
Abstract
Background:
Both Parkinson’s disease (PD) and multiple system atrophy (MSA) are neurodegenerative disorder affecting striatonigral system. Although various lines of evidence demonstrate that dopaminergic neuron degeneration emerges before the onset of motor symptoms in PD, preclinical/prodromal progression of neurodegeneration is far less understood in MSA.
Objective:
The aim of this study was to clarify the difference in the progression of dopaminergic degeneration in MSA and PD using dopamine transporter single-photon emission computed tomography (DAT SPECT).
Methods:
We analyzed longitudinal data of the specific binding ratio (SBR), a measure of striatal radiotracer uptake, in DAT SPECT from 7 patients with MSA-C, 5 patients with MSA-P, and 18 patients with PD. We performed 2.7±0.7 scans with an interval of 9.85±6.00 months for MSA and 2 scans with an interval of 2.16±0.16 years for PD.
Results:
The rate of SBR decline was faster in both subtypes of MSA compared with PD, but the value was similar between MSA-P and MSA-C. The estimated SBR at the onset of initial motor symptoms was lower in PD and MSA-P than in MSA-C, especially in the predominantly affected side. SBR of the predominantly affected side starts to decrease before the onset of motor symptoms in PD and MSA-P, whereas the initiation of SBR decline is around the onset in MSA-C individuals. The decline of SBR in the less affected side was not clearly shown before the onset in MSA-P or MSA-C.
Conclusions:
Our results suggest that the SBR in DAT SPECT analysis is an important pathophysiological marker reflecting the disease- and subtype-specific progression of dopaminergic degeneration in MSA and PD.
Keywords
INTRODUCTION
Both Parkinson’s disease (PD) and multiple system atrophy (MSA) are neurodegenerative disorder affecting striatonigral system. PD is characterized by motor symptoms such as bradykinesia, rigidity, resting tremor, and postural instability. At the onset of motor symptoms more than 50% of dopaminergic neurons are lost, indicating the progression of neurodegeneration before the onset of motor symptoms in PD [1]. This view has been supported by a variety of clinical and histopathological evidence. Clinically, motor symptoms are anteceded by non-motor symptoms including autonomic impairment, REM sleep behavior disorder (RBD), hyposmia, excessive daytime sleepiness, and depression. Most of these symptoms are reported to be associated with non-dopaminergic systems (i.e. cholinergic and serotonergic systems) [2], but there appear to be some non-motor symptoms related to dopaminergic deficits such as excessive daytime sleepiness [3]. Deposition of alpha-synuclein, a histopathological hallmark of PD, often presents in the gastrointestinal mucosa of presymptomatic patients with PD, signifying that the peripheral pathology might expand to the central nervous system during the prodromal phase of this disease [4]. The preclinical/prodromal progression of dopaminergic degeneration is also advocated by neuroimaging studies showing loss of dopamine transporter in [123I]FP-CIT dopamine transporter single-photon emission computed tomography (DAT SPECT) at a very early stage of the disease [5].
MSA is a fatal neurodegenerative disease characterized by parkinsonism, cerebellar ataxia, dysautonomia, and pyramidal signs in various combinations, the progression of which is faster than PD [6]. The disease entity of MSA includes two different clinical forms with a common neuropathological background: the parkinsonian variant (MSA-P) and the cerebellar variant (MSA-C). Both forms of MSA progress rapidly with a median survival from the onset of initial neurological symptoms being 9 to 10 years, although functional decline is shown to be faster in MSA-P [7–9]. Parkinsonism appears earlier and is more severe than cerebellar signs in MSA-P, and this appears to result in the poor functional prognosis of parkinsonism-predominant cases. The pathological hallmark of MSA is alpha-synuclein-positive glial cytoplasmic inclusions with neurodegenerative changes in the olivopontocerebellar, striatonigral, and corticospinal tracts. Increasing evidence indicates that propagation of alpha-synuclein underlies the progressive multi-system degeneration within the central nervous system in MSA [10, 11]. In common with PD, RBD may precede the onset of motor symptoms in patients with MSA, suggesting the preclinical/prodromal progression of neurodegeneration. However, preclinical/prodromal change of striatonigral degeneration is far less understood in MSA, compared with PD. It is also unclear whether the clinical subtypes, MSA-P and MSA-C, are doomed by the initial site of pathology, the speed of regional degeneration, or both.
In this study we sought to clarify the timing and speed of dopaminergic degeneration in PD and two subtypes of MSA by analyzing longitudinal data of DAT SPECT which detects presynaptic nigrostriatal dopaminergic denervation [12].
MATERIALS AND METHODS
Subjects
We retrospectively analyzed longitudinal data from patients who underwent DAT SPECT more than once during the follow-up period: 7 consecutive patients with MSA-C (mean age, 65.6±5.9 years at initial evaluation; 4 men/3 women), 5 consecutive patients with MSA-P (mean age, 68.6±8.1 years at initial evaluation; 3 men/2 women) and 18 consecutive patients with PD (mean age, 70.9±6.2 years at initial evaluation; 10 men/8 women), all of whom were followed at National Hospital Organization Higashinagoya National Hospital from March 2014 to January 2017 (Table 1, Fig. 1). All the MSA participants fulfilled clinical criteria [13] for ‘probable’ or ‘possible’ MSA at the initial evaluation and/or during the follow-up, and all the PD patients were clinically diagnosed using criteria from UK Parkinson’s Disease society Brain Bank [14]. None of them had a family history of parkinsonism or ataxia. At the time of initial evaluation, each patient underwent baseline DAT SPECT. Second or more scans were obtained at average intervals of 9.85±6.00 months for MSA patients, and 2.16±0.16 years in PD. The onset of disease was determined as the timing when any motor symptom occurred. The clinical diagnosis between MSA-P and MSA-C was made on the basis of both patients’ subjective statements and clinicians’ neurological examination.
Patient characteristics
MSA-C, cerebellar variant of multiple system atrophy; MSA-P, parkinsonian variant of multiple system atrophy; PD, Parkinson’s disease; M, male; F, female; OH, orthostatic hypotension; SBR, specific binding ratio. #Autonomic dysfunction that does not meet the level required in probable MSA. *p < 0.05 for PD with ANOVA and Tukey-Kramer post-hoc analysis.
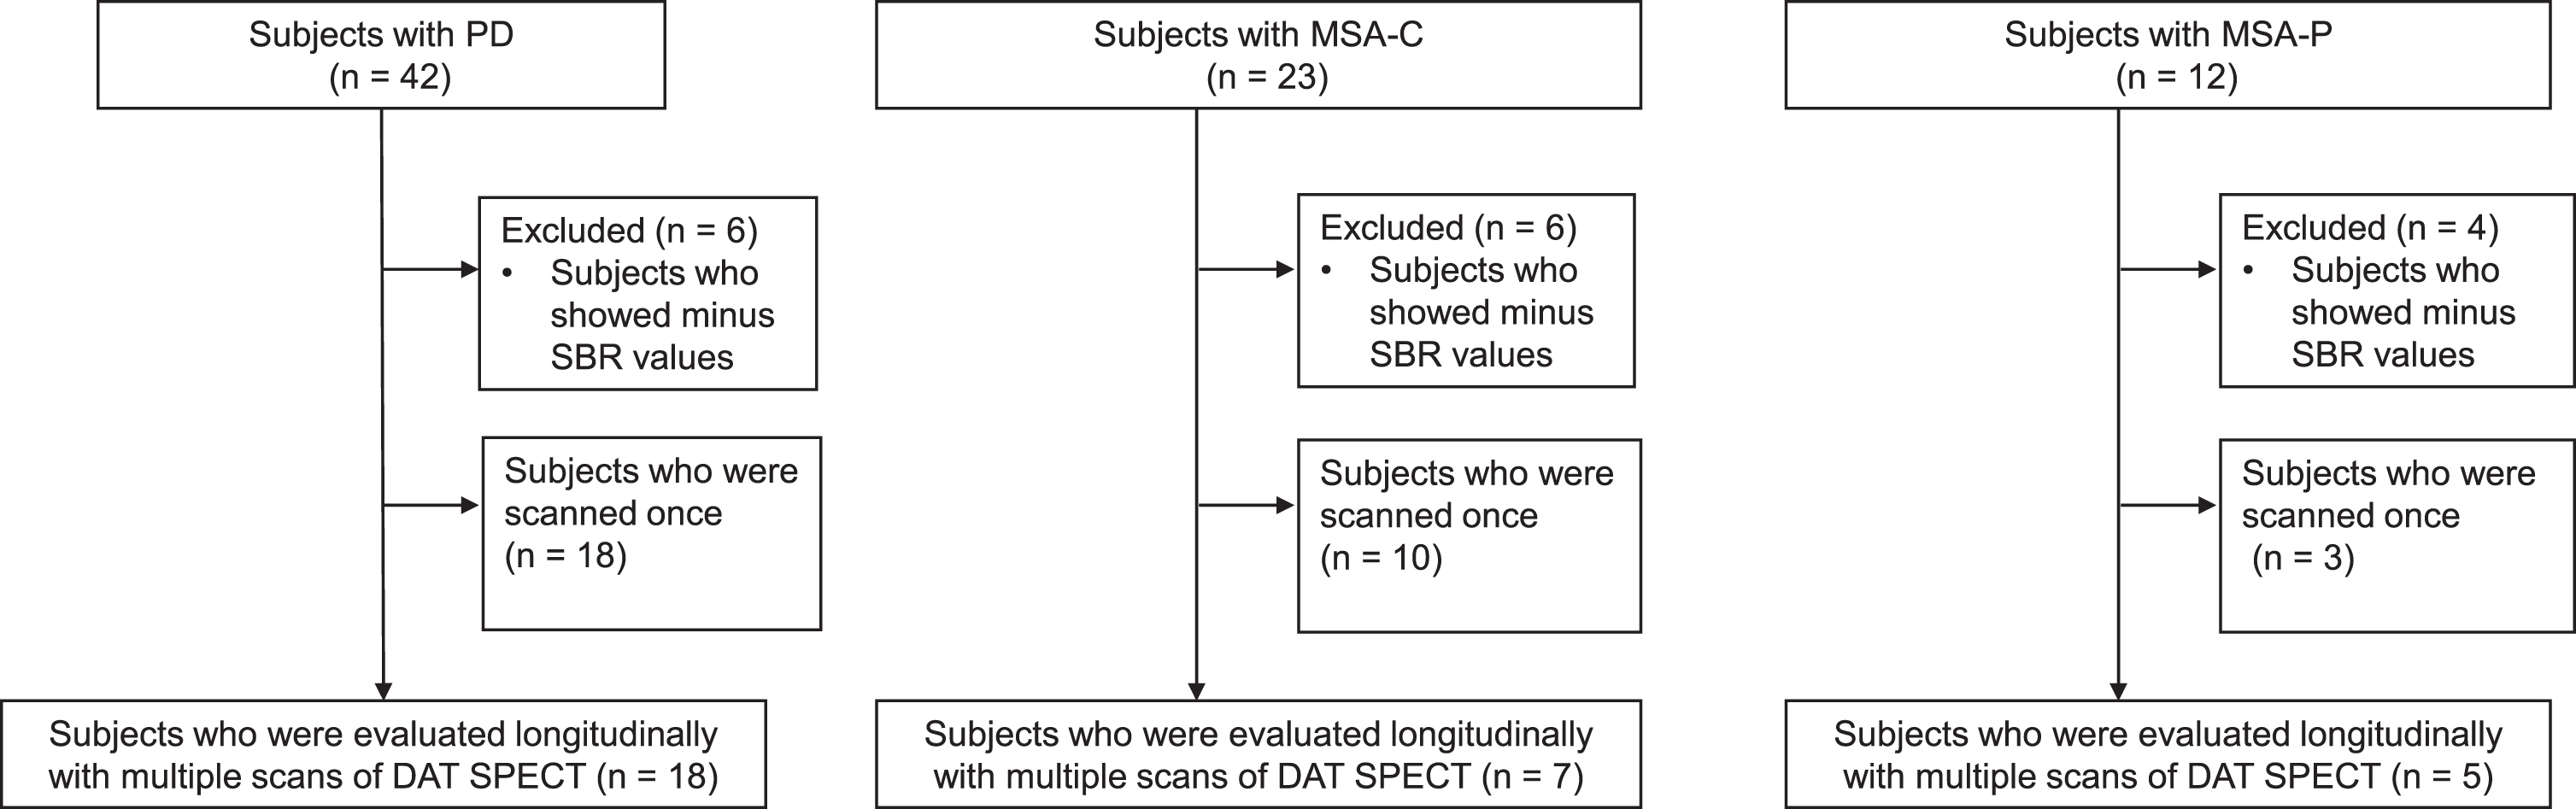
Flow chart of patient enrollment. Patients who underwent dopamine transporter single-photon emission computed tomography (DAT SPECT) more than once were included. MSA-C, cerebellar variant of multiple system atrophy; MSA-P, parkinsonian variant of multiple system atrophy; PD, Parkinson’s disease; SBR, specific binding ratio.
This study conformed to the Ethical Guidelines for Medical and Health Research Involving Human Subjects endorsed by the Japanese government. The study was approved by the ethics committees of National Hospital Organization Higashinagoya National Hospital and Nagoya University Graduate School of Medicine.
DAT SPECT
All patients were scanned at National Hospital Organization Higashinagoya National Hospital. Four hours after intravenous administration of 167 MBq of [123I] ioflupane (DaTSCAN, Nihon Medi-Physics, Tokyo, Japan), SPECT acquisition of entire brain was performed using a dual-head gamma camera (Prism-Axis, Shimadzu, Kyoto, Japan) equipped with low-energy high-resolution collimators. The parameters of acquisition were as follows: rotation radius of 15 cm, circular orbit; magnification factor of 1.49; matrix size of 128×128, pixel size 3.0 mm; 90 projections, 20 s/projection; energy window 20% over 159 keV. Two-dimensional reconstruction using filtered back projection with a Butterworth filter (cutoff, 0.15 cycles/pixel; order, 8) and reconstructed transaxial slices were displayed for quantitative analysis. We did not perform either attenuation correction or scatter correction. Volume of interest were defined in bilateral striatum, and a reference was whole brain. SPECT images were reconstructed with the iterative algorithm: the ordered subset expectation maximization and specific binding ratio (SBR) were defined as the uptake ratio of (striatum - whole brain)/whole brain using DaTView software version 3 (AZE, Tokyo) with CSF correction method [15] in the same way as recent Japanese study [16] on DAT SPECT. SBR values were obtained for both the right and left striatum regions. We defined the most affected striatum side as ‘predominantly affected side’ and the opposite side as ‘less affected side’ with SBR values. We used the average of the right and left sides as SBR ‘average’. The asymmetry index (AI) of SBR was calculated using the following equation: AI [% ] = (SBRpredominantly affected – SBRless affected) × 2/(SBRpredominantly affected + SBRless affected) × 100 [17, 18]. An AI value of >10% was considered substantial. SBR in one of the scans from a MSA-P patient was unmeasurable, which was eliminated from the analysis. All scans were performed on dopaminergic medication as their usual dose and none of them used the drugs that influence the accumulation of [123I] ioflupane in the brain. For comparing the initiation of SBR reduction among the three groups, we calculated the time when SBR decreases below cutoff values. We chose a value of 4.5 as a cutoff because previous studies proposed that the average value minus a SD of the SBR in healthy adults between 50 and 80 years old were around 4.5 both in Japanese [16] and European [17] studies. In consideration of the fact that SBR is a relative value, we also used cutoff at 5 and 6.
Statistical analysis
The means of continuous variables among the three groups was compared by using analysis of variance (ANOVA) followed by Tukey-Kramer post-hoc analysis. For the longitudinal analysis of changes in SBR in MSA and PD reduction, we log-transformed the SBR values, because the skewed distribution of the SBR values was observed. We then compared the log SBR reduction rates among the three groups using the mixed-effect model with the unstructured covariance matrix for the random intercept and slope effect. Using this model, we estimated the trajectories in the SBR over time along with initial SBR values at the onset of initial motor symptoms. We back-transformed the log SBR data before estimating the trajectories in the SBR over time. We considered p-values <0.05 to be significant. Statistical analysis was performed using SAS version 9.4 (SAS Institute Inc., Cary, NC, USA) and SPSS Statistics 23 (IBM Japan, Tokyo, Japan).
RESULTS
Baseline characteristics of MSA and PD individuals
The clinical characteristics of the MSA-C, MSA-P, and PD patients are presented in Table 1. At disease onset, all the MSA-P and PD patients had parkinsonism, whereas all the MSA-C patients presented cerebellar symptoms. Dopaminergic treatment, evaluated with L-Dopa equivalent daily dose, was more intense in PD individuals than in MSA-C subjects (p < 0.05). There was a trend that SBR at baseline scan are higher in MSA-C than in the other groups, albeit not statistically significant (Supplementary Figure 1). To access the possible selection bias, we compared clinical backgrounds of the patients who underwent two or more scans and those had only one scan (Supplementary Tables 1–3). The results demonstrated that the period from first to last clinical evaluation was longer in MSA-C and PD patients with multiple scans and that the age at first scan was older in the PD patients with multiple scans. However, there was no significant difference between the groups as for the other items.
Longitudinal changes in SBR in MSA and PD individuals
In a longitudinal study, SBR showed decline overtime in MSA-C, MSA-P, and PD groups (Fig. 2A, B). Our analysis of the estimated trajectories using the mixed-effect model with the unstructured covariance matrix for the random intercept and slope effect demonstrated a non-linear decrease in SBR along with disease progression for all groups (Fig. 2C, D). The mixed effect model indicated that annual reductions of SBR in the less affected side were larger in both subtypes of MSA than in PD (Fig. 2C, D and Table 2): MSA-P, 95% Confidence Interval [CI] = 0.13–0.60, p = 0.006; MSA-C, [CI] = 0.06–0.34, p = 0.010). The SBR reduction rate in the predominantly affected side was also larger in MSA-C compared to PD ([CI] = 0.07–0.30, p = 0.012). There also was a trend that the annual reduction of SBR in the predominantly affected side was larger in MSA-P than in PD, although not statistically significant. No difference was found between MSA-P and MSA-C. In PD and MSA-C groups, SBR reduction rates were relatively similar between the predominantly affected and less affected sides. The estimated SBR at the onset of initial motor symptoms was lower in PD and MSA-P than in MSA-C, especially in the predominantly affected side (Fig. 2C, D and Table 2). SBR in the less affected side was as low as in the predominantly affected side at the onset of PD, but laterality was more prominent in MSA-P.
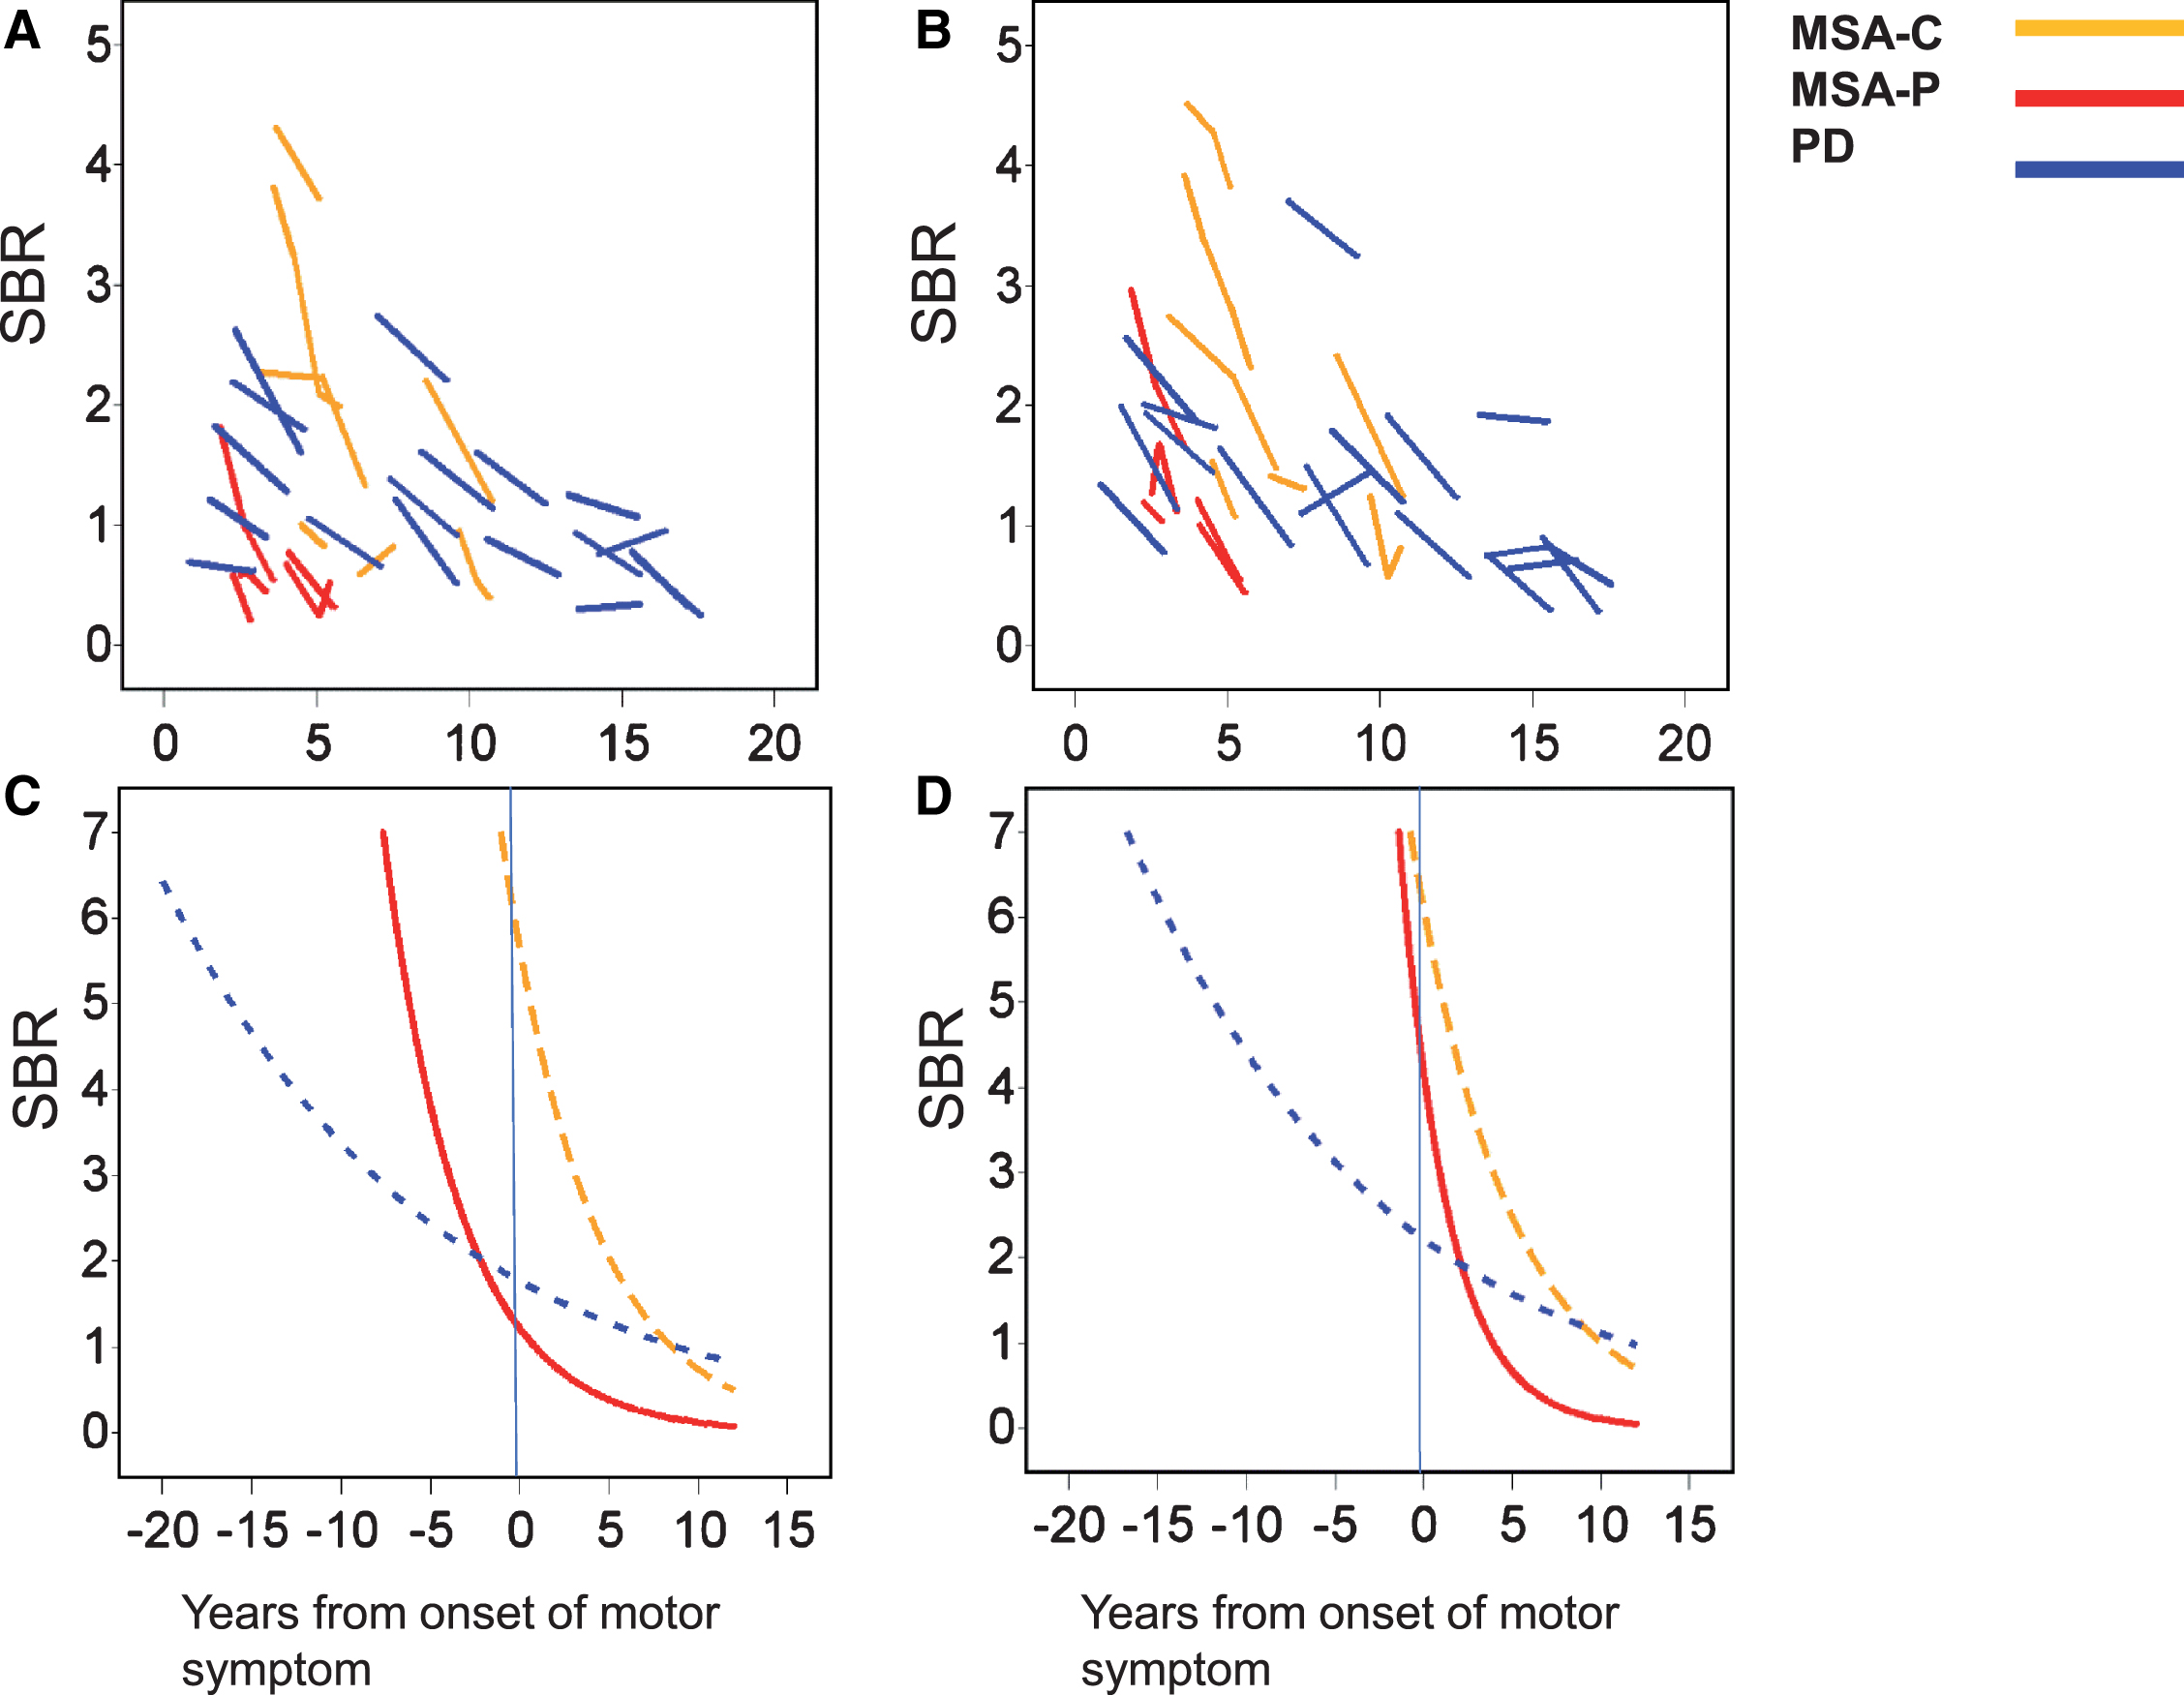
Longitudinal change in the SBR in MSA-C, MSA-P, and PD patients. A, B) Plots of raw data of SBR in the predominantly affected side (A) and less affected side (B). C, D) Estimated trajectories of SBR in the predominantly affected side (C) and less affected side (D). MSA-C, cerebellar variant of multiple system atrophy; MSA-P, parkinsonian variant of multiple system atrophy; PD, Parkinson’s disease; SBR, specific binding ratio.
SBR reduction rate and estimated SBR at onset
SBR, specific binding ratio; PD, Parkinson’s disease; MSA-P, parkinsonian variant of multiple system atrophy; MSA-C, cerebellar variant of multiple system atrophy; CI, confidence interval. *p-values for the comparison of log SBR reduction between the PD and MSA-P or MSA-C groups.
Preclinical decline of SBR in MSA and PD individuals
Our estimation from mixed effect model demonstrated that the decline of SBR occurs earlier in the predominantly affected side than in the less affected side in all the groups (Table 3). It is also estimated that SBR of the predominantly affected side starts to decrease before the onset of motor symptoms in PD and MSA-P, whereas the initiation of SBR decline is around the onset in MSA-C individuals. SBR of the less affected side also begins to decrease more than 10 years before the onset of motor symptoms in PD, while the decline of SBR in the less affected side was not clearly shown before the onset in MSA-P or MSA-C.
Estimated time from disease onset when SBR become below cutoff value based on the mixed effect model
SBR, specific binding ratio; PD, Parkinson’s disease; MSA-P, parkinsonian variant of multiple system atrophy; MSA-C, cerebellar variant of multiple system atrophy.
DISCUSSION
In the present study, we investigated longitudinal characteristics of DAT SPECT scans from individuals with MSA and those with PD to clarify how the degenerative process progresses in MSA-C, MSA-P, and PD, all of which results from striatonigral degeneration associated with pathological alpha-synuclein accumulation. Our findings demonstrated that the initiation of neurodegeneration occurs earlier in PD than in MSA, but the speed of disease progression is faster in MSA compared with PD. This appears to result in the similar values of SBR at the time of disease onset in MSA-P and PD, particularly in the predominantly affected side. Our results also confirmed that the values of the SBR in DAT SPECT correspond well to the clinical subtypes of MSA: the values of SBR were lower in PD and MSA-P than in MSA-C whose SBR was fairly preserved at the disease onset.
In the preset study, we depicted a substantial difference in the preclinical progression of dopaminergic degeneration between MSA and PD. SBR starts to decrease more than a decade prior to the onset of motor symptoms in PD, supporting a previous data that DAT density decreases by approximately 60% at a very early stage of PD [5]. In contrast, the prodromal period is predicted to be much shorter in MSA: reduction in the SBR begins several years before the onset of MSA-P and around the onset of MSA-C. These findings suggest that the progression of neurodegeneration is faster in MSA, regardless of the subtype, than in PD, and this hypothesis matches the observation that the functional decline is particularly rapid in MSA, especially MSA-P, compared with PD [7, 19].
There are various studies that compared DAT SPECT of patients with MSA-P and that of PD longitudinally [20] or cross-sectionally [21–23]. Such studies commonly showed that the rate of reduction of the SBR is higher in MSA-P than in PD. However, the difference in the SBR decline between MSA-P and MSA-C was not directly compared in these studies. Our results indicate that the speed of dopaminergic degeneration is similar among the two subtypes of MSA despite the earlier onset of SBR reduction in MSA-P compared with MSA-C. This result suggests that the distinction in MSA subtypes largely stems from the difference in the timing, but not speed, of striatonigral degeneration. This result also supports the idea that the pathology of MSA emerges in a multi-hit manner, providing a theoretical basis for the fact that certain cases of MSA have similarly severe histopathological features of MSA-C and MSA-P [25, 26].
The present study demonstrated a non-linear decrease of the SBR not only in PD but in both MSA-C and MSA-P. This phenomenon has been reported in various studies of PD. The dopaminergic degeneration in PD appears to slow down during the course of the disease [27]. The rate of decline in DAT-related dopamine uptake diminishes when the population of remaining dopamine neurons in the substantia nigra reaches a minimum [28]. Our results thus suggest that the pattern of dopaminergic degeneration is similar between PD and MSA, in both of which accumulation and propagation of alpha-synuclein play an important role. We may develop a prediction model for distinguishing MSA and PD using the information obtained prior to the onset of motor symptom such as the degree of progression of SBR values for a certain period. This is a study with different aspects from the present study and needs more patients’ data for developing the prediction model.
Although the present results revealed a differential progression of neurodegeneration in PD and MSA, our study has several limitations. First, the small number of MSA patients who underwent multiple scans limited the robustness of the statistical analysis of the longitudinal study. The lack of MSA subjects, especially MSA-P, with longer disease duration might reduce the accuracy of the non-linear model. Second, the follow-up period of scans was short for analyzing the pattern of progression of SBR reduction, even though a longer follow-up of scans was difficult in certain cases, particularly MSA-P, because their SBR deteriorated so fast that it was unmeasurable in several months after first scan. The number of scans was also small, since several scans were not feasible in clinical settings due to ethical concerns about radiation exposure. In fact, we performed multiple scans only if they were necessary for clinical diagnosis and management of the patient. Third, this study was based on a retrospective analysis of medical records and images. In addition, most of the patients involved in this study are still alive, so pathological evidence of disease is lacking. Therefore, prospective analyses with a larger population are needed to confirm the results of the present study. Studies on patients with different ethnic backgrounds would also provide stronger insights.
Full financial disclosure for the previous 12 months
Tomohiko Nakamura receives a KAKENHI grant from MEXT/JSPS, Japan (No. 16K09713). Ikuko Aiba receives research support from the Research Committee of CNS Degenerative Diseases, the Ministry of Health, Labor and Welfare of Japan and the Japan Agency for Medical Research and Development (AMED). Masahisa Katsuno receives a KAKENHI grant from MEXT/JSPS, Japan (No. 17H04195); grants from the Japan Agency of Medical Research and Development (AMED) (Nos. 17ek0109221h0001, 17dk0207027h0002, 15ek0109025, and 15ek0109165); grants from The Japanese Ministry of Education, Culture, Sports, Science and Technology (MEXT); a grant from the Naito Foundation; a grant from The Uehara Memorial Foundation; research grants from Otsuka Pharmaceutical, Nihon Pharmaceutical, Sanofi, Astellas, Sumitomo Dainippon, Pfizer, and Takeda; and speaking fees from Nihon Medi-physics, Daiichi-Sankyo, Sumitomo Dainippon, Takeda, and Tanabe-Mitsubishi.
Funding sources for study
This work was supported by a grant from Ministry of Health, Labour and Welfare, Japan, and a grant from the Naito Foundation. There were no other funding sources, and the investigators had sole discretion over study design, collection, analysis, and interpretation of data, writing of the report, and the decision to submit it for publication.
CONFLICT OF INTEREST
Masahisa Katsuno receives speaker honoraria from Nihon Medi-physics.