
Abstract
Background:
Parkinson’s disease (PD) is characterized by distinct motor symptoms which do not manifest until significant neurodegeneration has already occurred. Therefore, preventative treatments depend on PD being detected in a prodromal phase. To date, prodromal PD (pPD) has been conceptualized based on conditions such as REM Sleep Behavior Disorder (RBD), which has a high conversion rate to clinical PD (cPD). However, few studies have examined microstructural differences between healthy controls (HC), pPD, and cPD.
Objective:
The current study examined white matter microstructure in different phases of PD progression.
Methods:
Participants included 21 HC, 20 pPD (14 with RBD and 6 with hyposmia), and 17 cPD from the Parkinson’s Progression Markers Initiative database. Tract-based spatial statistics were used to determine between group differences in fractional anisotropy (FA) and mean diffusivity (MD).
Results:
Mean diffusivity was significantly increased in pPD relative to cPD in widespread, but mostly right lateralized regions. Post-hoc analyses indicated that this pattern was particular to individuals with RBD. There were no microstructural differences between HC and pPD or cPD. The pPD group had significantly higher RBD symptoms and the cPD group had significantly higher motor symptoms.
Conclusions:
Observed microstructural deterioration in individuals with RBD relative to cPD may indicate an altered pattern of neurodegeneration associated with RBD as a prodromal symptom of PD. Future studies should aim to further characterize possible differential patterns of progression from various non-motor symptoms (e.g., RBD, hyposmia) to cPD using longitudinal designs.
Keywords
INTRODUCTION
Parkinson’s disease (PD) is a neurodegenerative disorder that affects approximately one percent of the global population over the age of 60 [1]. Though the cause of PD is unknown, it is associated with progressive deterioration of dopamine-producing neurons in the substantia nigra in the midbrain and Lewy pathology. The diagnosis is based on hallmark motor symptoms, including bradykinesia, postural instability, rigidity and resting tremor, although it has been estimated that 30–70% of dopaminergic neurons in the substantia nigra degenerate before the first motor symptoms appear [2]. Detecting these brain changes at the earliest time point is imperative for early diagnosis and implementation of preventative treatments.
With a focus on early diagnosis, the International Parkinson and Movement Disorder Society task force recently redefined PD to include three phases: (a) preclinical PD, where there are no evident symptoms or signs, but there is evidence of PD-specific pathology supported by molecular or imaging markers; (b) premotor or prodromal PD, where early non-motor symptoms and signs are present, but are yet insufficient to define disease; and (c) clinical PD, where diagnosis of PD based on presence of classical motor signs [3]. These categorizations also stress the importance of biomarker validation in the earlier phases of PD.
An ideal approach to identifying early biomarkers for PD would be non-invasive, widely available and easily repeatable, as is magnetic resonance imaging (MRI). Advanced MRI based methods, such as diffusion tensor imaging (DTI) are particularly promising, given that the derived metrics represent changes at a microstructural level. The most commonly reported DTI metrics are fractional anisotropy (FA) and mean diffusivity (MD), which are broadly considered non-specific indices of axonal degeneration and demyelination [4, 5]. Although DTI metrics may provide sensitive in vivo biomarkers of early changes in PD, few studies have used DTI to study prodromal PD.
The current paucity of studies on prodromal PD may be explained by challenges associated with this research; in particular, it is not possible to confirm progression to clinical PD without longitudinal follow up. However, emerging DTI studies [6–9] have examined individuals with idiopathic rapid eye movement sleep behavior disorder (RBD) as prodromal PD subjects, since the rate of eventual conversion to PD and other synucleinopathies in those with RBD is up to 80% [10]. To date, there have been four studies that have compared RBD subjects to healthy controls and the findings have been mixed. Several studies found no differences in FA or MD between groups [6, 7]. Relative to healthy controls, Unger et al. [9] found RBD subjects to have increased FA in the internal capsule and olfactory regions, and decreased FA in the fornix, right visual stream, and left superior temporal lobe (with no differences in MD). Scherfler et al. [8] found RBD subjects to have decreased FA in the tegmentum of the midbrain and the rostral pons along with increased MD in the pontine reticular formation relative to healthy controls. Taken together, these findings suggest that DTI has potential for detecting microstructural differences between healthy controls and persons with RBD in brain areas related to PD etiology and progression, but further studies are needed to understand the mixed results. Notably, although hyposmia (impaired olfaction) has also been considered a non-motor prodromal PD symptom [10], there have been no studies that have examined DTI metrics in the prodromal stage for this group, to date.
The current study utilized data from the Parkinson Progression Markers Initiative (PPMI) database to investigate how white matter microstructure differs in different phases of PD progression including healthy controls, prodromal PD (indicated by diagnosed RBD or hyposmia), and clinical PD. It was hypothesized that results would reveal between group differences consistent with progressive deterioration in white matter microstructure (as evidenced by decreased FA and increased MD). Given that only a few studies have examined DTI metrics in the prodromal phase of PD, the current study represents an important step understanding changes in the brain associated with the progression of PD.
MATERIALS AND METHODS
Participants
Data were obtained from the PPMI database [11]. A flow chart of participant selection is displayed in Fig. 1. Participants were first selected by availability of DTI data at baseline and matched by age and sex. Four clinical PD subjects and one prodromal PD subject were removed from the analysis due to poor image quality. The final sample included 21 control subjects, 20 prodromal PD subjects, and 17 subjects with clinical PD. Control subjects had no diagnosis of PD and did not have a first-degree relative with PD. Prodromal PD subjects were listed in PPMI as having a diagnosis of hyposmia and/or RBD (14 prodromal PD subjects were confirmed to have RBD by polysomnography, while data for the other six prodromal subjects was unavailable, six were diagnosed with hyposmia). Data on medication use was only available for 15 prodromal subjects, of which seven subjects were reported to have been taking medications which included clonazepam (three subjects), melatonin (two subjects), a selective serotonin reuptake inhibitor (two subjects), a serotonin-norepinephrine reuptake inhibitor (two subjects), or a tricyclic anti-depressant (one subject). Seventeen PD subjects were de novo, meaning they had a diagnosis of PD for two years or less and were not taking PD medications. For more detail of specific study eligibility criteria and up-to-date information on the study, please see the PPMI website: www.ppmi-info.org. The Human Research Ethics Board at the University of Victoria granted approval for secondary analyses of PPMI data.
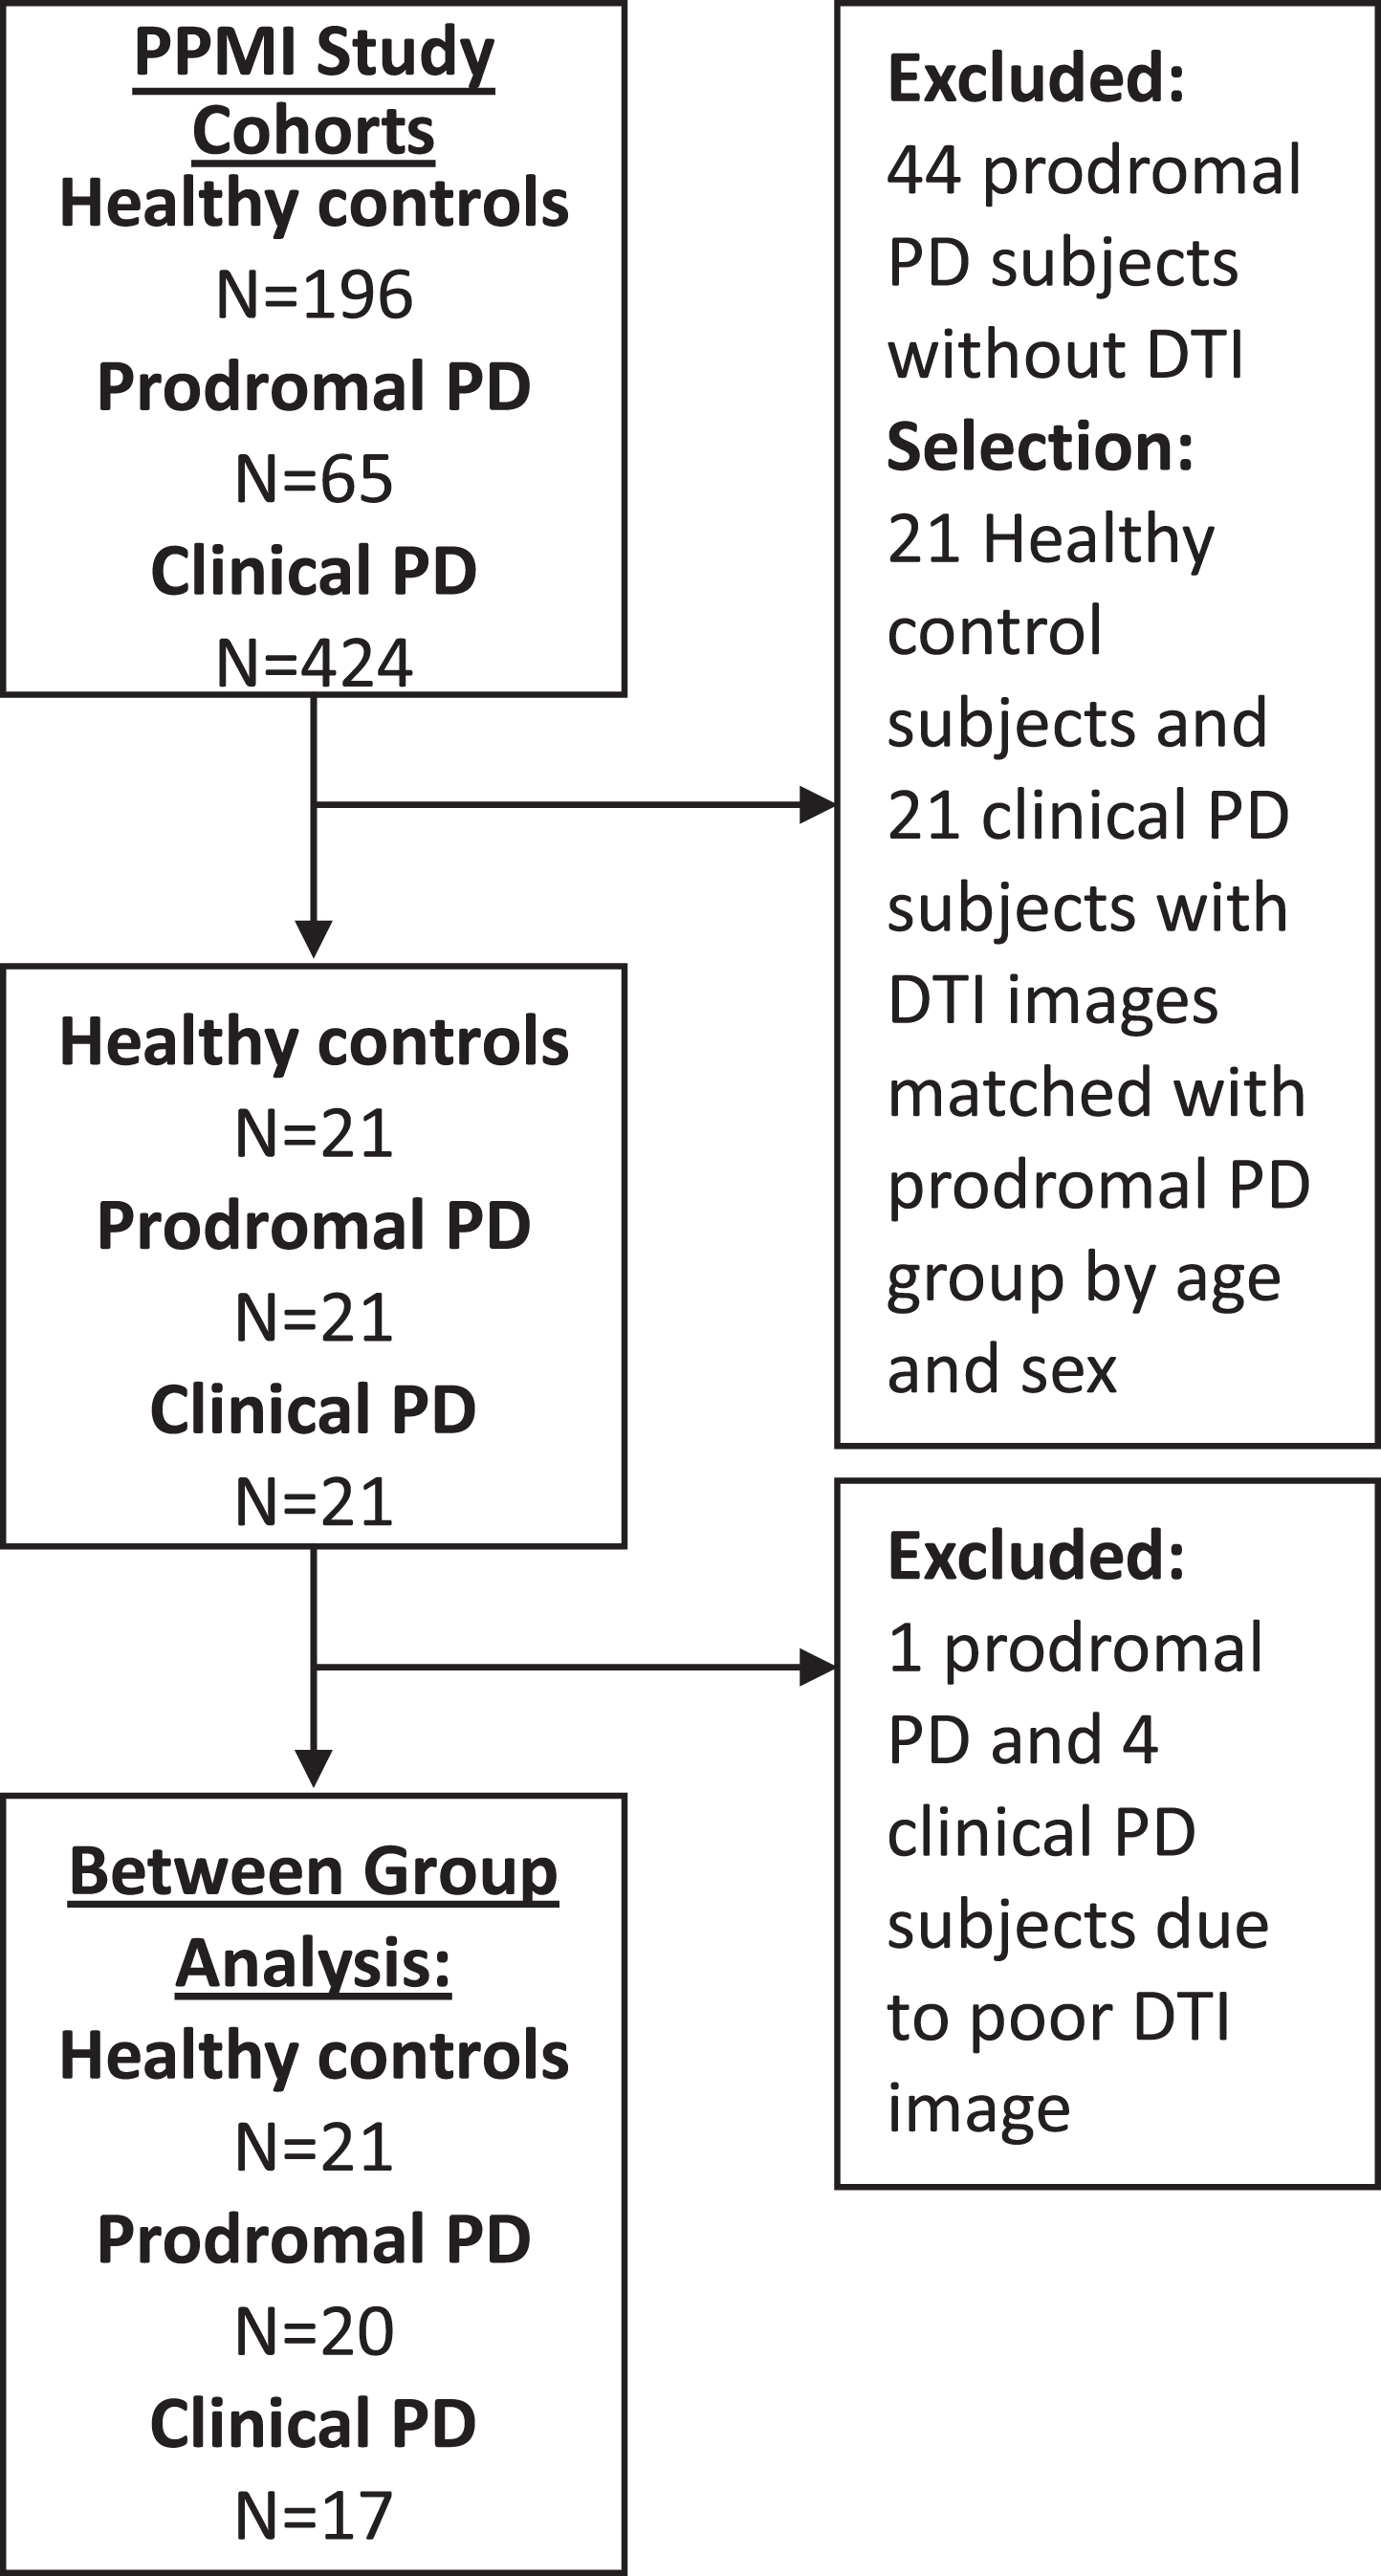
Flow diagram of participant selection and analysis. PPMI = Parkinson Progression Marker Initiative. PD = Parkinson’s disease. RBD = rapid eye movement sleep behaviour disorder. DTI = diffusion tensor imaging.
Measures
Clinical
Clinical measures of motor symptoms with the Unified Parkinson’s Disease Rating Scale (UPDRS-III), RBD with the REM Sleep Behavior Disorder Screening Questionnaire (RBDSQ), and general screening tool for cognitive performance, with the Montreal Cognitive Assessment (MoCA).
DTI
All images were acquired with a Siemens 3T TIM Trio scanner with a 12 channel Matrix head coil. Diffusion-weighted images were acquired with a single shot echo-planar imaging sequence, along 64 uniformly distributed directions using a b-value of 1000 s/mm2 with a single b = 0 image (matrix = 116×116, isotropic resolution = 2 mm, TR/TE = 900/88 ms). For more information regarding MRI acquisition, please see: http://ppmi-info.org/.
Data analyses
Demographic and clinical characteristic comparisons
Using R-Studio, participants in the current study were compared for using independent t-tests for differences in age, education level and on clinical measures.
Image preprocessing
Raw diffusion weighted images were downloaded from the PPMI website and converted from DICOM to NifTi files using dcm2nii converter from mricron [12]. FMRI Software Library (FSL) Version 5.0.10 was used for all image preprocessing and analysis [13–15]. First, to correct for eddy currents distortions and head movement, the Eddy Current Correction (ECC) tool was used [16]. Next, the skull and other non-brain tissue were removed from the images using the Brain Extraction Tool (BET) [17]; accuracy was confirmed with visual inspection.
Image analysis
Tract-Based Spatial Statistics (TBSS) is a fully automated approach to objectively estimate the overall white matter tracts within the brain that are common to study subjects, which can then be compared statistically [17]. First, FA images were created by fitting a tensor model to the raw diffusion data using DTIfit [18, 19]. All subjects’ FA data were then aligned into FMRIB58_FA space using the nonlinear registration which uses a b-spline representation of the registration warp field [20]. Next, the mean FA image was created and thresholded (FA 0.2) to create a mean FA skeleton, which represents the centres of all tracts common to the group. Each subject’s aligned FA data were then projected onto this skeleton and the resulting data fed into voxelwise statistics. The previous steps were repeated for MD.
Statistical comparisons
Between-group comparisons were conducted for FA and MD across the entire skeleton for healthy controls, prodromal PD, and clinical PD. FSL’s Randomise, a tool for nonparametric permutation inference on neuroimaging data [21] was applied with 5000 permutations using threshold-free cluster enhancement to correct for multiple comparisons [22]. Statistically significant group differences in FA and MD were identified with the ICBM-DTI-81 white matter label atlas and the JHU White Matter Tractography Atlas (p < 0.05) [23].
RESULTS
Descriptive statistics
Participant demographics are presented in Table 1. Between-group comparisons revealed no significant differences in age, education, or total score on the MoCA (Table 1). The clinical PD group had significantly higher motor scores on the UPDRS-III than the healthy control and prodromal PD groups. The prodromal group had significantly higher RBDSQ scores than the healthy control and PD groups. The percent of sample experiencing particular RBD symptoms is presented in Fig. 2.
Participant demographics
Note. RBD = Rapid Eye Movement Sleep Behaviour Disorder, PSG = Polysomnography, UPDRS-III = Unified Parkinson Disease Rating Scale Part III (Motor), RBDSQ = RBD Screening Questionnaire, MoCA = Montreal Cognitive Assessment. Only a14, b18, c15 scores available from PPMI database. **p < 0.01.
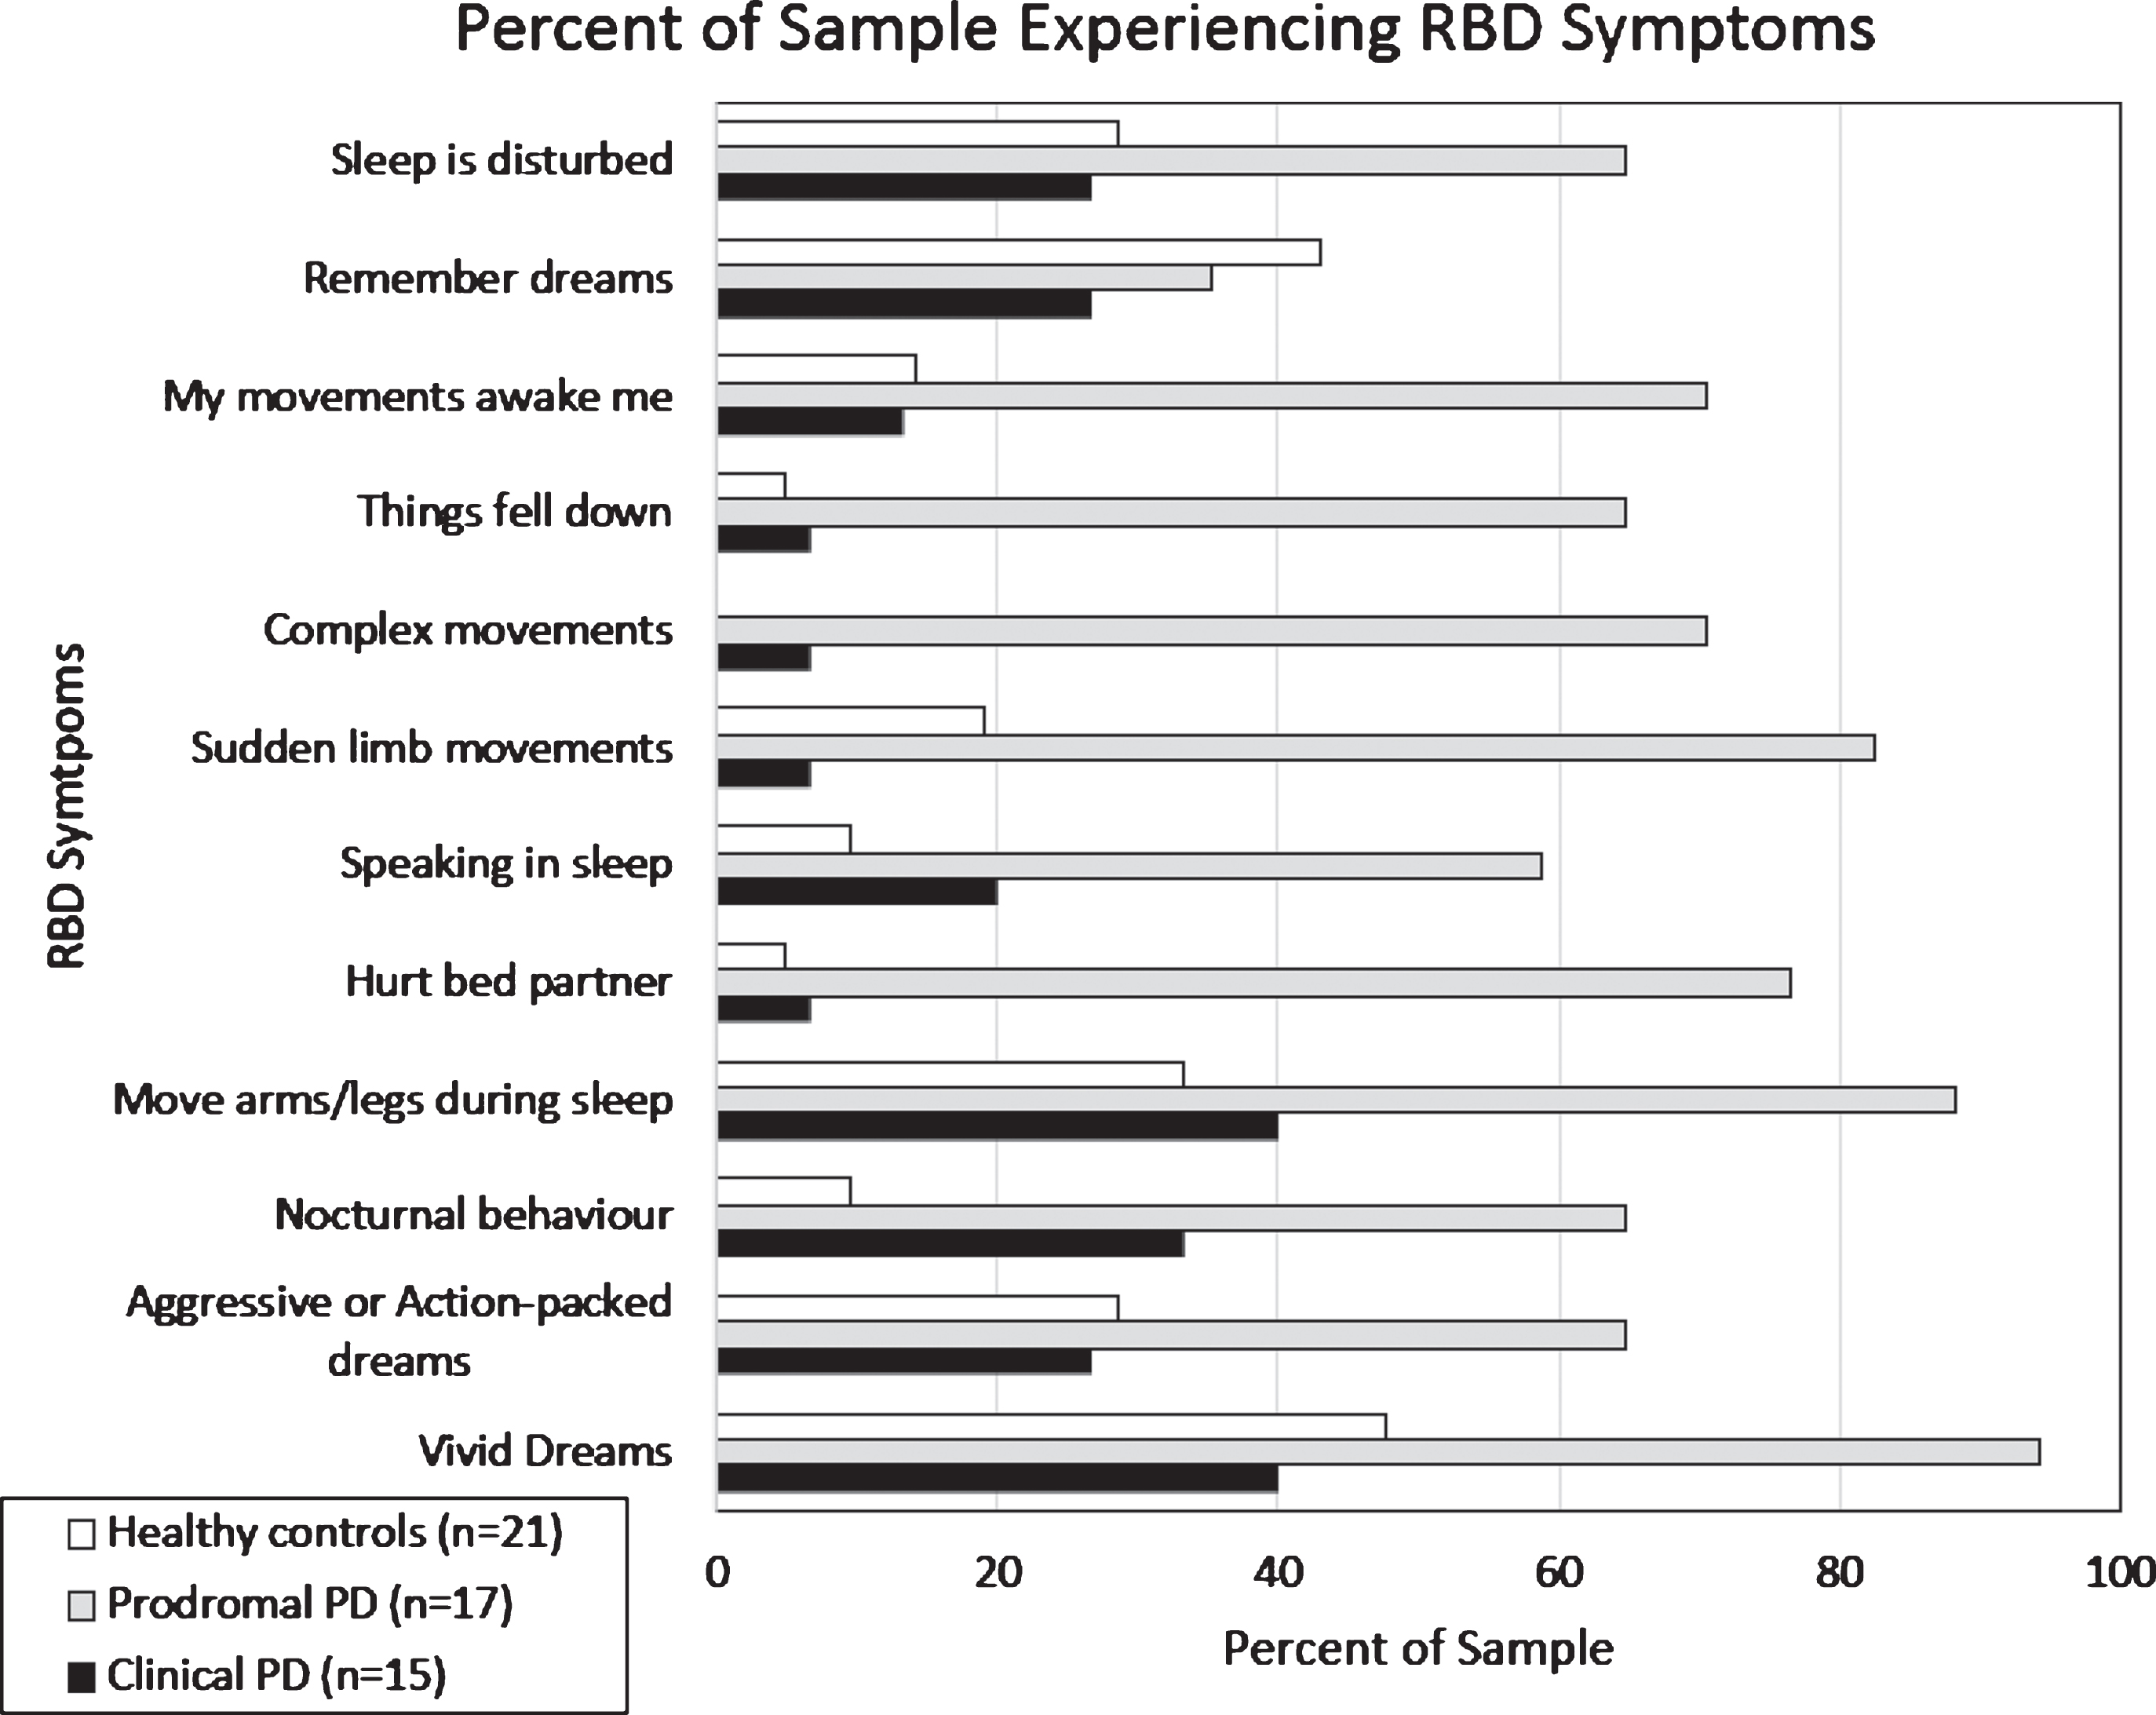
Percent of healthy controls, prodromal PD, and clinical PD subjects that endorsed specific RBD symptoms on the RBD Screening Questionnaire.
DTI results
There were no significant differences in DTI metrics between groups of healthy controls, prodromal PD, and clinical PD. One exception was the finding of significantly increased MD in the prodromal PD compared to the PD group (Fig. 3). Specifically, relative to the clinical PD group, the prodromal PD group showed increased MD in the corpus callosum, the right limb of the internal and external capsule, the right superior and inferior longitudinal fasciculus, the right inferior fronto-occiptal fasciculus, the right cortical spinal tract, the right forceps major, the right corona radiata, the right tapetum and the left posterior thalamic radiation.
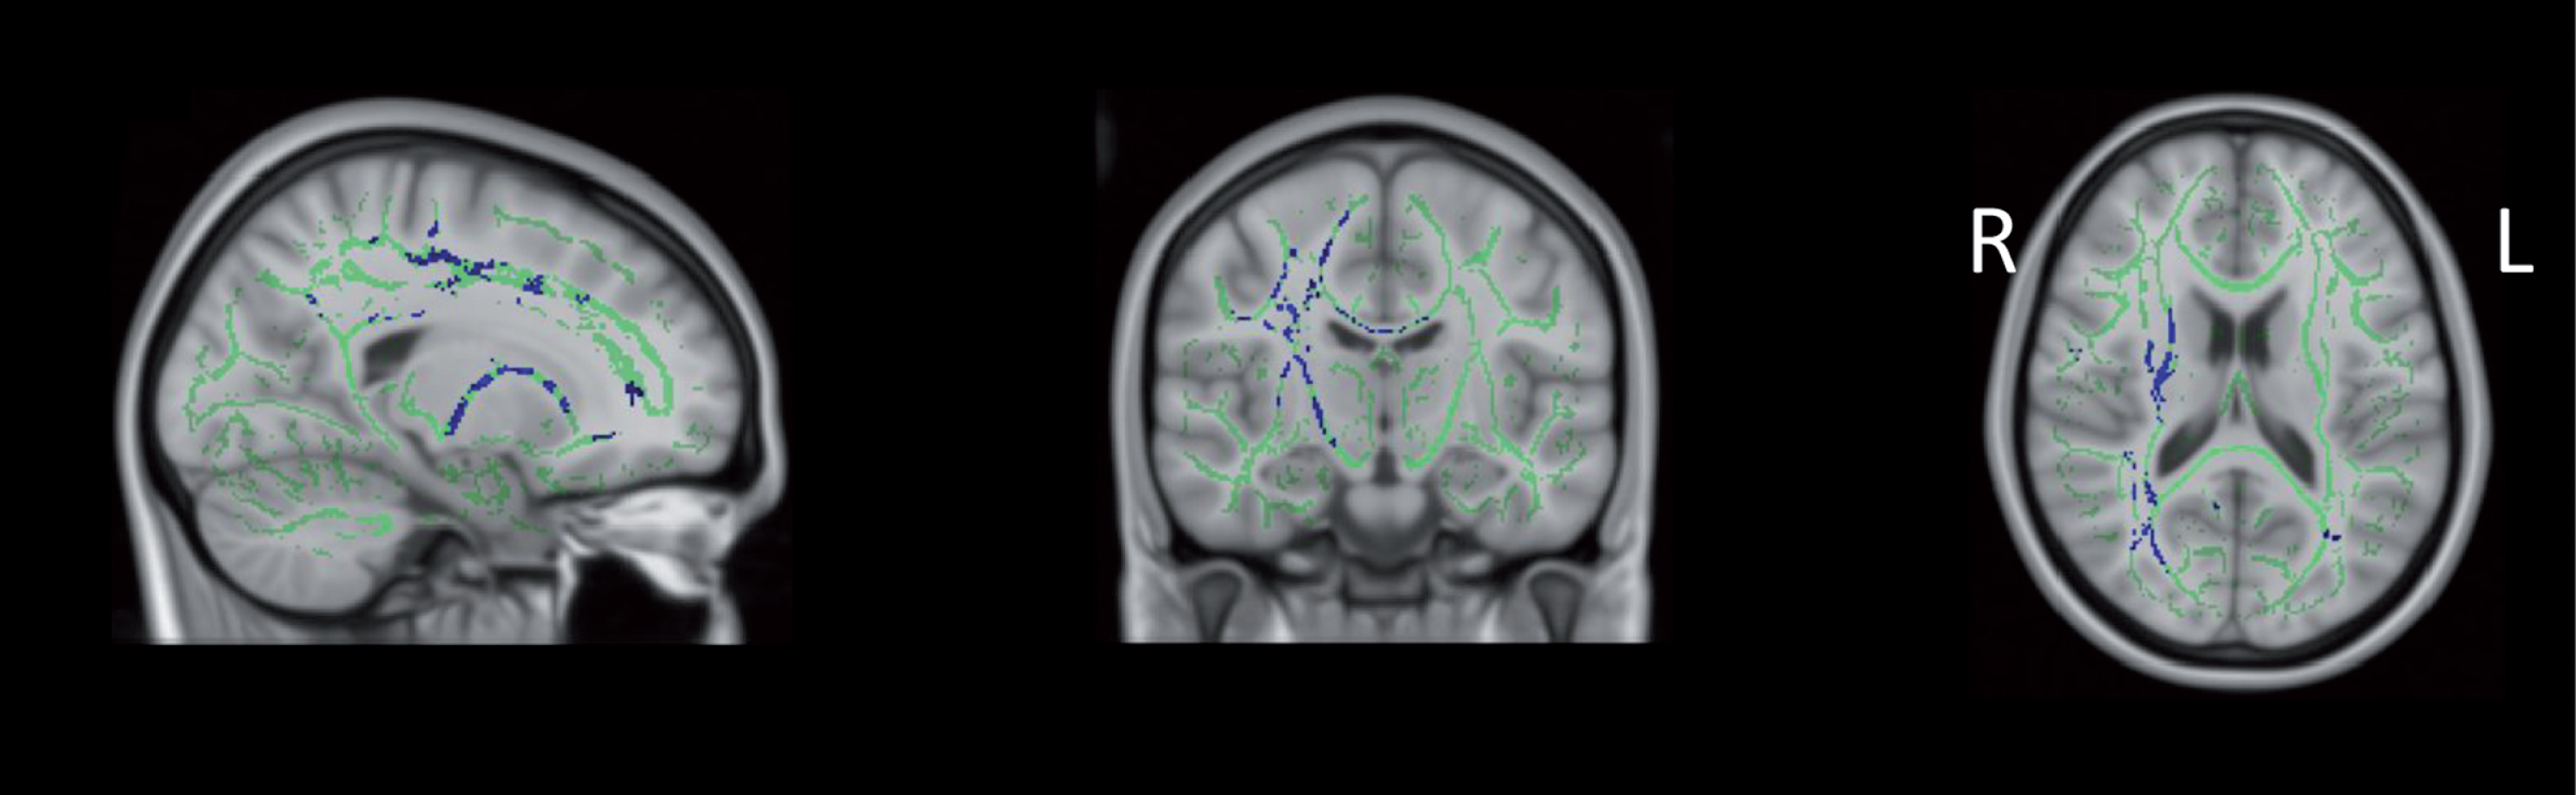
Increased MD in prodromal vs. clinical PD. From left to right: sagittal, coronal, and axial slices of the standard MNI_152_T1_1 mm brain overlaid with the mean FA skeleton (green) showing increased MD (blue) (p < 0.05, corrected for multiple comparisons, radiological view). Note: Figure 3 intended for color reproduction.
Post-hoc analyses and results
To determine if RBD could account for the group differences between prodromal and clinical PD, the analyses were completed using only subjects with RBD confirmed by polysomnography in the prodromal group (RBD+ prodromal PD; N = 14). Our results showed significant increases in MD in the RBD+ prodromal group relative to the clinical PD group (Fig. 4). When the prodromal PD group was limited to individuals with hyposmia (N = 6), there were no significant group differences in white matter microstructure when compared to the healthy control group or the clinical PD group.
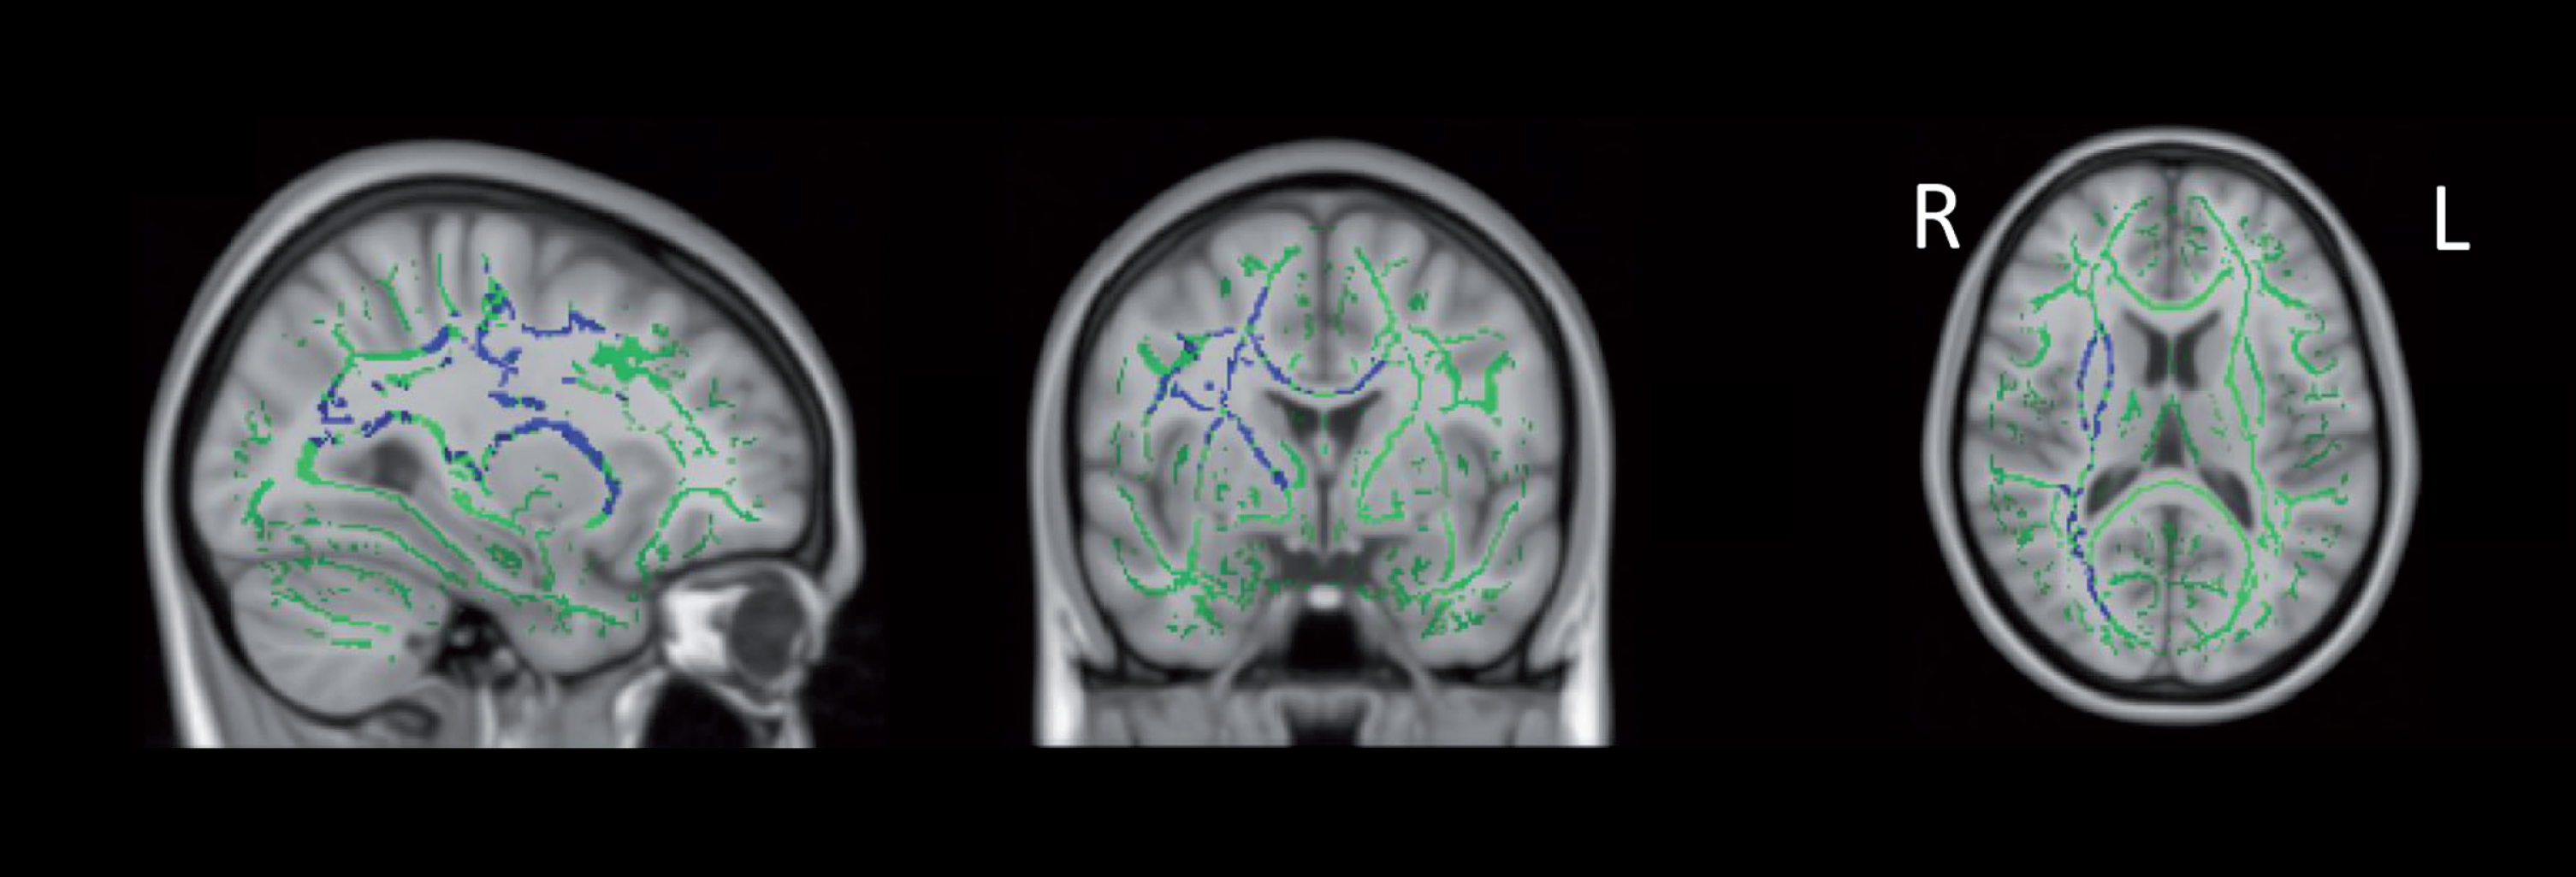
Increased MD in RBD+ vs. clinical PD. From left to right: sagittal, coronal, and axial slices of the standard MNI_152_T1_1 mm brain overlaid with the mean FA skeleton (green) showing increased MD (blue) (p < 0.05, corrected for multiple comparisons, radiological view). Note: Figure 4 intended for color reproduction.
DISCUSSION
The current study represents one of the first to compare both prodromal and clinical PD groups to healthy controls using DTI. The primary objective was to investigate how white matter microstructure differs in phases of PD progression. Contrary to our hypothesis that white matter microstructure reveal neurodegeneration (i.e., increased FA and decreased MD) in groups of higher disease state, our main finding was increased MD in the prodromal PD group relative to the clinical PD group. No other group differences in FA or MD were observed. Next, these unexpected results are discussed, which may have implications for future studies conceptualizing prodromal PD, including those using the PPMI database to advance biomarker detection for PD.
Increased MD in prodromal PD vs. clinical PD
Our findings revealed significantly increased MD in the prodromal PD group relative to the clinical PD group. These results are unusual and prompt consideration of what might have caused the prodromal group to present more severely (with decreased white matter microstructural integrity) than the clinical PD group.
One possibility is that the prodromal PD group represents a group with earlier, but more severe white matter degeneration – possibly due to RBD, in light of our post-hoc analyses, which showed increased MD specifically in RBD positive prodromal PD and no significant differences between groups when the prodromal PD group was limited to individuals with hyposmia.
Notably, our clinical PD group had relatively low rates of RBD that were unconfirmed (eight out of 17), while the prodromal PD group was largely composed of polysomnography confirmed RBD (14 out of 20). Congruent with this, we found significantly higher RBD scores in the prodromal PD group compared to the PD group, which suggests that group differences could be due to RBD specifically. That is, our results suggest that individuals with RBD have poorer white matter microstructure than individuals with early PD. These findings are in line with recent suggestion that PD with RBD should be considered a subtype of the PD, because clinically they have a more severe disease prognosis with higher probabilities of developing dementia and psychosis, a greater disease burden, and a higher risk of mortality [24]. Notably, although up to 80% of individuals with RBD convert to PD [10], the prevalence of RBD in patients with PD ranges from 20–70% [25]. To further test this hypothesis, future research should examine differences in white matter microstructure between individuals with and without RBD at the prodromal and clinical phases of PD.
To date, there have been few DTI studies that have compared PD with and without RBD. One study found decreased FA and increased MD in PD with RBD relative to PD without RBD, but these results became non-significant with statistical correction [26] and match other non-significant findings [27]. Another study using a different method of analysis called diffusion connectometry found significantly reduced quantitative anisotropy (a metric similar to FA that measures the “compactness” of fibre bundles) in PD with RBD compared to PD without RBD bilaterally in the cingulum, inferior fronto-occipital fasciculi, corticospinal tract, and the body, genu, and splenium of the corpus callosum [28]. The latter results are similar to ours in that subjects with RBD are displaying more significant white matter neurodegeneration, also within similar brain regions.
It is key to note that it is currently unknown whether the participants labeled prodromal PD in the PPMI database are truly prodromal of PD, or if they are stable, or if they are prodromal for another alpha-synucleinopathy, such as multiple system atrophy or dementia with Lewy bodies, as RBD can also predate these diseases. As such, another possible interpretation of our findings is that the prodromal group may not necessarily have a poorer white matter microstructure, but prodromal PD may have a different pattern or profile of neurodegeneration than the clinical PD group, perhaps with some areas of overlap that would not lead to visualization of group differences. This is an area of research that requires further investigation, ideally with longitudinal rather than cross-sectional methods, which may become possible as the PPMI database grows over time and captures conversions to PD.
Of note, the areas of increased MD in prodromal PD relative to clinical PD were for the most part lateralized to the right side, with the exception of areas of increased within the corpus callosum. In clinical PD, motor symptoms typically emerge on one side of the body and findings from neuroimaging studies have found asymmetric neurodegeneration in brain regions that are contralateral to the side of motor symptoms onset [29]. It is possible that the differences between prodromal and clinical PD are due to early asymmetric neurodegeneration or reorganization. These unexpected findings require additional research that is longitudinal and takes lateralization of symptoms into account to clarify the observed differences between prodromal and clinical PD.
Absence of differences in healthy controls vs. prodromal PD or clinical PD
Despite observing increased MD in prodromal PD versus clinical PD, there were no differences in white matter microstructure between controls and prodromal or clinical PD groups. Despite a recent meta-analysis showing overall microstructural differences between clinical PD and controls in several white matter tracts [30], we found no differences in FA or MD at the whole brain level. However, many individual studies included in the meta-analysis also failed to find any significant differences between PD and controls. This raises an important question about the clinical utility of and replicability of DTI across the different phases of PD. Certainly, research using DTI has contributed to our understanding of PD pathology and progression; but clinically, DTI has not reliably discerned clinical PD from healthy controls, limiting its applications as a diagnostic neuroimaging biomarker for PD at this time.
Limitations and future directions
There were several limitations to our study that prompt direction for future research. The current study included all of the prodromal PD subjects with diffusion weighted imaging available in the PPMI database. As the PPMI database grows, it may be possible for future studies to have larger samples with increased statistical power. Though the current sample size was limited, it is comparable to other neuroimaging studies that have found significant group differences and is in line with recent findings estimating the number of subjects required for DTI metrics to obtain a statistical power of 0.9 at an effect size of 10% [31]. Further, this study was limited to the most commonly used DTI metrics of FA and MD. Other studies have examined group differences in other DTI metrics, such as AD and RD and have used other related DTI metrics, such as free water diffusion. Guttuso et al. [32] found significantly increased free water diffusion in the substantia nigra in individuals with idiopathic PD compared with healthy controls at baseline. The authors suggest that free water diffusion may in fact contaminate conventional DTI metrics which may account for inconsistent DTI findings across studies [32]. Free water diffusion should be incorporated into future DTI studies.
Future research must carefully consider inclusion and exclusion criteria for prodromal PD samples for many reasons. Firstly, as outlined above, it is possible that different prodromal symptoms, such as RBD, represent a unique subtype of progression to PD. In our initial analyses, the prodromal sample was a mixed group with RBD/hyposmia, which represented a conscious decision to be more representative of prodromal PD presentation. Many studies have restricted their prodromal groups to include only those with idiopathic RBD as the eventual conversion to PD is high (and we examined this group specifically in our post-hoc analyses, as well). However, utilizing RBD only prodromal samples may underrepresent women as RBD has a higher male to female ratio of 5:1, compared to the estimated 2:1 ratio in clinical PD [33]. In fact, a potential limitation of the current study is that the prodromal group also did not include subjects with prodromal markers other than hyposmia and RBD. The current findings have implications for future studies, which should carefully consider examining the progression/conversion from differently defined prodromal PD groups onto clinical PD, using longitudinal analyses. Hopefully, this will become possible as the PPMI database develops over time. Additionally, future cross-sectional studies should consider comparing individuals in each disease stage based on prodromal symptom presentation and/or consider matching their groups based on clinical presentation of non-motor symptoms.
CONCLUSIONS
The current study represents an initial step in understanding microstructural differences in white matter across groups representing PD progression. Given that there were no significant differences between healthy controls and individuals with clinical PD, and group differences in FA and MD have been inconsistent throughout the literature, these DTI metrics assessed through TBSS do not seem to represent a consistent biomarker for detecting group differences in white matter microstructure. However, our finding of decreased white matter microstructure in prodromal PD – particular to RBD diagnosis - relative to clinical PD, may have implications for how future studies may define prodromal PD.
FUNDING
This work was supported by the University of Victoria and the Canada Graduate Scholarship Masters Award.
CONFLICT OF INTEREST
The authors have no conflict of interest to report.
AUTHOR CONTRIBUTIONS
LO, CMS, and JG contributed to the conception and design of the study. LO analyzed the data and drafted the primary manuscript. CMS and JG critically reviewed and revised the manuscript. All authors reviewed and approved the final version of the manuscript.
Footnotes
ACKNOWLEDGEMENTS INCLUDING SOURCES OF SUPPORT
Data used in the preparation of this article were obtained from the Parkinson’s Progression Markers Initiative (PPMI) database (www.ppmi-info.org/data). For up-to-date information on the study, visit www.ppmi-info.org. PPMI – a public-private partnership – is funded by the Michael J. Fox Foundation for Parkinson’s Research. Corporate funding partners include AbbVie, Avid, Biogen, Bristol-Myers Squibb, General Electric Healthcare, BioLegend, Genentech, GlaxoSmithKline, Lilly, Lundbeck, Merck, Meso Sale Discovery, Pfizer, Piramal, Roche, Sanofi Genzyme, Servier, Takeda, TEVA, and Union Chimique Belge, and philanthropic funding partner include GOLUB CAPITAL.