
Abstract
Background:
Genetic models of Parkinson’s disease (PD) coupled with advanced imaging techniques can elucidate neurobiological disease progression, and can help identify early biomarkers before clinical signs emerge. PTEN-induced putative kinase 1 (PINK1) helps protect neurons from mitochondrial dysfunction, and a mutation in the associated gene is a risk factor for recessive familial PD. The PINK1 knockout (KO) rat is a novel model for familial PD that has not been neuroradiologically characterized for alterations in brain structure/function, alongside behavior, prior to 4 months of age.
Objective:
To identify biomarkers of presymptomatic PD in the PINK1 -/- rat at 3 months using magnetic resonance imaging techniques.
Methods:
At postnatal weeks 12-13; one month earlier than previously reported signs of motor and cognitive dysfunction, this study combined imaging modalities, including assessment of quantitative anisotropy across 171 individual brain areas using an annotated MRI rat brain atlas to identify sites of gray matter alteration between wild-type and PINK1 -/- rats.
Results:
The olfactory system, hypothalamus, thalamus, nucleus accumbens, and cerebellum showed differences in anisotropy between experimental groups. Molecular analyses revealed reduced levels of glutathione, ATP, and elevated oxidative stress in the substantia nigra, striatum and deep cerebellar nuclei. Mitochondrial genes encoding proteins in Complex IV, along with mRNA levels associated with mitochondrial function and genes involved in glutathione synthesis were reduced. Differences in brain structure did not align with any cognitive or motor impairment.
Conclusions:
These data reveal early markers, and highlight novel brain regions involved in the pathology of PD in the PINK1 -/- rat before behavioral dysfunction occurs.
Keywords
INTRODUCTION
Parkinson’s disease (PD) is the second most common neurodegenerative disorder after Alzheimer’s disease and affects nearly 1 in 1000 people globally [1]. Epidemiological studies report that idiopathic or sporadic PD accounts for 95% of the cases that occur late in life [2], while only 5% are familial or genetically based and lead to early onset of PD. Despite years of research, while the etiology of idiopathic PD is unknown, research in familial models have led to the discovery of several genes associated with an increased risk for disease onset including PINK1, LRRK2, PARK2, and GBA. These genes significantly increase disease susceptibility and can be identified early in life, long before the onset of clinical symptoms [3].
The normal function and life cycle of mitochondria are intimately related to PD [4–6]. Loss of function mutations of the gene encoding PTEN-induced kinase 1 (PINK1), a serine/threonine kinase localized to mitochondria, are the second most frequent causes of autosomal recessive PD [7, 8]. PINK1 is key in sensing mitochondrial viability by responding to membrane depolarization, and ultimately acts with other proteins to coordinate the disposal of damaged mitochondria [9]. Almost 4% of patients afflicted with early-onset PD are estimated to carry a PINK1 mutation, with homozygous carriers exhibiting a slow disease progression beginning at an age of onset of around 40 years [10]. Clinical symptoms include motor akinesia, sleep disorders, loss of olfactory discrimination, and depression [11–13].
HorizonDiscovery® in collaboration with the Michael J. Fox Foundation has developed the first homozygous PINK1 -/- rat and subsequently characterized the developmental changes in behavior, neurochemistry, and Lewy body neuropathology collected at 4, 6, and 8 months of age [14]. Motor deficits appear at 4 months, with a significant reduction in nigral dopaminergic neurons by 6–8 months, and no evidence of alpha synuclein aggregates. In studies by Ciucci et al., PINK1 -/- rats showed vocalization and oromotor deficits as early as 4 months, with altered tyrosine hydroxylase levels in the locus coeruleus and reduced gene expression of lysosomal marker Atp13a2 in the periaqueductal gray. Moreover, these animals also show evidence of alpha synuclein aggregates at 8 months of age [15, 16]. In a more recent study, Villeneuve et al. (2016) reported evidence of altered metabolomics, mitochondrial pathways, and mitochondrial function in the striatum of PINK1 -/- rats at 4 months [17]. Despite these indications of altered motor function coupled with anatomical and physiological changes early in development in the PINK1 -/- model, like most other PD animal models (e.g., see [18–21]), extensive characterization of the PINK1 -/- rat model prior to 4 months is unavailable [14, 17].
Diffusion tensor imaging and quantitative anisotropy (DTI-QA) comprise an imaging modality that is useful in diagnosing and characterizing early onset PD in the clinic [22, 23] (for review, see [24, 25]), and were used in this study to map differences in distributed neural networks between WT and PINK1 -/- rats. When combined with a 3D-segmented, annotated brain atlas, and computational analysis, it is possible to reconstruct integrated neural circuits or “finger prints” of subtle but significant changes in microarchitecture.
In these studies, we used non-invasive MRI to identify differences between wild-type (WT) and PINK1 -/- rats at 12-13 weeks of age. This time period was specifically selected because it occurs before any robust behavioral indications of PD have been noted to emerge in various rodent models of PD, including the PINK1 -/- model [14, 18]. As hyposmia is a common and early symptom that often precedes PD onset [26], we included a BOLD imaging experiment to measure changes in cerebral blood flow after exposure to a novel almond odor. Alongside imaging, we utilized behavioral assays to identify any early motor or cognitive indications, as well as biochemical measures to identify brain areas that are affected during early disease progression prior to symptom onset.
MATERIALS AND METHODS
Animals
Male Long Evans WT (n = 15) and PINK1 -/- (n = 15) rats were obtained from HorizonDiscovery at 11-12 weeks of age and were acclimated to our facilities for one week prior to behavioral testing. Rats were maintained on a 12:12 h light:dark cycle with a lights on at 07:00 h and allowed access to food and water ad libitum. All rats were acquired and cared for in accordance with the guidelines published in the Guide for the Care and Use of Laboratory Animals (National Institutes of Health Publications No. 85–23, Revised 1985) and adhered to the National Institutes of Health and the American Association for Laboratory Animal Science guidelines. The protocols used in this study complied with the regulations of the Institutional Animal Care and Use Committee at the Northeastern University.
Behavioral tests
Novel recognition test
A novel object recognition test (NOR) was used to assess episodic learning and memory related to stimulus recognition, as PD patients as well as PD animal models have been reported to display object and spatial memory/learning impairments early in development [27–33]. The NOR apparatus consisted of a large black cube-shaped Plexi-glass box (L: 60.9, W: 69.2, H:70.5 cm) with no lid that was indirectly dimly illuminated with two 40 W incandescent light bulbs. The task was performed over the course of two days. On day one, animals were placed in the empty NOR box for an acclimation period of 15 min. The following day, for the first phase of testing (the familiar phase), two identical objects were placed in diagonal corners of the box 5 cm from each wall. Animals were placed in the box facing one of the two empty corners and allowed to investigate the objects for 5 min. Animals were then placed back into their home cage for a period of 90 min, and then exposed to the second phase of the test (the novel phase). During the novel phase, one of the familiar objects was replaced with a novel object, and animals were placed in the box facing one of two empty corners and allowed to freely explore the objects for 3 min. Animals were assessed for the total time spent with the novel object, the amount of encounters that the animal had with the novel object, and for the novel object recognition index as described [32] defined as the ratio of the total time spent investigating the novel object over the total time investigating both the novel and familiar objects. Exploration was defined as the rat directing its nose within 2 cm of the object or touching the object with its nose.
Barnes maze
The Barnes Maze has been validated in assessing spatial learning and memory across various rodent models [34–36]. The maze consists of a circular platform (121 cm in diameter, elevated 40 cm), with 18 escape holes along the perimeter at 30 cm intervals. A black, removable enclosed Plexiglas “goal” box (L: 40.0, W:12.7, H:7.6 cm) was positioned under a single escape hole on the underside of the maze in the same position relative to the testing room across all trials. Between trials, the maze was rotated 45 degrees and the goal box shifted accordingly for cardinal consistency. Each trial began with animals being placed inside the goal box for 1 min and then under an enclosed container at the center of the maze for 30 s. The container was then lifted to start the trial. If the animals did not find the goal box within the test period (4 min), they were gently nudged into the box and allowed to stay for 1 min, and then placed back in their home cages between trials (3 trials/day for 4 days). The day following the last trial, animals were exposed to a single probe trial to assess short-term memory retention. This trial was identical in procedure to the acquisition trials except the goal box was removed and animals explored the maze for 4 min. For the acquisition trials, all animals were analyzed for goal box latency (i.e., the amount of time before the animals entered into the goal box), errors (defined as the number of instances animals investigated any non-goal box hole with their head directed towards the hole within 2 cm), speed and distance traveled on the maze to assess any motor abnormalities. For the probe trial, animals were assessed for the percentage of total testing time (i.e., 4 min) they spent with their heads within 2 cm of the goal box hole (“goal exploration time”), as well as the primary distance traveled (i.e., the distance traveled before first exploring the goal box region), primary latency (i.e., the amount of time animals explored the maze before first investigating the goal box region), and speed. For both the NOR and the Barnes maze, all trials were video recorded and analyzed using manual methods by experimenters blind to treatment condition and verified with automated scoring using ANY-maze® software (Stoelting, Wood Dale, IL).
Beam walk
A tapered balance beam equipped with sensors capable of detecting foot faults on either side of the beam (Dragonfly Inc., Ridgeley, WV) was used to assess fine-motor coordination as previously described elsewhere, and using the PINK1 -/- animal model [14, 38]. The beam was 150 cm long and started at a width of 5.5 cm, tapering down to 1.5 cm immediately prior to an opening leading into an enclosed goal box. The beam was elevated 120 cm off the ground and was fitted with a safety hammock approximately 80 cm below the beam in case the animals fell off. Positioned on either side of the beam, approximately 4 cm below the ledge of the beam surface, there were two 2 cm wide ledges that ran the length of the beam that were connected to sensors that recorded the number of times that each animal’s paw(s) slipped off the beam surface (“foot faults”). The sensor ledges were divided along the length of the beam into three separate sections (each approximately 47 cm long) on either side that recorded faults at the beginning (the widest, or “wide”, portion of the beam), the “middle” (the intermediate portion of the beam) and the end (the thinnest, or “thin”, portion of the beam).
Similar to protocols reported elsewhere [38], all animals were acclimated to the beam over 2 days and exposed to 3 training trials each day. For training, animals were placed initially inside the goal box and allowed to acclimate for 60 s. Animals were then placed on a start platform illuminated by a single white light (60 W incandescent light bulb) to serve as a mildly aversive stimulus to motivate the animal to traverse the beam and enter the goal box. Once the animals reached the goal box, they remained there for 1 min and were then placed back in their home cage until the next trial. The day after training, animals were tested over 3 trials per day for 2 days. Testing conditions were similar to training conditions with the aversive light stimuli removed. Foot faults and goal box latency were recorded for each trial, and averaged for each day. Additionally, foot faults per beam segment type (i.e., thin, middle, wide) were also analyzed to provide greater detail in assessing balance and coordination.
Rotarod
The Rota-Rod test isolates equilibrium and motor behavior using a cylindrical tube 4 cm in diameter rotating at an increasing frequency, and has previously been used to assess motor function in Parkinson’s models [14, 40]. Animals were acclimated to the rod over the course of 2 consecutive days, with 3 trials per day. For training, animals were placed on the rod rotating at a frequency of 5 rpm for 3 min. If at any time, the animals fell off, they were immediately returned to the rod surface for the remainder of the training period. The day following training, animals were tested for 2 consecutive days with 3 trials per day. During testing trials, animals were placed on the rod set at a frequency of 1 rpm increasing linearly at a 0.1 v/t2 acceleration rate for a total of 210 s ending at a maximum frequency of 50 rpm. Latency to fall off the rod was recorded and averaged across trials and days.
Magnetic resonance imaging
Imaging system and anatomy acquisition
Animals were scanned at 300 MHz using quadrature transmit/receive volume coil built into the rat head holder and restraining system for awake animal imaging (Animal Imaging Research, Holden, MA). The design of the coil provided complete coverage of the brain from olfactory bulbs to brain stem with greater than sufficient B1 field homogeneity. Experiments were conducted using a Bruker Biospec 7.0T/20-cm USR horizontal magnet (Bruker, Billerica, MA) and a 20-G/cm magnetic field gradient insert (ID = 12 cm) capable of a 120-μs rise time. At the beginning of each imaging session, a high-resolution anatomical data set was collected using the RARE pulse sequence (22 slice; 1.0 mm; field of vision [FOV] 3.0 cm; 256×256; repetition time [TR] 2.5 s; echo time [TE] 12 ms; NEX 2; 2 min acquisition time).
Acclimation
To reduce the stress associated with head restraint, rats were acclimated to the restraining system (head holder and body tube) one week prior to their actual imaging session. The design of the restraining system (Animal Imaging Research, Holden, MA) included a padded head support obviating the need for ear bars to help to reduce animal discomfort while minimizing motion artifacts. These acclimation sessions were run each day for 5 consecutive days. Rats were briefly anesthetized with 2-3% isoflurane while being secured into the head holder, and forepaws were secured with tape. When rats regained full consciousness, the imaging restraint system was placed into a black opaque box “mock scanner” for 30 min with a digital recording of the MRI pulse sequence to simulate the bore of the magnet and the imaging protocol. These acclimations steps minimize various sources of variability associated with restraint as a significant decline in respiration, heart rate, motor movements, and plasma corticosterone are noted to occur when the first and last acclimation periods are compared [41]. These reductions in autonomic and somatic measures of arousal and stress improve the signal resolution and image quality. All animals were imaged within one week of acclimation procedures.
Almond odor stimulation
Awake WT and PINK1 -/- rats were imaged for changes in BOLD signal intensity in response to the odor of almond (benzaldehyde), a stimulus known to elicit the innate reward response [42]. We chose almond odor because nuts are high in calories and would be expected to convey greater valance as compared to other odors. Moreover, the standard food chow in our colony is devoid of nuts, so laboratory bred rats and the rats used in these studies have no previous exposure to this food. Previous studies have revealed that brain activation maps from banana, rose, citrus and almond odors are dramatically different. Almond, but not the other odors, activate the hippocampus, amygdala, and limbic cortex [42]. In a serial dilution of almond scent, we previously showed that a threshold dilution of 100% benzaldehyde (1/10,000 v/v) gives a significant and consistent pattern of brain activity, and was the threshold dilution of almond odor used in this study.
BOLD image acquisition
Functional images were acquired using spin echo (SE) BOLD, specifically a multi-slice HASTE pulse sequence (Half Fourier Acquisition Single Shot Turbo Spin Echo). Bruker Paravision (Bruker, Billerica, MA USA) automatically finds the: basic frequency, shims, power requirements for 90° and 180° pulses, and sets the receiver gain. A single scanning session acquired 22 slices, 1.0 mm thick, every 6.0 s (FOV 3.0 cm, matrix size 96×96, NEX 1) repeated 150 times for a total time of 15 min. The in-plane pixel resolution was 312μm2. Each scanning session was continuous, starting with 50 baseline image acquisitions, followed by almond odor exposure, and a final 100 image acquisitions.
BOLD imaging data analysis
Data are coregistered to a mean functional image using SPM8’s coregistrational code with the following parameters: Quality: 0.97, Smoothing: 0.35 mm, and Separation: 0.5 mm. Gaussian smoothing was performed with a full width half maximum of 0.8 mm. Images were aligned and registered to the 3D rat brain atlas, segmented and labeled with 171 discrete anatomical regions. The alignment process was facilitated by an interactive graphic user interface. The registration process involved translation, rotation, and scaling independently, and in all three dimensions. Matrices that transformed each subject’s anatomy were used to embed each slice within the atlas. All pixel locations of anatomy that were transformed were tagged with major and minor regions in the atlas. This combination created a fully segmented representation of each subject within the atlas. The composite statistics were built using the inverse transformation matrices. Each composite pixel location (i.e., row, column, and slice), pre-multiplied by [Ti]-1, mapped it within a voxel of subject (i). A tri-linear interpolation of the subject’s voxel values (percentage change) determined the statistical contribution of subject (i) to the composite (row, column, and slice) location. The use of [Ti]-1 ensured that the full volume set of the composite was populated with subject contributions. The average value from all subjects within the group determined the composite value.
Using voxel-based analysis, the percent change in BOLD signal for each independent voxel was averaged for all subjects. Each scanning session consisted of data acquisitions (whole brain scans) with a period of 6 s each for a total time of 25 min. The control window was the first 50 scan repetitions (5 min baseline), while the almond odor stimulation window was 100–150 (10–15 min). Student’s t tests with 95% confidence levels (two-tailed; heteroscedasticity assumed) were performed on each voxel (ca. 15,000 in number) of each subject within their original coordinate system with a baseline threshold of 2% BOLD change to account for normal fluctuations of BOLD signal in the awake rodent brain [43]. Due to the multiple t test analyses performed, a false-positive detection controlling mechanism was introduced [44] and assured a false-positive detection rate (FDR) below our cutoff of 0.05.
A composite image of the whole brain representing the average of all subjects was constructed for each group for analyses of 171 brain areas, allowing us to look at each area separately to determine the BOLD change and the number of activated voxels in each area. Volume of activation was compared across experimental groups using the nonparametric Kruskall-Wallis test statistic with an α level set at 0.05.
Diffusion weighted imaging (DWI)
In a recent study, we used diffusion weighted imaging DTI-QA to identify subtle changes in subcortical, gray matter microarchitecture in rats following mild concussion [45]. The determinants of diffusion at a microscopic level are many as the microarchitecture of the brain parenchyma is composed of neurons and their axonal and dendritic fibers, glia, connective tissue, capillaries, and intracellular and extracellular water. It should be noted that microscopic axonal properties and the general microarchitecture of a voxel are the key determinants of diffusion anisotropy, and not myelination as originally posited [46]. At a macroscopic level, the coherence of the axons in a voxel (i.e., whether they are parallel or crossing) is the key determinant. Accordingly, DTI is a very sensitive method that can detect subtle micro- and macrostructural changes in tissues, but cannot specify what changes occurred. The specificity of the changes is better addressed by histological methods.
Diffusion-weighted imaging data were acquired with a spin-echo echo-planar-imaging (EPI) pulse sequence with the following parameters: TR/TE = 500/20 ms, 8 EPI segments, and 10 non-collinear gradient directions with a single b-value shell at 1000 s/mm2 and one image with a b-value of 0 s/mm2 (referred to as b0). Geometrical parameters were: 60 slices, each 0.313 mm thick (brain volume) and with in-plane resolution of 0.313×0.313 mm2 (matrix size 96×96; FOV 30 mm2). The imaging protocol was repeated two times for signal averaging. Each DWI acquisition took 44 min and the entire MRI protocol lasted about 1 h 28 min.
Image analysis included DWI analysis of the DW-3D-EPI images to produce maps of fractional anisotropy (FA) and relative anisotropy (RA). DWI analyses were implemented with Matlab (Mathworks, Natick, MA) and MedINRIA (1.9.0; http://www-sop.inria.fr/asclepios/software/MedINRIA/index.php) software. Because sporadic excessive breathing during DTI acquisition can lead to significant image motion artifacts that are apparent only in the slices sampled when motion occurred, each image (for each slice and each gradient direction) was automatically screened, prior to DWI analysis, for motion artifacts. Following the elimination of acquisition points with motion artifacts, the remaining acquisition points were corrected for linear (motion) and non-linear (eddy currents/susceptibility) artifacts using SPM8 (Welcome Trust Centre for Neuroimaging, London, UK).
For statistical comparisons between rats, each brain volume was registered with the 3D rat atlas allowing voxel-based statistics. All image transformations and statistical analyses were carried out using in-house MIVA software [47]. For each rat, the b0 image was co-registered with the b0 template (using a 6-parameter rigid-body transformation). The co-registration parameters were then applied on the DWI-indexed FA and RA maps. Normalization was performed on the maps since they provide the most detailed visualization of brain structures and allow for more accurate normalization. The normalization parameters were then applied to all DWI indexed maps. The normalized indexed map was smoothed with a 0.3 mm Gaussian kernel. To ensure that IA values were not significantly affected by the pre-processing steps, we used the ‘nearest neighbor’ option following registration and normalization.
Isolation and measurement of intracellular glutathione
Frozen brains were cut into 2 mm thick slices using a brain block. The areas of the prefrontal cortex (pre- and infralimbic cortex, medial orbital cortex), striatum, substantia nigra, deep cerebellar nuclei, and the underlying brainstem from the same section were blocked out with a razor blade. Samples were thawed on ice, and a 10% homogenate was prepared. A 100μl sample was separated for protein measurements and the remaining lysate was added to a microcentrifuge tube and an equal volume of 0.4 N perchloric acid was added, followed by incubation on ice for 5 min. Samples were centrifuged at 13,000 g and the supernatant transferred to new microcentrifuge tubes. One hundred μl of sample was added to a conical microautosampler vial and kept at 4°C in the autosampler cooling tray. Ten μl of this sample was injected into the high-performance liquid chromatography (HPLC) system.
The separation was accomplished using an Agilent Eclipse XDB-C8 analytical column (150 mm; 3.5 mm) and an Agilent Eclipse XDB-C8 (4.6×12.5 mm; 5 mm) guard column (Agilent Technologies, Santa Clara, CA). Two mobile phases were used. Mobile phase A was 25 mM sodium phosphate and 1.4 mM 1-octanesulfonic acid, adjusted to pH 2.65 with phosphoric acid. Mobile phase B was 50% acetonitrile. The flow rate was initially set at 0.6 ml/min and a step gradient was used: 0–9 min 0% B, 9–19 min 50% B, 19–30 min 50% B. The column was then equilibrated with 5% B for 12 min prior to the next run. Temperature was maintained at 27°C. The electrochemical detector was an ESA CoulArray with BDD analytical cell model 5040 (Thermo Scientific, Wilmington, DE), and the operating potential was set at 1500 mV. Sample concentrations were determined from the peak areas of metabolites using standard calibration curves and ESA-supplied HPLC software. Sample concentrations were normalized against protein content. In some cases, samples were diluted in mobile phase as needed, or up to 50 ml of sample was injected to ensure that thiol levels were within the range of the standard curve.
DNA isolation and global DNA methylation measurements
Genomic DNA was isolated from different brain regions from controls and PINK1 -/- animals for measurement of global DNA methylation as previously described [48, 49]. DNA was isolated from harvested brain regions using the FitAmp Tissue DNA Extraction Kit from Epigentek (Farmingdale, NY) according to the manufacturer’s protocol. The isolated DNA was cleaned for any contaminating RNA by treatment with RNAase enzyme and quantified using ND-1000 NanoDrop spectrophotometer (Thermo Fisher Scientific; Waltham, MA).
Global DNA Methylation analysis was performed using the MethylFlash Methylated DNA Quantification Kit from Epigentek using the manufacturer’s protocol. One hundred ng of clean genomic DNA isolated from different brain regions from controls and PINK1 -/- animals was used for this purpose. DNA-Methylation was quantified using 5-methylcytosine monoclonal antibodies by an enzyme-linked immunosorbent assay–like reaction as previously described [48, 49]. The levels of methylated DNA were calculated using the intensity of optical density on a microplate reader at 450 nm. Results were normalized against a standard curve prepared according the manufacturer’s protocol using 0–100% methylated standards.
ELISA assay
ELISA analysis was conducted for Complex I, Complex IV, and GFAP, using commercially available kit as previously described by our group and according to the manufacturer’s instructions (Abcam, Cambridge, MA).
Western blot
Protein expression for Nrf-2 was evaluated using western blot as previously described [50]. Briefly, proteins were extracted from different brain regions using Total Protein Extraction Kit (Millipore, Billerica, MA) and Powergen 125 tissue homogenizer (Fisher Scientific, Waltham, MA). Tissue lysate samples were analyzed for total protein concentration using the BCA assay (Pierce, Rockford, IL). 50μg of total protein extract was run on a precast 4–20% sodium dodecyl sulfate-polyacrylamide gel electrophoresis (SDS-PAGE) system at 200 V for 30 min. Subsequently, protein bands on the gel were transferred onto a PVDF membrane by an iBlot® Dry Blotting System (Invitrogen, Carlsbad, CA). The membrane was blocked with 5% milk in Tween®-containing Tris buffer saline (TBS-t) for 1 h at room temperature. Membrane was cut and incubated with 1:1,000 dilution of primary rabbit β-actin antibody or 1:1000 dilution of primary Nrf-2 antibody (Abcam, Cambridge, MA) separately overnight at 4°C. Membranes were then washed three times with TBS-t and incubated with 1:2,000 dilutions of secondary anti-rabbit horseradish peroxidase-conjugated IgG (Cell Signaling Technology Inc., Danvers, MA) in TBS-t for 1 hour at room temperature. After rinsing excess antibody with TBS-t and water, 4 ml ECL substrate (Pierce, Rockford, IL, USA) was added and mixed with membranes for 5 min, which is cleaved by peroxidase to give a chemiluminescent product. The membranes were visualized using a Kodak Digital X-ray Specimen (DXS) System. β-actin was used as a protein loading control.
qRTPCR
RNA was isolated and cDNA was synthesized to measure the mRNA levels as described previously [51] using commercially available primers from TaqMan for all the genes.
Statistics
GraphPad Prism version 6.0 (GraphPad Software, La Jolla, CA) was used for all statistical analyses, unless otherwise noted. Student’s independent t-test was used for comparing control and experimental groups in the NOR test and for Barnes maze probe data. A one-sample t-test was used to assess differences from chance (i.e.,
RESULTS
Behavior
The Novel Object Recognition task showed that WT rats spent significantly more time beyond chance (i.e.,
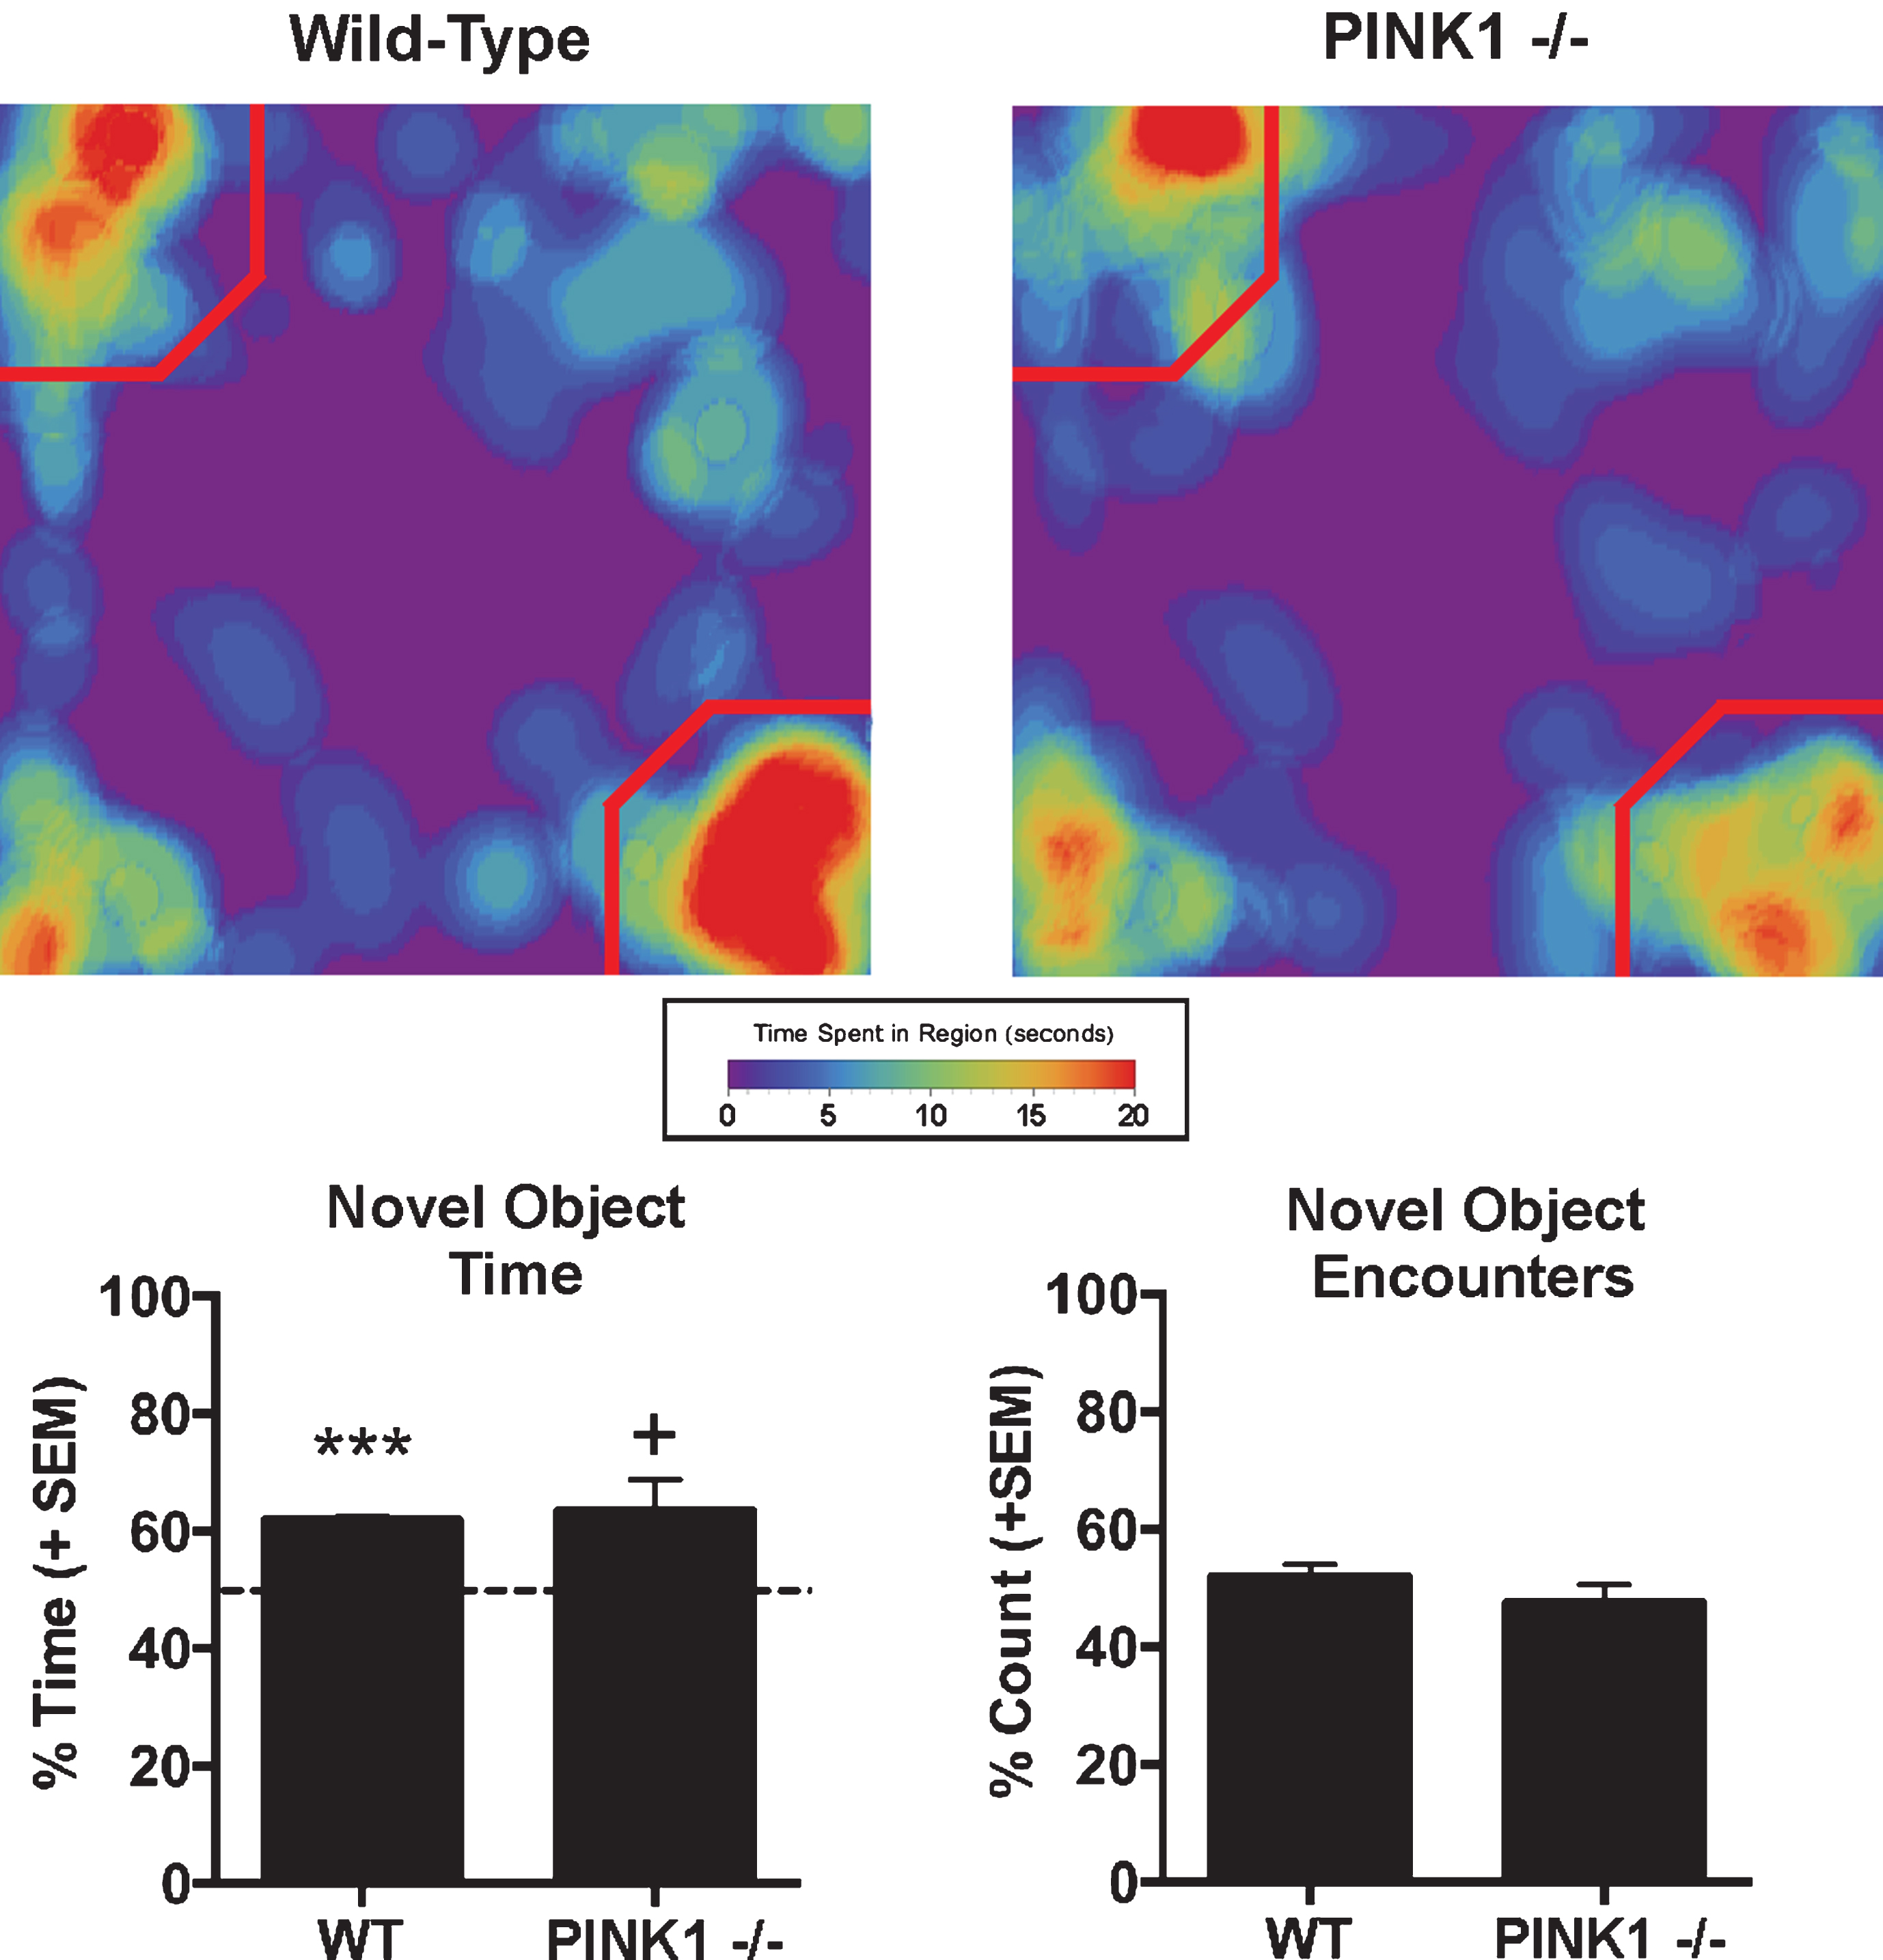
Novel Object Recognition:
Barnes maze testing showed no significant differences between genotypes for the time required to find the goal box (Latency) during the acquisition phase (t(8) = 1.96, p > 0.2, Fig. 2A). Across days, despite a longer average goal box search time on the first day of testing for PINK1 -/- animals (WT:
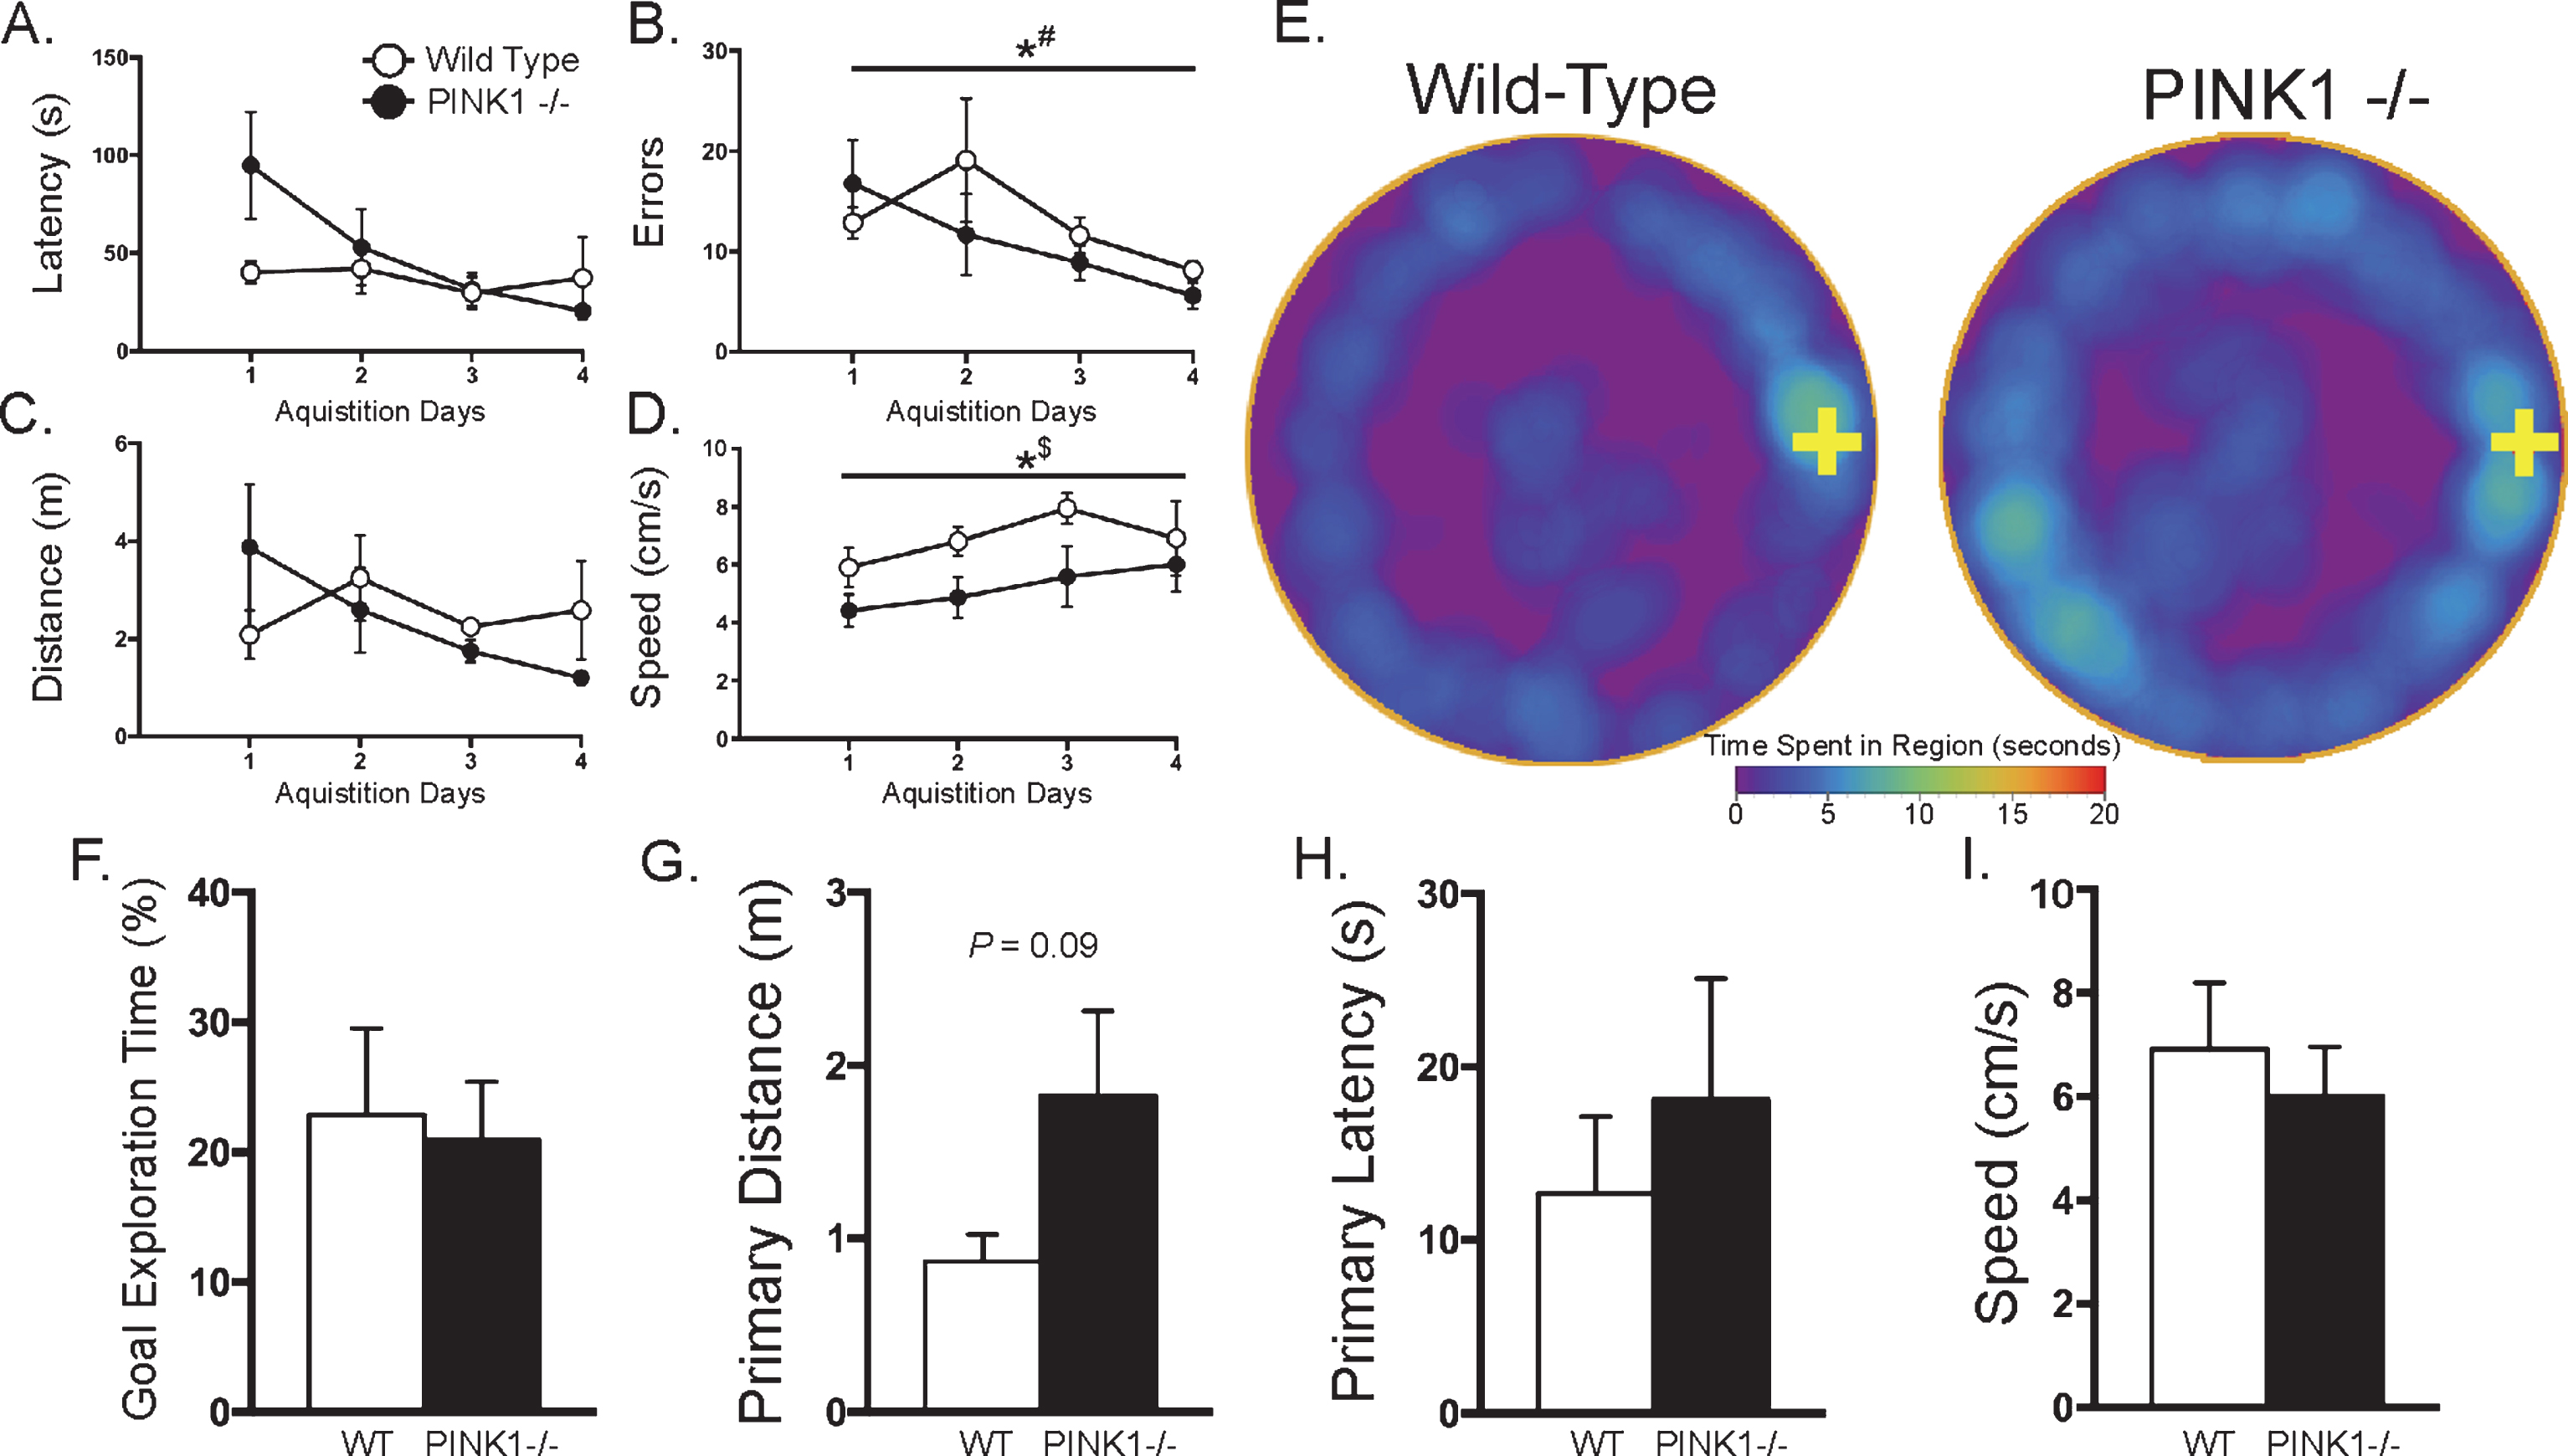
Barnes Maze: Barnes maze data from the acquisition phase (A-E) and a single probe trial (F-I). With the exception of a main effect of testing day on the number of errors committed (B), and a main effect of genotype on the speed that the animals explored the maze, with wild-types (WT) showing faster travel speeds than PINK1 -/- animals (D), there were no significant differences for any parameter during the acquisition phase, including goal box latency (A). Qualitative data from averaged heat maps (E) that show an overhead view of movement patterns on the Barnes maze (the goal box location is indicated by a yellow cross on the right side) suggest that PINK1 -/- rats may have spent more time exploring the maze before reaching the goal box, however this qualitative difference was not significant. During probe testing, similar to the acquisition phase, there were no significant differences between genotypes for: the percentage of total time animals spent exploring within 2 cm of the goal box hole over the 4 min testing period (F), the primary distance (i.e., the total distance traveled until the first encounter with the goal box hole) (G), primary latency (i.e., the amount of time before animals first encountered the goal box hole) (H), or the speed at which the animal explored the maze (I). *p < 0.05; #: Main effect of testing day (repeated factor) for both WT and PINK1 -/- for 2-way mixed ANOVA; $: Main effect of genotype (between-subjects factor) for 2-way mixed ANOVA. All line graphs, mean±SEM; bar graphs, mean + SEM.
Measures of motor behavior
Data represent means±SD. aIndependent samples t test; bBonferroni’s multiple comparison post hoc test.
Brain activation in response to almond odor
Activation of the Primary Olfactory System in Response to Almond Odor
One day after the last day of acquisition on the Barnes maze, animals were tested for short-term retention memory with a probe trial. During the probe trial, animals did not differ in the percentage of time spent within 2 cm of the goal box hole (t(8) = 2.50, p > 0.8; Fig. 2F). Similarly, animals did not differ in primary distance traveled (t(8) = 1.87; Fig. 2G), primary latency to find the goal box (t(8) = 0.66; Fig. 2H), or the speed at which they explored the maze (t(8) = 0.56, Fig. 2I, p > 0.05 for all).
Table 1 summarizes the results of the motor behavior tests. PINK1 -/- animals had marginally significantly fewer foot faults on the balance beam than their WT counterparts (t(8) = 2.02, p = 0.06). Analysis of balance beam performance evaluated in terms of the widths of the three specific beam segments (i.e., wide, middle, and thin), resulted in a significant interaction between genotype and segment width (F = 4.34, p < 0.05). Post hoc analysis showed that PINK1 -/- animals committed significantly fewer foot faults on the thinnest portion of the balance beam compared to their WT counterparts (p < 0.005). There was no significant difference between groups for the time required to traverse the balance beam into the goal box (t(8) = 1.13, p > 0.2), or for fall latency on the Rota-Rod apparatus (t(8) = 0.21, p > 0.8).
BOLD imaging in response to almond
Shown in Tables 2A and 2B are truncated lists of brain areas that were significantly different between WT and PINK1 -/- rats in response to the smell of almond. A complete list of all brain areas ranged in order of significance can be seen in Supplementary Table 1. The positive BOLD (Table 2A) volume of activation (voxel numbers) was limited to 13/171 brain areas while the negative BOLD (Table 2B) was only present in 6/171 brain areas. The thalamus appeared particularly sensitive as the anterior pretectal, lateral dorsal, lateral posterior, medial dorsal, and lateral geniculate all showed higher positive BOLD activation in PINK1 -/- animals. The negative BOLD data showed significant differences in the central, medial, paraventricular, and reuniens nuclei of the thalamus. Tables 3A and 3B show positive and negative BOLD volumes of activation, respectively, for brain areas comprising the primary olfactory system. Both WT and PINK1 -/- rats showed similar BOLD signal changes in response to almond, as there were no significant differences between genotypes for any of the 11 brain areas.
Diffusion weighted imaging
Shown in Fig. 3 are imaging data collected at 13 weeks of age comparing measures of fractional anisotropy (FA) and relative diffusivity (RD) between WT and PINK1 -/- rats. At this early age, there are significant differences, particularly in the olfactory system, hypothalamus, thalamus, and nucleus accumbens across both measures of water diffusion. There is a continuum of areas along the medial basal forebrain extending from the tenia tecta through the diagonal band of Broca, to the ventral hypothalamus. Measures of FA showed a trend toward significance for white matter (blue). Interestingly, measures of apparent diffusion co-efficient (ADC) showed significant differences between WT and PINK1 -/- in the deep cerebellar nuclei, e.g., lateral cerebellar nuclei (p < 0.008) and interposed nuclei (p < 0.042) together with the 8th cerebellar lobule (p < 0.034) and copula of the pyramis (p < 0.047). There were no significant differences between genotypes using indices of anisotropy for axial diffusivity and radial diffusivity.
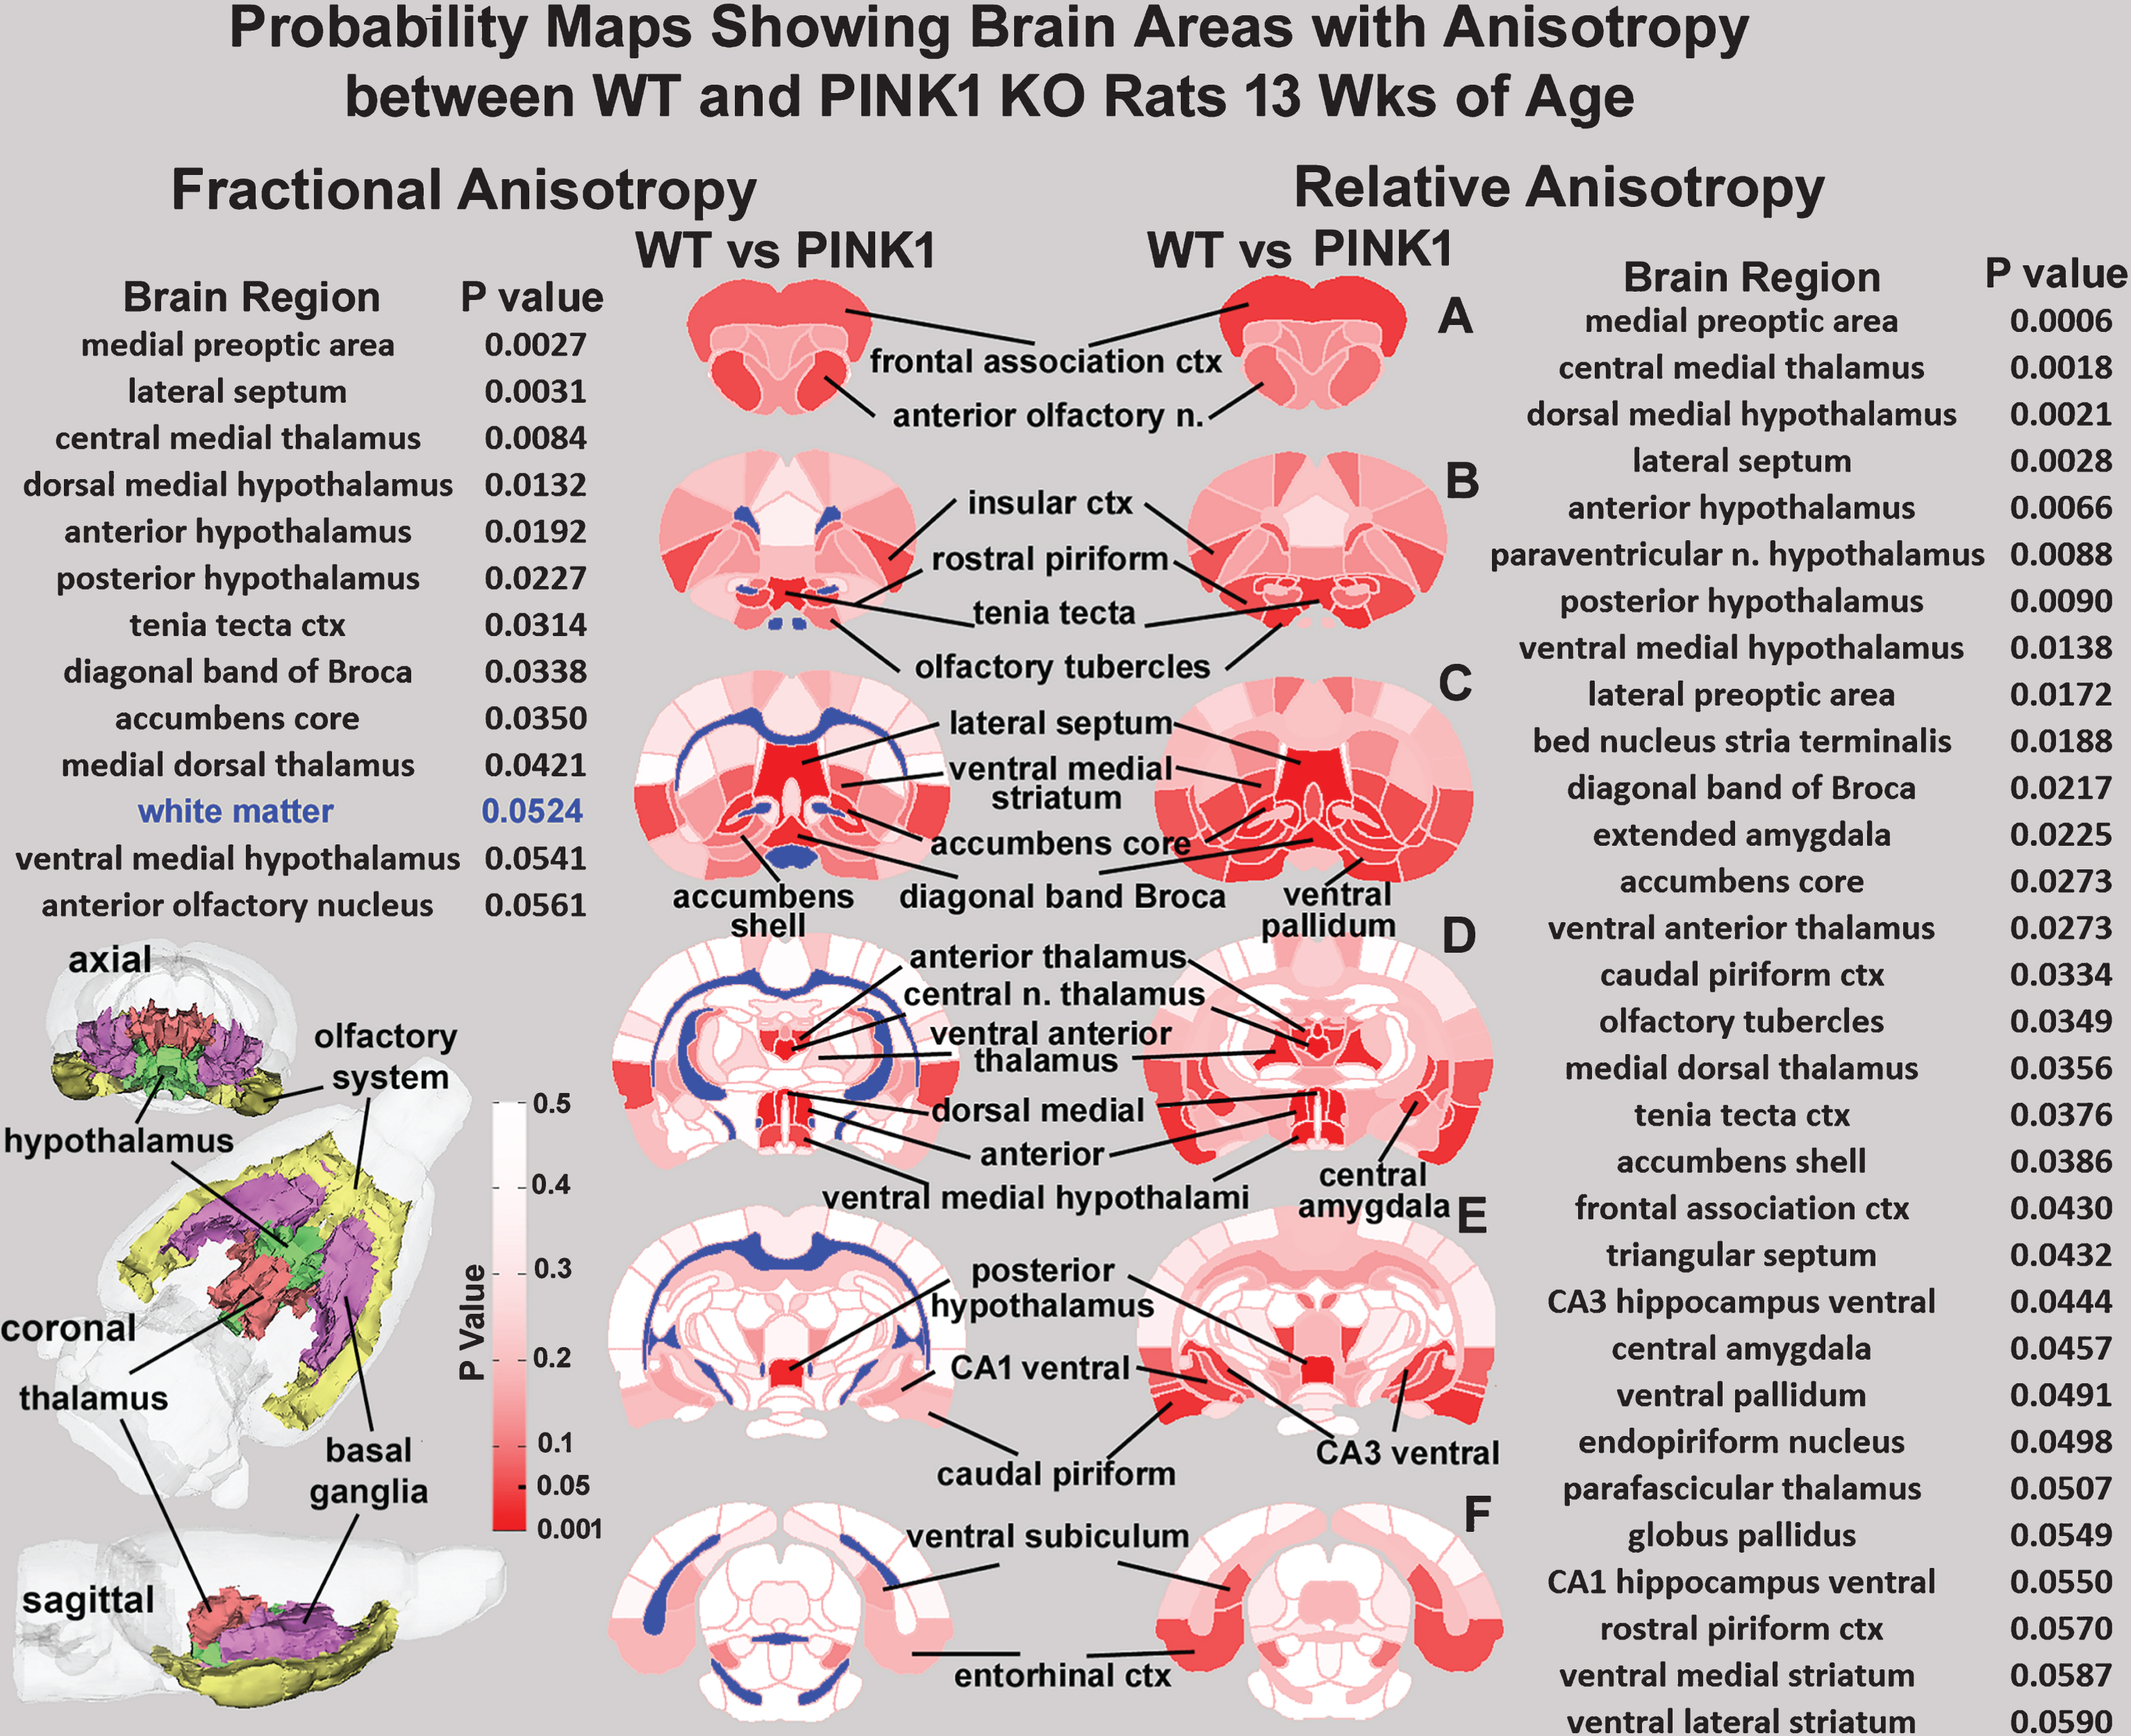
Diffusion Weighted Imaging: Shown are axial brain sections from the rat MRI atlas depicting the location of significantly affected areas (dark red) between wild-type (WT) and PINK1 -/- (PINK1) rats at 13 weeks of age for two measures of anisotropy, fractional anisotropy and relative diffusivity.
Postmortem metabolic/mitochondrial analysis
The levels of reduced glutathione (GSH), an endogenous antioxidant, were decreased in the striatum, substantia nigra, and deep cerebellar nuclei with a concurrent elevation in the levels of oxidized glutathione (GSSG) contributing significantly to the elevated oxidative stress status (GSH/GSSG) (Fig. 4). Moreover, the elevated oxidative stress also resulted in elevated oxidative DNA damage as identified from the 8-Oxo-2’-deoxyguanosine levels in these specific regions including the striatum and substantia nigra (Fig. 4).
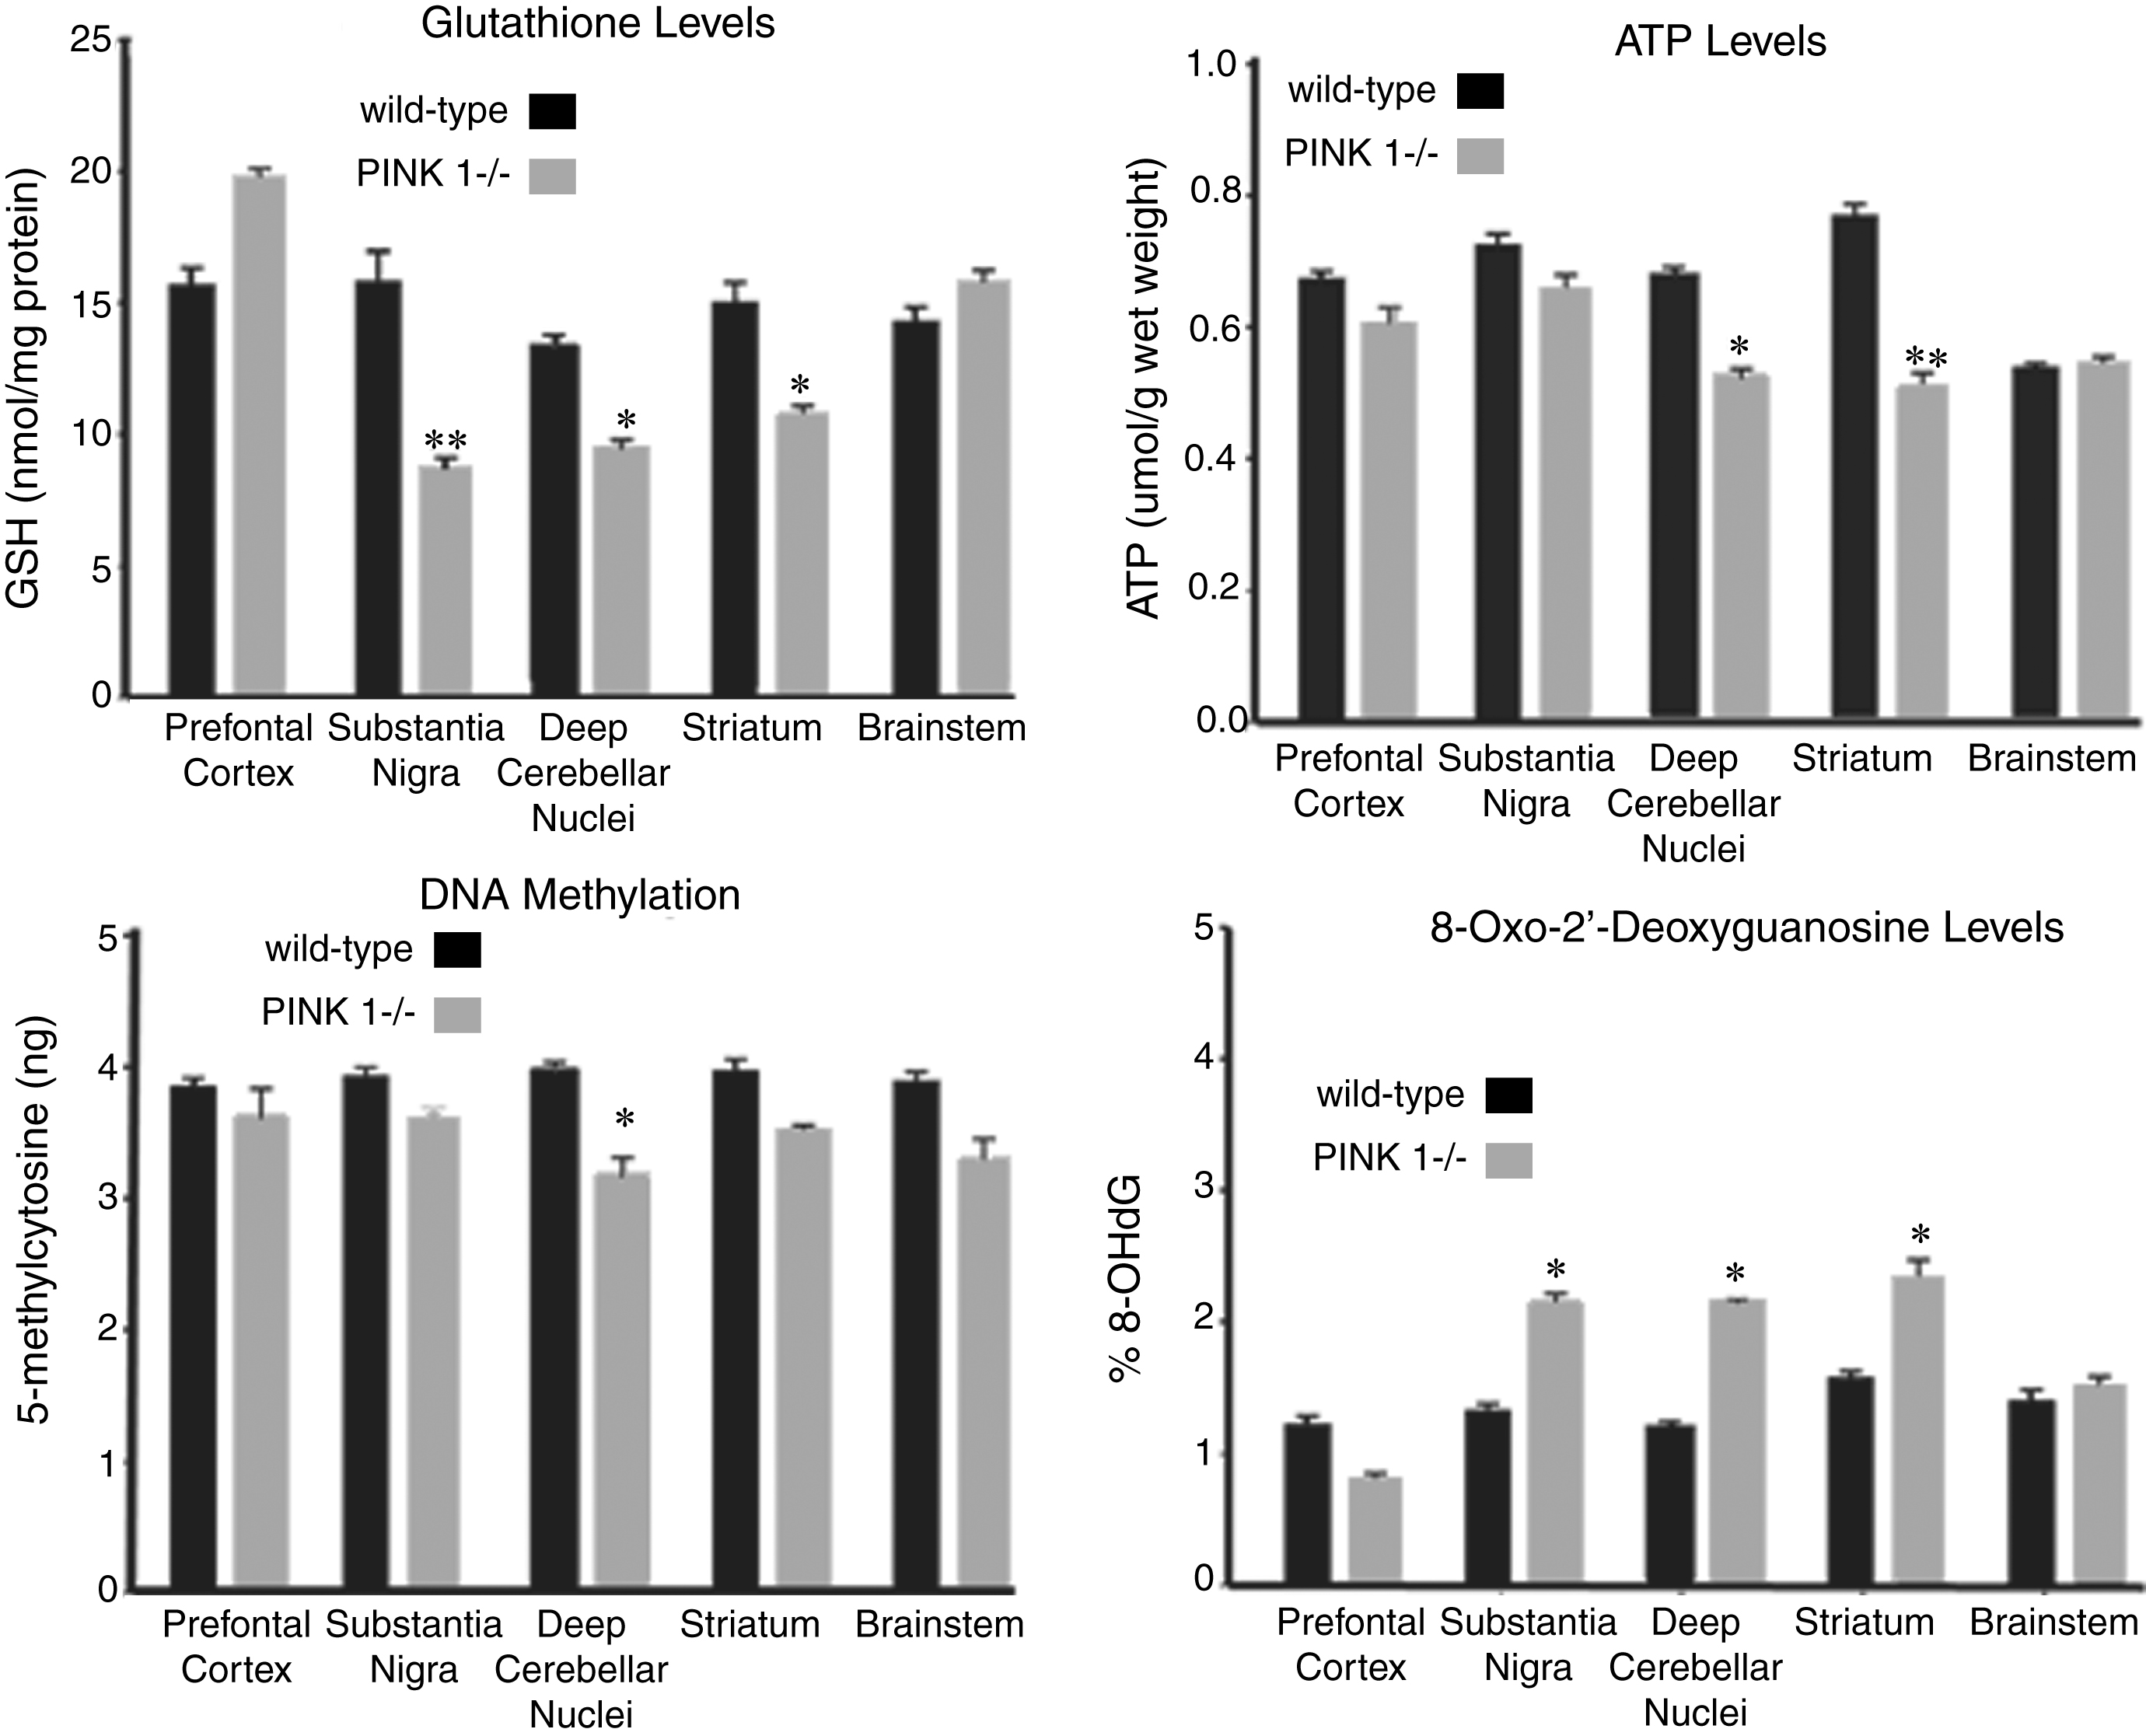
Redox Status and Mitochondrial Function: (A) Glutathione (GSH) and (B) 8-oxo-guanosine (8-oxo-dG) levels in different brain regions isolated from the postmortem brain samples from PINK1 -/- rat model of Parkinson’s disease. (C) ATP levels measured using ELISA in different brain regions postmortem from PINK1 -/- rats. *p < 0.05, **p < 0.01; comparison against wild-type controls, n = 6 for each genotype. All bar graphs, mean + SEM.
The mRNA transcript levels of genes contributing towards antioxidant levels were measured. The antioxidant pathway regulator (NRF2) and the enzyme glutathione synthase (GSS) that is responsible for GSH synthesis decreased in several regions (p < 0.05), including the deep cerebellar nuclei, substantia nigra, and the striatum (Fig. 5). Western blot analysis showed that the corresponding decrease in Nrf2 protein was also observed in these brain regions in the PINK1 -/- animals, as compared to WT animals (Supplementary Figure 1). We then measured the activity of antioxidant pathway enzymes, namely superoxide dismutase (SOD) and observed significant decline (p < 0.05) in all brain regions isolated from PINK1 -/- animals as compared to the WT animals (Fig. 6).
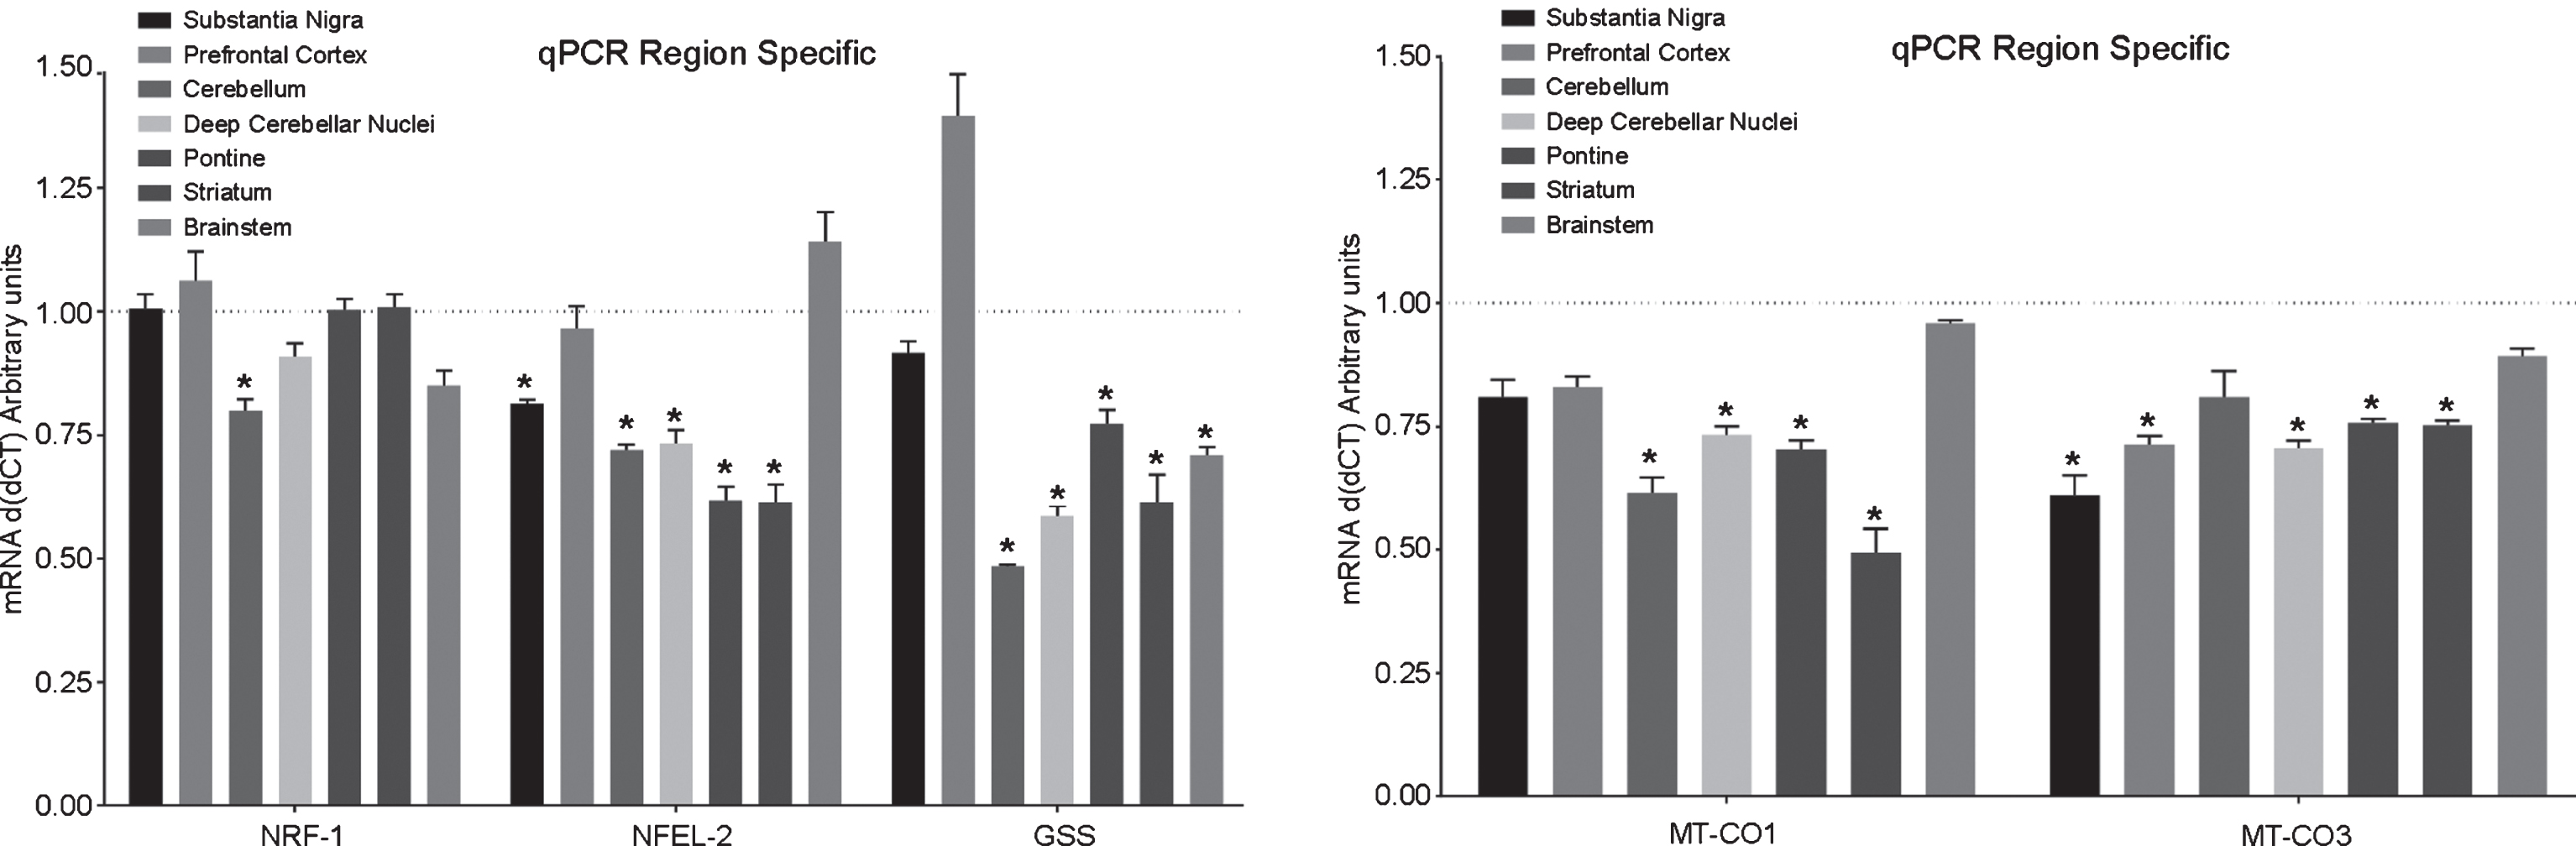
mRNA levels: Expression of antioxidant related genes (left panel) and genes on mtDNA (right panel) in different brain regions postmortem from PINK1 -/- rat model of Parkinson’s disease (n = 6). MT-CO1, MT-CO3 are subunits of cytochrome c oxidase encoded by mtDNA. NRF1 (nuclear respiratory factor 1) is a mitochondrial respirator factor, NRF2 (NFE2L2; nuclear factor, erythroid derived 2, like 2) antioxidant response element, GSS glutathione synthase enzyme; *p < 0.05, **p < 0.01; comparison against wild-type controls (n = 6) using two-sample t-test. All bar graphs, mean + SEM.
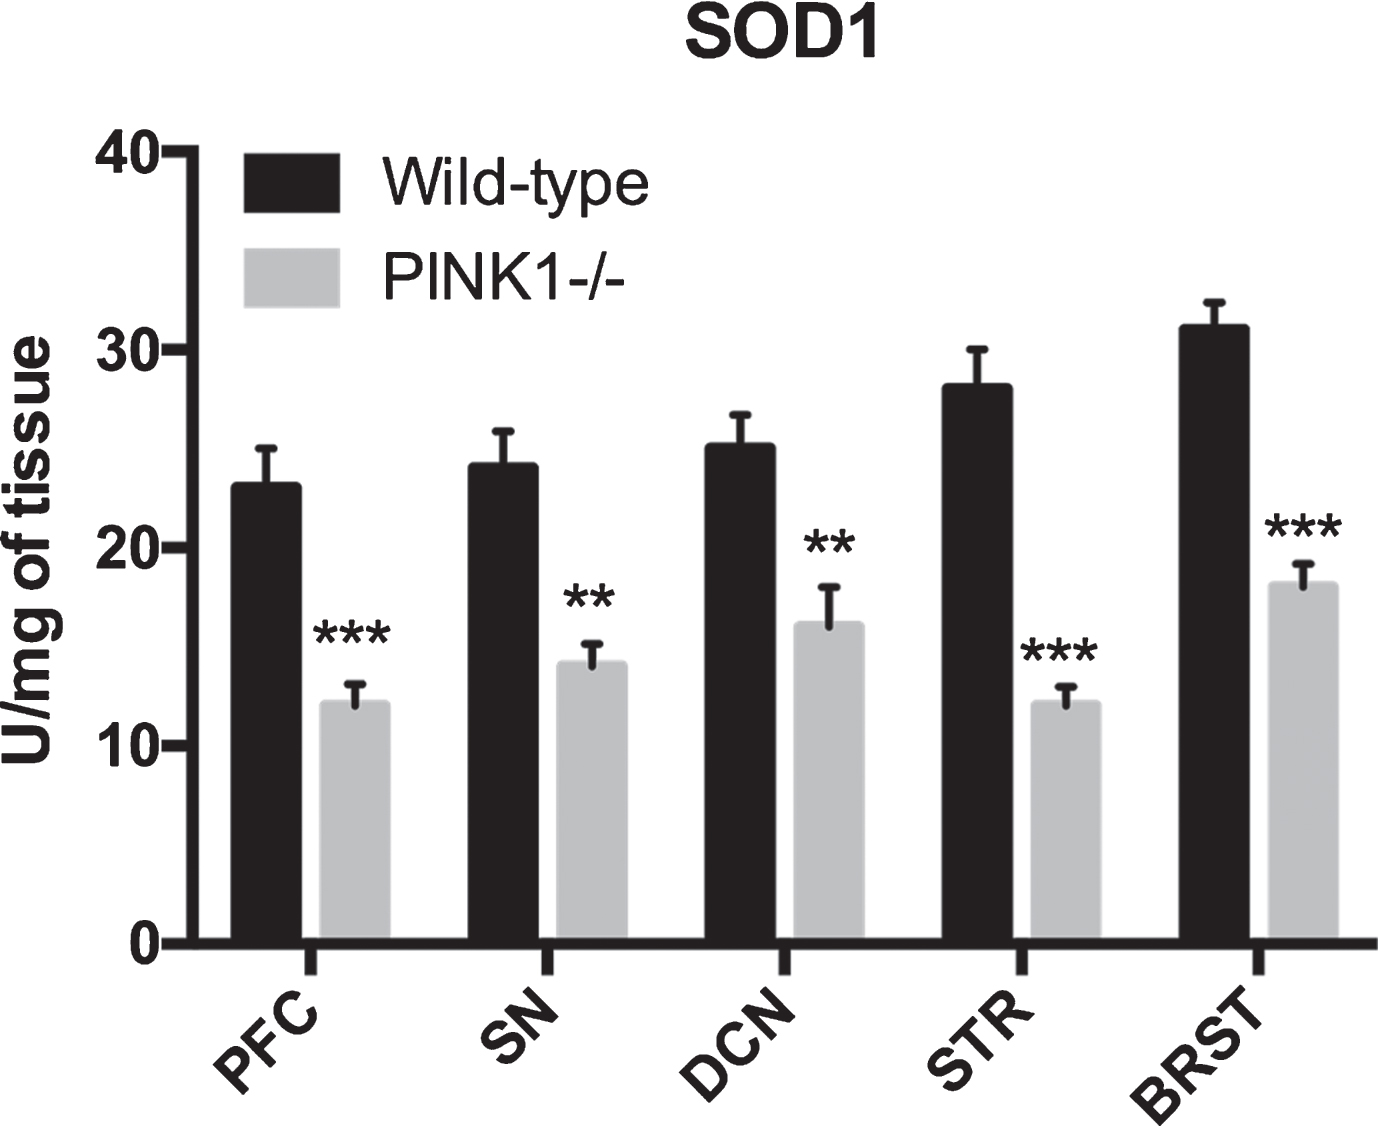
Antioxidant pathway enzyme activity: superoxide dismutase (SOD1) activity was reduced in postmortem brain samples from PINK1-/- animals. **p < 0.001, ***p < 0.0001; comparison against wild-type controls (n = 6 for each genotype). All bar graphs, mean + SEM.
Next we wanted to characterize any underlying effects on mitochondrial function related to the missing PINK1 protein. For this purpose, we measured changes in the expression of the mitochondrial genes using qRTPCR. Specifically, we observed a significant decline (p < 0.05) in levels of the genes encoding mitochondrial components including MT-CO1 and MT-CO3 (components for the complex IV; cytochrome C oxidase in the oxidative phosphorylation pathway) (Fig. 5). Next we measured the levels of the mitochondrial Complexes Complex I (NADH levels) and Complex IV (cytochrome C oxidase; CytC) levels using ELISA (Fig. 7). We observed a significant decline in the levels of both of these complexes on the mitochondria in the different brain regions isolated from the PINK1 -/- animals as compared to the WT animals (p < 0.05). Lastly, to identify any functional consequences of such metabolite and gene expression changes, ATP levels were measured in these specific brain regions (Fig. 4). Consistent with our previous observations, there was a significant decline in the levels of ATP in the deep cerebral nuclei and the striatum (p < 0.05).
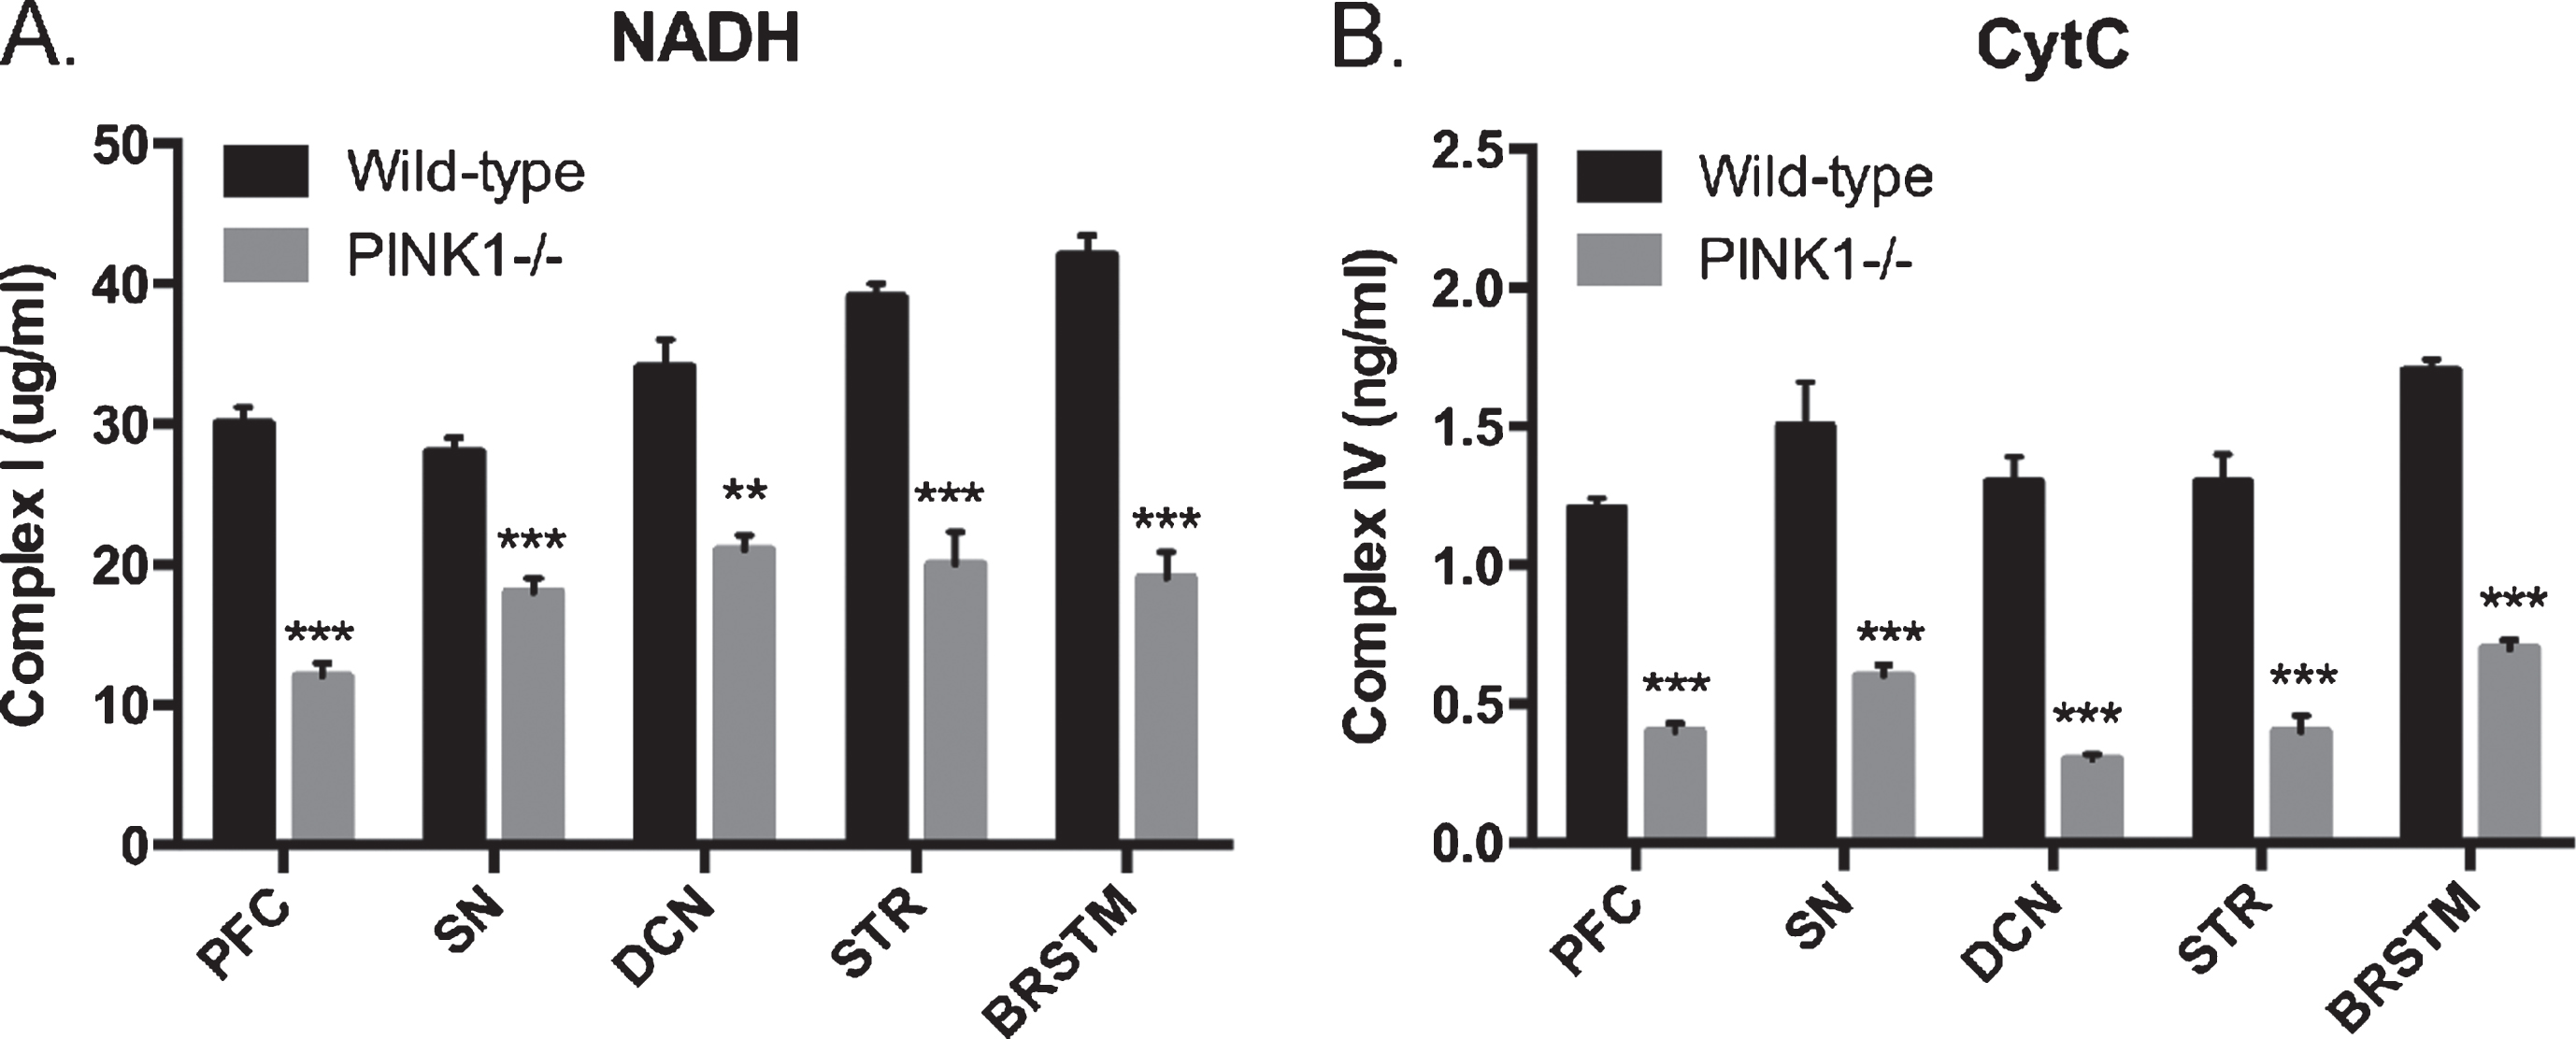
Mitochondrial complex levels: (A) Levels of Complex I (NADH) and (B) Complex IV (cytochrome C oxidase; CytC) from postmortem brain samples from PINK1-/- animals. **p < 0.001; ***p < 0.0001, comparison against wild-type controls, n = 6 for each genotype. All bar graphs, mean + SEM.
DISCUSSION
Using the PINK1 -/- genetic rat model we identified various neurobiological antecedents for PD well before motor deficits typically begin to emerge. Indeed, behavioral and molecular changes have only been reported in PINK1 -/- rats as early as 4 months of age [14–17], with further clear evidence of neurological abnormalities and atypical behavior patterns by year one. Our studies suggest that genetic factors may begin to significantly affect neural function with only slight alterations in motor behavior in affected populations well before clinical signs begin to emerge, thus highlighting novel opportunities for identifying preclinical risk factors and developing early intervention strategies.
Behavior
In these studies, we looked at the motor and cognitive effects of the PINK1 -/- genotype during early adulthood between postnatal weeks 12 and 13. Targeted motor behavior testing through the tapered balance beam and rotarod revealed no evidence of motor dysfunction in PINK1 -/- rats. On the contrary, WT rats showed more foot faults on the thinnest portion of the balance beam. This result lies in contrast to similar studies that showed that young parkin-deficient mice commit more foot faults than WT animals during the beam walk task [39]. More importantly, data from PINK1 -/- rats shows that older animals (8 months) traverse the beam slower than WT [15], or (at 4 months) commit more hindlimb foot faults on a modified inclined beam [14]. Our data do not align with these prior studies, although a direct comparison between our data and others may not be useful considering a 1-month age difference is a significant amount of time for rats, developmentally [52]. Moreover, the difference we observed in beam walking performance between genotypes falls in line with the variability in motor behaviors that exist across studies and PD models at different ages.
For instance, in the case of the balance beam task, most PD rodent models, including rats deficient for the DJ1 protein, 6-OHDA-lesioned rats, and rotenone-exposed rats show either longer beam traversal times or a have a higher frequency of foot faults [53–55]. This trend in balance beam data lies in contrast to that of transgenic rats overexpressing LRRK2 that, at 3, 6, and 12 months are no different than non-transgenic controls for all beam walking parameters [56]. More broadly, 5-6 month old parkin-deficient mice have been shown to travel longer distances than WT animals during open field testing across trials [21]; although, and in a separate study, at 16 months (but not 4 or 10 months), Gispert et al. (2009) reported the opposite result showing PINK1 -/- mice travel significantly shorter distances than WT controls. Similar to 16-month-old PINK1 -/- mice, Dave et al. reported that at 4, 6, and 8 months, PINK1 -/- rats traveled shorter distances and had fewer instances of rearing than WT animals during open field testing. These results are similar to our Barnes maze probe trial data that showed that PINK1 -/- animals moved around the maze slower and traveled a marginally longer distance (p = 0.09) before making first contact with the goal box hole. Together, these mixed findings suggest that factors that interact with, or go beyond genotype affect motor coordination in PINK1 -/- and other PD models. Although potentially costly, a direct comparison of multiple PD models at specific developmental time points would add insight into the source of motor behavior variability that appears to exist across studies.
During cognitive testing, the novel object recognition task revealed that both WT and PINK1 -/- (although marginally for PINK1 -/- animals) almost equally spent more time, beyond chance, with the novel object compared to the familiar object. Similarly, PINK1 -/- animals also showed no indication of spatial memory impairment since Barnes maze testing yielded no behavioral differences between WT and PINK1 -/- rats. In human carriers of PINK1 mutations, there is little data detailing whether early psychiatric and cognitive symptoms precede PD diagnoses. In one twin case report, two brothers with nonsense PINK1 mutations presented with cognitive and psychiatric impairments years before their diagnoses of early onset Parkinsonism [12]. Conversely, in another study, despite indications of gray matter deterioration across several frontal lobe areas and limbic structures, human PINK1 mutation carriers exhibiting pre-clinical motor signs of PD, showed no signs of impaired cognitive function when compared to healthy age-matched controls [57]. In addition to our results, those of Reetz et al. mirror most preclinical mutant animal model studies wherein tests of cognitive function that lack a social component generally reveal null effects when rodents are tested at 4 months and earlier [18–21, 59]. Moreover, regardless of age, any cognitive sign is rarely reported without robust concurrent motor deficits [19–21, 59] further obviating that behavioral alterations in motor function are likely better predictors of later PD onset than evidence of cognitive impairment.
BOLD imaging in response to almond odor
Selective hyposmia is commonly found in PD patients long before the appearance of any motor symptoms [60, 61]. Different laboratories have identified similar deficits in the ability to recognize odors including banana, licorice, and mint [62, 63]. Over a two-year prospective study, Ponsen et al. followed asymptomatic patients with “idiopathic” olfactory dysfunction for risk of developing PD [26]. Using 123IB-CIT binding as a biomarker of DA function they found that 10% of the cohort developed symptomatic PD that correlated with reduced DAT binding. Similar studies combining molecular imaging and assessment of olfactory discrimination have led researchers to associate hyposmia with the pathology of PD that precedes motor impairment [64, 65]. Bohnen and coworkers have combined tests of selective hyposmia with imaging of extrastriatal binding of 11CB-CIT and attributed the olfactory dysfunction to a reduction of hippocampal DA innervation underscoring the interrelationship between olfactory processing, PD, cognition and memory [66]. In one of the only BOLD fMRI studies published on PD and olfaction, it was reported that the hippocampus and amygdala showed a reduction in odor-induced activation as compared to controls [67].
In an earlier olfaction study, Kulkarni et al. (2012) showed that “odor naïve” rats exposed to almond odor for the first time exhibit activation across multiple neural circuits involved in emotion and memory in addition to the primary olfactory system [42]. The WT and PINK1 -/- rats used in this study similarly had no prior exposure to the smell of almond, and when challenged with this odor, showed equal levels of sensitivity within the primary olfactory system. In particular, PINK1 -/- rats showed greater activity in response to almond odor in the anterior cingulate, prelimbic cortex, extended amygdala, and nucleus accumbens; areas typically associated with emotion [68–70]. Interestingly, similar to a prior imaging study using PD patients [71], several areas of the thalamus showed preferential activation and deactivation in response to almond odor in PINK1 -/- versus WT animals. The negative BOLD changes were confined to the midline reuniens, paraventricular, and central thalamic nuclei; all of which have connections to the hippocampus and presage putative disruption of cognition and behavior.
Hummel et al., reported differences in activation patterns between PD patients and healthy controls, with PD patients exhibiting greater levels of deactivation in the amygdala and thalamus in response to odors that carry a positive valence. These results fall in partial alignment with our BOLD almond data that show greater levels of negative BOLD from a few thalamic areas in PINK1 -/- animals. In contrast, we also showed a greater positive BOLD response in PINK1 -/- animals in most of the thalamic and amygdalar regions where we observed differences. Taken together, regardless of direction, given the areas affected, as discussed above, these changes may represent alterations in emotion regulation; however, the differences between studies may also be a function of the novelty of the almond odor stimulus, as we also observed BOLD differences in the anterior cingulate, the extended amygdala, and across a number of thalamic areas that are connected to the anterior insula.
Both the anterior cingulate and the anterior insula are integral regions of the salience network, and functional imaging data from humans shows that both regions are highly sensitive to novelty and reward stimuli that result in putative fluctuations in dopamine (DA) neurotransmission [72]. Interestingly, both heterozygous and homozygous human carriers of the PINK1 mutation show signs of reduced striatal DA uptake alongside subtle evidence of olfactory impairment [73]. Given the role that DA plays in PD, it is possible that the changes we observed in the anterior cingulate and areas connected to the anterior insula in PINK1 -/- animals are related to fluctuations in DA that precede PD motor symptoms. Future studies making use of magnetic resonance spectroscopy may shed light on whether BOLD signal changes in PINK1 -/- rats are related to alterations in DA signaling as well as subsequent motor impairment.
Diffusion weighted imaging
In the present study, we used DWI to identify subtle differences in brain microarchitecture between WT and PINK1 -/- rats. DWI provided some evidence of early changes in areas associated with olfaction (e.g. piriform cortex, olfactory tubercles, tenia tecta, endopiriform nucleus), memory (lateral septum, diagonal band of Broca, CA3 and CA1 hippocampus), and the basal ganglia/midbrain dopaminergic system (e.g. nucleus accumbens, olfactory tubercles, ventral pallidum, globus pallidus, and striatum). Again, similar to our BOLD signaling data, differences between WT and PINK1 -/- were well represented across various subregions of the thalamus (i.e., central medial, ventral anterior, medial dorsal and parafascicular). The changes in activation within the olfactory cortex, together with hippocampal circuitry, is notable because they are suggestive of alterations in gray matter microarchitecture involved in the integration of olfactory stimuli with learning and memory. The loss of olfactory discrimination as a biomarker of early PD may not be at the level of the bulbs but may be due to dysregulation in association pathways. The putative changes in gray matter microarchitecture in the basal ganglia have obvious implications in the early presymptomatic stages of PD.
Prominent in both the FA and RD measures was the hypothalamus. Beginning with the most rostral basal areas of the medial and lateral preoptic nuclei and extending caudally to include anterior, paraventricular, dorsal medial, and ventral medial hypothalamus, and ending in the posterior hypothalamus. The changes in the hypothalamus may reflect early dysregulation in the autonomic nervous system that is often reported in PD [74].
One of the more interesting observations with DWI was the highly localized changes in ADC values within the deep cerebellar nuclei e.g., lateral, fastigial, and interposed. These nuclei represent the only efferent connections from the cerebellum. The cerebellum has reciprocal interactions with much of the brain [75], and related to the changes we observed in FA and RD values, as well as the gray matter changes across the olfactory system, excitatory outputs from the cerebellar nuclei impact the motor and somatosensory cortices [76], thalamus [77–79], hypothalamus, amygdala, hippocampus [80] and basal ganglia [81–83].
There is a growing body of literature implicating the cerebellum in the pathogenesis of PD with hyperconnectivity and increased metabolism working as compensatory mechanisms for lost function (reviews [84–86]). Indeed, in a PET study that measured performance on a motor learning task, early PD patients had to activate approximately 4 times as much brain tissue to achieve a level of proficiency that was similar to healthy controls [87]. Interestingly, only the PD patients, and not the healthy controls, had to recruit portions of the cerebellum during these motor tasks. Relatedly, compared to healthy controls, functional imaging data indicate that PD patients exhibit more activity in the cerebellum when preforming learned automatic movement patterns [88]. Combined with the absence of any overt motor abnormalities in the PINK1 -/- animals, differences in ADC in the deep cerebellar nuclei may represent evidence of early compensatory mechanisms that may be similar to those suggested to be present during the early stages of PD in human patients.
Metabolic/mitochondrial measures
While the BOLD imaging and DWI pointed to a constellation of areas that may be involved the early pathogenesis of PD in the PINK1 -/- model, we chose to focus our molecular measures on the forebrain, basal ganglia, and the deep cerebellar nuclei. Glutathione (GSH) is an important antioxidant in the brain and plays a critical role in the scavenging excessive reactive oxygen species (ROS) production. Postmortem clinical and preclinical evidence indicates GSH is abnormally low in the brains of PD patients, and that such loss of GSH is associated with increased neurodegeneration and tissue damage [89]. Moreover, targeting GSH utilizing N-acetylcysteine (NAC) has been shown to increase brain GSH levels, improve mitochondrial function, and decrease brain edema in PD patients. Our studies indicate that decreased levels of GSH across different brain regions in PINK1 -/- animals occurs with a concomitant increase in oxidative damage (Fig. 4). Furthermore, such decreased GSH levels were also accompanied by a decrease in the enzyme activity of superoxide dismutase (SOD); a major antioxidant enzyme related to PD pathology [90, 91]. Such elevated levels of oxidative damage and decreased levels of antioxidant are involved with induction of inflammation as indicated by elevations in glial fibrillary activity protein (GFAP; a marker for the microglial activation) that we observed from different brain regions isolated in the PINK1 -/- animals (Supplementary Figure 2). Such markers of inflammation are particularly relevant to the PINK1 -/- rat, specifically within the substantia nigra, as previous studies have demonstrated that this animal model shows a progressive loss of DA neurons from 4 to 9 months in this same region [14, 17]. These data speak towards the translatability of the PINK1 rat model, since, unlike PD patients who show evidence of nigrostriatal decline prior to motor symptoms [92, 93], some animal models of PD (including some PINK1 KO mouse models) lack important indications of nigrostriatal DA neuronal loss over the course of development [94–96].
Mitochondria play a pivotal role in cerebral metabolism, the regulation of oxidative stress, and neuronal excitotoxicity [97–99], with failed mitochondria resulting in apoptotic neuronal death occurring in PD and several other neurodegenerative disorders. Cytochrome c oxidase is the fourth complex of the electron transport chain located in the mitochondrial membrane. It provides energy to the cell by coupling the electron transport chain to the cytochrome c complex via the process of oxidative phosphorylation. It is the final enzymatic complex of the electron chain and a direct assay of intact energy metabolism in mitochondria. We observed significant decreases in the levels of cytochrome C oxidase (both at the qRTPCR, as well as at the protein levels) across various brain regions highlighted in the MRI studies particularly in the striatum and deep cerebellar nuclei. Decreased cytochrome c levels, along with corresponding decreases in ATP that we observed are consistent with previous studies identifying these changes as biological markers for PD [100–104]. Hence, the molecular and metabolic changes that we recorded provide evidence for the validity of the MRI methodologies used in this study as a means of early detection of neurodegeneration in brain regions that are likely involved in the neuropathology of PD.
Summary
Here we report the first extensive characterization of the PINK1 -/- rat model at 3 months of age. PINK1 -/- rats showed distinct differences in brain neurobiology from WT rats prior to any robust motor and non-motor behavioral alterations. This presymptomatic period in early adulthood was characterized by alterations in indices of anisotropy across specific brain areas that reflect putative changes in gray matter microarchitecture. The changes we observed extended from the rostral, medial basal forebrain to the caudal brainstem and cerebellum, and involved components of the basal ganglia, olfactory system, hypothalamus, and deep cerebellar nuclei. Molecular analyses revealed signs of elevated oxidative stress in brain samples collected from these regions. Together, these data provide further detail for the characterization of the PINK1 -/- rat model, and potentially shed light on early indications and potential therapeutic targets for the treatment of familial PD.
CONFLICT OF INTEREST
C. F. Ferris has a financial interest in Animal Imaging Research, the company that produces the awake rat imaging system.
Footnotes
ACKNOWLEDGMENTS
We owe a debt of gratitude to Lara Reid, Product Manager and her staff at Horizon Discovery for their generosity in supply and coordinating the timely delivery of the PINK1 -/- and WT rats. Also, Mark Nedelman, President of Ekam Imaging for helping fund these studies.