
Abstract
Background:
Substantial progress has been made in the discovery of blood biomarkers for Parkinson’s disease (PD), a progressive neurodegenerative disease that affects more than 4 million worldwide. Olfactory dysfunction and dopamine deficits usually precede motor symptoms years before the onset of PD. A readily accessible biomarker useful for identifying patients at risk of PD is expected to accelerate clinical trials.
Objective:
To evaluate previously identified PD blood RNA biomarkers in a cohort of asymptomatic individuals at risk of PD.
Methods:
Here we tested 16 previously identified PD RNA biomarkers using quantitative PCR assays in a total of 269 blood samples at baseline from hyposmic and normosmic participants enrolled in the Parkinson’s Associated Risk Syndrome study. Results: Expression levels of four biomarkers, SOD2, PKM2, ZNF134, and ZNF160 were negatively correlated with the total Unified Parkinson’s Disease Rating Scale, thus suggesting these biomarkers may be useful to stratify patients prior to the onset of motor symptoms. Levels of SOD2 were upregulated in hyposmic males compared to females, whereas levels of PKM2 were upregulated in hyposmic males compared to normosmic males and hyposmic females. Further, levels of SOD2 were upregulated in males with abnormal dopamine transporter (DAT) scans compared to females with abnormal DAT scans.
Conclusions:
These results suggest that some of these biomarkers may be useful for stratification of individuals at risk for PD and that there may be sex differences in the expression of some biomarkers. Future studies in larger longitudinal studies will be key to assessing the validity of these findings.
INTRODUCTION
Parkinson’s disease (PD) is a progressive neurodegenerative disease characterized by the loss of dopaminergic neurons in the substantia nigra pars compacta leading to motor symptoms, which often manifest late in the disease. The gold standard of PD diagnosis is the assessment of motor symptoms, including tremor at rest, bradykinesia and rigidity. Unfortunately, there are no fully validated diagnostic tools for PD that would allow neurologist to identify PD patients before the onset of motor symptoms.
Several molecular signatures in blood have shown promise for detecting PD patients at early stages of the disease. Among the most promising findings is the replication of RNA biomarkers in samples obtained from multiple independent clinical cohorts. For example, we identified a molecular signature comprising 13 splice variants including FAXDC2 (C5ORF4), COPZ1, MACF1, WLS, PRG3, ZNF160, EFTUD2, MAP4K1, MPP1, PKM2, SLC14A1-s, SLC14A1-l and ZNF134 that was useful to distinguish PD patients from healthy and atypical parkinsonian disorders (APD) patients [1]. A subset of these markers including FAXDC2 (C5ORF4), COPZ1, MACF1, WLS, PRG3, ZNF160 and EFTUD2, was replicated in a second independent study that had PD patients and healthy controls, but no APD patients [2]. Network-based approaches have been useful in identifying several other RNA biomarkers including HNF4A, PTBP1, SOD2, APP, PTPN1 and NAMPT that could be useful for identifying PD patients early during the course of the disease [3–7] reviewed in [8].
Early detection of PD, especially at the pre-motor phase could accelerate the development of therapeutic strategies. In this context, loss of dopaminergic integrity and impaired olfaction are common prodromal features observed in PD patients. Approximately 85% of PD patients have hyposmia, which develops early in the disease independently from motor symptoms. A two-tiered biomarker assessment comprising a smelling test and dopamine transporter (DAT) imaging has been proposed as a viable diagnostic tool to identify prodromal PD patients [9]. In this study, we tested the hypothesis that previously identified candidate blood RNA markers might be useful to predict individuals at risk for PD when combined with assessment of hyposmia and/or with dopamine deficits in the Parkinsons Associated Risk Syndrome (PARS) Study, the largest cohort of asymptomatic individuals at risk of PD.
MATERIAL AND METHODS
Study participants
The Parkinson’s Associated Risk Study (PARS) is an ongoing longitudinal study coordinated at the Institute for Neurodegenerative Disorders (New Haven, CT) and conducted at 20 clinical sites in the United States. The purpose of PARS is to study prodromal features of PD by screening participants for impaired olfaction and dopamine transporter (DAT) imaging. All protocols were approved by the Department of Defense and Rosalind Franklin University Institutional Review Boards. Recruitment and clinical assessments were carried out at 20 clinics with movement disorders specialists in the United States. Regional mailing, email, and posts to several PD foundation websites were used to identify individuals with or without a family history of PD. Valid screening and background forms were received by the closing date of February 26, 2010. Potential subjects who returned interest forms received a study packet by mail containing a written informed consent form, a 40-item University of Pennsylvania Smell Identification Test (UPSIT), and other questionnaires regarding demographics and standard measures of non-motor symptoms for PD. Details about participant consent and recruitment can be found elsewhere in [10]. There were two groups of study participants. One group included individuals without a diagnosis of PD or other neurodegenerative diseases and the second group of subjects was comprised of first-degree relatives of patients with a diagnosis of PD. Inclusion criteria were: study participants had to be over 50 years of age (or within 10 years of age of onset of an affected relative diagnosed with PD), no known reason for abnormal olfaction (eg, nasal trauma, sinus infection or related surgery). Exclusion criteria included: history of PD or other neurodegenerative disorder, history of dementia or Mini-Mental Examination score <27, and evidence of parkinsonism based on the clinical assessment as determined by the investigator. Non-motor assessments were mailed to participants for self-administration. Olfaction was assessed with the 40-item UPSIT. In this regard, participants with UPSIT scores in the 15th percentile or lower based on age and sex were classified as hyposmic. Constipation was defined as less than 1 bowel movement per day. Motor symptoms were assessed using the Unified Parkinson’s Disease Rating Scale (UPDRS) [11]. For this study, we used the UPDRS total score (parts I-IV, questions 1–31). Sleep behavior disorder (RBD) was assessed via a questionnaire from participants who had input from a bed partner using a modified version of the validated RBD questionnaire [12]. Depression was assessed with the Center for Epidemiological Studies Depression Scale [13]. Specific details about clinical assessments of non-motor symptoms in PARS have been published elsewhere [10, 14]. A total of 10,139 returned valid screening and background forms by the closing date. From these 10,000 participants, 669 subjects were determined to have hyposmia and 303 underwent DAT imaging and biological fluids collection. DAT imaging was performed using [123I]-fluoro-propyl-beta-carbomethoxy-3beta-(4-iodophenyl) tropane ([123I]ß-CIT) single-photon emission computed tomography (SPECT). Subjects received an intravenous administration of 6 mCi [123I]ß-CIT. The striatal binding ratio was determined from SPECT images. The imaging outcome was adjusted by determining the percent of age expected [123I]ß-CIT binding in the lowest putamen compared to age-matched controls. For the purpose of this study, normal DAT scans were defined as >80% age-expected lowest putamen [123I]ß-CIT uptake and individuals with <80% age-expected lowest putamen [123I]ß-CIT uptake were considered with DAT deficits. The demographic and clinical characteristics of the subjects from PARS used in this study are presented in Table 1.
Demographic and clinical characteristics of PARS participants
Demographic and clinical features of hyposmic subjects and controls nested in the PARS study. Abbreviations: CI = 95% confidence interval; MMSE = Mini Mental State Examination; MoCA = Montreal Cognitive Assessment; UPDRS = Unified Parkinson’s Disease Rating Scale; SD = standard deviation; y = years. aBased on a Student t-test. bBased on chi-square test (X2).
Blood sample collection and handling
Baseline whole blood samples were collected at the time of clinical and imaging evaluations [15]. Blood was collected in PAXgene blood RNA tubes following the study protocol. Briefly, PAXgene tubes containing blood were inverted gently 8-10 times to mix the samples. Tubes were placed upright and incubated for 24 hrs at room temperature before freezing. After the 24 hrs incubation period, PAXgene blood tubes were stored at –80°F until shipment. Blinded RNA frozen samples (n = 269) were shipped in dry ice to Rosalind Franklin University for the studies described herein.
Quantitative polymerase chain reaction assays
Samples with RNA integrity values >7.0 and absorbance 260/280 between 1.2 and 3.0 were used in this study. One microgram of RNA was reverse transcribed into cDNA using a mix of random hexamer primers (High Capacity cDNA Synthesis Kit, Life Technologies, USA). Quantitative polymerase chain reaction assays (qPCR) were performed using the DNA engine Opticon 2 Analyzer (Bio-Rad Life Sciences, Hercules, CA, USA). Each 25 microliters reaction contained Power SYBR Green (Life Technologies, USA) and primers at a concentration of 5μM. Quantitative PCR assays were performed on all of the 269 baseline samples using 16 markers and 2 reference genes for normalization (Table 2). Samples were run in triplicates and non-template control was used in all experiments. The geometric mean of the two reference genes, GAPDH and PGK1, were used to normalize for input RNA. Amplification conditions and primer sequences have been published elsewhere in [1, 3–7].
RNA biomarkers tested in PARS
Statistical analysis
Statistical analysis was performed using STATISTICA 12 (StatSoft, OK, USA) and GraphPad Prism version 5 (GraphPad Software, Inc., CA, USA). A Student-t-test (unpaired, two tailed) was used to assess the differences between two groups and a chi-square test was used to analyze categorical data. Statistical analysis of baseline samples was performed in three different ways. A two-tailed t-test was used to analyze normosmic compared to hyposmic individuals. After adjusting for multiple comparisons using a Bonferroni correction, a p-value of 0.003 or less was regarded significant. As a second step, we compared patients with a normal DAT scan (>80% age-expected lowest putamen [123I]ß-CIT uptake) to participants with abnormal DAT scan (<80% age-expected lowest putamen [123I]ß-CIT uptake). We also performed the analysis by dividing the samples in 3 groups: normosmic with normal DAT scan (>80%), hyposmic with normal DAT scan (>80%) and hyposmic with abnormal DAT scan (<80%). All the analyses were repeated using multiple regression models adjusting by age. We also performed comparisons by sex between groups: normosmic vs hyposmic, and normal DAT vs abnormal DAT scans. Pearson correlation analysis was performed for age, sex, and clinical variables. Lastly, in order to find a biomarker signature, we performed a forward step-wise linear discriminant analysis as demonstrated previously [1, 7].
RESULTS
Demographic and clinical characteristics of the PARS study participants used in this study are presented in Table 1. Detailed description of the full PARS cohort has been reported elsewhere in [9, 14]. There were no significant differences in age, sex, and clinical features, including Hoehn and Yahr stage, Unified Parkinson’s Disease Rating Scale (UPDRS), and Montreal Cognitive Assessment (MoCA) in the participants whose samples were used in this study. Subjects with hyposmia had a slightly but significantly lower Mini Mental State Examination (MMSE) scores compared to normosmic individuals (Table 1).
We tested 16 biomarkers from our previous studies in 269 baseline samples from PARS (Table 2). Correlation analysis of biomarkers showed statistically significant correlations with the UPDRS and sex. Expression levels of 4 of the 16 biomarkers, SOD2, PKM2, ZNF134, and ZNF160 were negatively correlated with UPDRS (Fig. 1). Further, levels of SOD2 (r = 0.15, p = 0.01) and ZNF134 (r = –0.21, p = 0.0005) were significantly correlated with sex. No significant differences were observed for the remaining 12 biomarkers tested.
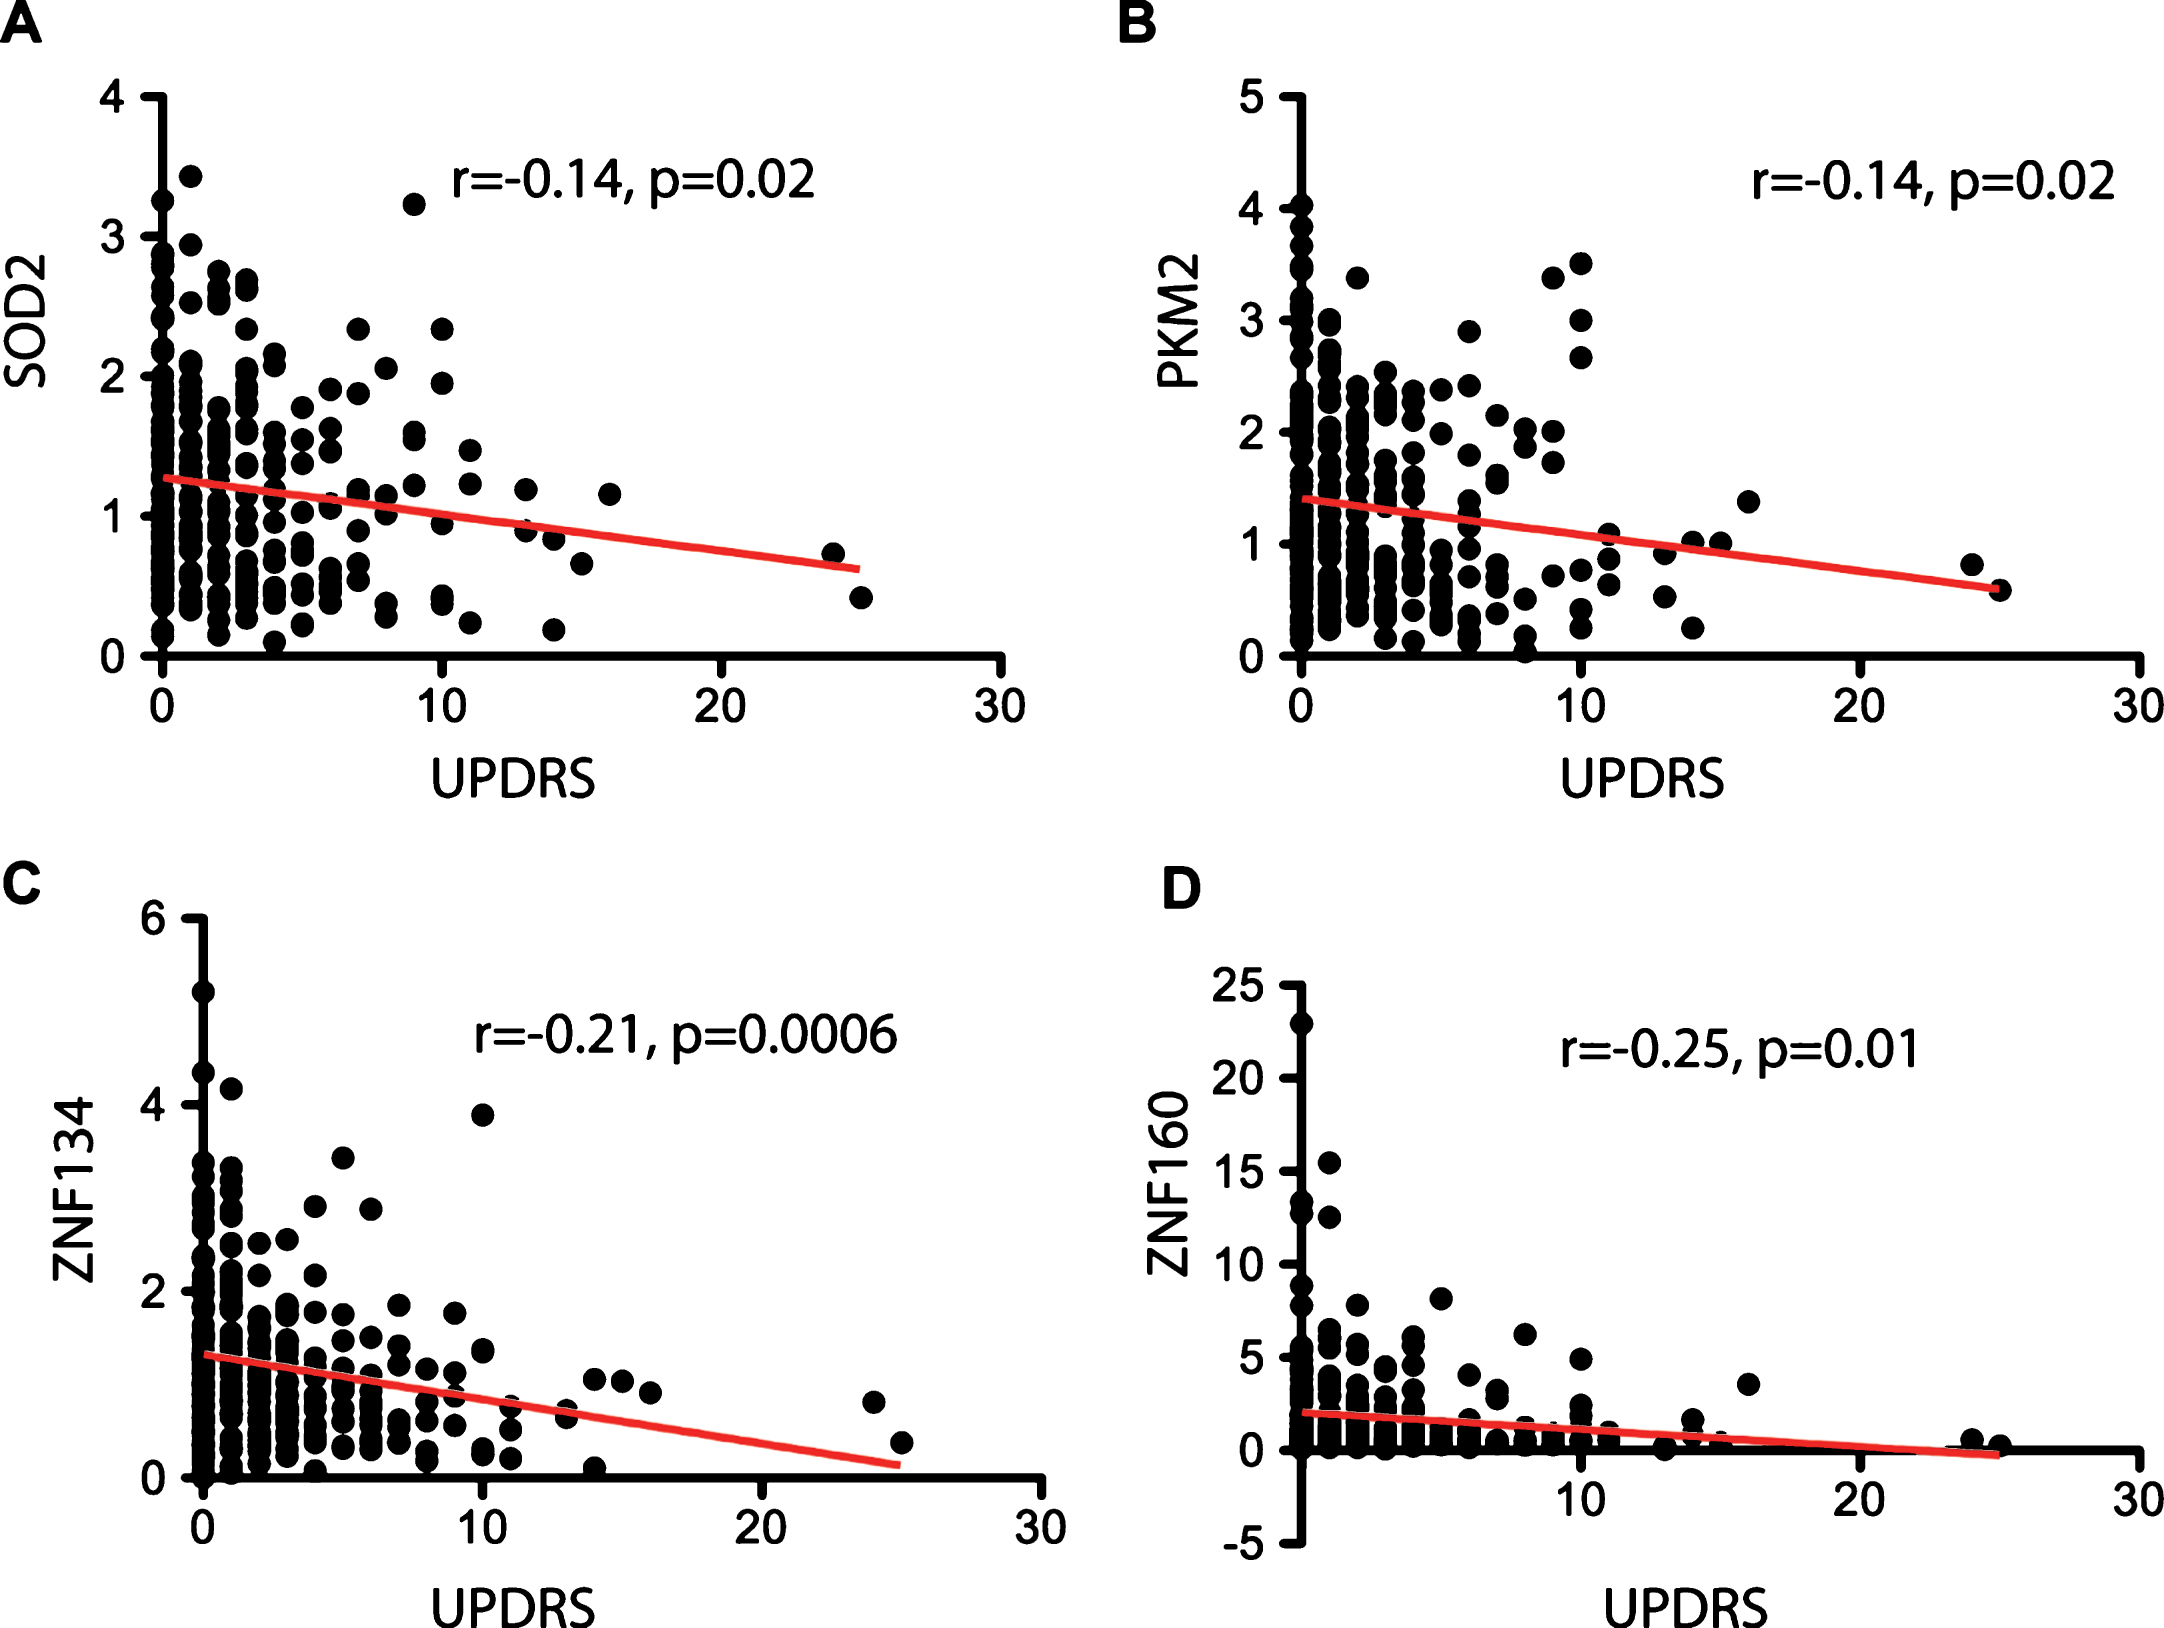
Correlation analysis of blood biomarkers with clinical characteristics. Pearson correlation (r) and its associated p-value are shown for the four biomarkers that reached significance with the total Unified Parkinson’s Disease Rating Scale (UPDRS). A. Correlation analysis between expression levels of SOD2 and the total UPDRS. B. Correlation analysis between expression levels of PKM2 and total UPDRS. C. Correlation analysis between expression levels of ZNF134 and total UPDRS. D. Correlation analysis between expression levels of ZNF160 and total UPDRS. Pearson correlation was calculated using all the samples analyzed (n = 269). Linear regression line is depicted in red. A p-value <0.05 was considered significant.
We next investigated whether the expression of previously identified RNA biomarkers was useful to distinguish hyposmic from normosmic subjects. After adjusting for multiple comparisons none of the 16 biomarkers reached statistical significance. Given the significant correlations with sex, we then divided hyposmic and normosmic groups by sex. Two biomarkers, SOD2 and PKM2 showed significant differences among the groups compared. Specifically, levels of SOD2 were upregulated in hyposmic males compared to hyposmic females (Fig. 2A). Similarly, levels of PKM2 were upregulated in hyposmic males compared to normosmic males and hyposmic females (Fig. 2B). This significance was maintained in multiple regression models adjusting by age.
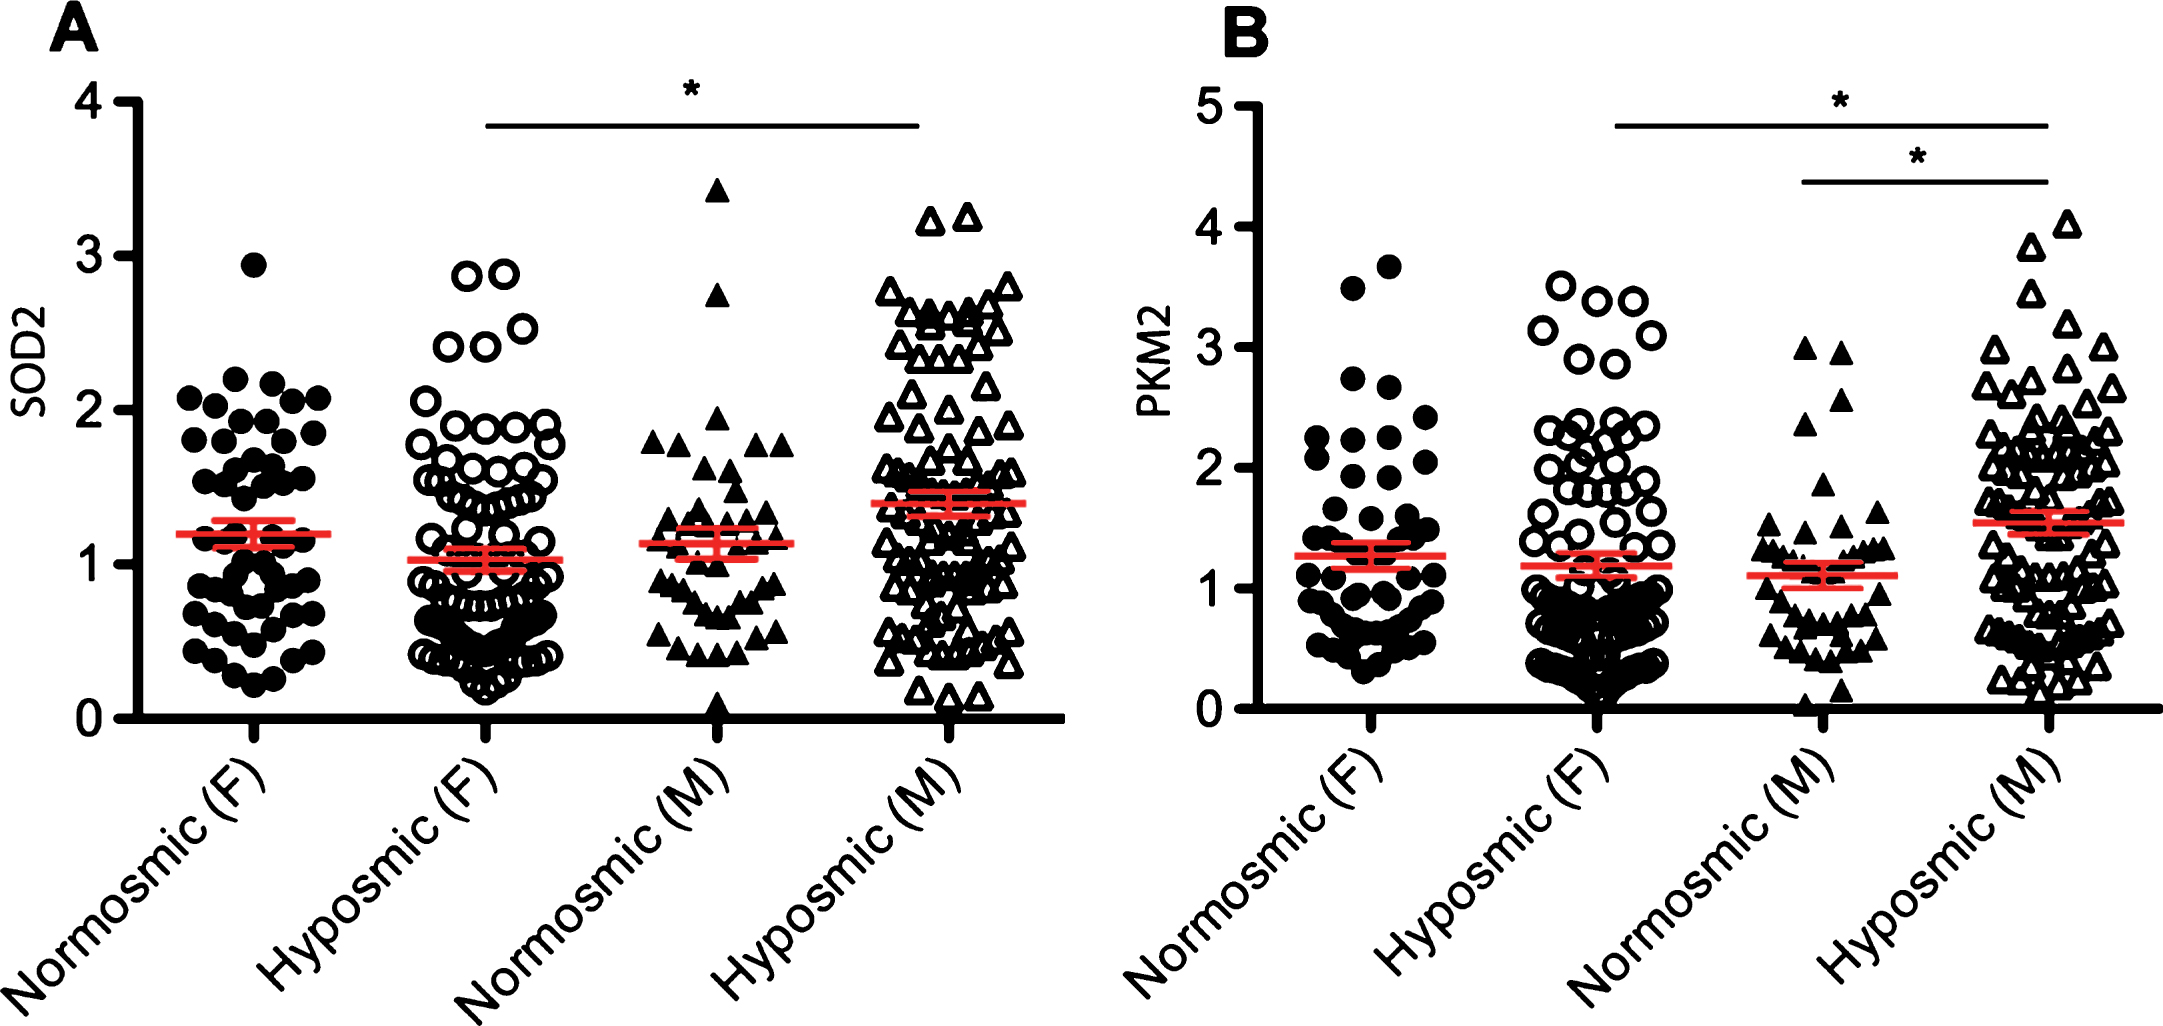
Relative expression levels of RNA biomarkers vary by sex. A. Sex-specific differences in the levels of SOD2 in blood of normosmic (n total = 97; F = 54, M = 43) compared to hyposmic subjects (n total = 172; F = 83, M = 89). B. Sex-specific differences in the expression of PKM2 in blood of normosmic compared to hyposmic subjects. The geometric mean of two reference genes, GAPDH and PGK1, were used to normalize for input RNA. Error bars in red represent standard error. A p-value of 0.003 or less represented by an asterisk (*) was considered significant based on a multiple regression analysis. F is the number of females, M is the number of males and n is the total number of subjects.
Imaging techniques to detect the loss of dopaminergic integrity have shown promise for identifying early stage PD patients. Although a definite cutoff value for what is considered abnormal DAT binding in prodromal PD has not yet been defined, we selected a value of 80% or less as previously used to minimize misclassification [9]. Comparison of individuals with normal DAT scans to participants with abnormal DAT scans did not reach significance in any of the biomarkers tested. However, the expression of one biomarker, ZNF160, showed nominal significance (p = 0.02) but this significance was not maintained after adjusting for multiple comparisons (Fig. 3A). We also made comparisons by sex between these groups. Levels of SOD2 were upregulated in males with abnormal DAT scans compared to females with abnormal DAT scans (Fig. 3B). This significance was maintained using multiple regression models adjusting by age.
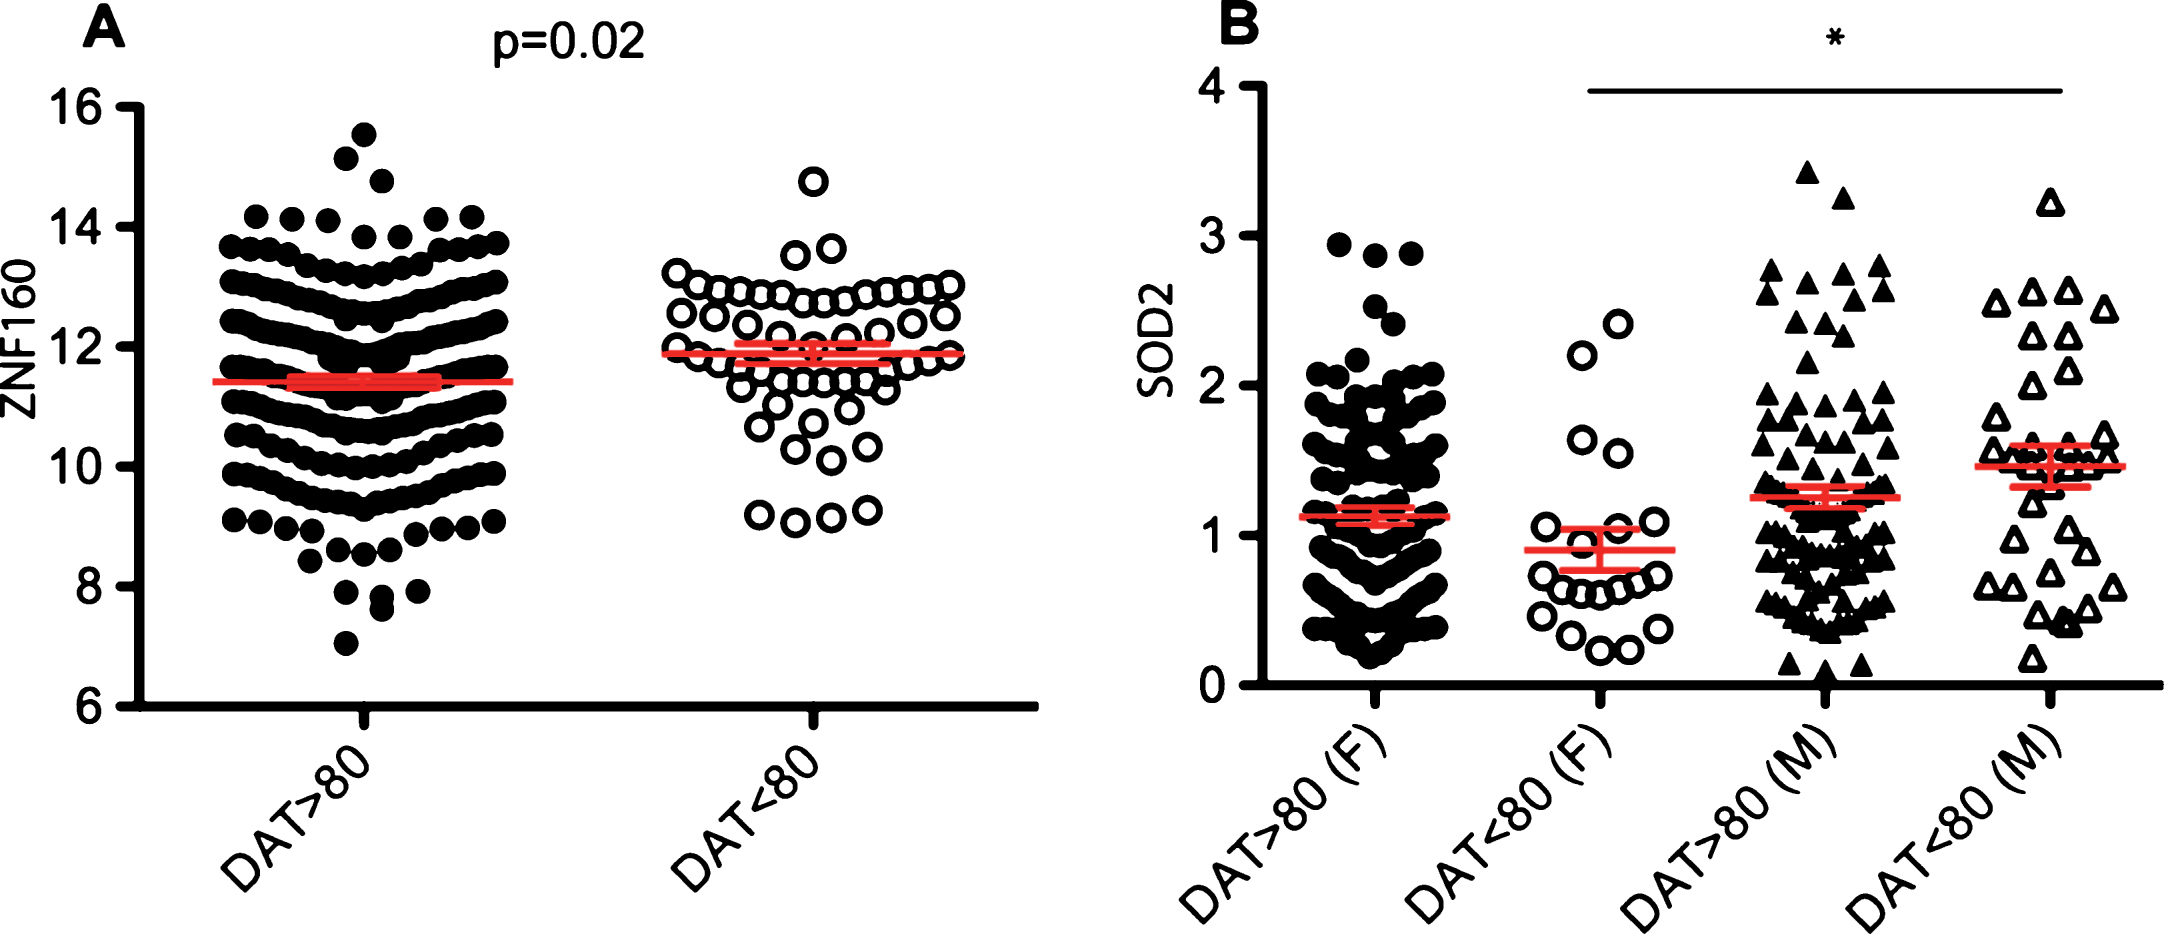
Relative expression of RNA biomarkers according to sex and DAT imaging. A. Relative expression levels of ZNF160 in subjects with abnormal DAT scans (n = 53) compared to normal DAT scans (n = 216). B. Relative expression levels of SOD2 in males and females with abnormal (n = 53; M = 33, F = 20) and normal DAT scans (n = 216; M = 99, F = 117). The geometric mean of two reference genes, GAPDH and PGK1, were used to normalize for input RNA. Error bars in red represent standard error. A p-value of 0.003 or less represented by an asterisk (*) was considered significant. F is the number of females, M is the number of males and n is the total number of subjects.
We also performed the analysis by dividing the samples in 3 groups: normosmic with no DAT deficit, hyposmic with no DAT deficit and hyposmic with a DAT deficit. There were not significant differences in any of the 16 biomarkers among the 3 groups.
In order to determine whether a group of biomarkers could be helpful to distinguish between the different categories (normosmic vs hyposmic, or DAT deficits), we performed a forward step-wise discriminant analysis adjusting for confounding variables age and sex as demonstrated previously [1, 7]. All of the biomarkers were eliminated from the equation thus demonstrating that none of them were capable to distinguish between groups.
DISCUSSION
Olfactory dysfunction usually precedes motor symptoms years before the onset of PD. Imaging studies to detect the loss of dopaminergic integrity using [123] ß-CIT SPECT and the smell test using UPSIT have been proposed as a sequential biomarker strategy to identify prodromal PD patients [9]. The PARS study expanded this approach to identify and build a cohort of participants at high risk of PD. Here we tested the hypothesis that previously identified RNA biomarkers might be useful for identifying individuals with hyposmia and/or DAT deficits, both characteristics of prodromal PD.
Analysis of hyposmic compared to normosmic subjects showed no significant differences among any of the biomarkers. However, sex comparisons between hyposmic and normosmic subjects yielded significant results. For example, levels of SOD2 and PKM2 were upregulated in hyposmic males compared to hyposmic females. Although preliminary, these findings suggest that expression levels of SOD2 and PKM2 may be useful to identify hyposmic males and ultimately, males at risk for PD. Upregulation of both SOD2 and PKM2 have been reported in blood of medicated early stage PD patients compared to healthy controls in our previous studies [1, 4], although sex differences were not observed. The present study is the first study testing the expression of these markers in asymptomatic subjects at risk for PD. Thus, this study suggests that expression of SOD2 and PKM2 may change from prodromal PD to the onset of motor symptoms. Interestingly, in a study of newly diagnosed drug-naive PD patients these markers were not differentially expressed [15].
Sex differences have been recently recognized as important factors in the susceptibility and development of PD [16]. Sex-specific genetic factors and hormones have been shown to contribute to biological and phenotypic differences in patients with PD [16]. The incidence of PD is commonly higher in men than in women according to studies based on death rates and disease prevalence [17]. However, these studies do not accurately reflect the incidence of PD because of the high misdiagnosis rate between PD and APD [18]. Furthermore, studies on disease prevalence are subject to sex differences in survival and healthcare access [18]. An additional factor that may contribute to the results from the PARS study is the fact that women outperform men on test of odor detection, identification, discrimination, and memory [19]. Sex differences have also been noted in the response of patients to levodopa treatment [20]. In the context of biomarker studies, sex differences have been reported in several studies. For example, reduced plasma levels of SNCA have been reported in men but not in women [21]. Likewise, plasma levels of SNCA associated with cognitive impairment, hallucinations and sleep disorders only in men [21]. Additionally, sex differences were observed in levels of LRRK2 and DJ-1 in urine exosomes [22]. Thus, sex differences may have important implications in the outcome of biomarker studies. Understanding sex related differences in PD is highly complex and therefore, the results presented in this study needs to be taken with caution and considered preliminary.
In addition, four RNA markers including SOD2, PKM2, ZNF134, and ZNF160 correlated negatively with UPDRS, a disease severity scale for PD. Although correlation values were low, these biomarkers may be useful to stratify patients according to the disease stage. Biomarkers of disease progression could greatly impact the outcome of clinical trials testing potential drugs and neuroprotective agents. In this regard, we previously identified two RNA biomarkers, HNF4A and PTBP1 that showed a longitudinally dynamic expression pattern in PD patients [6]. The findings reported here on SOD2, PKM2, ZNF134, and ZNF160 are preliminary and need to be replicated in future longitudinal studies.
Loss of dopaminergic neuronal integrity preceding motor symptoms has been documented in imaging studies in PD [9, 24]. Several studies in PARS have demonstrated significant clinical differences between hyposmic subjects with abnormal DAT scans who do not meet the criteria for a PD diagnosis and normosmic individuals [9, 14]. In this study, subjects with DAT deficits appeared to have higher levels of ZNF160 compared to subjects with normal DAT scans, although this result was not significant after correction for multiple comparisons. Nonetheless, this trend in expression of ZNF160 is consistent with our previous studies in which ZNF160 was upregulated in PD patients compared to healthy controls and atypical parkinsonian disorders [1, 2]. There were also sex differences in biomarker expression between subjects with normal and abnormal DAT scans. For example, levels of SOD2 were upregulated in males with abnormal DAT scans compared to females with abnormal DAT scans. Of note, upregulation of SOD2 has been documented in our previous studies involving PD patients compared to healthy controls and thus this study provides further support of the utility of this biomarker for PD diagnostics [2, 4].
Collectively, here we identified sex related differences and correlations between the UPDRS scale and the expression levels of RNA biomarkers in a cohort of participants at high risk of PD. There are several aspects that should be taken in consideration when interpreting the results from this study. First, it has been noted that medication could impact the expression levels of RNA biomarkers [15] and only a few of these biomarkers have been replicated in samples from drug-naïve PD patients [15]. Secondly, hyposmia is not specific to PD, therefore some of the subjects with hyposmia may eventually develop neurodegenerative diseases other than PD. In addition, the PARS study relied on self-report assessments of non-motor symptoms and a at home testing of olfactory function, thus some misclassification in terms of risk factors and hyposmia status of subjects is possible. Of note, most of the findings presented in this study are based on correlation analyses, thus future studies in a larger and extensively characterized cohort of prodromal PD individuals will be needed to fully understand the predictive potential of these markers. Additionally, given the limited number of males and females in this study, future longitudinal studies in other well-characterized populations at high risk for PD, for example, in individuals with sleep disorders [25], and involving a larger sample size of males and females will be helpful to validate these results.
This study highlights the importance of testing biomarkers in several independent clinical cohorts, an important step for the translation of biomarkers into the clinical setting. Besides the RNA markers tested in this study, plasma APOA1 and EGF levels have been tested in PARS [26, 27]. Specifically, plasma APOA1 levels correlated with dopaminergic system integrity and EGF correlated with poorer visuospatial performance in asymptomatic individuals at high risk of PD in PARS [26, 27]. Despite this progress, none of these biomarkers possess the ideal characteristics of a robust biomarker to identify individuals at risk of PD. We expect that combination of clinical tests, brain imaging, protein, and RNA markers will be key to build a diagnostic model to better predict risk of PD.
CONFLICT OF INTEREST
The authors have no conflict of interest to report.
Footnotes
ACKNOWLEDGMENTS
We are grateful to the participants and clinicians who participated in the PARS study. This study was funded by the US Army Medical Research and Materiel Command under awards number W81XWH-09-0708 and W81XWH13-1-0025 to J.A.P. Opinions, conclusions, interpretations and recommendations are those of the authors and are not necessarily endorsed by the U.S. Army. The funding agency had no role in study design, data collection and analysis, decision to publish, or preparation of the manuscript.