
Abstract
Background:
Lipid biomarkers have potential neuroprotective effects in Parkinson’s disease (PD) and there is limited evidence in the field.
Objective:
This study aims to investigate the association between comprehensive blood lipid biomarkers and PD.
Methods:
A total of 205 PD patients and 102 non-PD subjects were included from Early Parkinson’s disease Longitudinal Singapore (PALS) cohort. We investigated 6 serum lipid biomarkers including total cholesterol (TC), triglyceride (TG), high-density lipoprotein cholesterol (HDL-C), apolipoprotein A1 (Apo A1), low-density lipoprotein cholesterol (LDL-C), and apolipoprotein B (Apo B). PD patients were further classified into mild cognitive impairment (MCI) and normal cognition (NC) subgroups. We conducted a cross-sectionals study to examine the association between lipids and PD and further explored the relationship between lipids and PD-MCI.
Results:
PD patients had significantly lower level of lipid panel including TC, TG, HDL-C, Apo A1, LDL-C, and Apo B (all p < 0.05). TC, TG, Apo A1, and Apo B levels were independent protective factors (p < 0.05) for PD in the logistic regression model. PD-MCI group had significantly higher mean TC, TG, and Apo A1 levels compared to PD-NC group. Higher TC, TG, and Apo A1 levels were independent risk factors (p < 0.05) for PD-MCI.
Conclusion:
We demonstrated that PD patients had significantly lower levels of lipid biomarkers while PD-MCI patients had higher levels of TC, TG, and Apo A1. TC, TG, and Apo A1 may be useful biomarkers for PD-MCI.
INTRODUCTION
Parkinson’s disease (PD) is the second most common neurodegenerative disorder with great clinical heterogeneity in symptoms and disease progression. The specific cause of PD is still unknown and there is no existing cure.
Current evidence reveal that lipids play a central role in multiple cellular pathways that contribute to PD etiology including oxidative stress, endosomal-lysosomal function, endoplasmic reticulum stress, and immune response [1]. Lipids are a diverse group of organic compounds that include triglyceride (TG), total cholesterol (TC), high-density lipoprotein cholesterol (HDL-C), and low-density lipoprotein cholesterol (LDL-C). TG is the principle dietary lipid and participates in energy metabolism [2]. TC mainly consists of HDL-C and LDL-C. Apolipoprotein A1 (Apo A1) is the major constituent of HDL-C and Apolipoprotein B (Apo B) is the prime structural protein of LDL-C. Previous studies have shown that the serum levels of TG, TC, LDL-C, Apo A1, and Apo B were reduced in PD patients compared to non-PD subjects [2–4].
Mild cognitive impairment (MCI) is commonly present in PD patients even at the time of diagnosis. It is a clinical syndrome that consist of cognitive decline with minimal functional loss, predicting a higher risk of dementia in PD patients. We previously reported that higher TG level is significant associated with PD-MCI [5]. In view of the potential neuroprotective effects of lipids in PD and limited evidence in this field, we conducted a cross-sectionals study to examine the association between lipids and PD and further explored the relationship between lipids and PD-MCI. We hypothesize that PD patients have lower levels of lipid profiles with PD-MCI patients having distinguishable lipid status.
METHODS
Study population
The current study investigated the baseline data of 307 participants including 205 idiopathic early PD patients who were recruited within 1 year from PD diagnosis and 102 normal controls without PD nor significant cognitive impairment from Early Parkinson’s disease Longitudinal Singapore (PALS) cohort according to the inclusion and exclusion criteria of PALS study protocol [6].
PALS [6] is a prospective cohort study undertaken to investigate PD progression since 2015. The study is conducted at two movement disorder outpatient clinics within Singapore and it has been approved by SingHealth Centralized Institutional Review Board (CIRB) with Ref 2019/2433 and written informed consent was provided by all participants.
Data collection
Clinical assessments
Demographic data were collected from all subjects. Motor performance was assessed by Movement Disorder Society (MDS)-Unified Parkinson’s Disease Rating Scale (UPDRS)-Part III. Non Motor symptom burden was evaluated by non-motor symptom scale (NMSS). Montreal Cognitive Assessment (MoCA) was used to monitor the overall cognitive change. Comprehensive neuropsychological testing that includes two tests in each of the five cognitive domains (executive, visuospatial, memory, attention and working memory, and language) were performed to establish the PD-MCI diagnosis.
Lipid biomarkers assessment
Serum lipid biomarkers (TC, TG, HDL-C, Apo A1, LDL-C, Apo B) were measured using overnight fasting venous serum sample and determined by enzymatic assay in an accredited commercial laboratory in Singapore (Quest Laboratories Pte Ltd, Singapore).
PD subtypes
PD patients were further classified into PD-MCI and PD normal cognition (PD-NC) groups based on International Parkinson and MDS level II criteria [7]. According to MDS level II criteria, cognitive impairment should be present in at least two neuropsychological tests with 1.5 standard deviations (SDs) worse than norms as cut offs, either within a single cognitive domain or across different cognitive domains.
Statistical analysis
Continuous variables were summarized using mean with standard deviation (SD). Categorical variables were summarized by frequency and percent. Fisher’s exact test was carried out to compare the categorical variables between PD and controls, while two-sample t test or Mann–Whitney U test (depends whether normality assumption is tenable) was performed to compare continuous variables between two groups. Similar methodology was performed for sub-group analysis (PD-MCI vs. PD-NC and PD-MCI vs. controls). All the lipid items were standardized for the aim of comparison among different biomarkers. Logistic regression analysis was conducted to examine the association between serum lipid level and the risk of PD, adjusting for potential confounders including age, sex and comorbidities and adjusted odds ratio and 95% confidence intervals were reported. Similar methodology was used to study the association of lipid biomarkers vs. the risk of PD-MCI. Linear regression model was applied to assess the association between lipid levels and MoCA total score, adjusting for confounders, and regression beta coefficient and 95% confidence intervals were reported. Significance level was set at p < 0.05. Data processing and statistical analysis was performed using Stata/SE 16.1 (StataCorp. 2019. Stata Statistical Software: Release 16. College Station, TX: StataCorp LLC).
RESULTS
Demographic and clinical characteristics of participants
A total of 205 early PD patients and 102 non-PD subjects of predominantly Chinese ethnicity were included in the analysis. There were no significant differences of age, sex, and body mass index (BMI) between PDs and controls. In terms of comorbidities, the incidence of hypertension, hyperlipidemia, and patients taking medications for hypertension and hyperlipidemia in PD group were significantly higher than that in controls (Table 1).
Demographic data and lipid biomarkers in PD patients and controls
DM, diabetes mellitus; BMI, body mass index; TC, cholesterol; TG, triglyceride; HDL-C, high-density lipoprotein cholesterol; Apo A1, Apolipoprotein A1; LDL- C, low-density lipoprotein cholesterol; Apo B, Apolipoprotein B. †Categorical variables reported as frequency (%); continuous variables reported as mean±standard deviation. ‡Fisher exact test and two-sample t test or Mann Whitney U test (where appropriate) for categorical and continuous variables, respectively.
Comparison of serum lipid level in PD patients and controls
The means of the lipid levels were all within the normal range of values except for TC and LDL-C levels in controls that were slightly higher than the normal range. PD patients had significantly lower levels of serum lipid biomarkers (p < 0.05) (Table 1) compared to controls. Lower TC, TG, Apo A1, and Apo B level were independent risk factors (p < 0.05) for PD in the logistic regression analysis with adjustment for age, sex, hypertension, hyperlipidemia, and medications for hypertension and hyperlipidemia (Fig. 1).
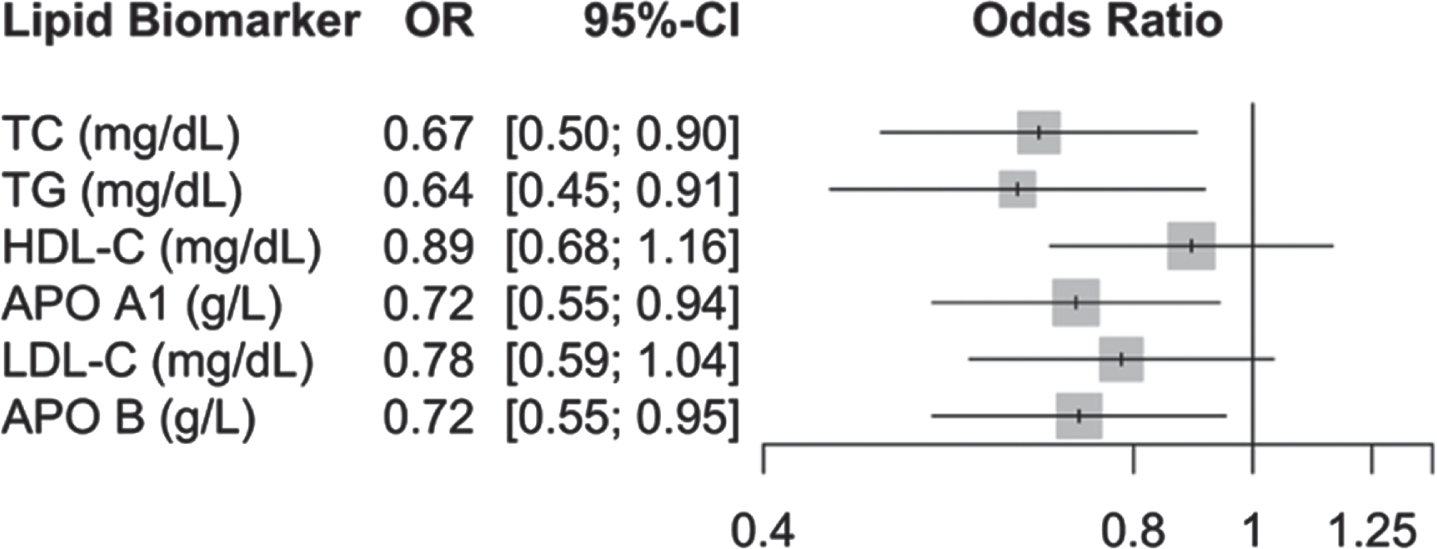
Association of standardized serum lipid biomarkers and the risk of PD. TC, cholesterol; TG, triglyceride; HDL-C, high-density lipoprotein cholesterol; Apo A1, Apolipoprotein A1; LDL-C, low-density lipoprotein cholesterol; Apo B, Apolipoprotein B. Multivariable logistic regression analysis was performed and adjusted for age, sex, hypertension, hyperlipidemia, and medications for hypertension and hyperlipidemia.
Comparison of serum lipid level in PD subgroups and controls
PD patients were further classified into PD-MCI and PD-NC subgroups. One hundred and seven patients had PD-MCI, accounting for 52.2% of PD patients. The PD-MCI group was significantly older, had significantly higher UPDRS total motor score than PD-NC group. The incidence of hypertension, hyperlipidemia, and patients taking medication for hypertension and hyperlipidemia in PD-MCI group were also significantly higher than that in PD-NC group. In terms of the comparison between PD-MCI and controls, they were significantly different in all the comorbidities and their medications, including hypertension, hyperlipidemia, and diabetes mellitus (Table 2).
Demographic and comorbidities and clinical characteristics of PD subgroups and controls
DM, diabetes mellitus; UPDRS, Unified Parkinson’s Disease Rating Scale; NMSS, non-motor symptom scale; TC, cholesterol; TG, triglyceride; HDL-C, high-density lipoprotein cholesterol; Apo A1, Apolipoprotein A1; LDL-C, low-density lipoprotein cholesterol; Apo B, Apolipoprotein B. †Categorical variables reported as frequency (%); continuous variables reported as mean±standard deviation. ‡Two groups were compared using Fisher exact text and two sample t test or Mann Whitney U test (depending on normality assumption) for categorical and continuous variables, respectively.
Univariate comparisons of lipid markers in different groups (PD-MCI vs. PD-NC and PD-MCI vs. controls) are shown in Fig. 2. In the multivariate logistic analysis, increased TC, TG, and Apo A1 levels were independent risk factors (OR = 1.68, p = 0.01; OR = 1.54, p = 0.032; 1.51, p = 0.016, respectively) for PD-MCI (vs. PD-NC) after adjustment of age of diagnosis, UPDRS total motor score, history of hypertension, hyperlipidemia, and medications for hypertension and hyperlipidemia. No lipid markers were significant risk factors for PD-MCI (vs. Controls) (Fig. 3A, B).
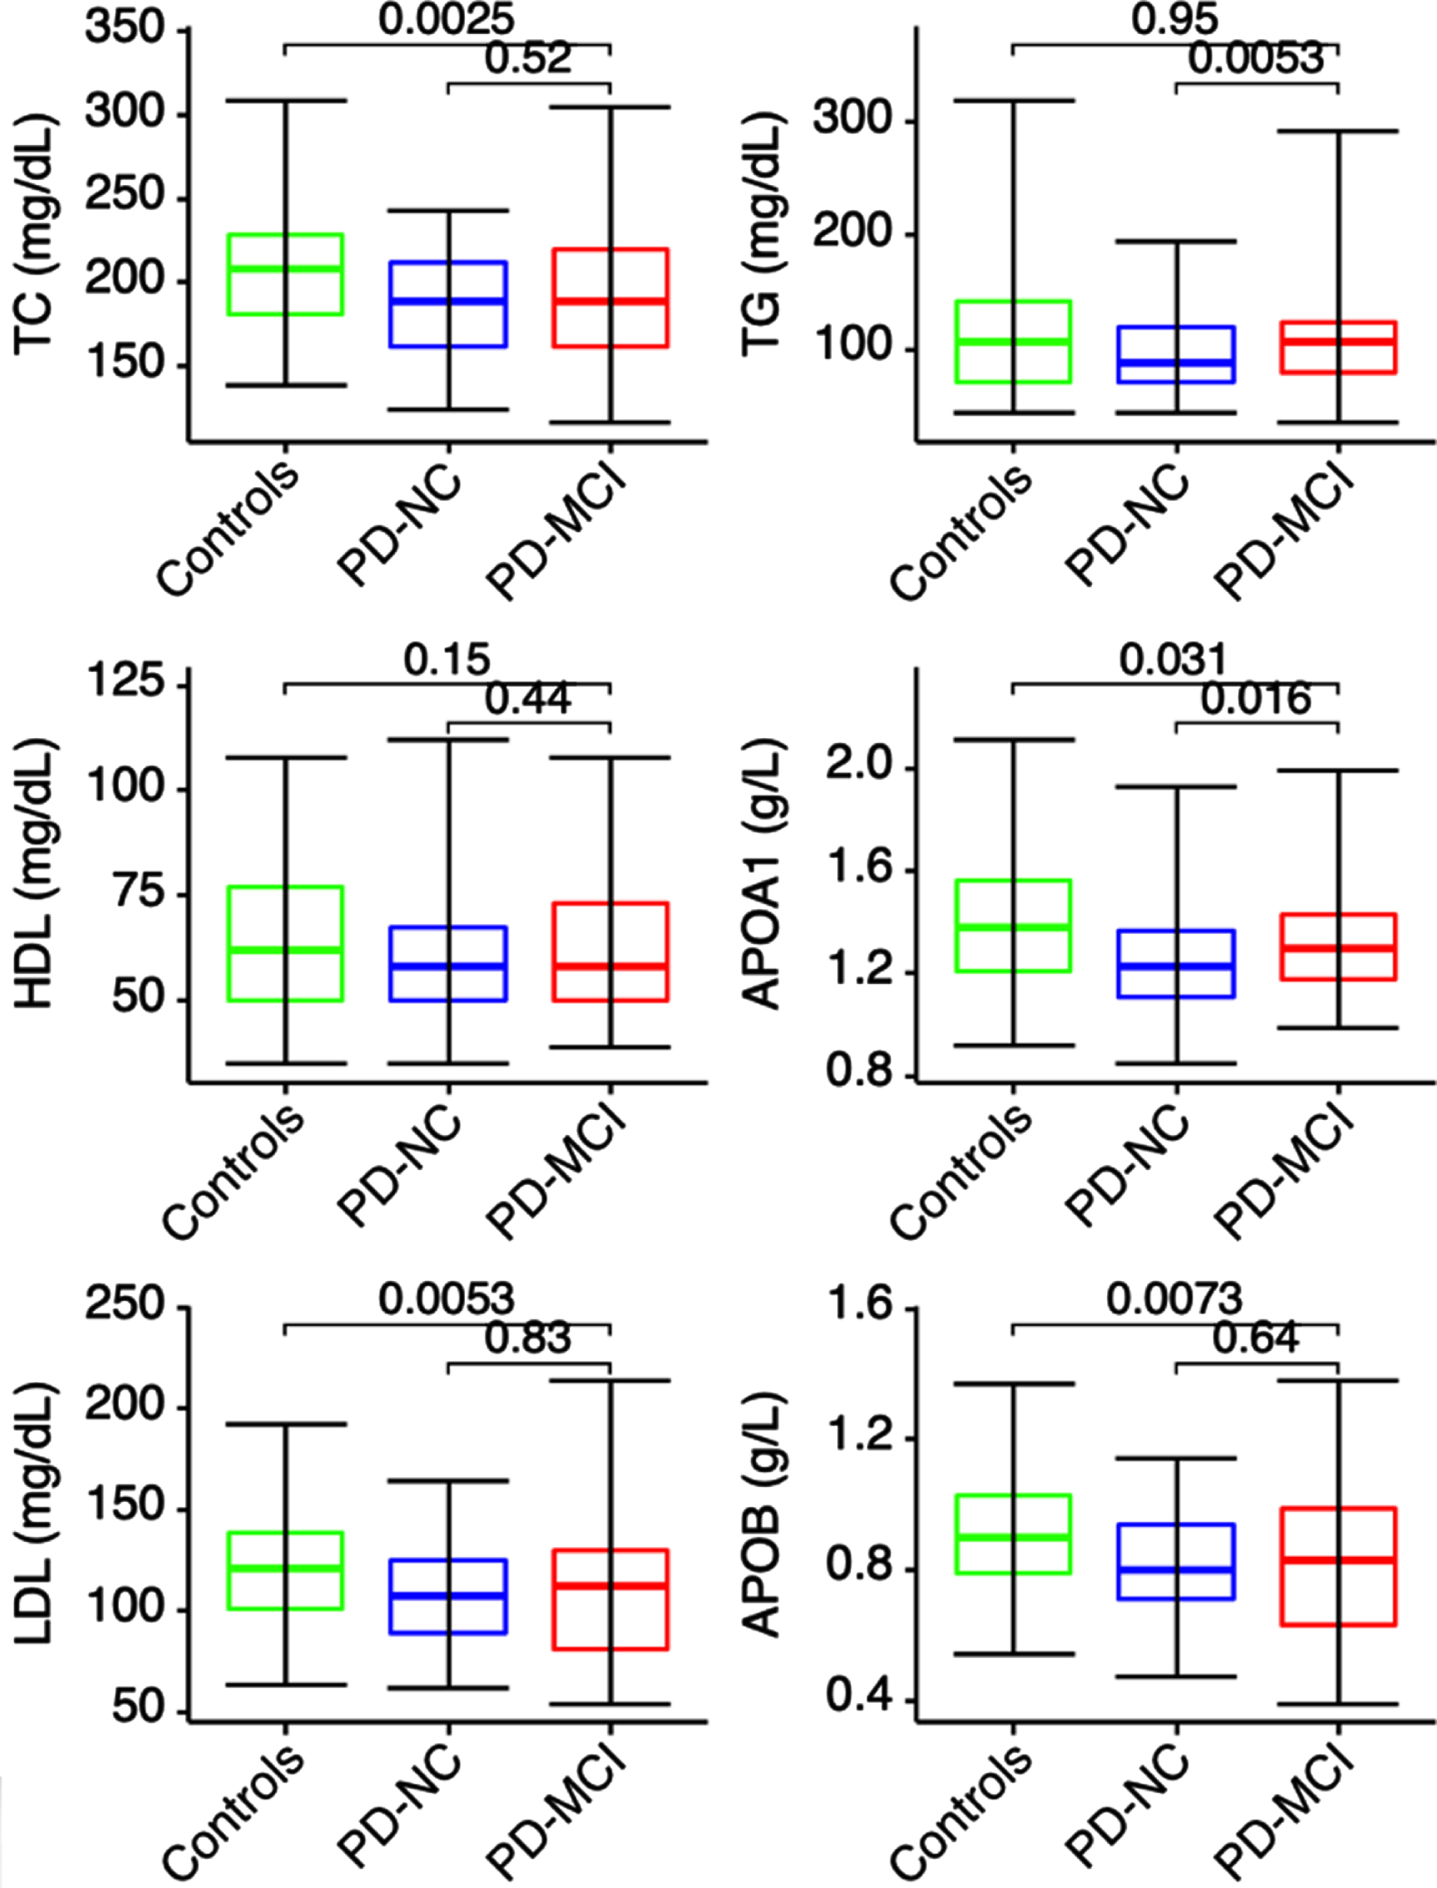
Serum lipid biomarkers of PD subgroups and controls. TC, cholesterol; TG, triglyceride; HDL-C, high-density lipoprotein cholesterol; Apo A1, Apolipoprotein A1; LDL-C, low-density lipoprotein cholesterol; Apo B, Apolipoprotein B. Mann–Whitney U test was performed to compare the levels of lipid markers between different groups (PD-MCI vs. PD-NC and PD-MCI vs. controls).
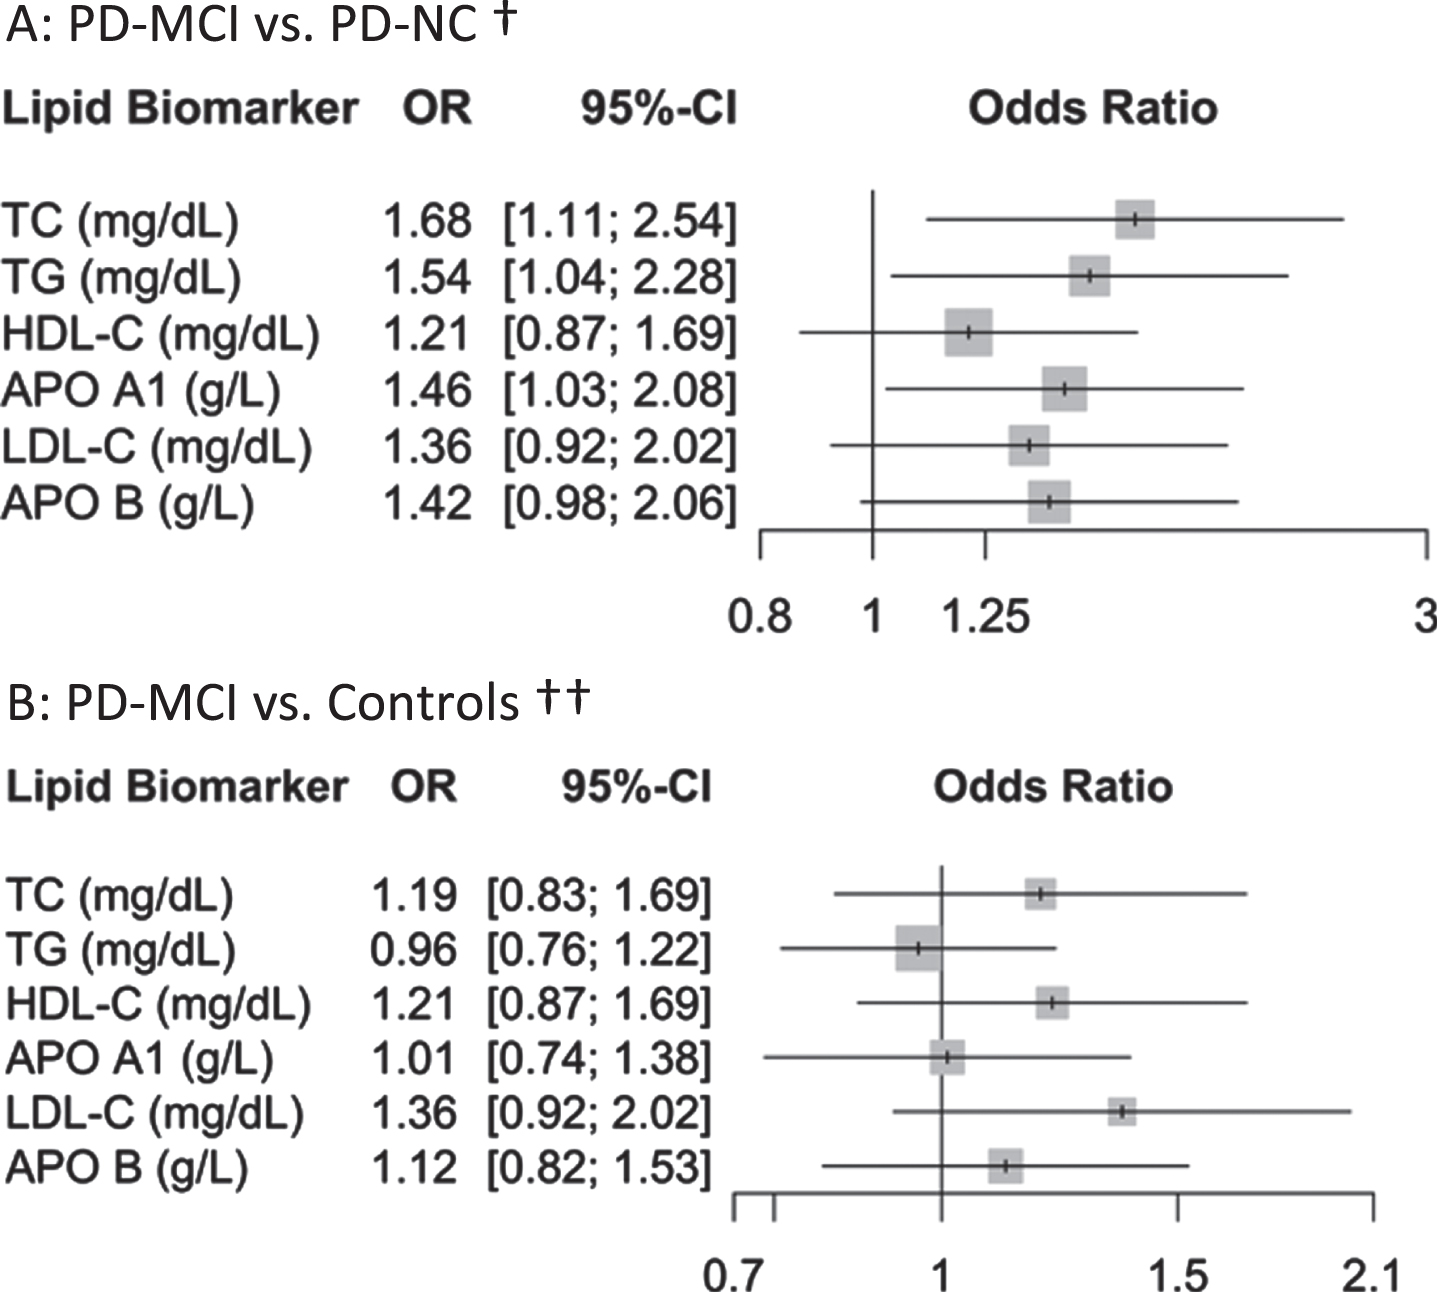
Association of standardized serum lipid biomarkers and the risk of PD-MCI. A: PD-MCI vs. PD-NC†. Figure 3B: PD-MCI vs. Controls ††. TC, cholesterol; TG, triglyceride; HDL-C, high-density lipoprotein cholesterol; Apo A1, Apolipoprotein A1; LDL-C, low-density lipoprotein cholesterol; Apo B, Apolipoprotein B. †Multivariable logistic regression analysis was performed to investigate the association of lipid markers versus the risk of PD-MCI in PD patients; Analysis has been adjusted for age of diagnosis, sex, UPDRS total motor score, hypertension, hyperlipidemia, and medications for hypertension and hyperlipidemia. ††Multivariable logistic regression analysis was performed to investigate the association of lipid markers versus the risk of PD-MC in PD-MCI and controls; Analysis has been adjusted for sex, hypertension, hyperlipidemia, diabetes mellitus, and medications for those comorbidities.
In the linear regression model, TG and Apo A1 had significantly negative association with MoCA score, indicating higher levels of Apo A1 and TG correlated with poorer cognitive performance (Table 3). There were no significant correlations between lipid profiles and cognitive domain scores except that the levels of TC and TG had negative associations, of borderline significance, with standardized memory score (Supplementary Table 1).
Association analysis of standardized serum lipid biomarkers and MoCA score
TC, cholesterol; TG, triglyceride; HDL-C, high-density lipoprotein cholesterol; Apo A1, Apolipoprotein A1; LDL-C, low-density lipoprotein cholesterol; Apo B, Apolipoprotein B; MoCA, Montreal Cognitive Assessment. ‡ Multivariable linear regression analysis was performed to investigate the association of lipid profile versus MoCA score. Analysis has been adjusted for age of diagnosis, sex, UPDRS total motor score, hypertension, hyperlipidemia, and medications for hypertension and hyperlipidemia.
DISCUSSION
In this study, we investigated the levels of lipid biomarkers and their association with PD. All the lipid biomarkers studied (TC, TG, HDL-C, Apo A1, LDL-C, Apo B) were significantly lower in PD patients when compared with controls. Decreased TC, TG, Apo A1, and Apo B level were independent risk factors for PD in the multivariate model after adjustment for confounders. To our best knowledge, this is the first study investigating the association between a comprehensive panel of lipid biomarkers and cognitive impairment in early PD patients. We found that higher TG and Apo A1 levels were independent risk factors for cognitive impairment in PD patients.
Our findings are consistent with previous studies, reinforcing the notion that elevated serum levels of TC, TG, Apo A1, and Apo B are protective factors for the development of PD [2, 8]. Cho et al. found that the incorporation of higher molar ratio of α-syn and apoA-I into the reconstituted HDL exhibited potent antioxidant and anti-glycation activity [9]. Overall, lipid involvement in oxidative stress, chronic inflammation, and its cytotoxic interactions with alpha-synuclein may be the underlying mechanisms for this neuroprotection [10].
ApoA1 may be an important biomarker for PD risk and it correlates with dopaminergic system vulnerability [11]. However, the association between Apo A1 and cognitive impairment in PD has not been previously reported. In the mouse model of Alzheimer’s disease (AD), overexpression of human ApoA-I preserves cognitive function partially by attenuating neuroinflammation and cerebral amyloid angiopathy, suggesting that elevating plasma Apo A1 levels may be an effective approach to preserve cognitive function in patients with AD [12]. However, the findings of blood Apo A1 levels in AD patients have been inconclusive. Koch et al. reported that Apo A1 was not correlated to dementia risk [13]. Multiple studies reported that AD patients had lower blood Apo A1 levels [14, 15], while other studies found AD patients to have higher levels of Apo A1 than controls [16–18]. In our study, increased Apo A1 levels were independent risk factors for MCI in PD patients. Our finding suggests that Apo A1 might be a dysregulated protein that could serve as a biomarker for mild cognitive impairment in early PD. The underlying mechanism is not yet clear. Potential biological plausibility lies in the upregulation of Apo A1 in peripheral circulation in PD-MCI patients that passes through the blood-brain barrier (BBB) to ameliorate neuroinflammation and amyloid-β (Aβ) deposition in the brain. Considering the fluctuation of Apo A1 level in aging animal models [19], it is possible that Apo A1 levels in PD patients is dynamic and might change as PD progresses. Future longitudinal studies that regularly monitor Apo A1 levels overtime might be helpful for further characterization of this biomarker.
In our study, we also found that TC was an independent risk factor for cognitive impairment which, to our best knowledge, has not been reported before in PD. Elevated TC levels have been reported to be a potential risk factor for cognitive impairment in AD [20, 21]. Consistent with our previous study, TG was significantly elevated in PD-MCI group [5]. Higher TC and TG levels impair the BBB and are associated with increased cerebral Aβ/tau pathology that could be the underlying biological explanation for our findings [20, 22].
Our study is the first study investigating the association between a comprehensive panel of lipid biomarkers and PD along with PD-MCI. Moreover, the study was conducted in a homogeneous Asian cohort, as all our PD patients were recruited within 1 year from diagnosis. Considering the homogeneous participants and statistical adjustment of confounders, our results are likely to reflect unbiased associations between lipids and PD/PD-MCI. However, some limitations of the study should be noted. The study design was cross-sectional and lipid biomarkers were not monitored overtime. Second, this was a single cohort study that requires further validation in other populations.
In conclusion, our findings reinforce the relationship between lipid biomarkers and PD. We demonstrated that PD patients had lower levels of lipid biomarkers and PD-MCI patients had higher levels of TC, TG, and Apo A1. Elevated TC, TG, and Apo A1 levels could be useful biomarkers to predict MCI in early PD patients. Longitudinal studies are needed to further confirm and characterize the association between PD, PD-MCI, and lipid biomarkers.
Footnotes
ACKNOWLEDGMENTS
We would like to thank all participants and their families for their support of the PALS study, and also neurologists from the National Neuroscience Institute, Singapore for referring their patients for the study.
This study was supported by the Singapore Ministry of Health’s National Medical Research Council under its Open Fund Large Collaborative Grant (MOH-OFLCG18May-0002).
CONFLICT OF INTEREST
The authors have no conflict of interest to report.