
Abstract
Background:
Exercise intolerance is an important impairment in patients with SMA, but little is known about the mechanisms underlying this symptom.
Objective:
To investigate if reduced motor unit and capillary recruitment capacity in patients with SMA contribute to exercise intolerance.
Methods:
Adolescent and adult patients with SMA types 3 and 4 (n = 15) and age- and gender matched controls (n = 15) performed a maximal upper body exercise test. We applied respiratory gas analyses, non-invasive surface electromyography (sEMG) and continuous wave near-infrared spectroscopy (CW-NIRS) to study oxygen consumption, arm muscle motor unit- and capillary recruitment, respectively.
Results:
Maximal exercise duration was twofold lower (p < 0.001) and work of breathing and ventilation was 1.6- and 1.8-fold higher (p < 0.05) in patients compared to controls, respectively. Regarding motor unit recruitment, we found higher normalized RMS amplitude onset values of sEMG signals from all muscles and the increase in normalized RMS amplitudes was similar in the m. triceps brachii, m. brachioradialis and m. flexor digitorum in SMA compared to controls. Median frequency, onset values were similar in patients and controls. We found a similar decrease in median frequencies of sEMG recordings from the m. biceps brachii, a diminished decrease from the m. brachioradialis and m. flexor digitorum, but a larger decrease from the m. triceps brachii. With respect to capillary recruitment, CW-NIRS recordings in m. biceps brachii revealed dynamics that were both qualitatively and quantitatively similar in patients and controls.
Conclusion:
We found no evidence for the contribution of motor unit and capillary recruitment capacity of the upper arm muscles in adolescent and adult patients with SMA types 3 and 4 as primary limiting factors to premature fatigue during execution of a maximal arm-cycling task.
Keywords
INTRODUCTION
Hereditary proximal spinal muscular atrophy (SMA) is a progressive neuromuscular disease caused by the homozygous loss of function of the survival motor neuron 1 (SMN1) gene [1]. This results in α-motor neuron degeneration and neuromuscular junction abnormalities, but also affects other tissues including skeletal muscle [2–4]. SMA is characterized by progressive muscle atrophy and fatty replacement of muscle tissue and life-long deteriorating muscle strength [5–7]. Reduced endurance during repetitive motor task is an additional and disabling dimension of physical impairment in SMA [4, 8–11].
Evidence has been mounting that neurogenic abnormalities are not the sole cause of muscle dysfunction and exercise intolerance in SMA [3]. Amongst other factors, mitochondrial abnormalities have been found in muscle in SMA mouse models and patient biopsy material [3, 12–16]. We recently reported the first in vivo evidence for mitochondrial dysfunction in muscle in a cohort of adolescent and adult patients with SMA [17]. However, we found oxidative mitochondrial dysfunction in residual fast glycolytic white, but not slow oxidative red or intermediate, myofibers of the upper arm muscles similar to previous findings in a mild SMA mouse model. This finding was associated with a white-to-red shift in myofiber type composition and, as a consequence, a reduced specific force of the arm muscles [17].
Other peripheral factors that have been implicated in exercise intolerance in SMA include truncated motor unit recruitment capacity and vascular abnormalities, respectively. Specifically, decreased muscle capillary density has been documented in mouse SMA models and patients [18–21]. Lack of residual motor unit recruitment capacity during execution of a submaximal motor task has been reported to limit performance during a six minute walk test [22] and was identified in some, but not all, patients with SMA during submaximal endurance tests [23].
Here, we further investigate these matters in a cohort of adolescent and adult patients with SMA types 3 and 4. We collected surface electromyographical (sEMG) [22–26] and continuous wave near-infrared spectroscopic (CW-NIRS) data [27–29] from arm muscles together with respiratory gas analyses during a maximal arm-cycling task to study motor unit and capillary recruitment dynamics in relation to exercise performance and bodily oxygen consumption.
MATERIALS AND METHOD
Participants
Subjects participated in a cross-sectional study of two visits, aiming to examine muscle morphology and oxidative mitochondrial function in SMA [17]. We obtained data described here during the first visit at the Spieren voor Spieren Inspanningslab of the University Medical Center Utrecht, The Netherlands. The local Medical Ethics Committee approved our study (NL62792.041.17). We obtained informed consent from all participants (and their parents in case of minors). We included treatment-naïve patients, ambulant and non-ambulant, with an initial genetically confirmed diagnosis of SMA types 3a, 3b and 4 registered in the Dutch SMA database [30]. We recruited age and gender matched control participants via the patient’s social network of family and friends. All participants met the following inclusion criteria: 1) age≥12, 2) ability to perform active supine arm cycling movements, 3) ability to follow test instructions, 4) m. biceps brachii Medical Research Council (MRC) score for muscle strength≥4 and m. triceps brachii MRC score≥2. Exclusion criteria were: 1) contraindications concerning MR assessment, 2) risk factors for exercise testing registered by a Dutch version of the Preparticipation Questionnaire (American College of Sports Medicine and American heart Association), 3) mental retardation, 4) comorbidities affecting exercise tolerance, 5) being under examination for non-diagnosed disease at the time of investigation.
Study design
We collected baseline characteristics (e.g. anthropometry (lean body mass using a bodystat scan (Quadscan 4000® Euromedix, Leuven, Belgium)). We assessed motor function (Hammersmith Functional Motor Scale Expanded), Medical Research Council (MRC) scores for muscle strength and patients performed a supine arm-cycling test to exhaustion.
Supine arm cycling test
A custom-built mechanically braked bicycle ergometer for arm-cycling described elsewhere [17, 31] was used in the study. Participants were positioned supine on a bed with an angle of 90° elbow flexion and vertical cranks (Fig. 1). After five minutes of rest for baseline recordings, participants were asked to start cycling at a desired pace of 90 rpm indicated by audio cues. Between minutes 0 and 6, the default workload was 5 W [31]. At min 6, a mechanical brake was applied raising the workload to 10 W [31]. From min 7 on, the workload was increased every min by adding weight (0.2 kg for women and 0.3 kg for men) (Fig. 2). The primary aim of the test was to cycle until exhaustion thereby exerting a maximal performance of the upper arm muscles. Exercise duration in each subject was documented.
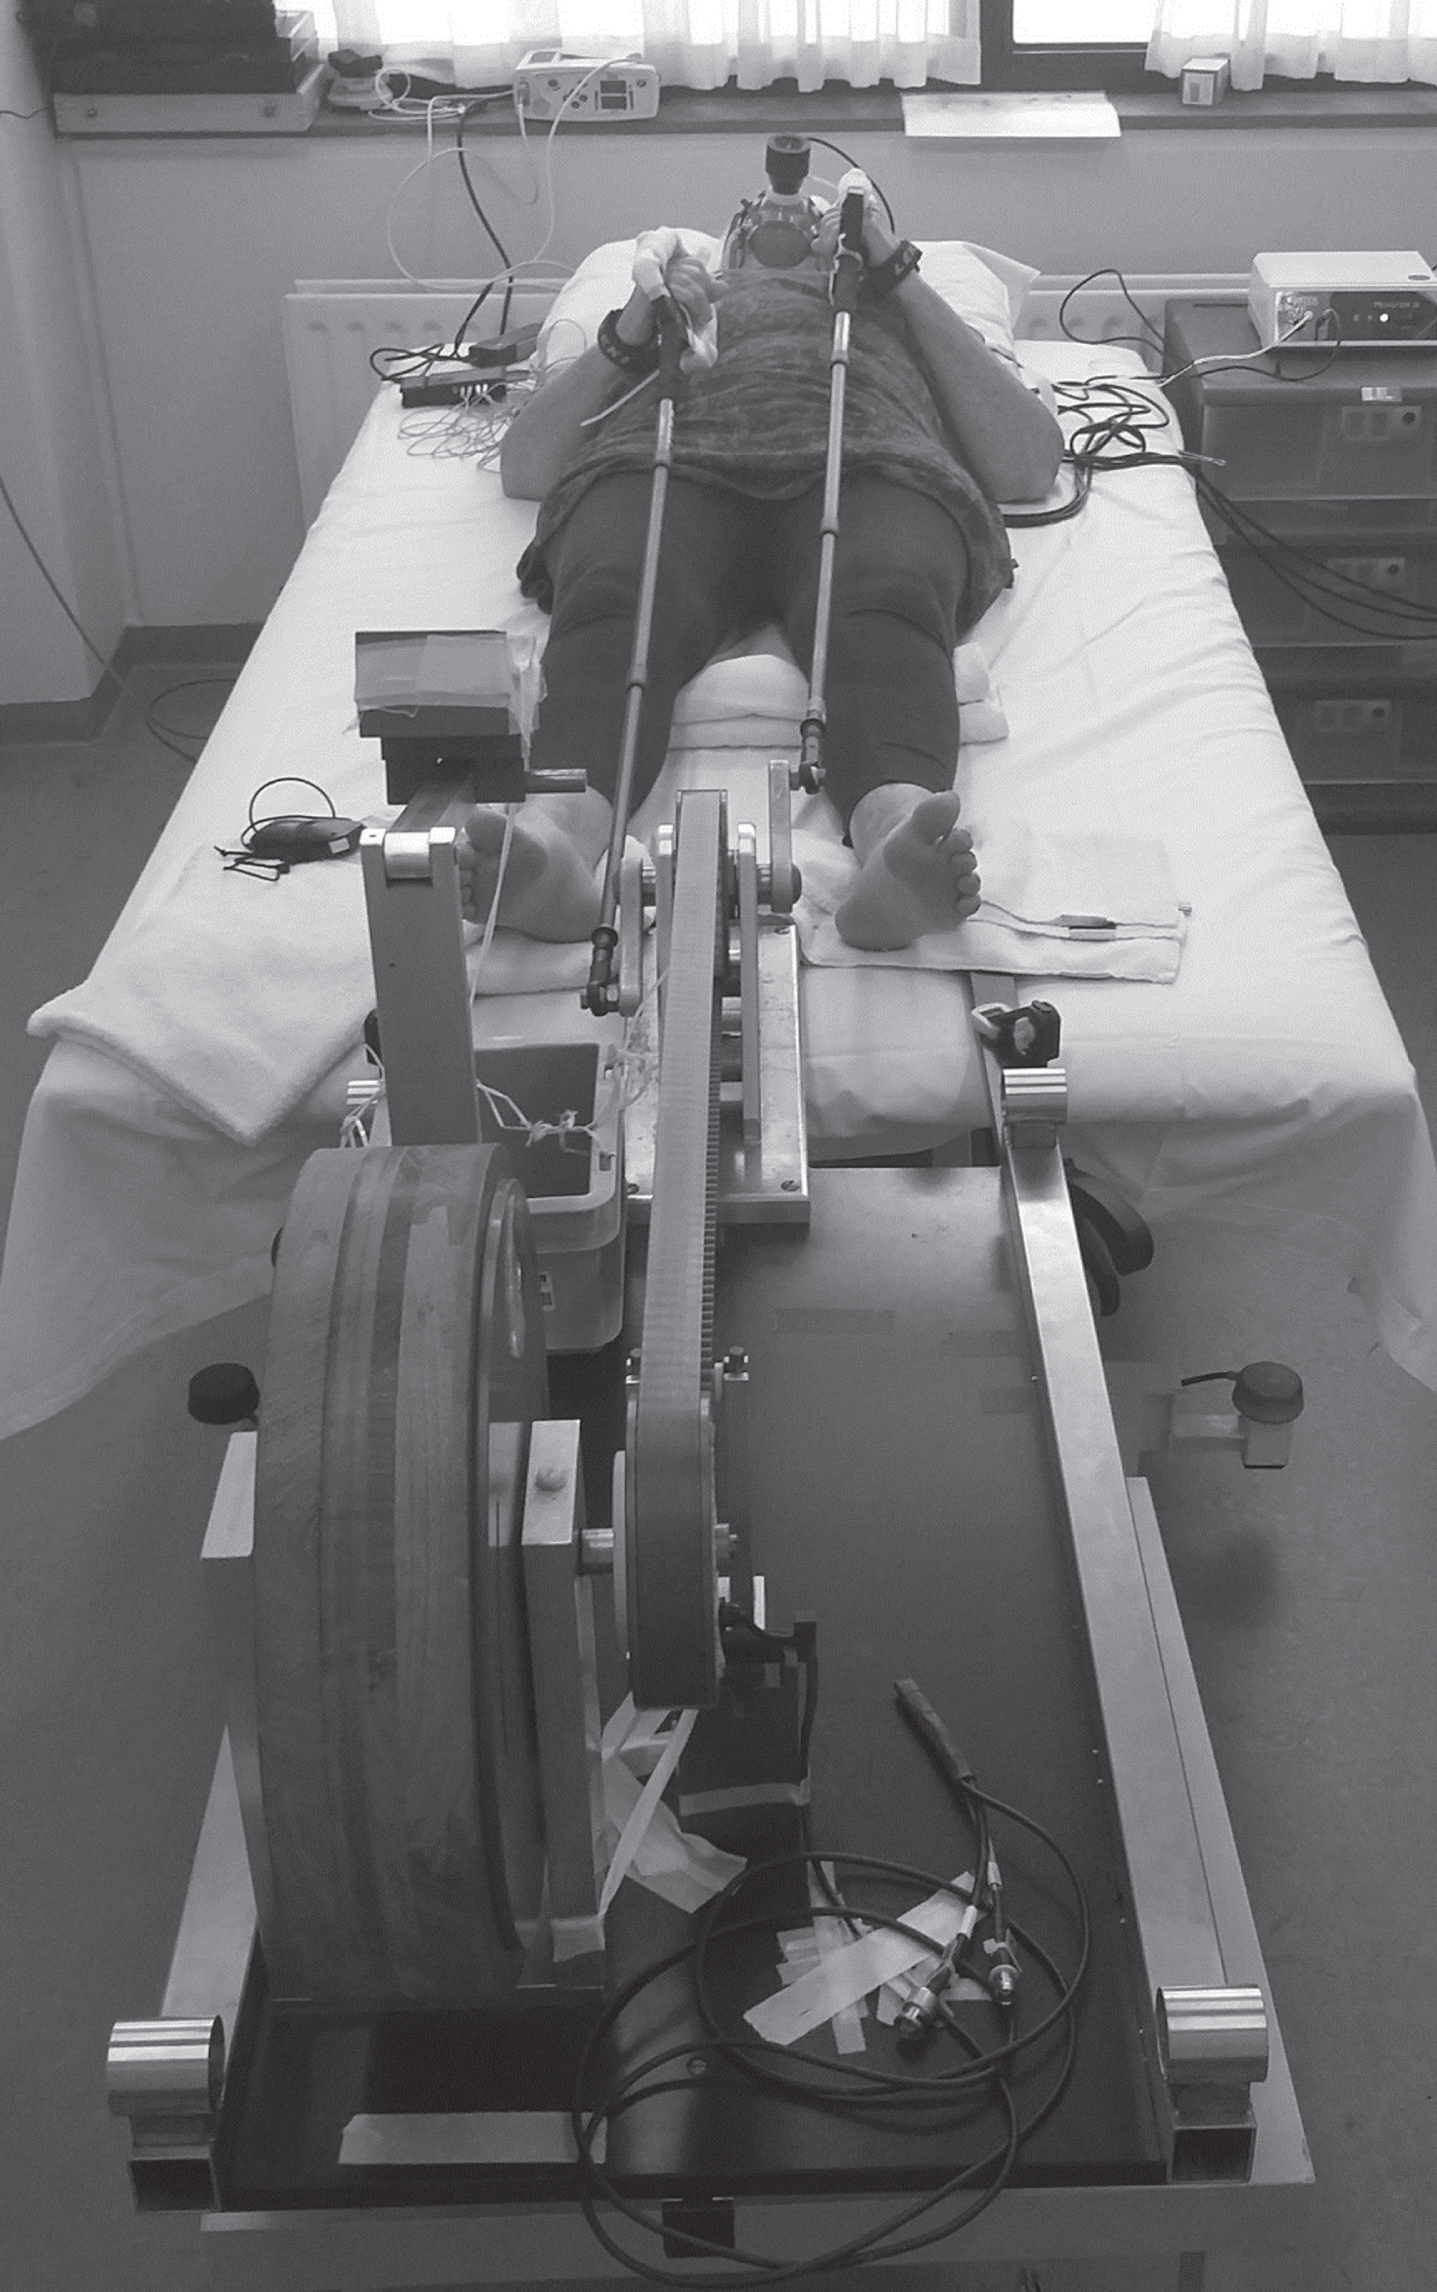
Overview of the experimental set up of the incremental arm-cycling test to exhaustion. The participant is wearing sEMG equipment on the right arm, CW-NIRS equipment on the left arm and a respiratory gas exchange mask. The participant depicted in the photo granted permission for publication.
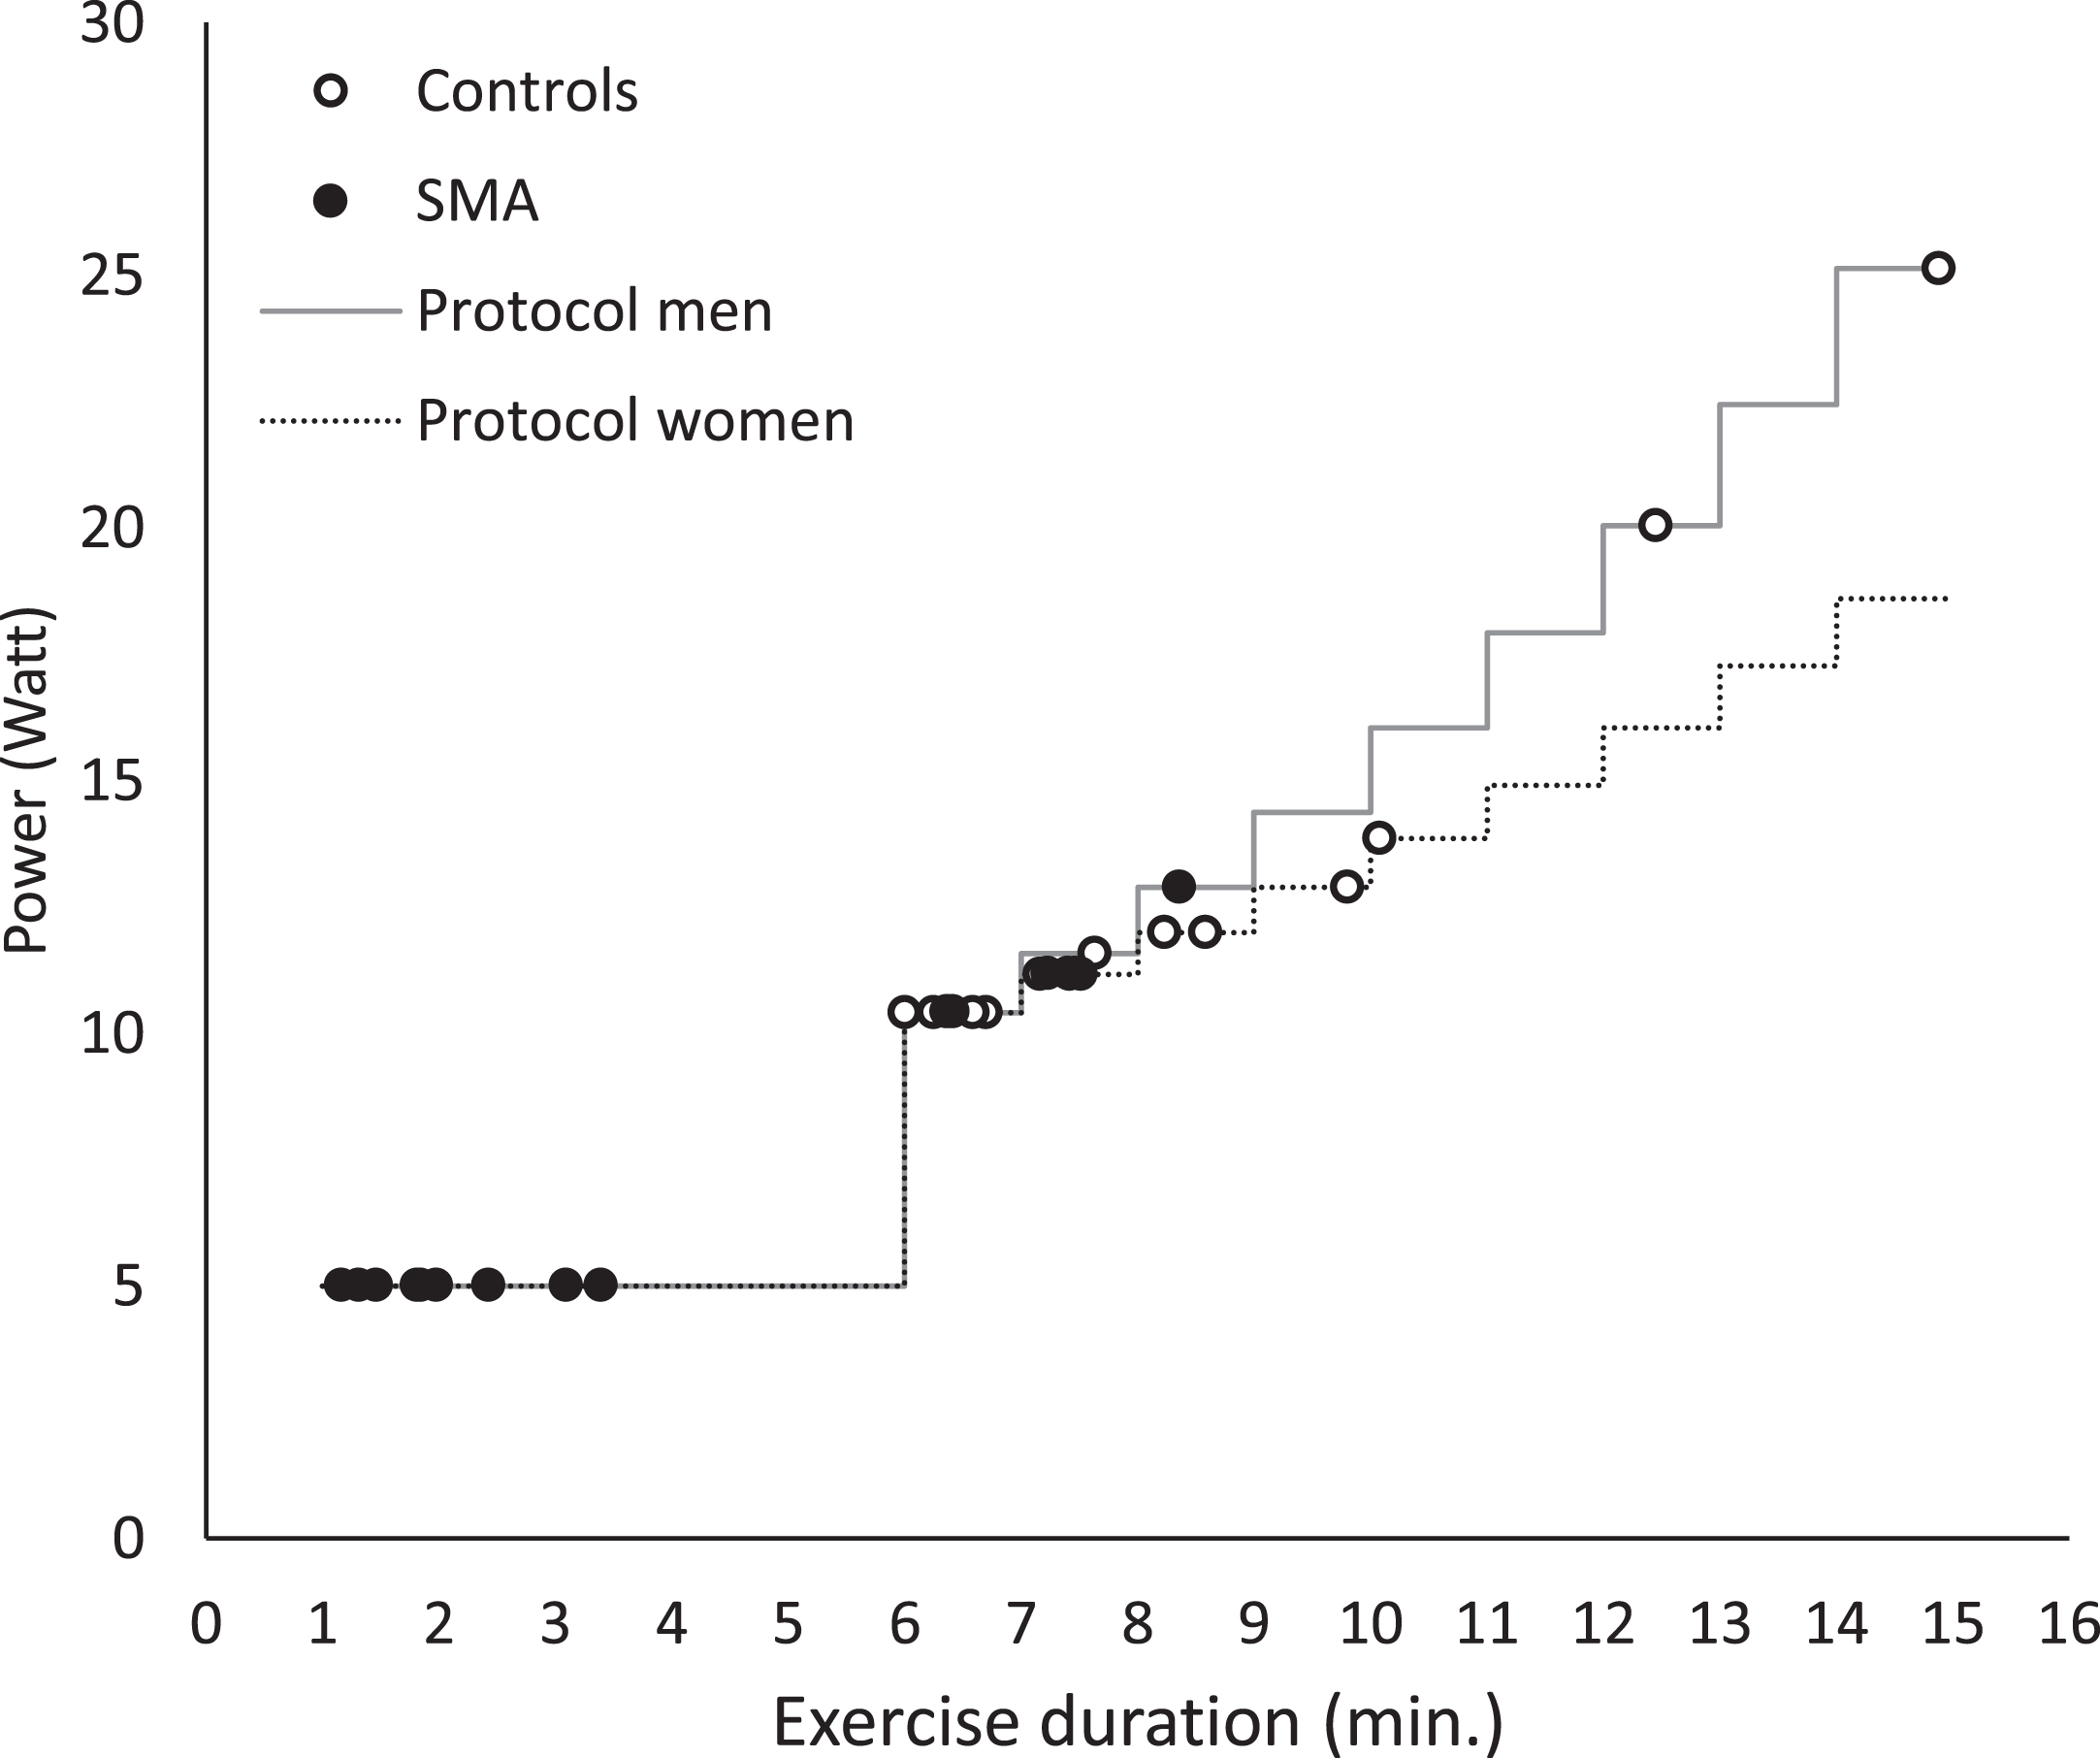
Schematic overview of the incremental arm-cycling protocol and individual performances during the first visit. The primary aim of the test was to cycle until exhaustion thereby eliciting recruitment of all available motor units of the upper arm muscles.
Respiratory gas exchange data collection and processing
We measured breath-by-breath gas exchange (CORTEX Biophysik GmbH, Leipzig, Germany) and heart rate (HR) (Polar, Kempele, Finland) during rest, exercise and recovery. Participants with an exercise duration lower than three minutes were excluded from the analyses. Recorded data was time-aligned and interpolated second-by-second in Metasoft® and averaged over 10 second periods. Mean rest (HR and RER) and end recovery values (HR, VO2, VCO2, VE, RER) were calculated over the last three minutes of period, respectively. We calculated peak values (HR, VO2peak, VCO2peak, VE peak, RER peak) over the last 30 seconds of exercise. Mean values of VO2, VCO2, VE and RER over the last 30 seconds of every minute during constant load cycling were calculated for participants with an exercise duration between six and nine minutes. We corrected VE, VO2 and VCO2 for lean body mass.
sEMG data collection and processing
We continuously measured muscle activation of four muscles with bipolar sEMG, using the four-channel wireless Bio Radio system (Great Lakes Neurotechnologies, Cleveland, OH, USA). When necessary, we removed hair and we cleaned the skin with alcohol (70% denatured ethanol incl. 5% isopropanol). We placed standard self-adhesive Ag/AgCl Discs (3Mtrademark Red Dottrademark, 9 mm electrode, 18 mm gel, 50 mm disc) with 34 mm center-to-center inter-electrode distance on the right side of the body: m. biceps brachii (1/3 on the line from fossa cubit to medial acromion), m. triceps brachii (1/2 on the line between posterior crista of the acromion and olecranon at 2 fingers width medial to the line), m. brachioradialis (4 cm distally from lateral epicondyle of the elbow on the medial fleshy mass) and m. flexor digitorum (1/4 between wrist and elbow on the area where the greatest movement is felt while the subject flexes his/her fingers). Reference electrodes were placed on the manubrium. We taped all wires to the skin to prevent cable movement artifacts.
We recorded muscle electrical activation (sampling rate of 1000 Hz, sampling resolution of 6μV per least significant bit, 250 Hz anti-aliasing filter) using Biocapture software. We used custom programs written in MATLAB R2016b to process raw sEMG data (detrend, 20 Hz high pass bi-directional 4th order butterworth filter, 50 Hz notch filter). Outcome variables were median frequencies (Fast Fourier Transformation) and root mean square (RMS) amplitudes, calculated over 10 sec windows. RMS amplitudes were normalized to maximal voluntary contractions (MVC); measured before arm-cycling using a handheld dynamometer (MicroFET2, Hoggan Health Industries, Salt Lake City, UT, USA) following standardized procedures [32].
NIRS data collection and processing
We continuously measured capillary recruitment by [766 + 859] nm and [766–859] nm signals using a two-channel single distance wave photometer (OXYMON, Artinis, Zetten, The Netherlands) during rest and arm-cycling. We placed light emitting fibers with an interoptode distance between 30 –50 mm [29, 33], depending on skinfold and adipose tissue thickness measured with a Harpender Skinfold Caliper (93/42/EEC), on the left m. biceps brachii and m. triceps brachii according to described procedures. We taped the optodes on the skin to prevent movement and used a black cloth to reduce stray light intrusion and loss of transmitted light from the field of examination.
We recorded NIRS signals (sampling rate of 50 Hz) using Oxysoft software (diffusion path length factor (DPF) = 4 [34]). We used a Gaussian filter and custom programs written in MATLAB R2016b for data down sampling to 2Hz. Datasets were excluded based on high percentages of fatty infiltration in the m. triceps brachii and the absence of an appropriate reference DPF. Datasets with a high signal to noise ratio, drift, high adipose tissue thickness or an instable resting period were excluded from analyses. Signals were normalized to the highest value of the [766 + 859] nm signal measured in controls. We visually inspected the match between the [766 + 859] nm signal and [766–859] nm signal. A mismatch was determined individually by visual inspection of the NIRS signals in combination with sEMG parameters and exercise duration.
Statistical analysis
We used quantitative descriptive statistics (independent samples t-test: mean (SD) or Wilcoxon singed rank test: median (IQR)) to present between group differences in demographics, clinical characteristics, respiratory gas analyses and NIRS. We used linear mixed effect statistical models (LMM) (fixed effects: group, time, interaction; random effects: intercept per individual; unstructured covariance) to examine the difference over time, during the first six minutes, on VO2, VCO2, VE and RER between patients and controls. We used LMM (fixed effects: group, time, interaction; random effects: intercept per individual; unstructured covariance) to examine the difference over time on sEMG normalized RMS amplitudes and median frequencies between patients and controls. A simple linear regression was fitted on individual HR and NIRS parameters over time to calculate slopes. We used SPSS (IBM SPSS Statistics version 24; IBM, Inc., Chicago, IL, USA) for statistical analyses. Level of significance was set on p < 0.05.
RESULTS
Subject characteristics and arm-cycling exercise performance
We included 15 patients with SMA types 3 and 4 (type 3a: n = 6, type 3b: n = 8, type 4: n = 1) and 15 age and gender matched controls in the study. Participant baseline characteristics are summarized in Table 1. Lean body mass was significantly lower in patients compared to controls (Table 1). Patients prematurely fatigued during execution of the arm-cycling task. Mean (SD) exercise duration (min) was twofold lower in patients (4.1 (2.6)) compared to controls (8.4 (2.5)), p < 0.001. Individual exercise performances are shown in Fig. 2.
Baseline characteristics
SMA, spinal muscular atrophy; FEV1, forced expiratory volume in 1 s; FVC, forced vital capacity; *level of significance p < 0.05.
Respiratory gas exchange during arm-cycling
Basal and post-exercise values of respiratory gas exchange variables in patients and controls were not significantly different (Table 2). In response to arm-cycling exercise, minute ventilation (VE) and oxygen uptake (VO2) scaled to maximal power output was significantly higher in patients with SMA compared to controls (Fig. 3). Absolute values of VE, VO2, VCO2 and RER were not significantly different between patients and controls (Table 2, Fig. 4 and Supplementary Table 1). The median incremental change in heart rate per minute in response to arm-cycling was 2.1-fold larger in patients with SMA than controls (p = 0.016). This result was closely correlated with arm-cycling duration and lower total upper arm muscle strength (r2 = 0.86; Supplementary Figure 1). The temporal change in HR per minute in response to exercise was not correlated with arm muscle activity (Supplementary Figure 2).
Respiratory gas exchange during exercise
SMA, spinal muscular atrophy; HR, heart rate; RER, respiratory exchange ratio (VCO2/VO2); VE peak, peak ventilation; VO2 peak, peak oxygen uptake per kilogram lean body mass; W peak, peak workload per kilogram lean body mass.
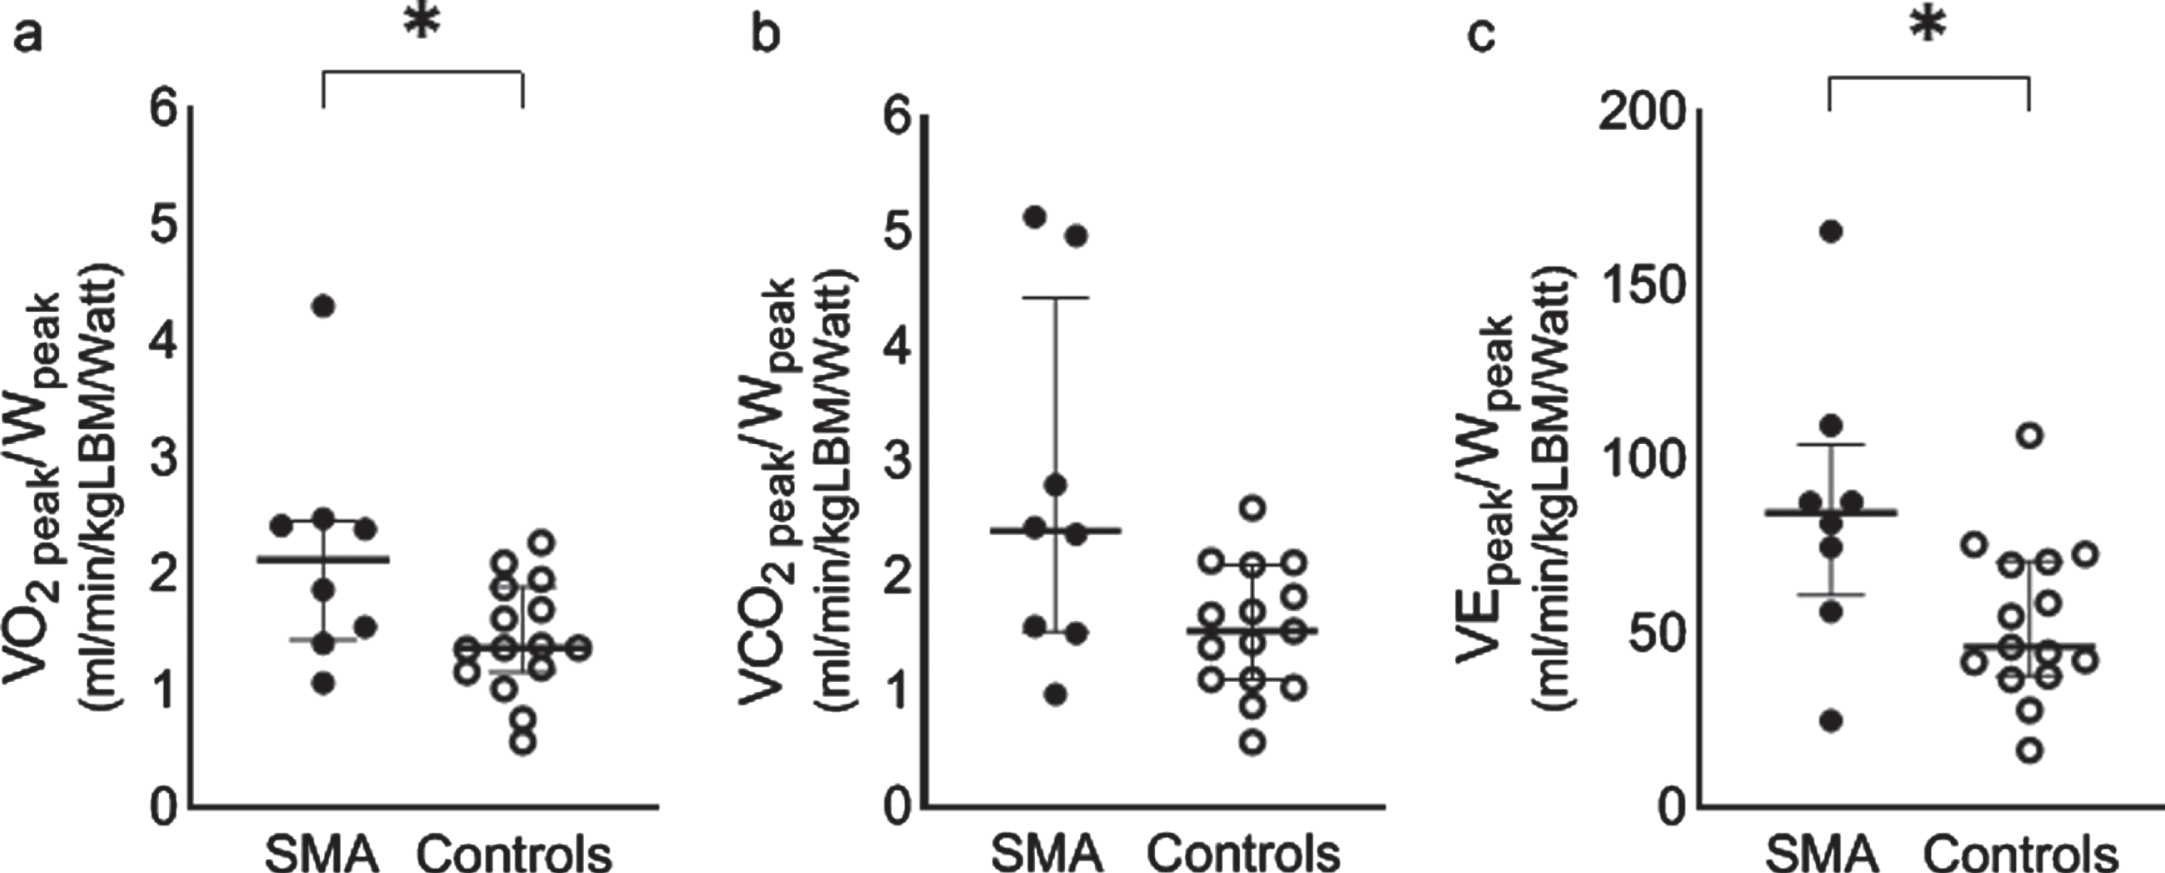
Peak oxygen consumption, carbon dioxide exhalation and ventilation normalized to peak workload in patients with SMA (n = 8) and controls (n = 15). a) Median (IQR) and individual oxygen consumption per Watt in patients with SMA (solid dots) and controls (open dots), p = 0.040. b) Median (IQR) and individual carbon dioxide exhalation per Watt in patients with SMA (solid dots) and controls (open dots), p = 0.056. c) Median (IQR) and individual ventilation per Watt in patients with SMA (solid dots) and controls (open dots), p = 0.023.* p < 0.05.
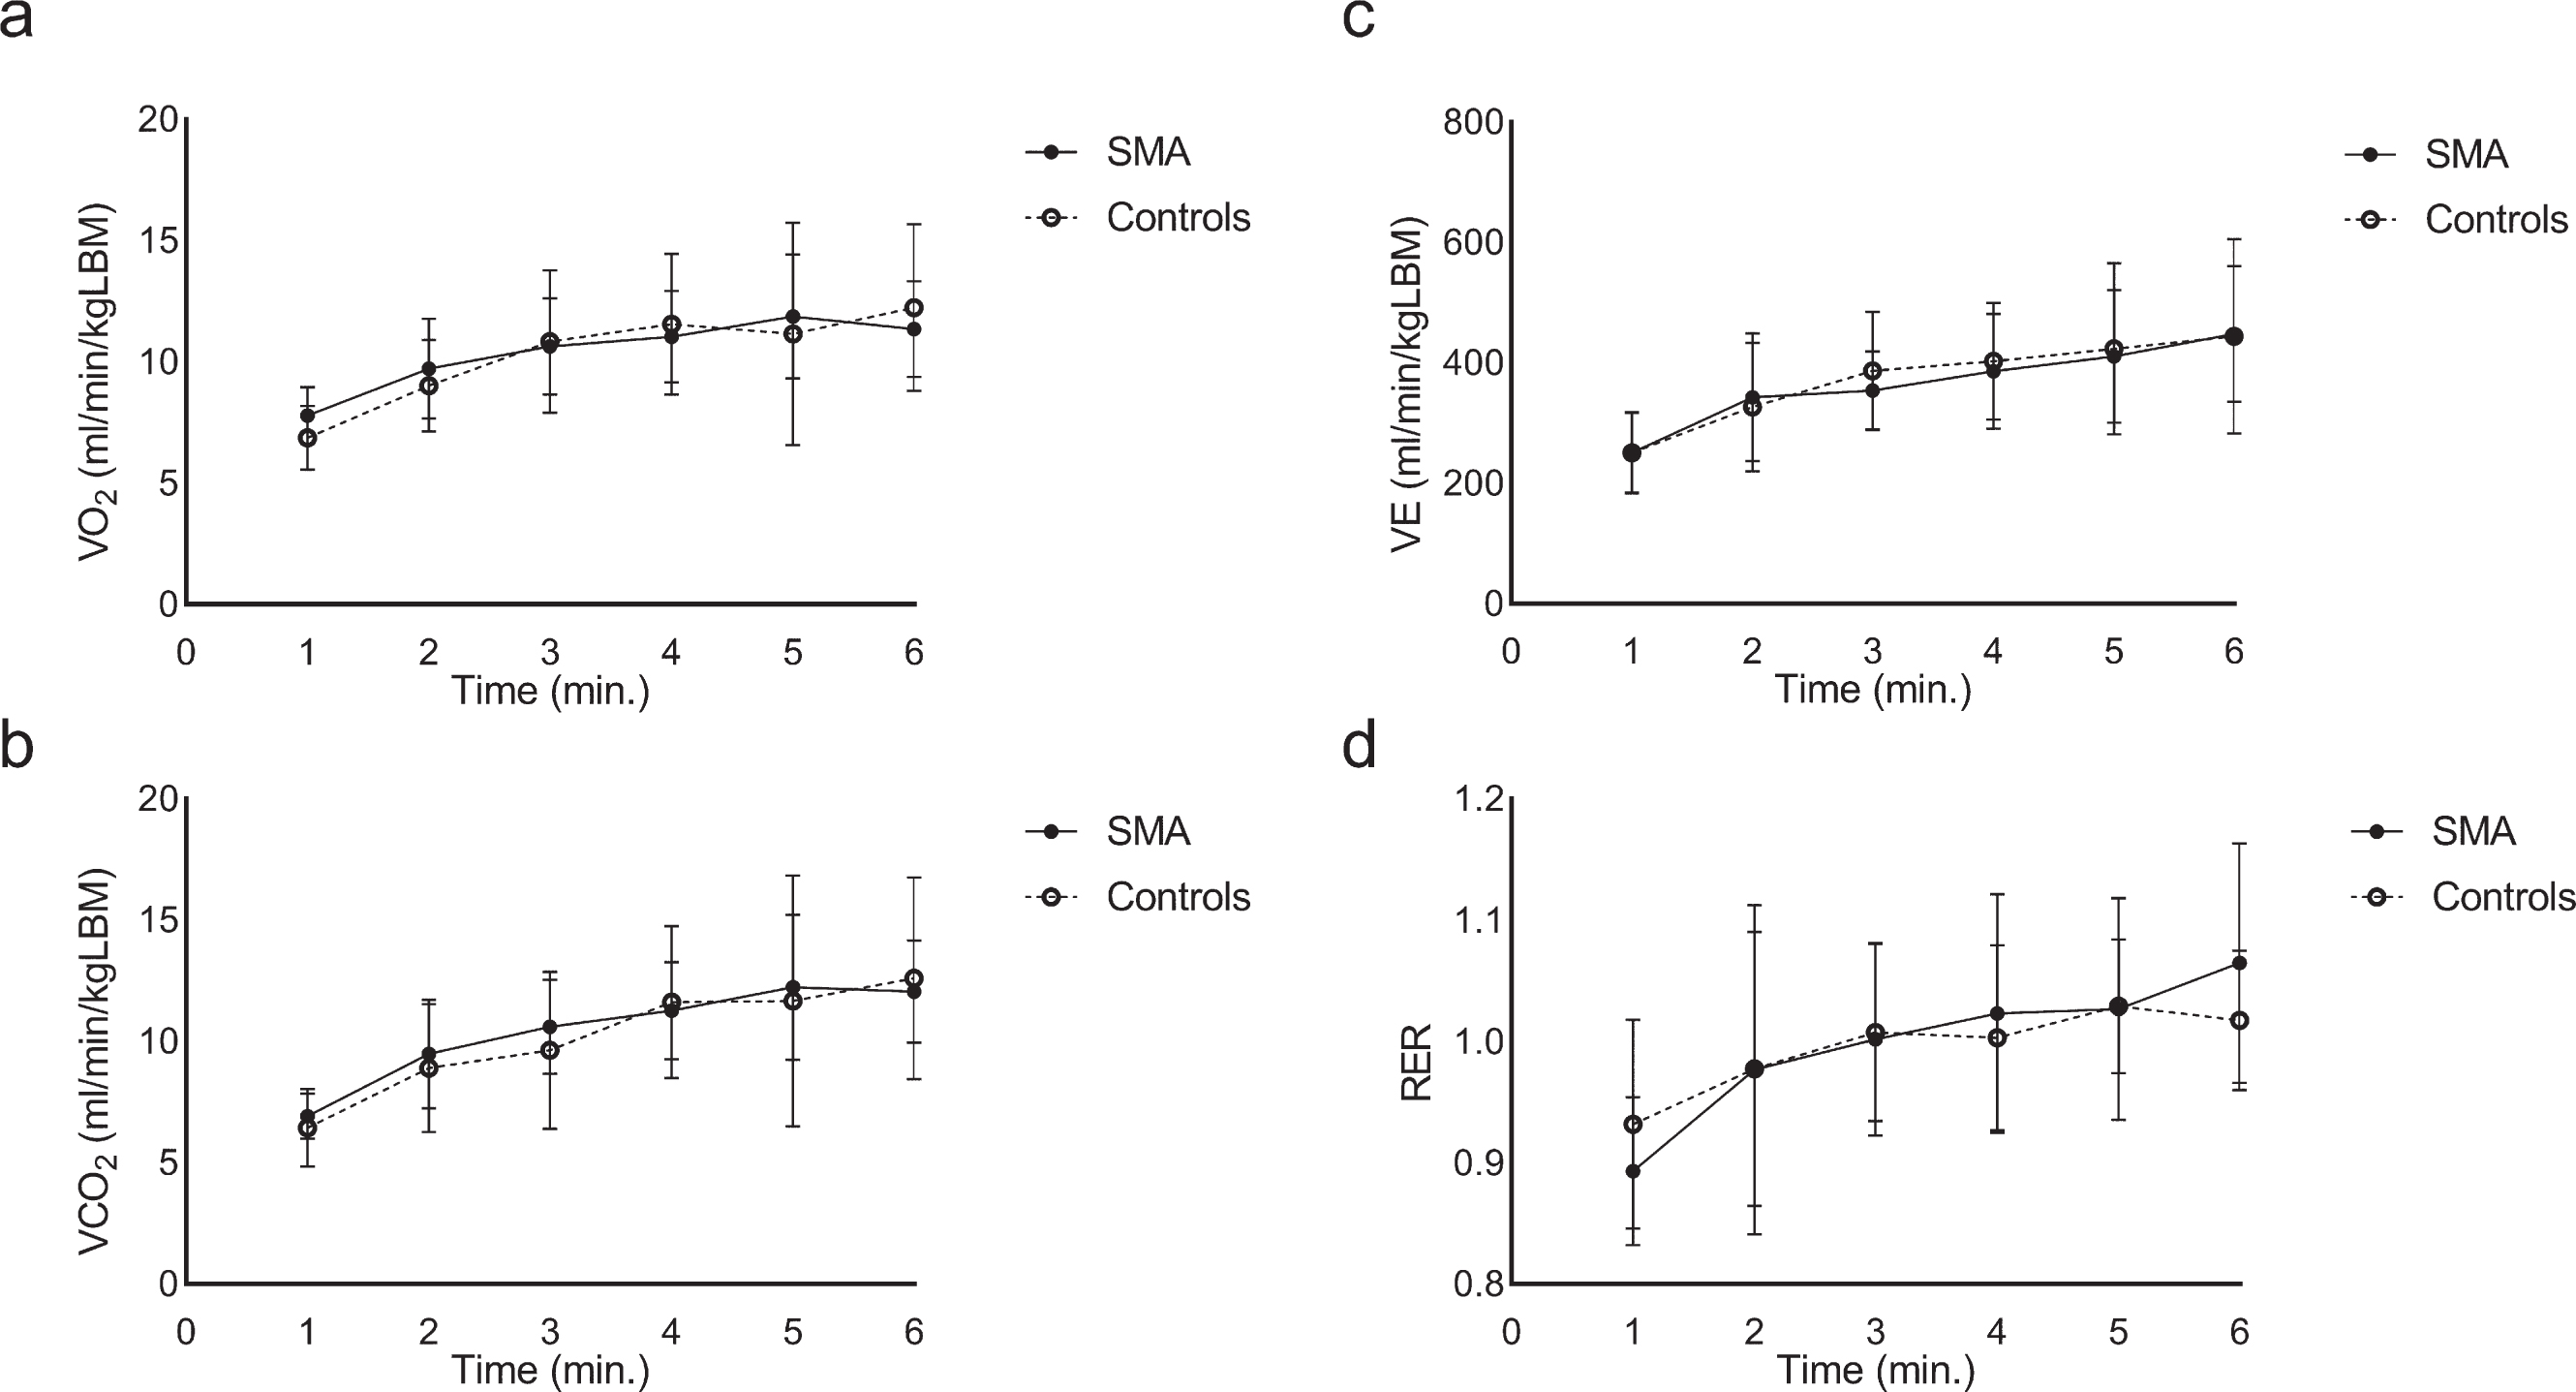
Respiratory gas exchange in patients with SMA (n = 6; closed symbols, solid lines) and controls (n = 12; open symbols, dotted lines) during the constant load phase of arm-cycling. a) Mean (SD) oxygen uptake per minute, corrected for lean body mass (LBM), in patients with SMA and controls. b) Mean (SD) carbon dioxide exhalation per minute, corrected for lean body mass (LBM), patients with SMA and controls. c) Mean (SD) ventilation per minute, corrected for lean body mass (LBM), patients with SMA and controls. d) Mean (SD) respiratory exchange ratio per minute in patients with SMA and controls.
Surface EMG dynamics during arm-cycling
We obtained sEMG datasets from 15 patients with SMA and their controls. Two m. flexor digitorum and one m. biceps- and triceps brachii datasets from one patient and control were excluded due to invalid normalization. Normalized RMS amplitudes of sEMG recordings immediately after onset of arm-cycling were increased in patients with SMA compared to controls in all sampled muscles (m. biceps brachii, m. triceps brachii and m. brachioradialis: p < 0.001, m. flexor digitorum: p < 0.05 (Fig. 5a, b and Supplementary Table 2). Normalized RMS amplitudes of sEMG recordings from the m. triceps brachii, m. brachioradialis and m. flexor digitorum increased identically in patients and controls as exercise progressed (Fig. 5a, c and Supplementary Table 3). The increase in normalized RMS amplitude for the m. biceps brachii as exercise progressed was significantly higher in patients than in controls (p < 0.01). The median frequency of the sEMG recordings immediately after onset of arm-cycling were not different between patients and controls for all sampled muscles (Fig. 5d, e and Supplementary Table 2). As exercise progressed, this parameter decreased identically (m. biceps brachii), less (m. brachioradialis and m. flexor digitorum, p < 0.05) or more (m. triceps brachii, p < 0.05) in patients compared to controls, respectively (Fig. 5d, f and Supplementary Table 3).
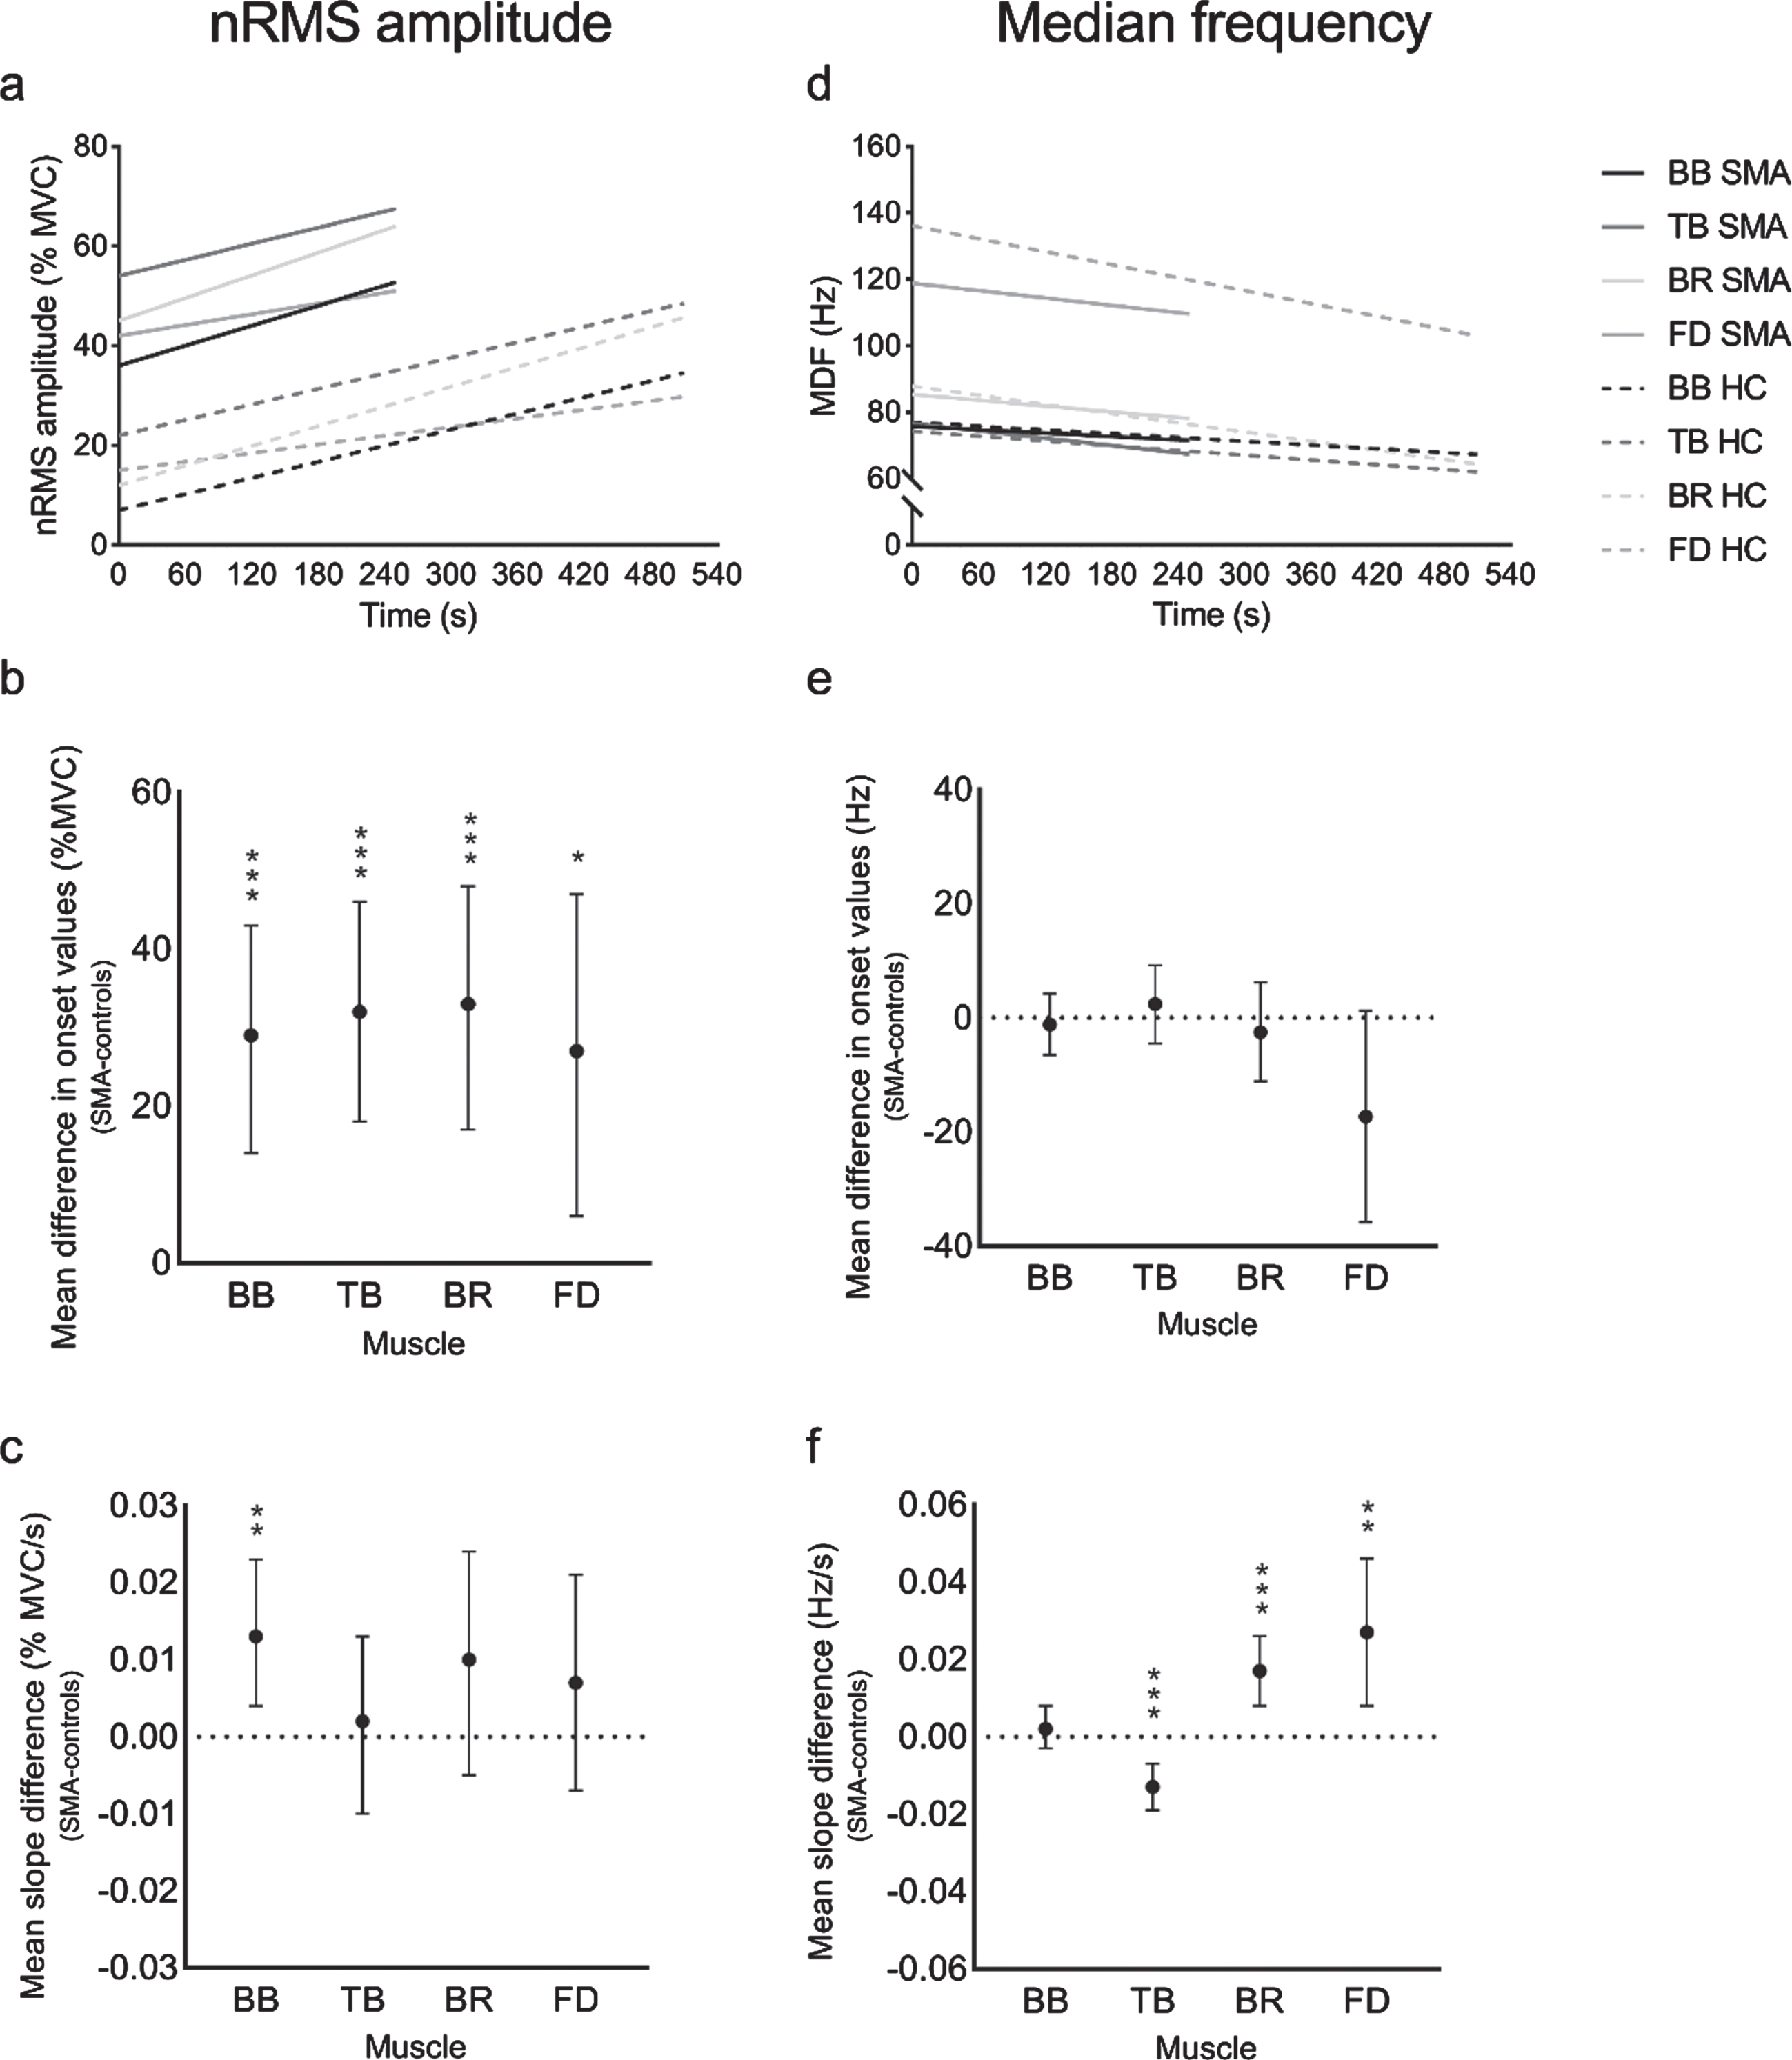
Linear mixed effect statistical models on sEMG variables in patients with SMA and controls. Linear mixed statistical models on normalized RMS amplitude (a) and median frequency (d) per muscle in patients with SMA (solid lines) and controls (HC: dotted lines) extrapolated to the mean cycle time to exhaustion. (b) Mean difference in normalized RMS amplitude values at onset of four muscles between patients with SMA and controls. (c) Mean differences in normalized RMS amplitude slopes of four muscles between patients with SMA and controls (e) Mean difference in median frequency at onset of four muscles between patients with SMA and controls. (f) Mean difference in median frequency slopes of four muscles between patients with SMA and controls. Error barrs indicate 95% confidence interval. BB, m. biceps brachii; TB, m. triceps brachii; BR, m. brachioradialis; FD, m. flexor digitorum; */**/*** = p < 0.05/ 0.01/ 0.001.
NIRS dynamics during arm-cycling
We obtained 10 complete datasets from the m. biceps brachii in patients with SMA and 8 complete datasets in controls. In the patient group we had one missing dataset and excluded four datasets (three due to insufficient signal to noise ratio and one due to drift, respectively). In the control group, we excluded seven datasets (one due to high skinfold thickness, five due to unstable baseline and one due to movement artefacts, respectively). Upon onset of arm-cycling we observed in all participants a steady increase in [766 + 859] nm signal with a response time of approximately 10 seconds, except in one patient with SMA (Fig. 6a and Supplementary Figure 3). The decrease in [766 + 859] nm signal in this particular patient (exercise duration 502s) was the result of an initial increase and a steep decrease in the last 50 secondsof exercise. We found no differences between groups in temporal change in [766 + 859] nm signals during arm-cycling (Fig. 6), p > 0.05. In comparison, the [766–859] nm signal dynamics were much more variable than the [766 + 859] nm signal dynamics (Supplementary Figure 3). No between-groups difference was found in temporal change in [766–859] nm signals during arm-cycling (Supplementary Figure 4), p > 0.05.
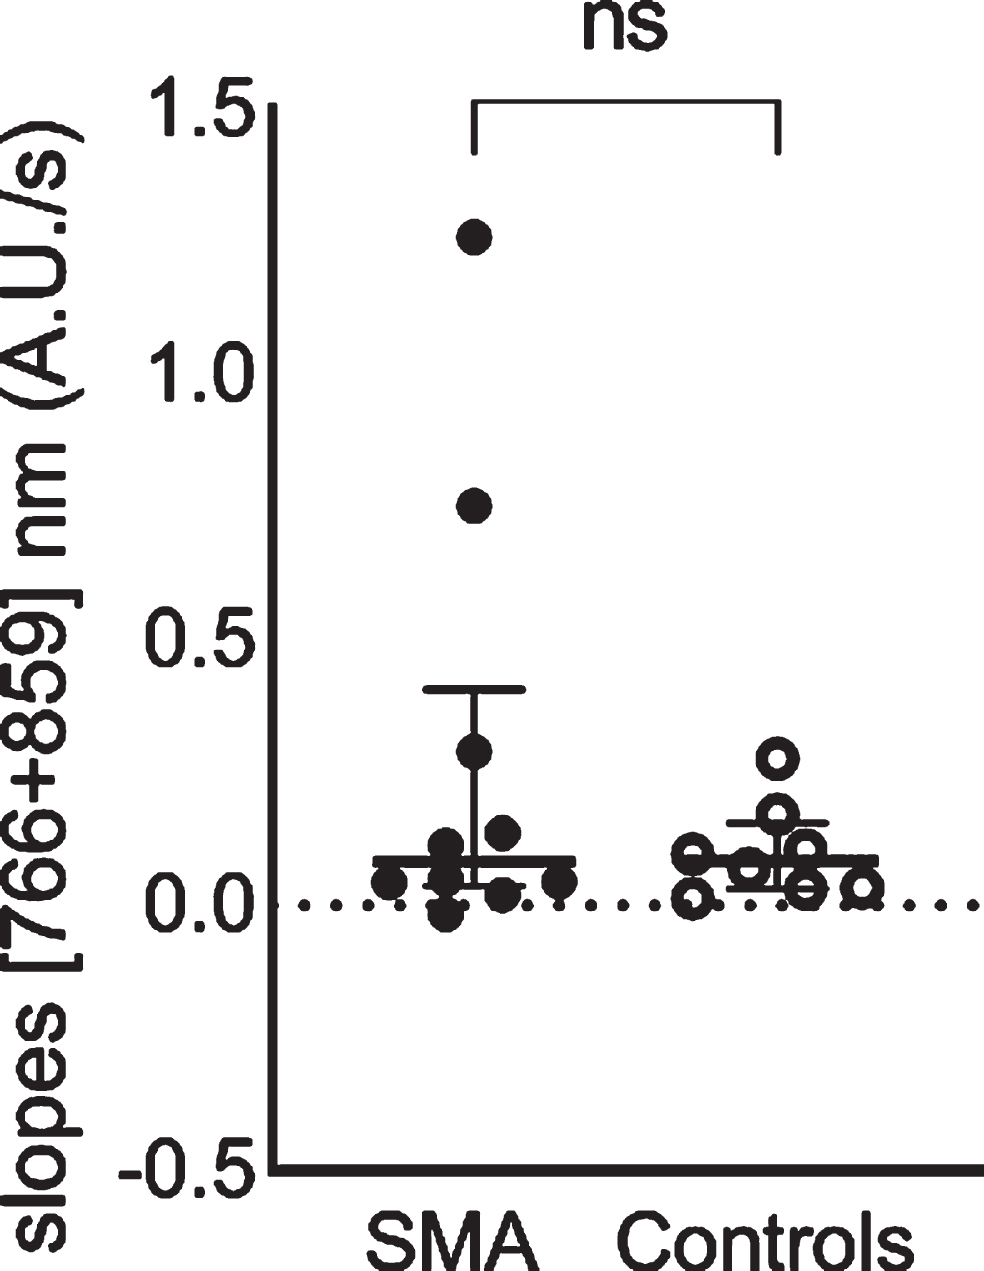
Non-significant difference in capillary recruitment during arm cycling between groups, indicated by slopes of the [766 + 859] nm continuous wave near-infrared spectroscopy signals. Median (IQR) and individual [766 + 859] nm slopes in patients with SMA (solid dots) and controls (open dots).
DISCUSSION
Patients with SMA in our cohort prematurely fatigued during execution of a maximal arm-cycling task, evidencing the symptoms of muscle weakness and exercise intolerance known for this disease. Below, we discuss what may be learned from our breath-by-breath gas exchange, sEMG and CW-NIRS measurements about the underlying mechanisms of premature mechanical failure of the arm muscles in the patients.
Cardiac and ventilatory work during arm-cycling
Our analysis revealed an association between exercise duration, muscle weakness and change in HR (Supplementary Figure 2). Specifically, in weak patients the change in HR in response to arm-cycling against the initially stationary workload of 5 W was more pronounced than in less affected patients or controls. Ventilatory work and work of breathing during maximal arm-cycling in patients was 1.8-fold and 1.6-fold higher than in controls (Fig. 3). In light of the fact that patients have lower arm muscle mass than controls this was a surprising finding. Our results may be explained two ways. Patients may have additionally recruited other muscles than strictly upper- and lower arm muscles during arm-cycling to compensate weakness of their arm musculature. Indeed, inspecting recorded videos we observed compensatory movements of the trunk and legs at the occurrence of fatigability (data not shown). This observation may also explain the higher change in HR in response to this heavy arm-cycling exercise task. Conversely, our results may also be explained by a white-to-red shift in myofiber type composition [17]. Since red myofibers rely on oxidative metabolism a shift towards this myofiber type may result in higher ventilatory work. However, during constant load arm-cycling we found no such pattern (Fig. 4) which provides no conclusive evidence on this matter. Here, we found, in fact, similar respiratory gas exchange findings between patients and controls. This may suggest limited sensitivity of whole body measurements to examine gas exchange at the level of the muscle when using an upper body exercise paradigm [31, 35].
A previous investigation in patients with SMA employing breath-by-breath gas analyses during exercise reported decreased peak oxygen uptake compared to controls [28]. This particular study employed a lower-body exercise paradigm. The authors suggested that the lack of a larger increase in oxygen uptake was a consequence of muscle atrophy and provided evidence for a mitochondrial dysfunction in SMA [28]. However, VO2peak corrected for peak workload during exercise in patients compared to controls in that particular study was threefold higher in patients than in controls [28] similar to our present finding in patients with SMA using an arm-cycling exercise task. This suggests that oxidative work capacity of the muscles in adolescent and adult patients with SMA normalized to peak work is, in fact, intact if not enhanced in these studied cohorts. Again, this hypothesis is supported by our previous finding of evidence for a white-to-red shift in myofiber type composition of upper arm muscles of the patients in our cohort [17]. In light of future studies on training interventions in SMA, our results suggest no energetic limitations in muscle of adolescent and adult patients with SMA types 3 and 4.
Motor unit recruitment capacity during arm cycling
Motor unit (MU) recruitment during a submaximal voluntary exercise task in patients with SMA has been investigated in two previous studies using sEMG [22, 23]. Any increase in firing frequency, recruitment of MUs, and/or MU synchronization during exercise may be reflected by an increase of the normalized RMS amplitude of the sEMG signal [25, 36]. We previously reported increasing RMS amplitudes and decreasing median frequencies in some, but not all, patients with SMA performing a submaximal endurance shuttle task involving shoulder and arm muscles, suggesting the presence of motor unit reserve capacity in individual patients [23]. Here, we observed in all patients a temporal increase of normalized RMS amplitudes during arm-cycling similar to controls (Fig. 5). This suggests residual motor unit recruitment capacity in upper extremity muscles in patients with SMA (Fig. 5). In comparison, an overall decrease of RMS amplitude of sEMG signals recorded from leg muscles during a six minute walk test in patients with SMA type 3 has been recorded previously [22]. Walking velocity, however, decreased during the test which may have confounded this observation [22].
As described above, we previously found evidence for a white-to-red shift in myofiber composition in upper arm muscles in this same cohort of patients [17]. Since muscle fiber conduction velocity correlates with muscle acidification [37] we therefore hypothesized to observe a diminished decrease in median frequency of the sEMG signal [24–26, 38]. Our present results on temporal changes in median frequencies testing this hypothesis are, however, inconclusive. Specifically, we found a 0.6-fold smaller decrease in median frequency of the sEMG signal from the m. brachioradialis and m. flexor digitorum in patients compared to controls, but not in the m. biceps- and m. triceps brachii. Further studies are needed to test the hypothesis, preferably using simultaneous 31Phosphorus Magnetic Resonance Spectroscopy and sEMG data acquisition. In principle such measurements are feasible [39].
This study has provided no new insight into the underlying mechanisms of premature mechanical failure of the arm muscles of our cohort of patients with SMA during execution of a maximal arm-cycling task. Based on sEMG data we suggest that muscle function was, at least, not the primary limiting factor. As presented in Fig. 5, the linear mixed effect models on RMS amplitudes and median frequencies extrapolated to the mean cycle time to exhaustion in patients seem to end abruptly. While the patients performed the exercise task at higher percentages of MCV, we did not observe any abnormal sEMG dynamics compared to controls. Therefore, we suggest that future investigations should perhaps focus on another link in the chain, i.e. failure of neuromuscular transmission at the neuromuscular junction itself, previously associated with exercise intolerance and located proximal to the muscle, which may primarily affect exercise duration [40–47].
Comparison of our results to observations in other neuromuscular diseases such as Duchenne Muscular Dystrophy and Amyotrophic Lateral Sclerosis reveals similar observations, i.e. higher normalized RMS amplitude onset values and a reduced shift in median frequencies [48–50]. To the best of our knowledge no observations of temporal changes of normalized RMS amplitudes providing insight into any residual motor unit recruitment capacity during dynamic exercise in neuromuscular diseases other than SMA have been reported. Further research on the latter is needed in this patient population since the availability of any residual MU recruitment capacity suggest an opportunity for training interventions.
Capillary recruitment capacity during arm-cycling
Studies in SMA mouse models have reported evidence for local vascular system defects which may affect skeletal muscle oxygen supply [18–21]. To provide insight into muscle capillary recruitment in vivo, we used non-invasive CW-NIRS. This technique uses specific wavelengths, [766] nm and [859] nm, of infrared light and the difference in absorption characteristics of oxygenated and deoxygenated hemoglobin [51–53]. A normal physiological response during exercise shows an overall increase in the sum of the two signals as a consequence of exercise-induced capillary recruitment in the active muscle [54–56]. Montes and colleagues first applied NIRS to study vascular functional abnormalities in upper leg muscle in a cohort of 19 adolescent and adult patients with SMA and reported inadequate capillary recruitment [28]. Here, we found no such evidence in upper arm muscles in a similar but different cohort of patients. Specifically, we found an overall increase in [766 + 859] nm signals and decrease in [766–859] nm signals with no differences between the patient and control group (Fig. 6 and Supplementary Figure 3) also suggesting that capillary recruitment was not the primary limiting factor of premature mechanical failure. Importantly, these NIRS findings are consistent with our previous finding of normal, if not faster, aerobic recovery of phosphocreatine stores in these muscles following arm-cycling in this same cohort of patients [17]. Whereas NIRS, in particular when using a continuous wave light source, is a technique with a number of methodological limitations [29, 57–59] no such methodological concerns apply to in vivo 31Phosphorus Magnetic Resonance Spectroscopy assay of muscular oxidative ATP synthesis capacity [60].
Limitations and outlook
The arm-cycling exercise set-up used in the present study has some technological limitations that should be considered when assessing the results. First of all, the minimal workload of the arm-cycling ergometer at 90 rpm is 5 W [31]. As such, seven patients with SMA were unable to perform arm-cycling for more than three minutes against the default workload [31] as a result of muscle weakness (Fig. 2). Consequently, data of these patients had to be excluded for analysis of breath-by-breath gas exchange. Nevertheless, individual CW-NIRS results of these particular patients are scattered around the group median justifying group analysis of these parameters. Secondly, atrophy of the m. triceps brachii was much more pronounced than its antagonist m. biceps brachii in this patient cohort [17], lowering its contribution to the cycling movement. This may have contributed to the 1.2-fold higher increase in RMS amplitudes found in the m. biceps brachii of patients compared to controls. Third, the factors examined in this study in mildly affected patients with SMA may possibly still contribute to exercise intolerance in severely affected patients. As, such, future studies employing a voluntary arm-cycling exercise paradigm, for example to evaluate the outcome of exercise training, should use ergometers with even lower ‘idle’ workloads than the ergometer used here (~5W). This would additionally provide the opportunity to study exercise intolerance in more severely affected patients with SMA. Preserving, if not expanding motor unit and capillary recruitment capacity of arm muscles, may present a potential therapeutic target. Specifically, high intensity exercise training in a mouse SMA model reduced fatigability, protected the integrity of the NMJ and additionally reduced motor neuron death and enhanced cross sectional area of large myofibrils [16]. Furthermore, as suggested above, beneficial effects of pharmaceuticals that directly target the NMJ, such as pyridostigmine, may also be investigated using this platform in futurestudies.
Footnotes
ACKNOWLEDGMENTS
The authors would like to thank all participants who participated in this study. This work was supported by grants from Prinses Beatrix Spierfonds (W.OR17-05), Stichting Spieren voor Spieren and Zwaluwen Jeugd Actie. The Spieren voor Spieren Inspanningslab at the University Medical Center Utrecht was funded by Stichting Spieren voor Spieren.
CONFLICTS OF INTEREST
WLP is a member of the scientific advisory board of SMA Europe and has served as an ad hoc member of the scientific advisory boards of Biogen and Avexis and as a member of a data monitoring committee for Novartis. BB is a member of the scientific advisory board of Scholar Rock. Their employer receives fees for SMA-related consultancy activities. WLP, BB and JALJ obtained research grants from non-profit foundations Prinses Beatrix Spierfonds and Stichting Spieren voor Spieren. The other authors have no conflict of interest to report.