
Abstract
Background:
Muscles of boys with Duchenne muscular dystrophy (DMD) are progressively replaced by fatty fibrous tissues, and weakness leads to loss of ambulation (LoA). Step activity (SA) monitoring is a quantitative measure of real-world ambulatory function. The relationship between quality of muscle health and SA is unknown in DMD.
Objective:
To determine SA in steroid treated boys with DMD across various age groups, and to evaluate the association of SA with quality of muscle health and ambulatory function.
Methods:
Quality of muscle health was measured by magnetic resonance (MR) imaging transverse magnetization relaxation time constant (MRI-T2) and MR spectroscopy fat fraction (MRS-FF). SA was assessed via accelerometry, and functional abilities were assessed through clinical walking tests. Correlations between SA, MR, and functional measures were determined. A threshold value of SA was determined to predict the future LoA.
Results:
The greatest reduction in SA was observed in the 9– < 11years age group. SA correlated with all functional and MR measures.10m walk/run test had the highest correlation with SA. An increase in muscle MRI-T2 and MRS-FF was associated with a decline in SA. Two years prior to LoA, SA in boys with DMD was 32% lower than age matched boys with DMD who maintained ambulation for more than two-year period. SA monitoring can predict subsequent LoA in Duchenne, as a daily step count of 3200 at baseline was associated with LoA over the next two-years.
Conclusion:
SA monitoring is a feasible and accessible tool to measure functional capacity in the real-world environment.
INTRODUCTION
Duchenne muscular dystrophy (DMD) is the most common debilitating neuromuscular disorder with a birth prevalence of 15.9–19.8 cases per 100,000 live male births [1–3]. Boys with DMD develop muscle weakness and difficulty performing functional activities [4]. During the course of the disease, muscles are replaced by fatty fibrous tissue [4–7]. Typically, more than 70% of boys with DMD lose independent ambulation by 10 to 14 years [6, 8]. Corticosteroids have shown to be beneficial with prolonging ambulation in DMD, and recent interventions aimed at restoring dystrophin have shown considerable promise and may also delay loss of ambulation [8–11]. An understanding of the relationship between muscle health and real-world step activity is important to predict the impact of novel therapeutics on community ambulation and real-world functional ability.
Step activity (SA) is an outcome measure that evaluates physical activity, and accelerometry is a valid and reliable method to quantify physical activity level in DMD [12–16]. Physical activity measured via an accelerometer has also been used as an exploratory endpoint in a therapeutic trial in DMD [17]. Some initial studies have demonstrated accelerometry to be a useful marker of disease progression complementary to the current standard of functional assessment [12–14]. McDonald et al demonstrated that boys with DMD took fewer steps and had more inactive minutes compared to age-matched controls [12]. They also reported SA correlated with knee extensor strength and percent body fat. Davidson et al monitored step count in ambulatory boys with DMD and found it was strongly correlated with six-minute walk test distance (6MWD) [13]. A one-year study by Fowler et al reported that as age advances, boys with DMD had a significant decline in strides/day, and the change in strides correlated with changes in the 10 m walk/run test (10 m w/r) [14]. Recent work from our laboratory recommends using five days of activity monitoring to estimate step activity in boys with DMD [18], and we also reported that younger boys with DMD were more active than the elder boys. In addition,10 m w/r was the most important independent predictor of step activity [18]. Therefore, there is considerable promise in SA being predictive of function and overall muscle health in DMD.
Magnetic resonance (MR) imaging-derived transverse magnetization relaxation time constant (MRI-T2) and MR spectroscopy-derived fat fraction (MRS-FF), have been shown to be valid noninvasive biomarkers to monitor disease progression in DMD [7, 19–22]. MRI-T2 is considered as a global non-specific measure of muscle health because it is influenced by both edema and fibrofatty infiltration [23, 24], while MRS-FF is a more direct measure of fatty infiltration [19, 25]. Quality of muscle health measured by quantitative MRI-T2 and MRS-FF is strongly correlated to functional performance in DMD [20, 24–28]. Loss of function is also associated with muscle quality. For example, a vastus lateralis (VL) FF of 0.40, and VL MRI-T2 of 60 ms have been reported as approximate lower thresholds of muscle pathology associated with loss of ambulation in DMD [26]. These measures may also be sensitive to subtle declines in muscle quality, often referred to as “subclinical disease progression”. A multicenter longitudinal study in DMD by our group demonstrated that MRI-T2 values increased in lower extremity muscles even when the boys’ functional performance on the six-minute walk test (6MWT) was stable or improved [20]. MR modeling of disease trajectory in DMD reported that disease progression rate differed between muscles, and the age when VL and soleus (SOL) FF reach half-maximum muscle involvement is strongly associated with LoA [22]. Collectively, MR measures have been proposed as a sensitive marker of disease progression in DMD.
No studies have examined the association of SA with quality of muscle health, as measured by MRI-T2 and MRS-FF, in DMD. Therefore, the primary aims of the study were to: (1) determine the correlation of SA with quality of lower extremity muscle health using MRI-T2, MRS-FF, and functional performance (i.e, 6MWT and 10 m w/r test) in a cross-sectional design; (2) examine how SA is related to MR measures of muscle health and functional performance; (3) and to evaluate SA two years prior to loss of ambulation in DMD. We hypothesized that SA in ambulatory boys with DMD decreases with disease progression and is correlated with quality of lower extremity muscles and functional performance. Secondary aims included comparison of step activity across various age groups in boys with DMD at baseline, and to determine longitudinal changes in SA in a subset of participants.
MATERIALS AND METHODS
Steroid treated boys with DMD (ages 5–15 years at enrollment; n = 114) and unaffected controls (ages 5–15; n = 24) were recruited from three participating research institutes associated with the ImagingDMD natural history study. Institutional review board approval was obtained at each institution, and parental consent and child assent were obtained. Inclusion criteria were a genetic diagnosis of DMD with clinical symptoms before five years of age, the ability to walk at least 100m independently, and the ability to ascend four steps.
Primary outcome measures included SA, MRI-T2 of lower extremity muscles, MRS-FF of VL and SOL, 6MWD, and 10 m w/r test. Secondary outcome measures were body mass index (BMI), % predicted 6MWD, and composite measures of MRI-T2. Height and weight were documented at each visit to calculate BMI (BMI = weight in kg / height in m2). Controls’ SA were assessed only at baseline (BL) for comparison.
SA was operationally defined as the average step count taken on any combination of five days in a week irrespective of weekend or weekdays. SA was assessed via waist worn accelerometer (GT3X Actigraph, Actigraph Corporation, Pensacola, FL, USA). To maintain consistency in data acquisition across all individuals, participants were asked to wear the device on the right side of the waist [18, 30]. The participants wore the accelerometer for at least 10 waking hours for 7 consecutive days in their home and community environment following an annual research visit [18]. To enhance compliance, a phone call was made to the parent on the first day on which the child began to wear the accelerometer and again seven days later. Upon completion of the seven days, participants returned the accelerometers to the research institution via mail, and physical activity data were uploaded via ActiLife software (Actigraph Corporation, Pensacola, FL, USA). Analyses were conducted for all participants who had at least 10 hours/day of wear time for any combination of five days in a week. For those with six days of consecutive data, we excluded the first day of the data collection. We excluded both the first and last day of data for those with seven consecutive days of data.
The MR data acquisition methods and analyses used in this study have been published elsewhere [24, 31]. In short, MR procedures were performed using whole body 3T MRI instruments [University of Florida (UF) - Philips Achieva Quasar Dual 3T, Oregon Health & Science University (OSHU)- Siemens Magnetom TIM Trio 3T, Children’s Hospital of Philadelphia (CHOP)- Siemens Magnetom Verio 3T]; different coil configurations were used across centers [31]. Subjects were asked to avoid any excessive physical activity for two days prior to the MR scans. Participants laid in a supine position in the magnet without the use of sedation. T2-weighted multi-slice spin echo sequences (slice thickness = 7 mm, TR = 3000 ms) without fat suppression were acquired for MRI-T2 data. T2 maps were derived using TEs of 40, 60, 80, and 100 ms with a mono-exponential decay method on a voxel-wise basis using custom written Interactive Data Language software (IDL, Version 8.1, Exelis Visual Information Solution, Boulder, CO). Quantitative MRI-T2 was determined by tracing muscles on T2 maps. Muscles evaluated included vastus lateralis (VL), biceps femoris long head (BFLH), gracilis (GRA), peroneals (PER), medial gastrocnemius (MG), soleus (SOL), tibialis anterior (TA) and tibialis posterior (TP). These muscles were selected based on the severity of involvement in DMD from our previous studies [7, 26]. Analysis was performed using axial images, and the region of interest was carefully drawn within the borders of muscle to avoid any intermuscular fascia. The mean T2 reported was the average of all voxels in the muscle of the three consecutive slices. To consider the heterogeneity of the disease [19, 24], composite biomarkers were explored in DMD to monitor the disease progression [32, 33]. Therefore, we analyzed the composite T2 value of the upper and lower leg muscles [weighted T2 of (VL + BFLH + GRA + PER + MG + SOL + TA + TP)/8]. Composite MRI-T2 can capture multiple muscles at potentially different stages of disease progression [34].
Single voxel 1H-MRS was used to quantify intramuscular FF in the VL and SOL. Spectra were acquired using stimulated echo acquisition mode (STEAM) with TR = 3,000 ms, TE = 108 ms. MRS-FF (defined as fat/ [fat + water signal]) was determined using area integration of the phase corrected spectra from primary lipid (0.5–2.75ppm) and 1H2O (4.3–5.1ppm) regions of the spectrum, with signal correction for T1 and T2 relaxation [25].
To assess functional walking ability performance, we used the 10m w/r test [35] and 6MWT [36]. The goal of the 10m w/r test is to determine how fast an individual with DMD can travel 10m independently. Participants wore their walking shoes or regular sneakers and performed three trials and the fastest time was used for analysis as done previously [18, 35]. The 6MWT was performed, and to adjust for the effect of growth and maturation on 6MWT, we calculated % predicted 6MWD [% predicted 6MWD = (participant’s 6MWD/ normative 6MWD) X100; normative 6MWD(m) = 196.72 + (39.81 x age (years)) –(1.36 x age2 (years)) + (132.28 x height)] [37, 38]. We classified the boys into three groups based on ther performance on 10m w/r test time (< 5 sec, 5–8 sec and > 8 sec) [26, 35] and 6MWD (< 300 m, 300–400 m and > 400 m) [39]. We also examined the ambulatory status of the boys at each annual visit until two-years after the initial visit. Loss of ambulation (LoA) is operationally defined as the first annual visit when the participant was not able to complete a 10 m w/r test independently within forty-five seconds [22, 35].
Descriptive statistics were used to summarize the participants’ demographic information. For the analysis of age-related differences in SA, we square root transformed the raw data of SA. The transformed step count more closely follows a normal distribution and the variance does not depend on the mean. To examine the SA longitudinally among different age groups, a multivariate normal model was fit with an autoregressive-1 heterogenous covariance matrix; Bonferroni pairwise comparisons were used to assess the significance of differences between age groups. Spearman’s rank correlation coefficient, ρ, was computed to examine the association of SA with MR measures of muscle health, BMI, and functional performance. Standard errors and confidence intervals were computed using the bootstrap (1000 bootstrap samples; sampling subjects not data points) given many subjects provided more than one data point. To test for differences in SA among different MR measures of muscle health (VL MRI-T2 and FF) and functional groups (10 m w/r test time: < 5 sec, 5–8 sec and > 8 sec; and 6MWD: < 300 m, 300–400 m and > 400 m), we calculated the differences in group means; statistical significance was determined by whether the 95% bootstrapped confidence interval excluded zero. We used the Wilcoxon rank sum test to compare the SA in the two years prior to LoA with age-matched ambulatory boys with DMD who did not lose ambulation within two years. Statistical analyses were performed with SPSS (IBM SPSS Statistics V 25.0, Armonk, NY, USA) and GraphPad Prism (version 9.00, San Diego, CA, USA). Statistical significance was set at an alpha level of 0.05 for all analyses.
RESULTS
Demographic information
Out of the 114 ambulatory boys with DMD who enrolled in this study, we received valid SA data from 103 boys at baseline. In addition, we evaluated 57 of the boys at one year and 29 boys at a two-year follow up visit. The flow chart [Supplementary Figure 1] lists the reasons for patients drop out during annual visits. Across all MR and functional outcome measures, 94% yield valid data, and 6% were invalid data due to behavioral issues, motion artifact, or the participant or parent decided not to perform a specific test. Invalid data were not included in the analysis. The cohort characteristics are given in Table 1. All boys with DMD were taking corticosteroids as a part of their standard of care but the steroid regimen was determined by each participant’s own medical team and was independent of this research design. Our DMD cohort consisted of the following genetic mutations: deletion-60%, duplication-14%, point mutation 22%, other-3%. In general, our cohort at baseline appears to be similar to that described previously for DMD in this age range [19, 35].
Anthropometric, functional performance, and MR characteristics
Data reported as mean ± SD. BMI = body mass index; N/A = not applicable; 6MWD = six-minute walk test distance;10m w/r = 10meter walk/run test time; MRI-T2 = magnetic resonance imaging transverse relaxation time constant; MRS-FF = magnetic resonance spectroscopy fat fraction; VL = vastus lateralis; BFLH = biceps femoris long head; GRA = gracilis; PER = peroneus; MG = medial gastrocnemius; SOL = soleus; TA = tibialis anterior; TP = tibialis posterior; FF = fat fraction; n = the number of participants.
Age related differences in step activity
At BL, the average SA of the entire DMD cohort was 52% less than the control group (p < 0.0001) [Table 1]. From 9 years onwards, there is a steep decline in SA in boys with DMD [Fig. 1a]. To examine SA across ages, participants were stratified into 4 different groups at BL: 5–< 7 years, 7–< 9 years, 9–< 11years, and 11–< 13 years [35]. We only had two participants with DMD in the 13–<15 years age group, and they were excluded from statistical analysis due to limited sample size. A one-way ANOVA [F (3,97) = 9.44, p < 0.0001] with Tukey’s multiple comparison test was used to find the difference in SA across age groups in DMD. Relative to the 5–< 7 years group (6,035±1778), average step count was reduced by ∼1,270 for those in 9–< 11 years of age (4,766±1,544) and by ∼2,490 for those in 11–<13 years of age (3,547±1,310) [Fig. 1b]. Since the sample size is limited in control group, we did not perform a statistical comparison of SA between control and DMD across various age groups [Supplementary Table 1].
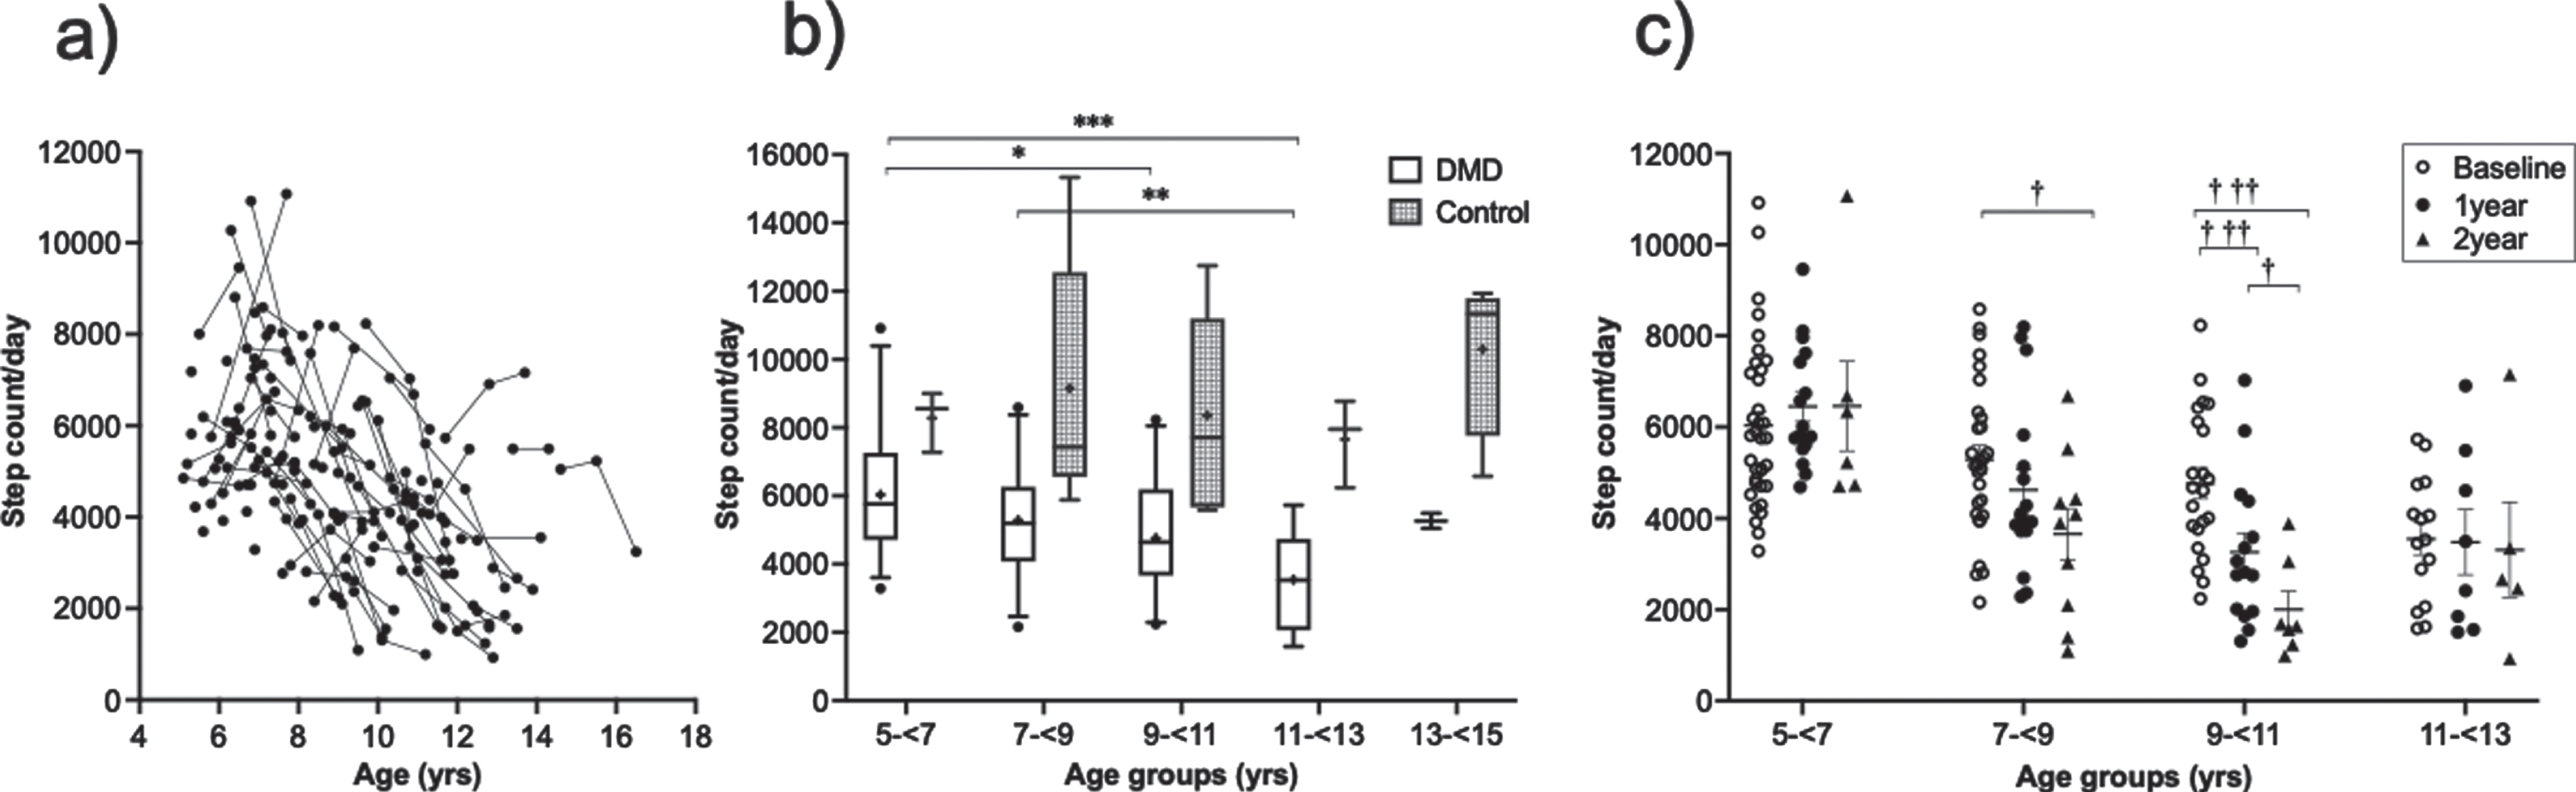
Step activity at various age. (a) Trajectory of step activity from individual boys with DMD of various age. (b) Step activity across various age groups in DMD and in control at baseline. Since the sample size is less in control group, no comparison was made between DMD and control across various age groups (whiskers represent the 5-95% percentile, the + indicates the mean of each group, a * indicates differences between each age group at baseline for boys with DMD, *p < 0.05, **p < 0.01, ***p < 0.001). (c) Longitudinal step activity across various age groups in DMD (Data represented as mean ± SEM; † indicates differences in SA in each age group over time with respect to baseline: † p < 0.05, ††† p < 0.001).
SA in different age groups over time was analyzed in the subset of participants with DMD who had two years of data (n = 29). A multivariate model followed by Bonferroni pairwise comparisons showed that SA was significantly decreased over time in the 7–< 9 years and in the 9–< 11 years age groups [Fig. 1c]. In 7–< 9 years of age group, a 36% decline (p = 0.006) in step count/day occurred over two years from BL. We found the highest reduction in SA in the 9–< 11years of age group, which had a 35% decline (p < 0.0001) over one-year and an 81% decline (p = 0.0007) over two years.
Association of step activity with MR measures of muscle health and functional performance
SA had moderate correlation with all MR and functional measures except MRI-T2 of the TP [Table 2]. Among MR measures, MRI-T2 of the VL had the highest correlations with SA (ρ= –0.50). Among functional tests, 10 m w/r showed the highest correlation with SA (ρ= –0.56) [Fig. 3].
Relationship of step activity with MR measures and functional performance
The correlation between SA and MR measures, and functional tests are represented by the correlation coefficient, ρ, and the 95% bootstrap confidence intervals are given in the parentheses. MRI-T2 = magnetic resonance imaging transverse relaxation time constant; MRS-FF = magnetic resonance spectroscopy fat fraction; VL = vastus lateralis; BFLH = biceps femoris long head; GRA = gracilis; PER = peroneus; MG = medial gastrocnemius; SOL = soleus; TA = tibialis anterior; TP = tibialis posterior; FF = fat fraction; 10m w/r = 10meter walk/ run test time; 6MWD = six-minute walk test distance; BMI = body mass index; n = the number of XY pairs for each given combination. All correlations (except TP) were significant with the 95% bootstrap confidence intervals excluding zero. ns = nonsignificant.
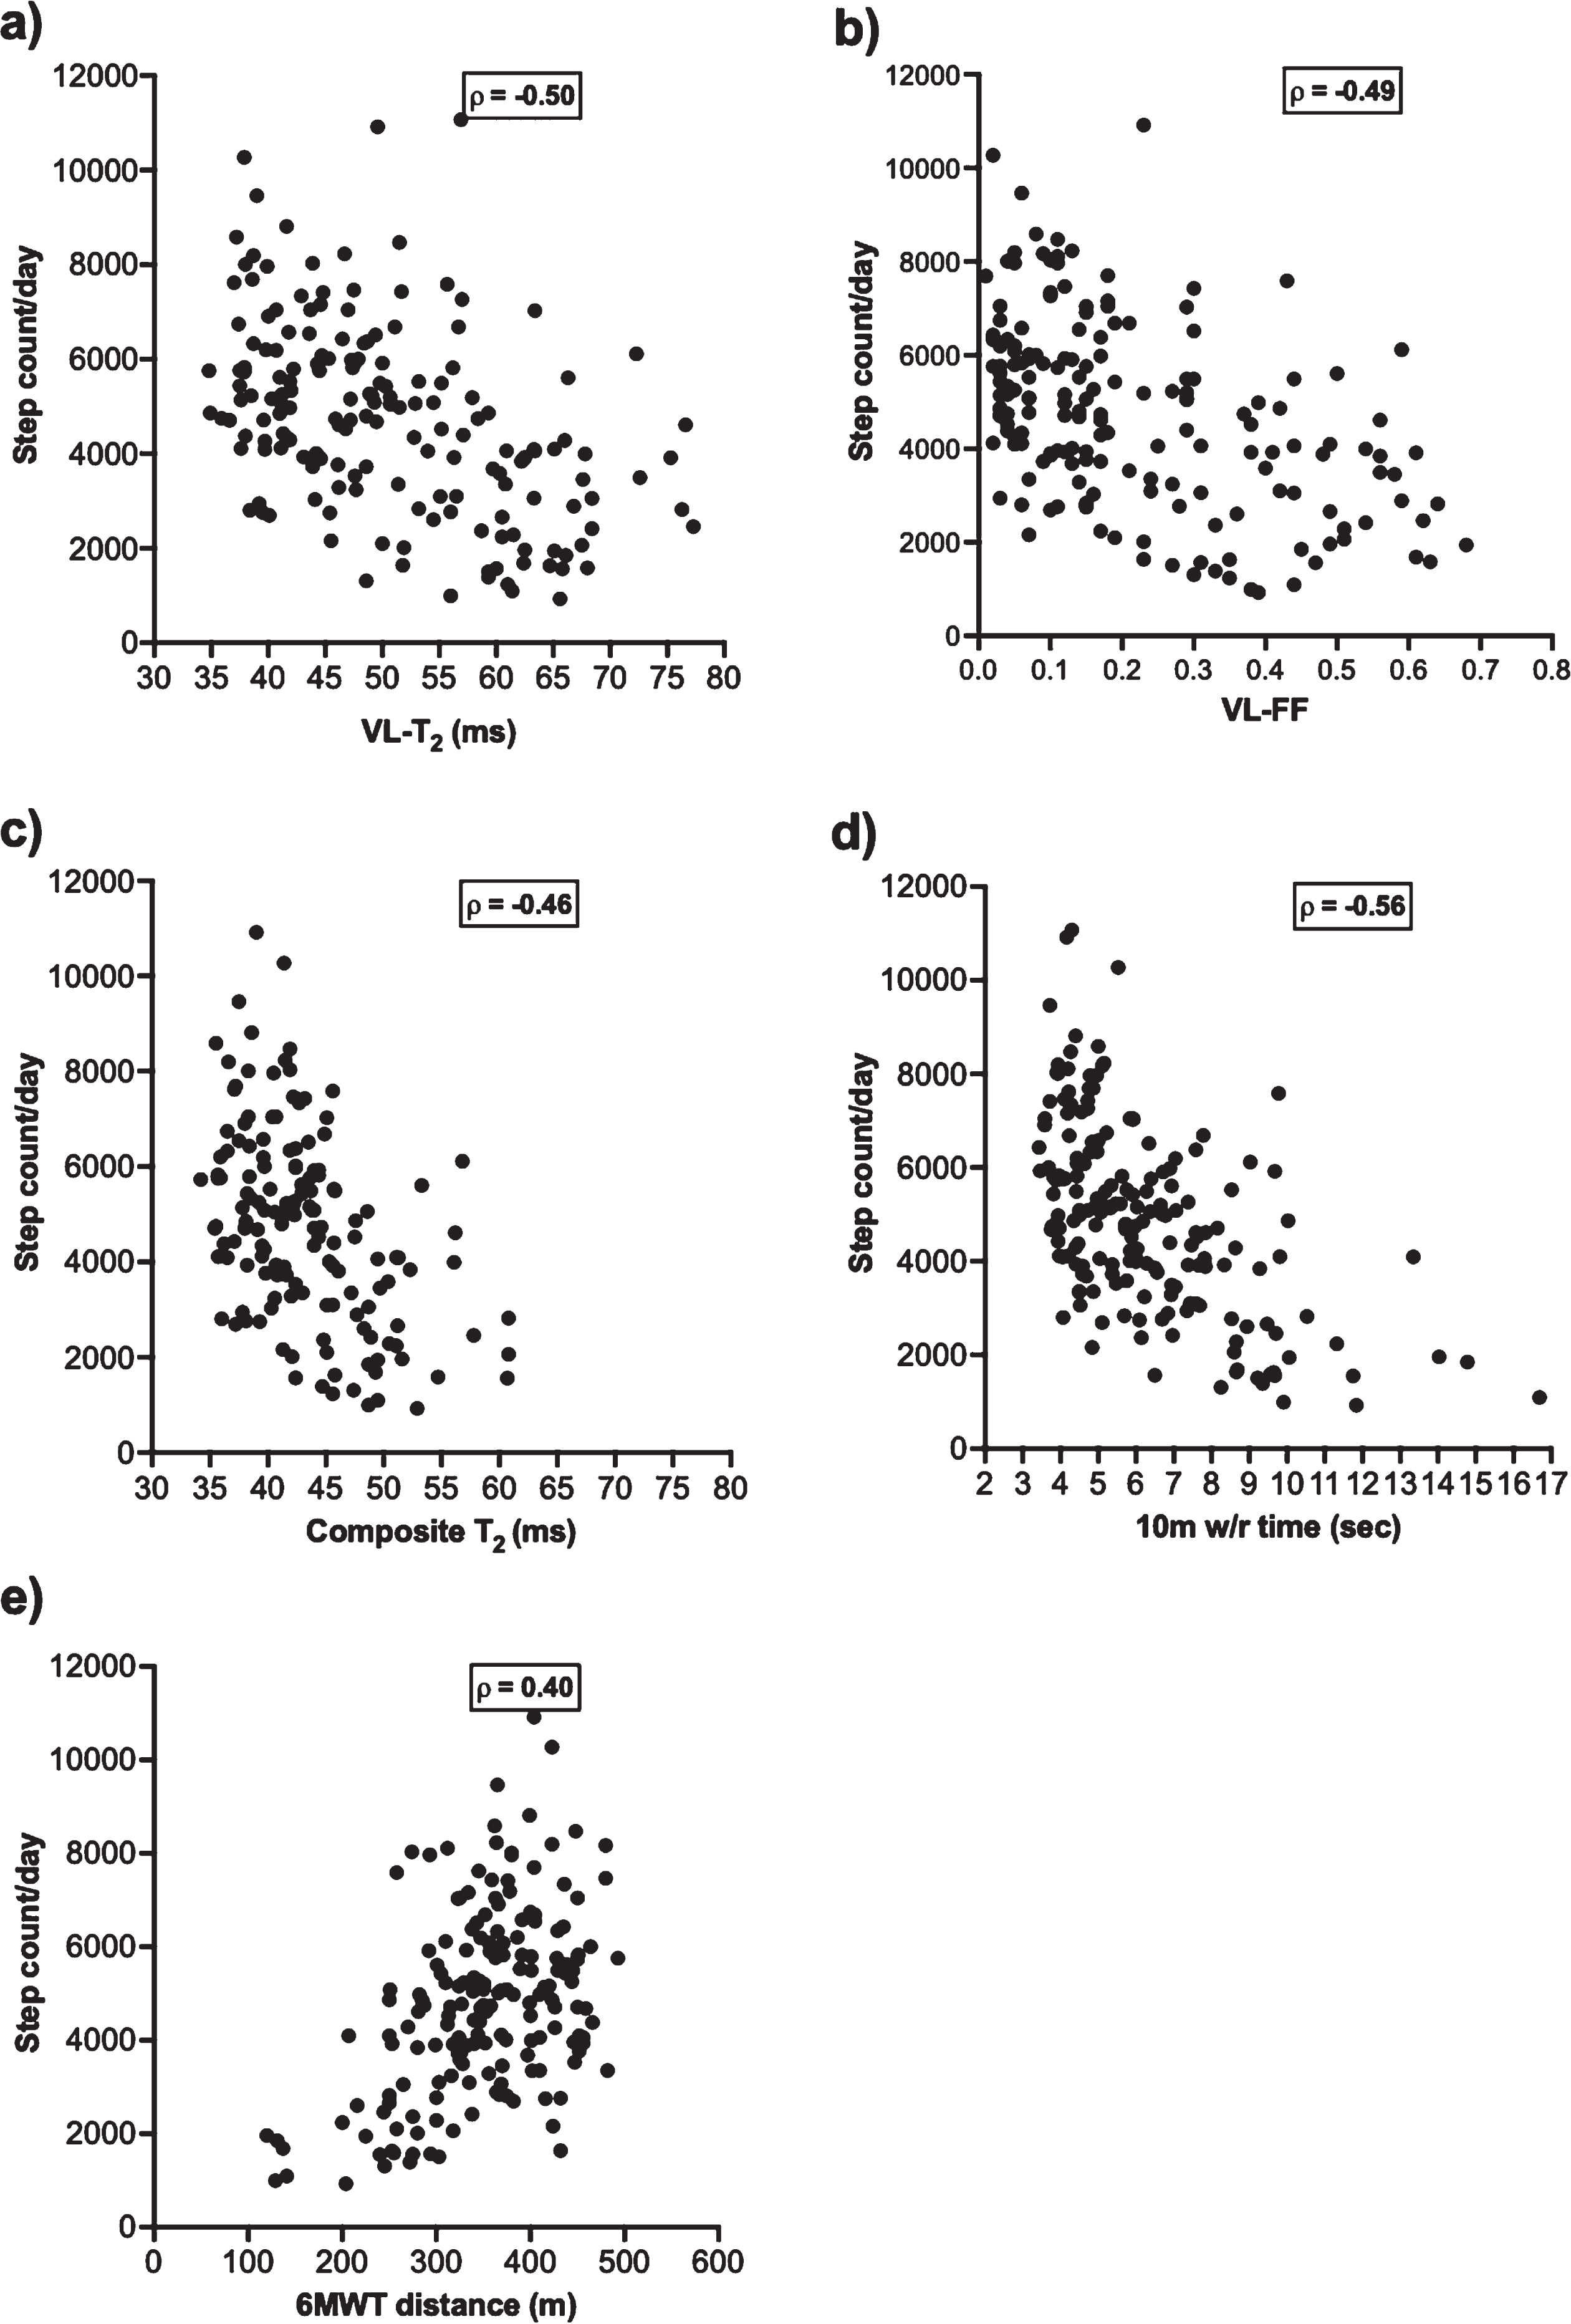
Scatterplot showing the relationship of step activity with: (a) MRI-T2 of VL, (b) FF of VL, (c) composite MRI-T2, d) 10 m walk/run test, and e) 6MWT distance. VL = vastus lateralis; T2 = transverse magnetization relaxation time constant; FF = fat fraction; 10 m w/r = 10meter walk/ run test time; 6MWT = six-minute walk test. As indicated in Table 2, correlations were significant with 95% bootstrap confidence interval excluding zero.
As the quality of muscle health decreases (increase in T2 value) in lower extremity there was an associated decline in step count observed [Fig. 2]. The trajectory of VL-T2 and FF show similarly strong relationships with SA [Fig. 4 a and 4c]. We have previously found the VL muscle to be a sentinel muscle for loss of ambulation and functional declines [26, 27]. Based on a lower threshold for loss of ambulation [26], we categorized the boys with DMD into two groups (VL-T2 < 60 ms, VL-T2
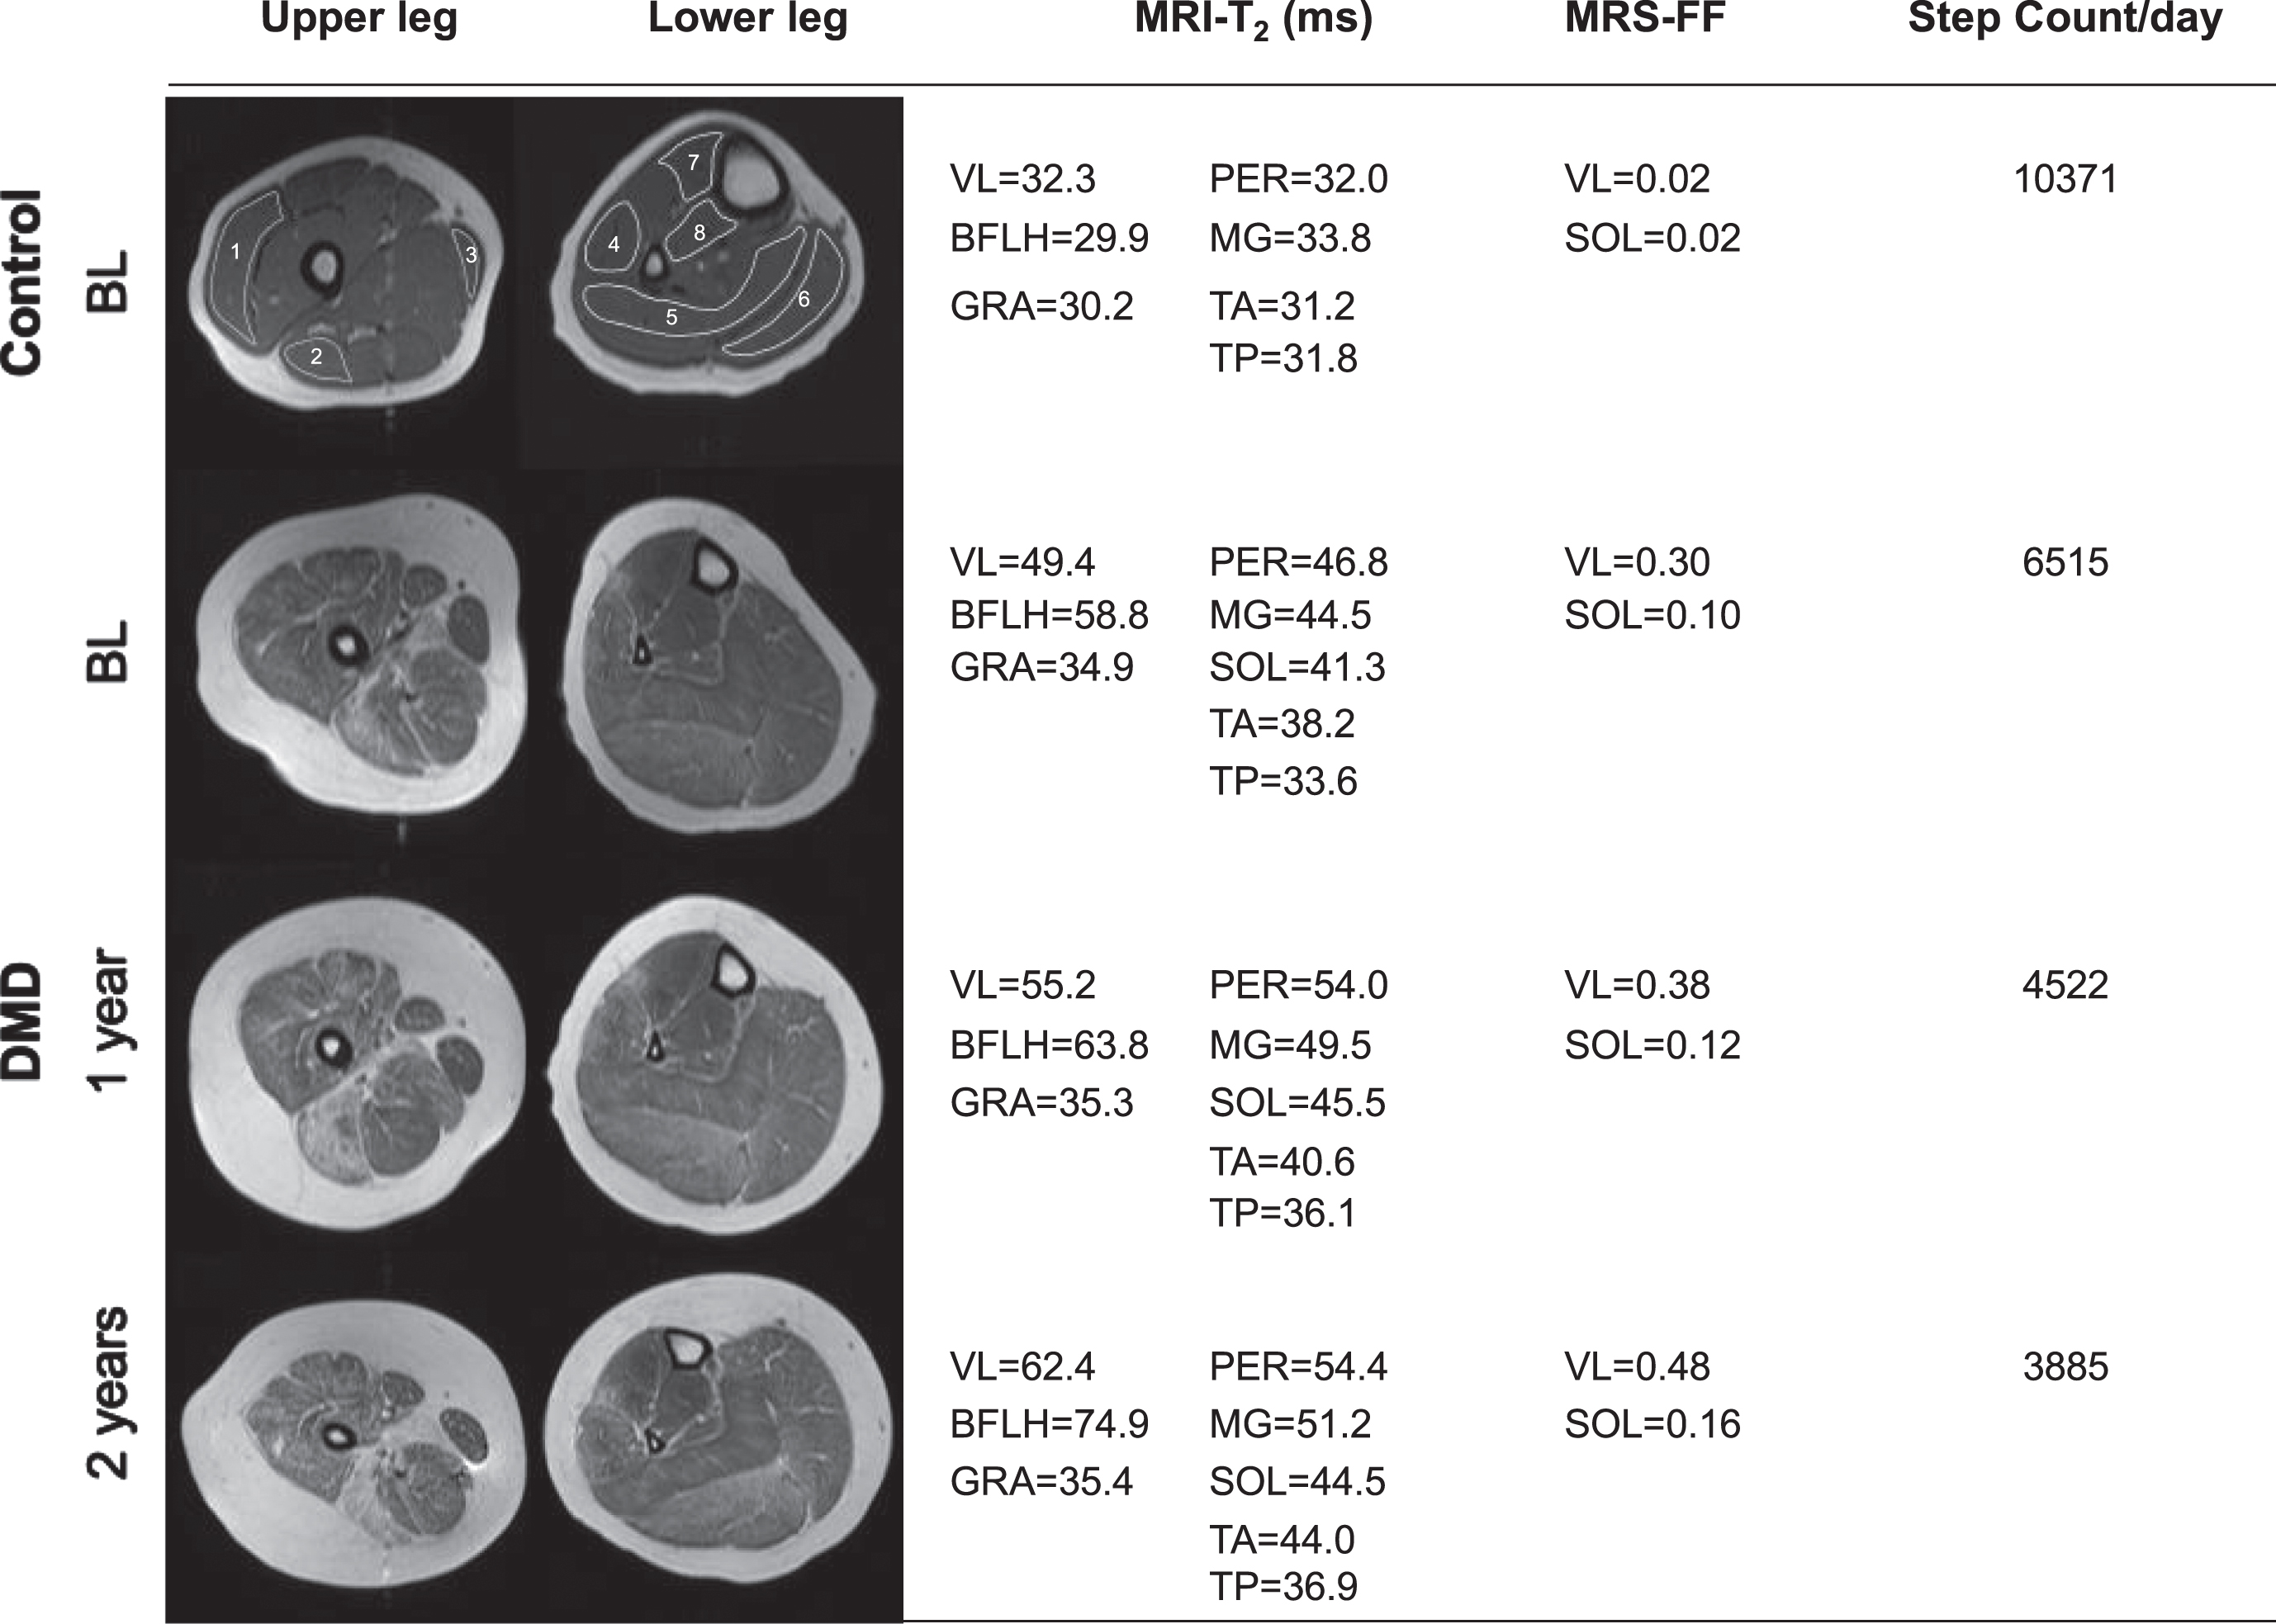
Longitudinal changes in step activity and MRI-T2 of the upper leg and lower leg. The topmost images are from a 9year old control, and example regions of interest were outlined in the eight muscles of the lower extremity.1-vastus lateralis (VL); 2-biceps femoris long head (BFLH); 3-gracilis (GRA); 4-peroneus (PER); 5-soleus (SOL); 6-medial gastrocnemius (MG); 7-tibialis anterior (TA) and 8-tibialis posterior (TP). The other images represent the annual changes in muscle health from a boy with DMD who was 9.7 years old at baseline (BL). As the muscle health decreases in lower extremity muscles (↑MRI-T2 value), there is an associated decline in step count. All the T2-weighted images shown above were acquired with a TE of 40 ms.
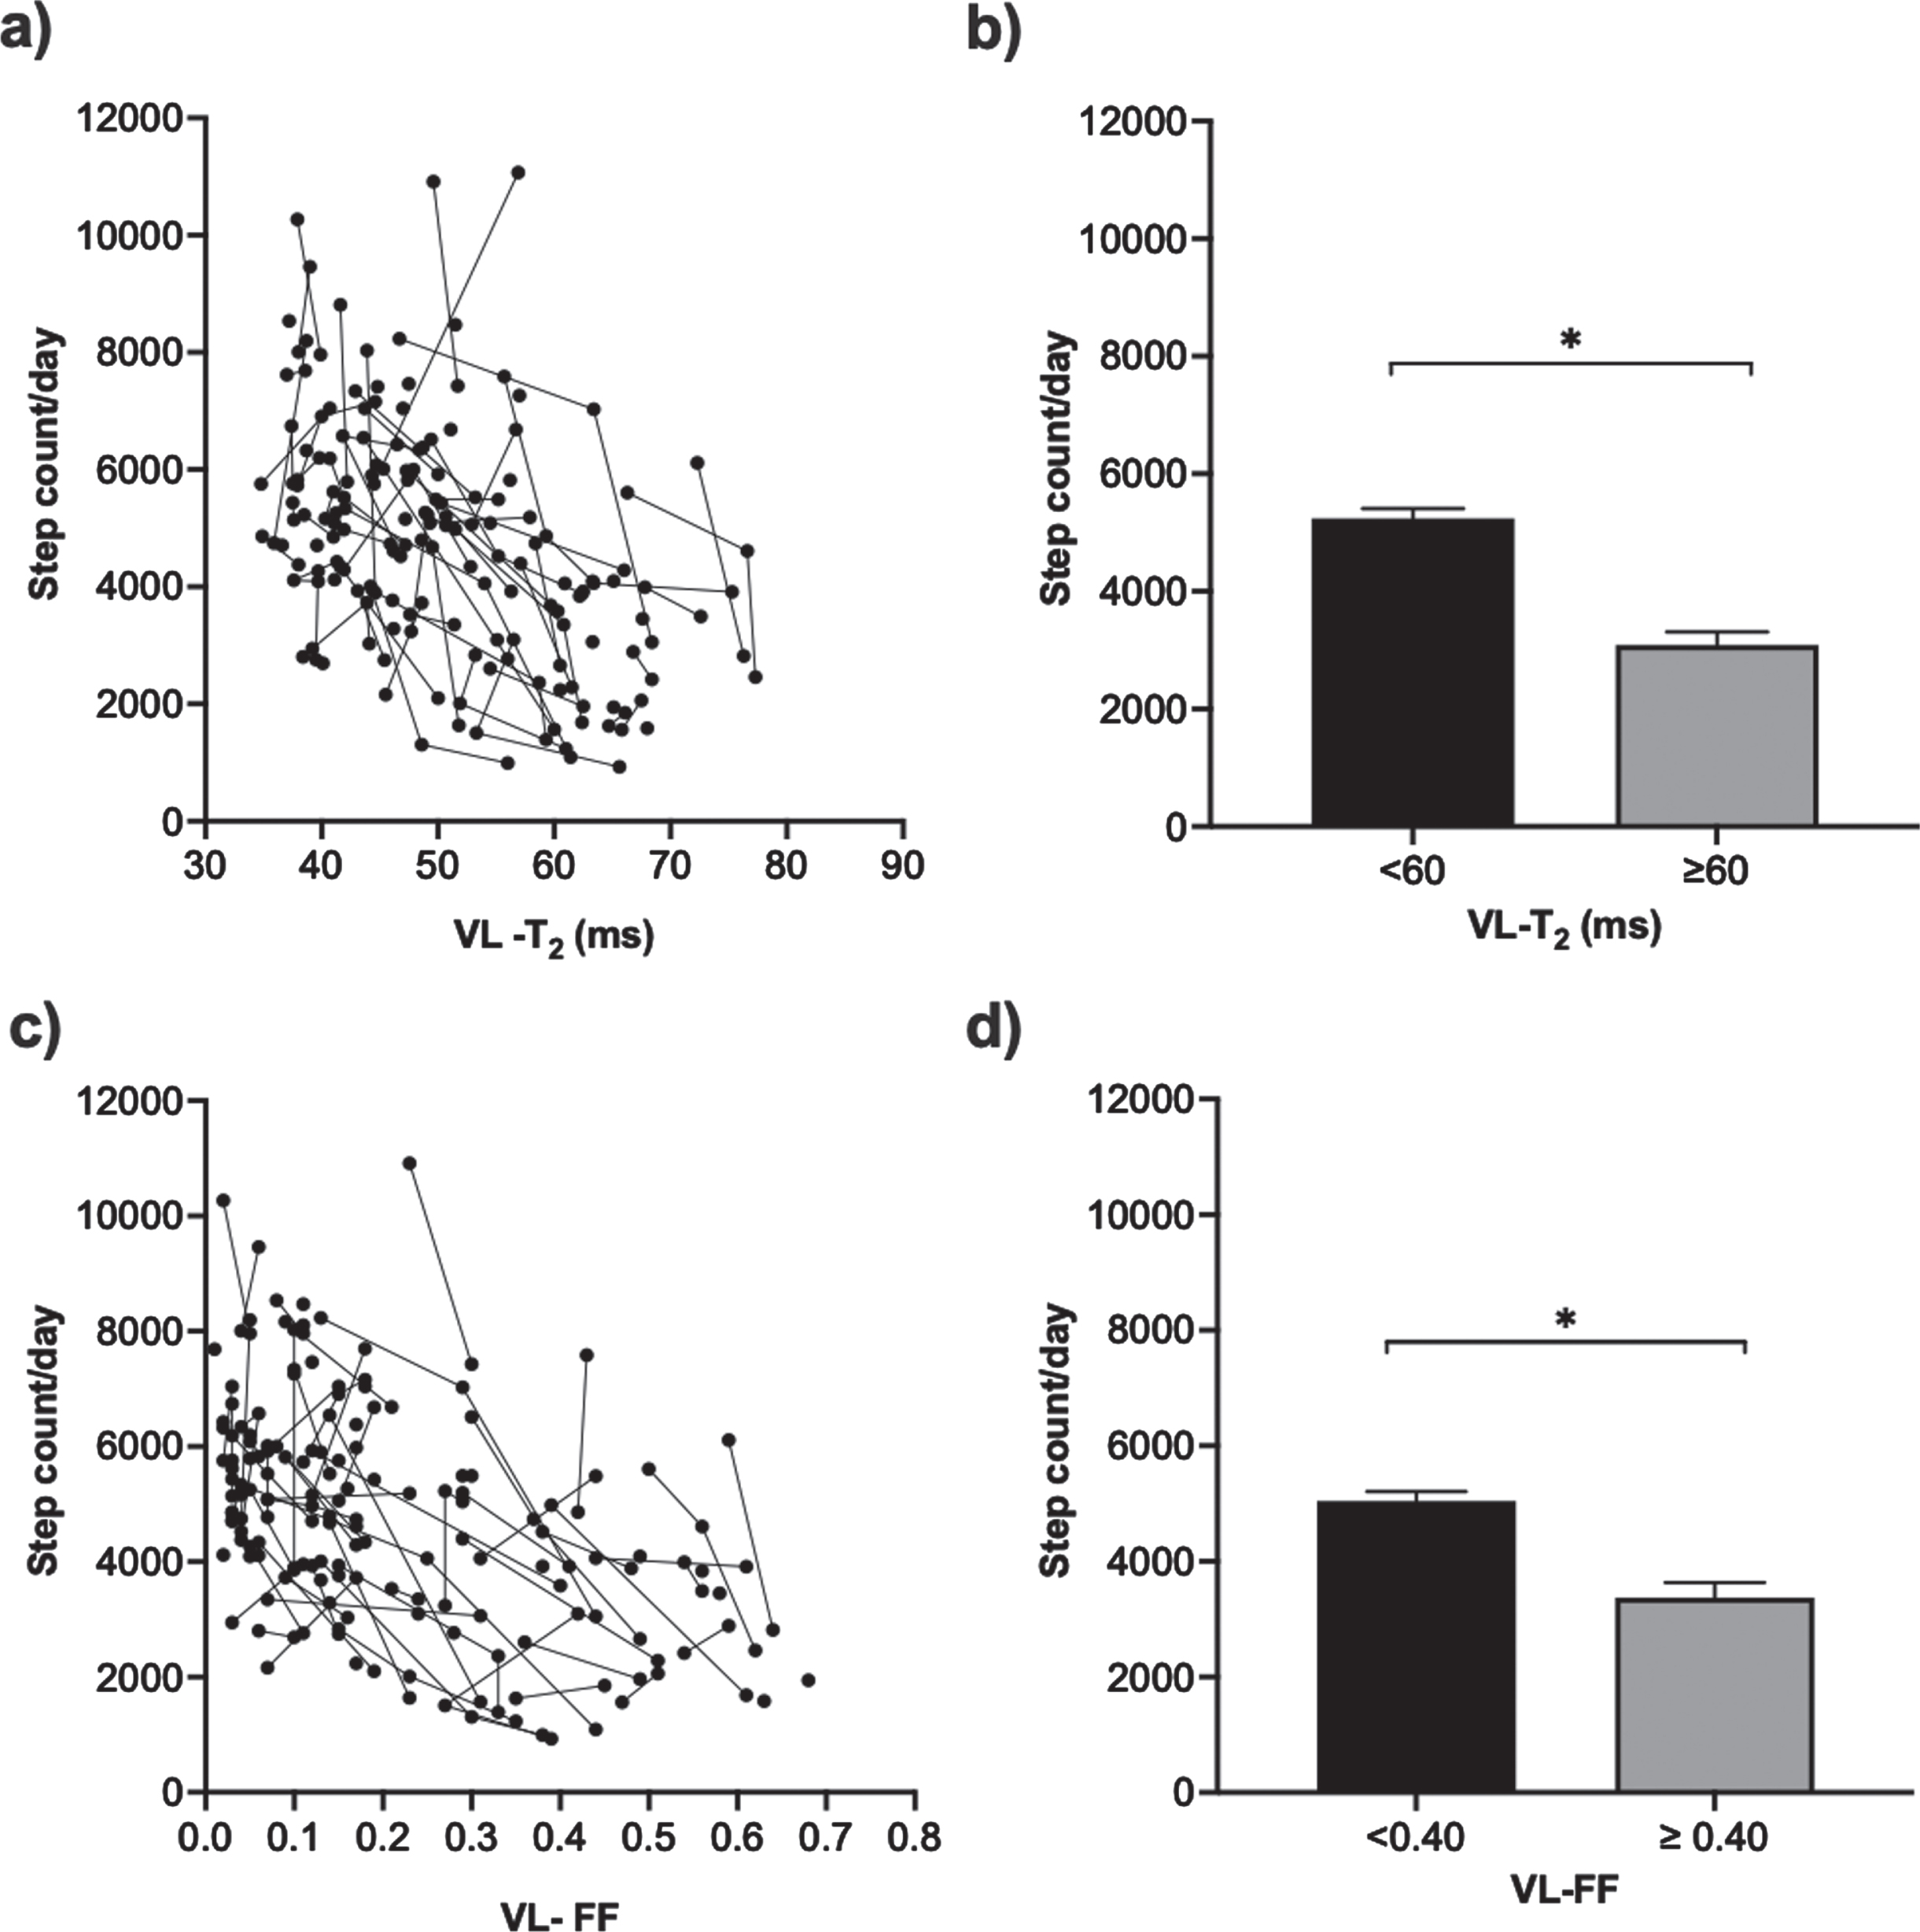
Step activity based on VL muscle pathology: trajectory of step activity as a function of VL-T2 (a) and differences in a step count/day by VL-T2 (b), trajectory of step activity as a function of VL-FF (c), and differences in step count/day by VL-FF (d). Data reported as mean ± SEM; *= significantly different, bootstrap confidence intervals excluded zero (VL = vastus lateralis; T2 = transverse magnetization relaxation time constant; FF = fat fraction).
To assess how SA varies among boys who have different levels of functional performance, we explored the longitudinal trajectory of SA and 10 m w/r time [Fig. 5a]. We classified the boys into three groups based on their performance on 10m w/r test time (<5 sec, 5–8 sec and > 8 sec) [26, 35] and 6MWD (< 300 m, 300–400 m and > 400 m) [39]. Individuals whose 10m w/r time was < 5 sec had, on average, 22% higher daily steps than individuals whose 10 m w/r time was 5–8 sec. Similarly, individuals whose 10 m w/r time was 5–8 sec had 49% higher daily steps than individuals with 10 m w/r time > 8 sec [Table 2, Fig. 5b]. This result indicates that boys who had faster performance on the 10 m w/r had greater SA relative to the boys who took a longer time to complete the 10 m w/r. Better performers in 6MWT (> 400 m, mean step count = 5472±1970, number of data points = 51) had 50% higher SA than poor performers (< 300 m, mean step count = 3293±1880, number of data points = 91). SA was higher in 300–400 m group (mean step count = 5140±1702, number of data points = 43) as compared to < 300 m group. However, no significant difference in SA was observed between the groups who walked 300–400 m and > 400 m [Table 2, Fig. 5c].
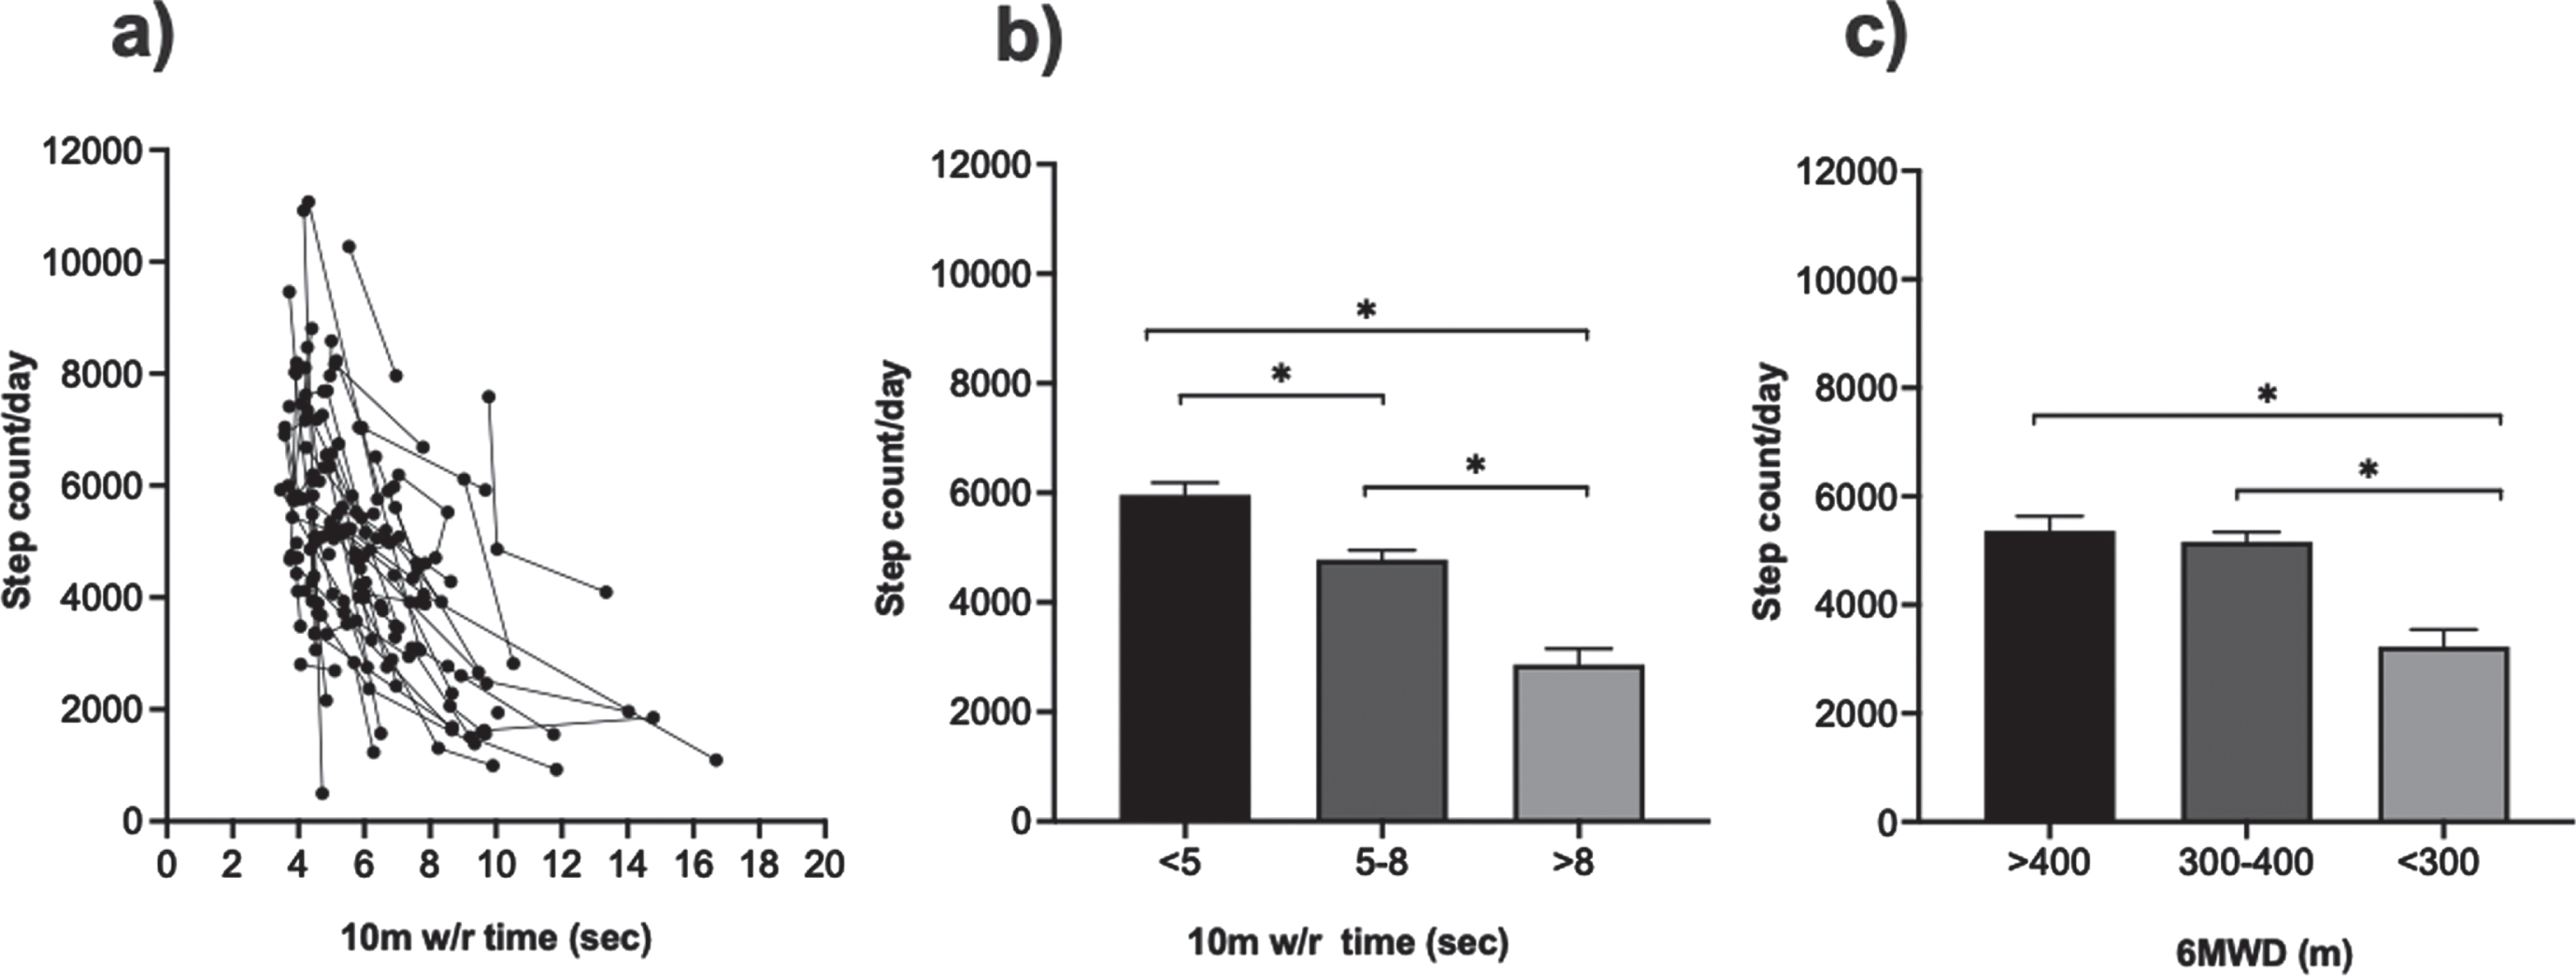
Step activity based on performance of functional measures:(a) represents the longitudinal trajectory of 10 m w/r test time versus step count/day, (b)10 m w/r (< 5 sec, 5–8 sec, > 8 sec), (c) 6MWT distance (< 300 m, 300–400 m, > 400 m). Data reported as mean ± SEM, *= significantly different, bootstrap confidence intervals excluded zero (6MWD = six-minute walk test distance; 10 m w/r = 10meter walk/run test time).
Step activity in the two years prior to loss of ambulation
To assess SA in the two years prior to LoA, we examined a subset of participants with DMD for an additional period of time (beyond the first 2 years of study) during their natural history study visit. In total, twenty-six boys lost ambulation over the four years. Out of those 26, two boys lost ambulation at one year follow-up and their data were excluded from further analysis. We examined SA of twenty-four boys, from two years prior to LoA, and compared it with age-matched ambulatory boys (n = 24) who did not lose ambulation. Results showed that two years prior to LoA, on average, these boys had 32% lower daily step count compared to age-matched boys with DMD who remained ambulatory for at least two more years (3219 vs 4468, p = 0.02) [Fig. 6]. Among the 24 participants who lost ambulation during the study, six had point mutations (median age of LoA = 10.3 years), seven had duplications (median age of LoA = 13.6 years), and eleven had deletions (median age of LoA = 11.3 years). Due to low sample size in different genotype groups, we were under powered to perform statistical analysis of genotype correlations with age of LoA and SA.
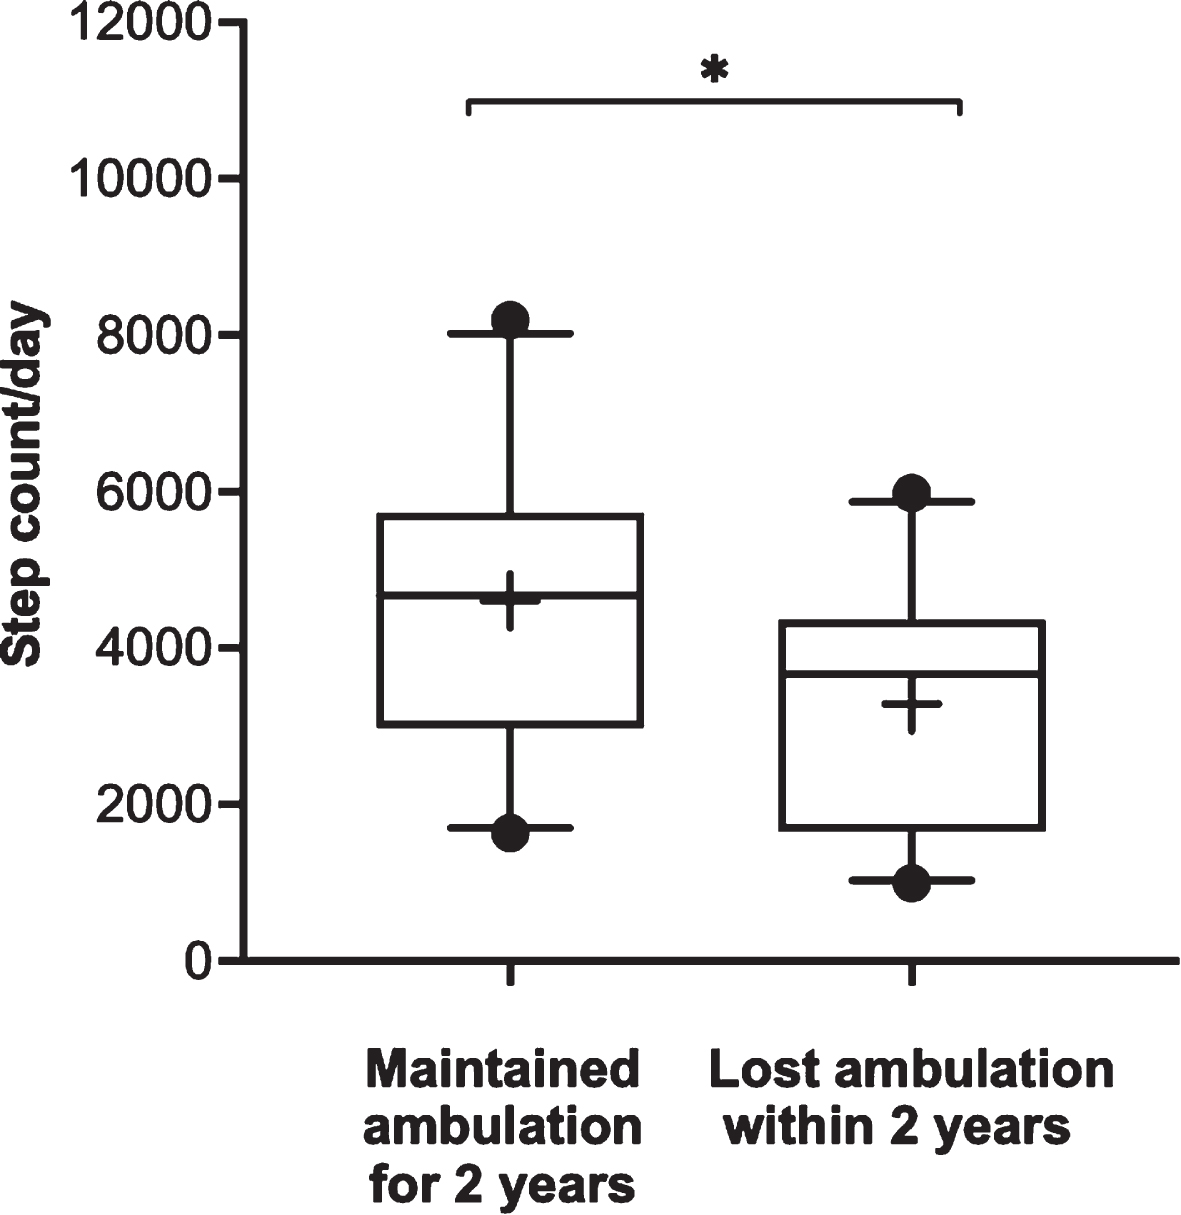
Step activity prior to loss of ambulation: SA from 2 years prior to loss of ambulation was compared with SA of age-matched ambulatory boys with DMD who did not lose ambulation for at least two more years (whiskers represent 5–95 percentile and + indicates mean of the group; * p < 0.05).
DISCUSSION
This study examined SA in steroid treated boys with DMD at their home and community-based environment in comparison with muscle MR biomarkers and functional data. We found that: 1) SA was associated with quantitative measures of MRI-T2 and MRS-FF as well as the functional 10 m walk/run test, 2) SA declined with age, and 3) SA was an indicator of future loss of ambulation. Collectively, our findings support the value of SA monitoring in DMD.
SA monitoring using accelerometry has the potential to provide valuable insights into functional capacities that may be missed in clinic-based functional outcome measures. Conventionally, functional tests are performed in a controlled clinical setting, and boys with DMD may or may not be able to complete the standardized tasks in these settings. However, their ambulatory capacity in a home environment or real-world setting may be different than their clinical performance suggests [12, 16]. In addition, parents and care takers believe that it is important to capture key measurements within the home environment and have this information as data to use when assessing the effect of investigational drugs, in addition to clinical measures which are only assessed periodically, not every day [40]. In this context, SA monitoring may be an important alternative to objectively measure the impact of disease progression on lower extremity muscles, ambulation, and effect of therapeutic intervention in DMD.
A small number of studies have explored SA monitoring in DMD and determined the relationship with clinically-based strength and functional measures [14, 18]. This study had a larger cohort (n = 103), and evaluated changes in SA, MR biomarkers, and common functional measures in steroid treated boys with DMD. In keeping with previous reports [12, 41], we found that daily SA was 31% less than that of age-matched healthy controls, even in young boys with DMD (age of 5–< 7years). Younger children with DMD (age of 5–< 9 years) were more active than the elder boys with DMD. Analysis of two years of longitudinal SA data from a subset of participants with different age groups demonstrated that the greatest percentage of decline in SA occurs at 7–<9 and 9–<11 years of age. In the youngest age group, 5–<7 years, the annual decline in SA was not statistically significant. This could be due to the stable status of the disease progression during this time period. The reason for not seeing a significant change in the longitudinal analysis for the oldest group,11–<13 years, could be either due to their reduction in sample size from baseline, as a few of them lost the ability to ambulate, or their SA may already have reached a floor effect or low level due to more advanced disease progression. These results suggest that including boys with varied ages (i.e., 5–11years) into one grouping could confound the findings and diminish the sensitivity of SA in detecting the effect of a therapeutic intervention. In that context, the amount of SA and the variability in different age groups observed in this study should be informative for future clinical trials that are focused on maintaining/prolonging ambulation in DMD.
SA was moderately correlated with MR measures of muscle pathology (increased MRI-T2, MRS-FF) and functional performance. Findings from this study show that T2 of the VL and BFLH rapidly increased each year and were associated with a decline in daily step count. The VL, a key extensor muscle of the knee, had a large impact on SA. When the VL muscle health deteriorated to a T2 > 60 ms and/or a FF > 0.40, SA declined to a range of 3101–3373 steps/day. MR findings from our group [20, 22] as well as others [21, 43] demonstrated that proximal thigh muscles such as the VL and BFLH are affected early in the disease and reach a ceiling effect at later stages of the disease. As the disease progresses, distal muscles of the posterior compartment such as the MG and SOL become progressively involved. On the other hand, muscles such as the GRA, TA and TP are relatively less affected in DMD [7, 43]. Therefore, we used composite MRI-T2 to capture the varying extent of dystrophic process in different muscles [34], and examined its association with SA. However, in this study we did not find a better correlation for a composite measure of MRI-T2 with SA than the individual muscle MRI-T2 measures. This could be due to stringent exclusion criteria used to remove any data set that lacked even one muscle’s MRI-T2 value.
Among the functional measures, the 10 m w/r test showed the highest linear correlation with SA. This is in agreement with the findings from other physical activity studies in DMD [14, 44]. Individuals with DMD who had a better performance in 10 m w/r had greater SA. For example, the fastest group (< 5 sec) in the 10 m w/r test had 70% higher SA than the slow performers (> 8 sec). This indicates that performance on 10 m w/r test may be useful to clinicians and researchers in estimating SA for ambulatory boys with DMD. Findings from this study show that SA had a significant correlation (ρ= 0.40) with 6MWD. Interestingly, SA did not differ significantly between 300–400 m and > 400 m functional groups. The number of participants in the > 400 m group was much smaller (56%) than the 300–400 m group, and had much greater variability (standard error of mean 275 vs 178). These factors likely contribute to the lack of apparent difference between the 300–400 m and > 400 m groups.
Findings from previous studies[26, 36] reported that if the 6MWD is less than 300m, there is a high probability for LoA within two years. Apart from that, 6MWD≤350 m is a commonly used predictive cut off point in clinical trials for inclusion and stratification criteria [10, 45]. Similar to the cut off value of the 6MWT, this study provides support for choosing a cut-off of ∼3200 steps/day as an indicator for loss of ambulation within two years in DMD. In this study we did not assess the actual date or age at which a participant lost his ambulation. The LoA was determined based on the 10 m w/r test performed on annual study visits. In the interim of study visits we documented parental recall or diary-based information about LoA, fall, fracture, and injury. However, the patient/parent reported LoA was not considered for the analysis of this study due to the subjective nature of the report. In the event that a participant lost his ambulation due to disease progression, an additional six-month follow up visit was scheduled as a part of natural history study.
Furthermore, the ease of wearing accelerometers without discomfort for 10hrs per day provided access to SA data in a real-world environment. With continued advances in wearable technology, SA is now routinely available to be measured in many forms making it an attractive and easily accessible means to monitor the functional capacity in free living environment and effect of therapeutic interventions that focused on maintaining ambulation in DMD. We believe that although clinical tests of function and muscle MR biomarkers correlate well with SA, monitoring SA provides additional and complementary real-world information about ambulatory performance beyond what is able to be obtained by MR and clinical function alone.
Limitations and future directions
This study has some limitations. The participants were enrolled on a rolling basis. Similar to other longitudinal physical activity studies [14, 47], we did not control or covariate-out external factors such as weather, seasons, and socioeconomic status which might have contributed to step count variability. However, it should be noted that we compared each individual over time on an annual basis. Therefore, the weather and seasons should have been similar on a year-to-year basis. Also, the subjects in this study had various genetic mutations, but these appeared to be distributed proportionally to the DMD population. The different mutations might be partly responsible for differing rates of disease progression [48–50]. Although our cohort consisted of different types of mutations, our post hoc analysis comparing different groups of genetic mutations did not find any significant difference in average step count/day between the groups.
Since disease progression in corticosteroid treated and steroid naïve boys is different, we did not include any corticosteroid naïve participants in this study. We documented information about the age at which corticosteroids were initiated, type of corticosteroid (prednisone/deflazacort), and dosing regimen. Since this study was performed as a part of natural history study and participants switched between different dosing regimens, based on their medical team’s advice, we did not perform a detailed analysis on the effect of steroid regimen on SA. However, based on the known effects of corticosteroids on 6MWT performance and disease progression in DMD [8, 36], we recommend that future studies of SA monitoring should incorporate the effect of corticosteroid regimen on step activity.
The disease process of DMD affects both quality and quantity of step count. As the boys have a harder time moving, their energy expenditure increases, which affects the quality of step activity. In this study, the methods employed focus on quantity of step activity whereas others have reported increased energy expenditure during gait [12, 52]. Therefore, we recommend that future work should explore how quantity and quality of step activity are affected by DMD and how combined they are sensitive for predicting loss of ambulation.
Finally, the accelerometer used in this study was a waist worn device, whereas some other studies have used an ankle worn [14] or wrist worn accelerometer [16, 44]. However, the accelerometer used in this study has been widely used to assess physical activity performance and sedentary behavior in various adult and pediatric neurological populations with validity and reliability [53–58]. Although, in general, we had good compliance (Supplementary Figure 1), it could be further improved in future studies by incorporating novel technologies, such as smart watches and GPS trackers, to capture additional activity related measures such as heart rate response to activity, different walking frequencies at various locations, and proportion of inactive periods. Although the main focus of our study was to examine the relationship between average step count/day and lower extremity muscle health in DMD, future studies may also consider examining intensity of physical activity.
CONCLUSIONS
This study demonstrates the relationship between SA and lower extremity muscle health in steroid treated boys with DMD. SA monitoring significantly correlated with functional performance in the 10 m walk/run test. In addition, our results indicate that SA can be used to estimate the decline in ambulatory capacity in boys with DMD in real-world settings. Collectively, SA monitoring is a valuable, readily administered tool that enables quantitative monitoring of disease progression in the home environment and may be useful in future studies to examine the effect of therapeutic interventions on ambulatory boys with DMD.
Footnotes
ACKNOWLEDGMENTS
This work was supported by National Institute of Health (R01AR056973). Donovan J. Lott and Alison M. Barnard were both supported by the Rehabilitation Research Career Development Program (K12-HD055929), and Dr. Barnard was also supported by NIH’s Breathing Research and Therapeutics (T32-HL134621). A portion of this work was performed in the McKnight Brain Institute at the National High Magnetic Field Laboratory’s Advanced Magnetic Resonance Imaging and Spectroscopy (AMRIS) Facility, which was supported by National Science Foundation Cooperative Agreement No. DMR-1157490 and the State of Florida.
We would like to acknowledge and thank the ImagingDMD participants and their families, and we are also appreciative of the research staff who assisted in data collection.
CONFLICT OF INTEREST
The authors have no conflict of interest to report.