
Abstract
Background:
Quantitative muscle MRI is one of the most promising biomarkers to detect subclinical disease progression in patients with neuromuscular disorders, including Duchenne muscular dystrophy (DMD). However, its clinical application has been limited partly due to the time-intensive process of manual segmentation.
Objective:
We present a simple and fast automated approach to obtain quantitative measurement of thigh muscle fat fraction and investigate its reliability in patients with DMD.
Methods:
Clinical and radiological baseline and 6-month follow-up data of 41 ambulant patients with DMD were analysed retrospectively. Axial 2-point Dixon MR images of all thigh muscles were used to quantify mean fat fraction, while clinical outcomes were measured by the Motor Function Measure (MFM) and its D1 domain. Data obtained by automated segmentation were compared to manual segmentation and correlated with clinical outcomes. Results were also used to compare the statistical power when using automated or manual segmentation.
Results:
A mean increase of 3.55% in thigh muscle fat fraction at 6-month follow-up could be detected by both methods without any significant difference between them (p=0.437). The automated muscle segmentation method demonstrated a strong correlation with manually segmented data (Pearson's ρ = 0.97). Additionally, there was no statistically significant difference between the automated and manual segmentation methods in their association with clinical progression, as measured by the total MFM score and its D1 domain (p = 0.235 and p = 0.425, respectively).
Conclusions:
The presented automated segmentation technique is a fast and reliable tool for assessing disease progression, particularly in the early stages of DMD. It is one of the few studies validated using manual segmentation, and with further refinement, it has the potential to become a good surrogate marker for disease progression in various neuromuscular disorders.
Keywords
Introduction
Most neuromuscular disorders are classified as orphan diseases, affecting fewer than 1 in 2000 individuals. These conditions are characterized by progressive muscle weakness and wasting, often leading to early loss of mobility and premature death. Duchenne muscular dystrophy (DMD) is one of the most common neuromuscular diseases, 1 for which a curative treatment remains unavailable. Although advancements in nonsteroidal drugs and gene therapies show promise, these options are not yet widely accessible or approved. Consequently, numerous randomized clinical trials are underway, aiming to identify effective treatment approaches with fewer side effects than the commonly used corticosteroids.
Reliable outcome measures represent an essential part of successful clinical trials, whereas objective and non-invasive methods are superior to those with high variability and dependence on the patient's compliance and the abilities of the investigator. Extensive research has been conducted in recent years to identify metabolic and genetic biomarkers that can be utilized in clinical trials, with the potential for translation into clinical practice. 2 However, the identification of qualified biomarkers in this group of diseases remains an unmet need. Imaging modalities, particularly quantitative muscle magnetic resonance imaging (qMRI), have shown promise in several genetic and acquired neuromuscular disorders. Its low inter-rater variability, non-invasive nature, and reduced dependence on patient compliance make qMRI a unique tool for monitoring short- and long-term treatment responses. A recent study confirmed that qMRI effectively identifies different muscle involvement in a heterogeneous group of patients with muscle diseases and correlates with clinical assessments. 3 The superiority of qMRI as a surrogate marker of clinical decline could also be confirmed in patients with DMD.4–7 Moreover, qMRI has been shown to correlate with clinical outcomes and detect even subclinical changes.6–10
During the disease course, inflammatory activity can be visualized using conventional methods of either short tau inversion recovery (STIR), spectroscopy, or T2 relaxation time from a dedicated sequence. Progressive fat replacement in the muscle that seems to follow the inflammatory state can further be quantified by using muscle fat fraction (FF), derived from either T1-weighted non-fat saturated turbo spin-echo images or ideally from Dixon MRI sequences (2-point, 3-point, or 6-point)5–8. However, quantification techniques require prior selection of regions of interest (ROI) for quantifying mean FF and T2 relaxation time, usually through manual segmentation. This can take between 30 to 90 min per patient as indicated by our expert radiologists and confirmed by literature data, depending on factors such as the number of MR slices and the precision of manual segmentation. 11 As segmentation steps necessitate manual adjustment, they remain reliant on the operator. The dependency on human input becomes more apparent at later disease stages, where the borders between subcutaneous, intermuscular adipose tissue, and muscle are less clear. To overcome these limitations of qMRI, such as its time-consuming nature, inter-operator variability, and reliance on disease type and stage, efforts have been directed towards developing semi- or fully automated methods to address these challenges.
Further optimization with the use of automated methods has the potential to improve both consistency and efficiency by reducing segmentation time while reliably distinguishing between fat replacement and muscle tissue. For this purpose, many algorithms for automated segmentation of the different lower and upper limb pools (e.g., adipose, muscular, and bony tissues) have been proposed. 12 Valentinitsch et al. introduced an automated unsupervised method for the differentiation of muscle and fat tissues through a multi-parametric clustering approach from chemical shift images. 13 Fouré et al. combined spatial normalization of skeletal muscle images with statistical parametric mapping and specific parcellation to localize and quantify tissue damage from computed T2 maps. 14 Another group aimed at discriminating between skeletal muscle, adipose tissue components, and intermuscular adipose tissue from T1-weighted MR images of the thigh and developed a combined fuzzy c-means algorithm and morphological operator. 15 The initial performance of (semi-)automated segmentation methods was still limited. However, recent approaches, primarily using deep learning, are more reliable.11,16–23 Challenges mostly arise in advanced neuromuscular conditions, where severe intramuscular changes—such as atrophy and fat replacement—make it difficult to differentiate intramuscular from subcutaneous fat. Early automated approaches based on clustering or histogram analysis differentiated between fat and muscle tissue, but intramuscular and subcutaneous fat remained indistinguishable. 24 To overcome this, k-means clustering and machine learning methods were developed, but they still failed to define the fascia lata boundary around the muscle accurately. 25 Several methods have therefore been studied, and shape prior based graph cuts were found to segment reasonably well even severely affected muscles.17,18 Many authors have further focused on automatically differentiating individual muscles to meet the need of physicians in understanding the pattern of muscle involvement in neuromuscular conditions. With regard to this Lpez et al. developed an evolutionary algorithm which selects the set and the sequence of morphological operators that best segments muscles and bones from an MR image. 26 Sdika at al. optimized an automatic multi-atlas-based segmentation method to quantify individual muscle volume in rat legs from MR images. 27 While numerous single, -and multi-atlas approaches were developed, 18 their validation in neuromuscular conditions is still missing. Deep learning algorithms, particularly supervised learning, have shown promise in muscle MRI segmentation as well, however, their potential in accurately segmenting severly affected patients needs to be proven.18,20,22,23,28 Altogether, most of these studies were performed either in healthy individuals or in less severely affected patients, and their accuracy was measured in relation to manual segmentation data. 29 Accordingly, their reliability in patients at advanced disease stages, as well as their validity in relation to clinical measurement, remained unclear.
Therefore, we aimed to develop a fully automated segmentation method capable of detecting subclinical disease progression even in more severely affected individuals, and to test its reliability by correlating it with clinical outcomes. In this article, we present a simple and rapid, fully automated segmentation method that provides objective quantitative measurements of muscle FF from axial 2-point Dixon images of the thigh. We evaluate its performance against ground truth data generated by an expert. Additionally, we examine the reliability of our automatic approach by comparing it to manual segmentation and assessing its correlation with motor function measures in a substantial cohort of 41 ambulant DMD patients.
Methods
Study population
Baseline and 6-month follow-up data of 41 ambulant patients (aged 6.5–10 years) with genetically confirmed DMD participating in the 'Treatment with L-citrulline and metformin in Duchenne muscular dystrophy' Study (DMD02-Study)30,31 were analysed retrospectively. Before recruitment, the study was approved by the local ethics committee and the Swiss Agency for Therapeutic Products. Written informed consent was given by all caregivers. All patients included in the analysis were receiving standard glucocorticoid treatment and received placebo (22 patients) or a combination of L-citrulline and metformin (19 patients). Quantitative muscle MRI measurements of the thigh muscles at baseline and at 6-month follow-up were separately analysed and correlated with data of the Motor Function Measure (MFM) and its D1 domain assessing standing and transfer.
Clinical outcome measures
All patients underwent standardized clinical assessments using MFM and timed function tests; however, in the current analysis we included only MFM and its D1 domain based on previous findings that concluded this clinical outcome measure is superior to other timed functions tests regarding its correlation to radiological outcome measures.32,33 The MFM is a validated score for patients with DMD and consists of 32 items assessing standing and transfer (D1 domain), axial and proximal motor function (D2 domain), and distal motor function (D3 domain).34,35 The total MFM score and its three domains were calculated based on the scores of each of the corresponding items previously quantified on a 4-point scale (0–3). The clinical test was done by experienced and qualified examiners.
qMRI
MRI of the thigh muscles (extensors, flexors, and adductors) was performed as described previously at baseline and at 6-month follow-up. 6 Briefly, all patients were scanned on a 3 Tesla clinical scanner (Magnetom Verio, Siemens Healthcare, Erlangen, Germany) with two 16-element body array coils and a spine coil. Repeatability of positioning was performed as previously described in. 6 A 2-point Dixon (2PD) method (consisting of the acquisition of two images such that water and fat molecules are in-phase and opposed-phase) was then used (3D, 30 slices, 384×384, FOV = 400×400 mm2, TR = 20 ms, TE1 = 2.45 ms, TE2 = 3.68 ms, flip angle = 15°, acquisition time 2:49 min) resulting in separate water (w) and fat (f) images. Relative fat content maps were generated from the voxelwise FF given f/(f+w)(f= fat, w= water). Region of interest (ROI) were drawn manually on three slices of the in-phase images for each muscle of both thighs, with sparing of 1–3 voxels at the edge of each muscle. All three acquired slides were segmented and used in comparative analysis. Muscles were drawn individually while bone as well as subcutaneous and intermuscular fat excluded. The average muscle FF (%) across all thigh muscles per patient was used for further analysis. No post-processing was done. ROIs were selected by one expert reader and checked for quality by an experienced radiologist. Each radiology reader had more than 5 years of relevant experience.
Fully automated qMRI analysis
The algorithm, originally developed for the neck region, was tested in our setting and approved for use with the current data by the radiology expert reader. In the initial step of the analysis, limited manual input was required; the reader manually drew a rough ROI around the entire muscle area in all axial slices, excluding subcutaneous fat from the central muscle area (Supplemental Fig. 1). After that, a field inhomogeneity correction was performed on all images to correct for inhomogeneity. Inhomogeneity correction to compensate for magnetic field variations is essential in MRI Dixon sequences for accurately separating fat and water signals, as seen in.36,37 Correcting for field inhomogeneity is typically done by adjusting the magnetic field or applying post-processing algorithms that correct for spatial variations. We deployed N4ITK Bias Field Correction that minimized local entropy in the image, smoothing intensity variations.
Afterward, the cut-off value that differentiates fat from muscle tissue was subsequently determined empirically based on integrative information from different sequences. This cut-off value was optimally set based on prior knowledge of the fat signal class value. Using in-phase and opposed-phase images, pixel intensity values were extracted to form data points for clustering. These pixel intensities serve as features for the k-means algorithm, which partitions the data into clusters—typically two, representing fat and water—based on signal intensity. Each pixel is assigned to the nearest cluster center, and the cluster centers are recalculated as the mean of the assigned pixels. This process repeats iteratively until the cluster assignments stabilize. Once clustering is complete, each cluster is identified as either fat or water based on the known characteristics of their signal intensities. The clusters from the in-phase and opposed-phase images are then combined using cutoff values to refine the classification. This results in distinct masks for fat and water, allowing for precise tissue characterization in MRI images. Accordingly, the operation consisted of two sub-steps:
Unsupervised standard k-means clustering was applied to define a set of similar features (k = 5, as default) within the whole in-phase and opposed-phase images. This operation resulted in two sets of clusters: cluster_in and cluster_opp, gathered respectively from the in-phase and opposed-phase images. Rule-based selection of best pixel classification was defined as follows: cluster_in + cluster_opp < cut-off class.
The proposed k-means approach classified each image pixel inside the ROI based on signal intensity and created image masks for bone, muscle, and fat in all axial slices inside the muscle ROI. These pixel counts were automatically measured to produce a muscle volume and a mean FF within all the muscle inside the ROI, including intermuscular fat and excluding subcutaneous fat (Supplemental Fig. 1). The method, therefore, separated muscle from bone and fat but did not differentiate between individual muscles. The automated segmentation required less than five minutes to perform on all three axial slices on a standard computer.
After automated segmentation, an expert performed quality checks to ensure accuracy and reliability. The first step involved visually inspecting the segmented images to confirm that the boundaries between fat, water, muscle, and other tissues were appropriately delineated. This process included comparing the automated outputs with expected anatomical features to ensure that no structures were misclassified. The expert also cross-referenced the segmented images with reference segmentations to identify any inconsistencies. Discrepancies found during visual checks could prompt repositioning of the fixed-size ROI or minor manual adjustments to refine segmentation boundaries, enhancing the precision of the process. However, for algorithm validation purposes, manual adjustments of segmentation results were not permitted. Additionally, the expert used built-in histogram tools (DYNAMIKA, Image Analysis Group) to analyse signal intensity distributions within the segmented regions, ensuring consistent classification across tissue types. Beyond visual inspection, a quantitative assessment was also conducted to measure the overlap between the automated segmentation and a ground truth or manually segmented reference, as described below.
Statistical analysis
The main results of this trial have been published in. 31 The secondary analyses presented in this paper were not predefined in the protocol. The agreement between the two methods (manual and automated segmentation) on muscle FF was quantified as the intraclass correlation coefficient (ICC). The ICC is presented together with its 95% basic bootstrap confidence interval (CI), estimated using 999 bootstrap replicates.
Since the ICC is calculated based on analysis of variance, a model was fitted to the data with visit and patient as random factors. Thereafter, the ICC was estimated by dividing the variation due to the subject-to-subject difference or visit difference (baseline vs. 6-month follow-up) by the total variance observed in the data. The ICC represents the absolute agreement between the two methods, accounting for differences between baseline and 6-month follow-up measurements. Measurements obtained by both methods were presented in a scatter plot, and their correlation was quantified using Pearson's correlation coefficient. The agreement between the two methods was further assessed using a Bland-Altman plot.
The clinical course between baseline and 6-month follow-up was assessed in a mixed-effects model. Visit and method were included as fixed effects, and a random intercept was estimated for each subject.
To investigate the association with the clinical outcome, the model was extended with fixed effects for the MFM total score and MFM D1 subscore. Since both FF and clinical outcomes evolve over time, the age at baseline was included as an additional covariate. This assessed whether the association between mean FF and clinical outcome is driven by the age of the subjects.
We illustrated the effect sizes by estimating the sample sizes for two hypothetical trials. In both scenarios, we assumed a two-armed trial with a 1:1 randomization to placebo and an active treatment. In the first scenario, we assumed that the muscle FF in patients receiving the active treatment is 2% lower at follow-up compared to those on placebo. In the second scenario, we assumed a stronger treatment effect, with a reduction in FF of 4% in the treatment arm compared to the control arm. We considered these numbers small enough to be realistic (2%) but large enough to be clinically relevant (4%).
These sample sizes were estimated solely to illustrate the standardized effect sizes. For the sample size estimation, the effect size, standard deviation, and the correlation between baseline and 6-month measurements were calculated. Assuming a normally distributed endpoint, the sample size depends on the significance level (α), power (1–β), and the standardized effect size. If covariates are present, additional adjustments should be made to reduce variance and consequently reduce the sample size. The stronger the correlation between the endpoint and the covariates within the same patient, the larger the gain in power. The sample sizes were calculated using a two-sided significance level of α = 0.05 and a power of 0.8.
Results
To validate the reliability of the developed automated method, its performance in detecting longitudinal increase of muscle FF (at baseline and 6-month follow-up) was compared to manually segmented data and clinical outcomes in DMD patients receiving either standard glucocorticoid treatment and placebo or L-citrulline and metformin within the clinical trial setting of the DMD02-Study.
Validation of automated qMRI analysis using longitudinal change of mean ff
Mean FF of all thigh muscles at baseline was 26.71% (±12.14) using manual segmentation and 28.02% (±9.64) using automated segmentation. At the 6-month follow-up, mean FF was 31.15% (±14.00) with manual segmentation and 30.73% (±9.83) with automated techniques. This corresponds to an increase in mean FF of approximately 2.5% using the automated segmentation and nearly 5% using the manual segmentation. When pooling baseline and follow-up measures, the ICC for FF was 0.94 (CI = [0.91; 0.95]). Hereby, the automated analysis correlated well with the manual evaluation (Figure 1). At 6-month follow-up, the calculated mean FF increase of 3.55% (using the increases measured by both methods) was detected without any significant difference between the two techniques (Figure 2(A)). However, the correlation between mean FF at baseline and follow-up was stronger when manual segmentation was used (Figure 2(B)).
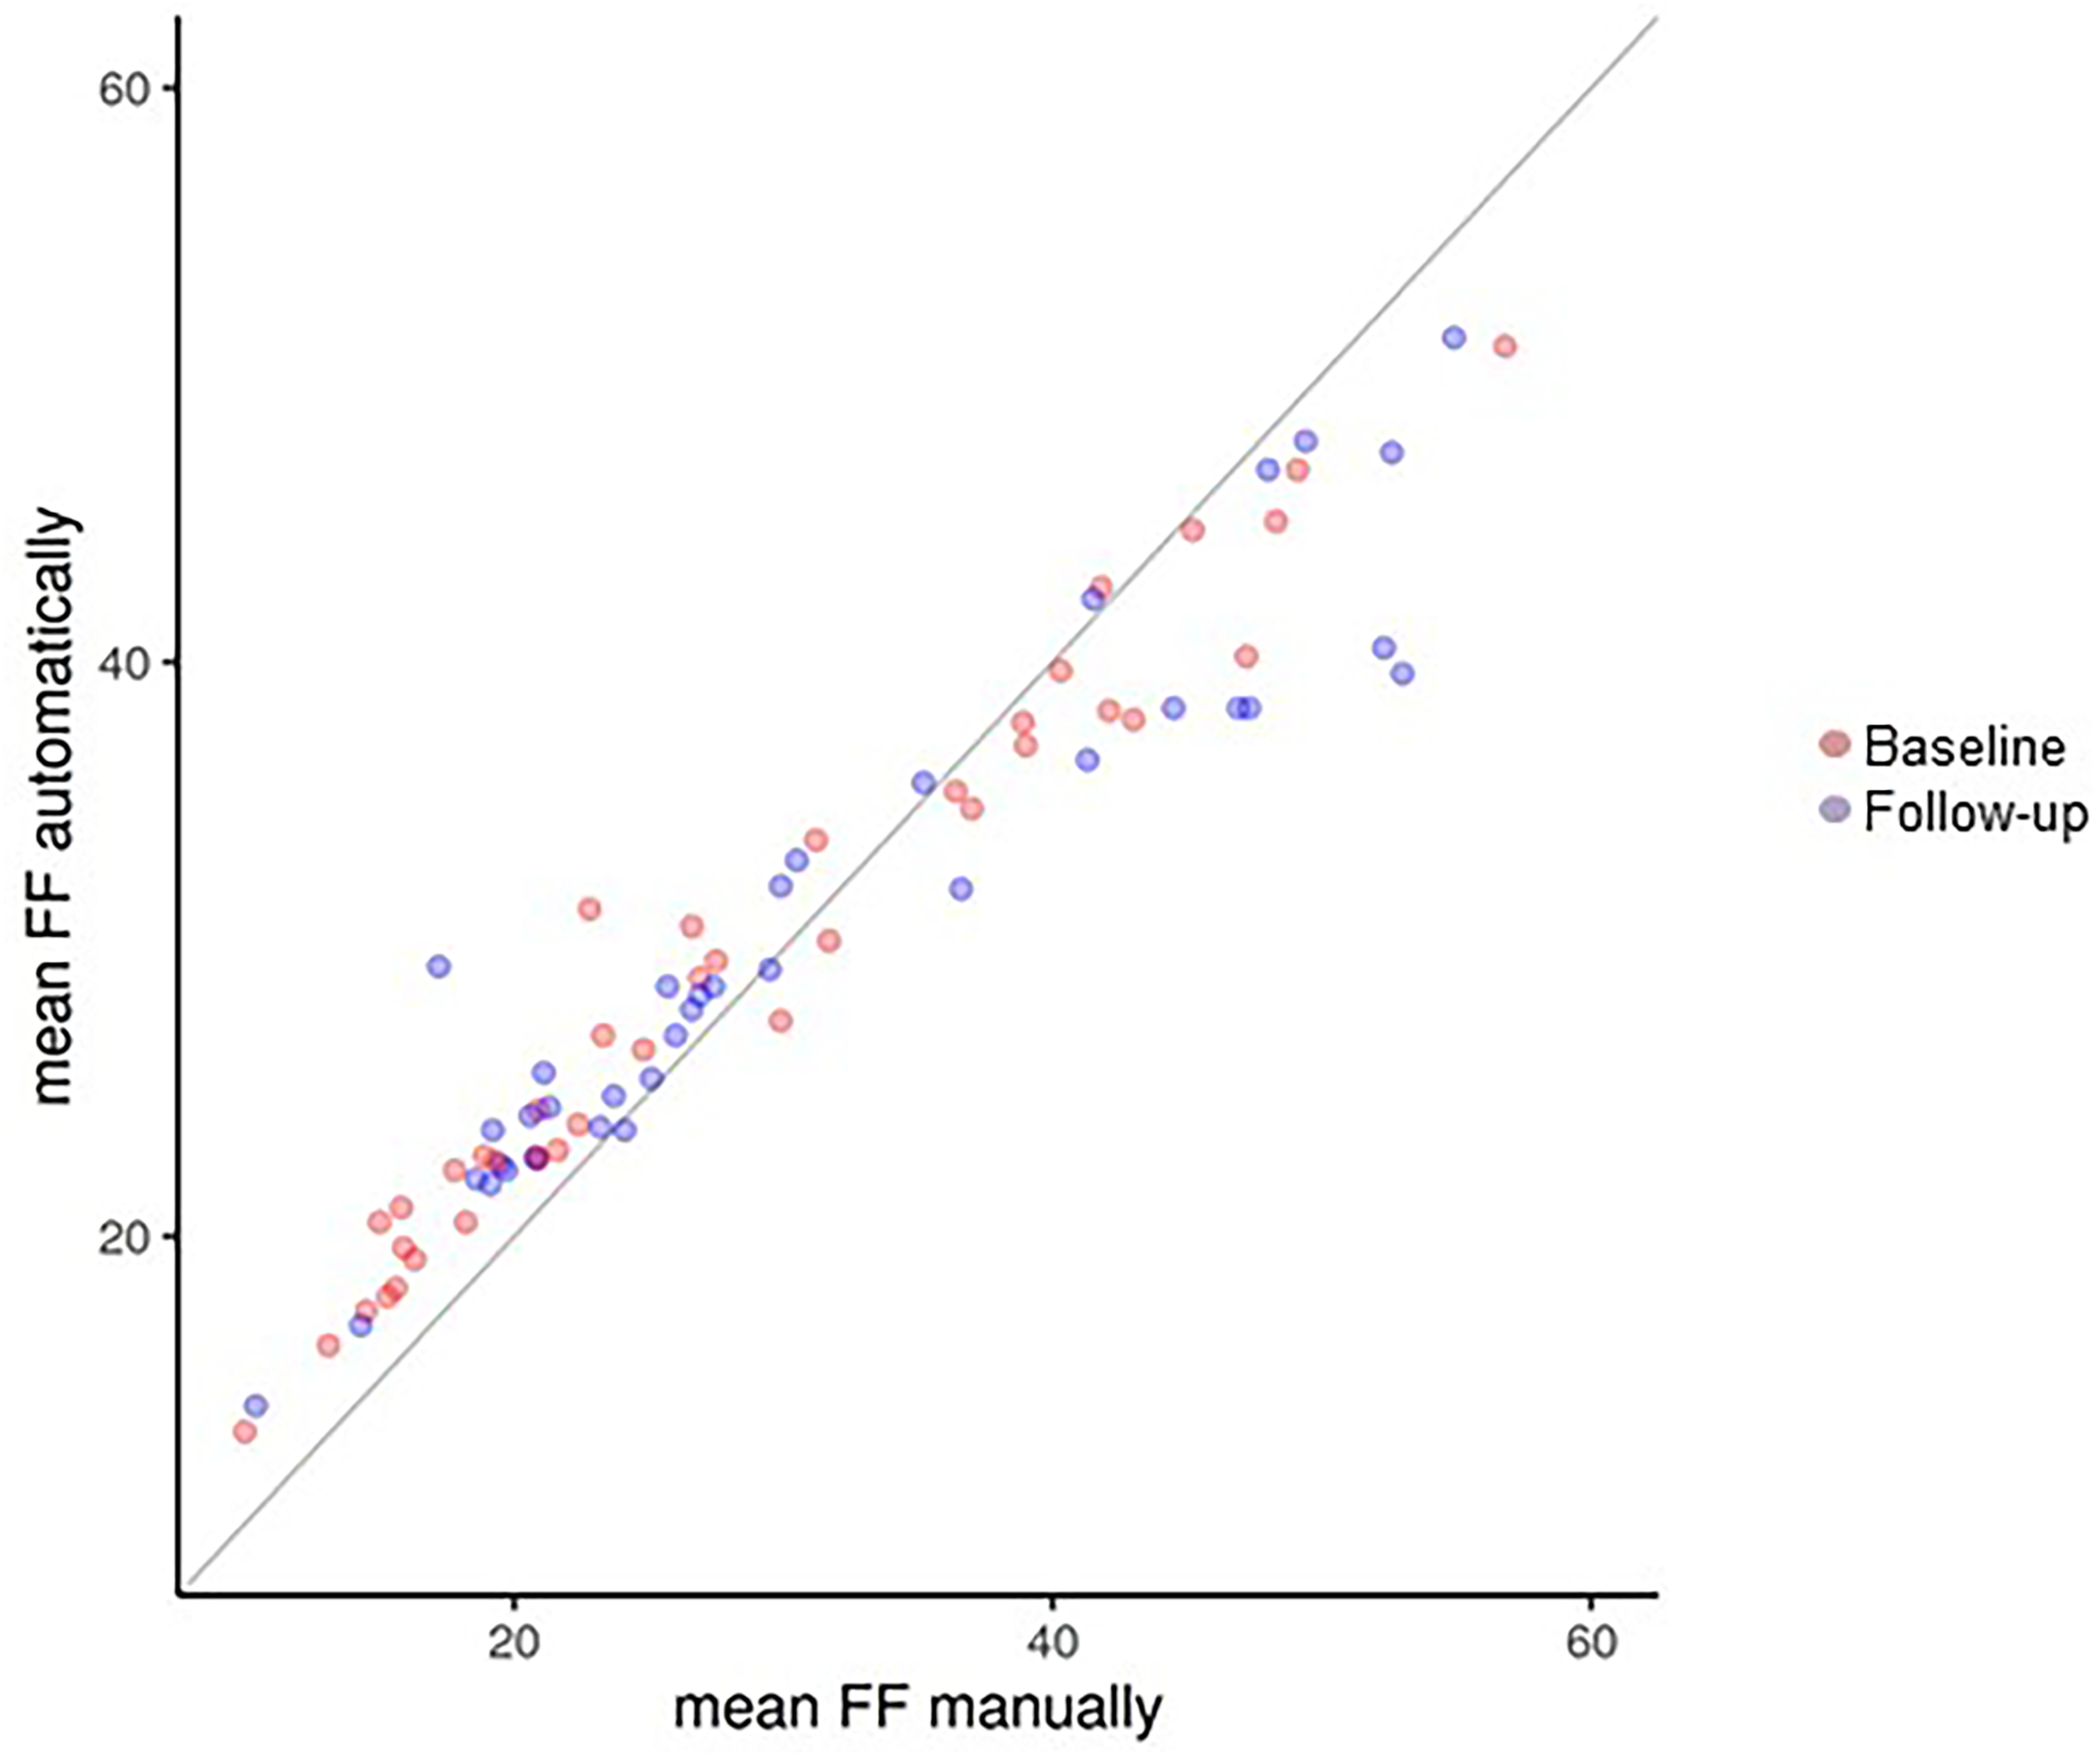
Agreement between muscle fat fraction by manual and automated segmentation.
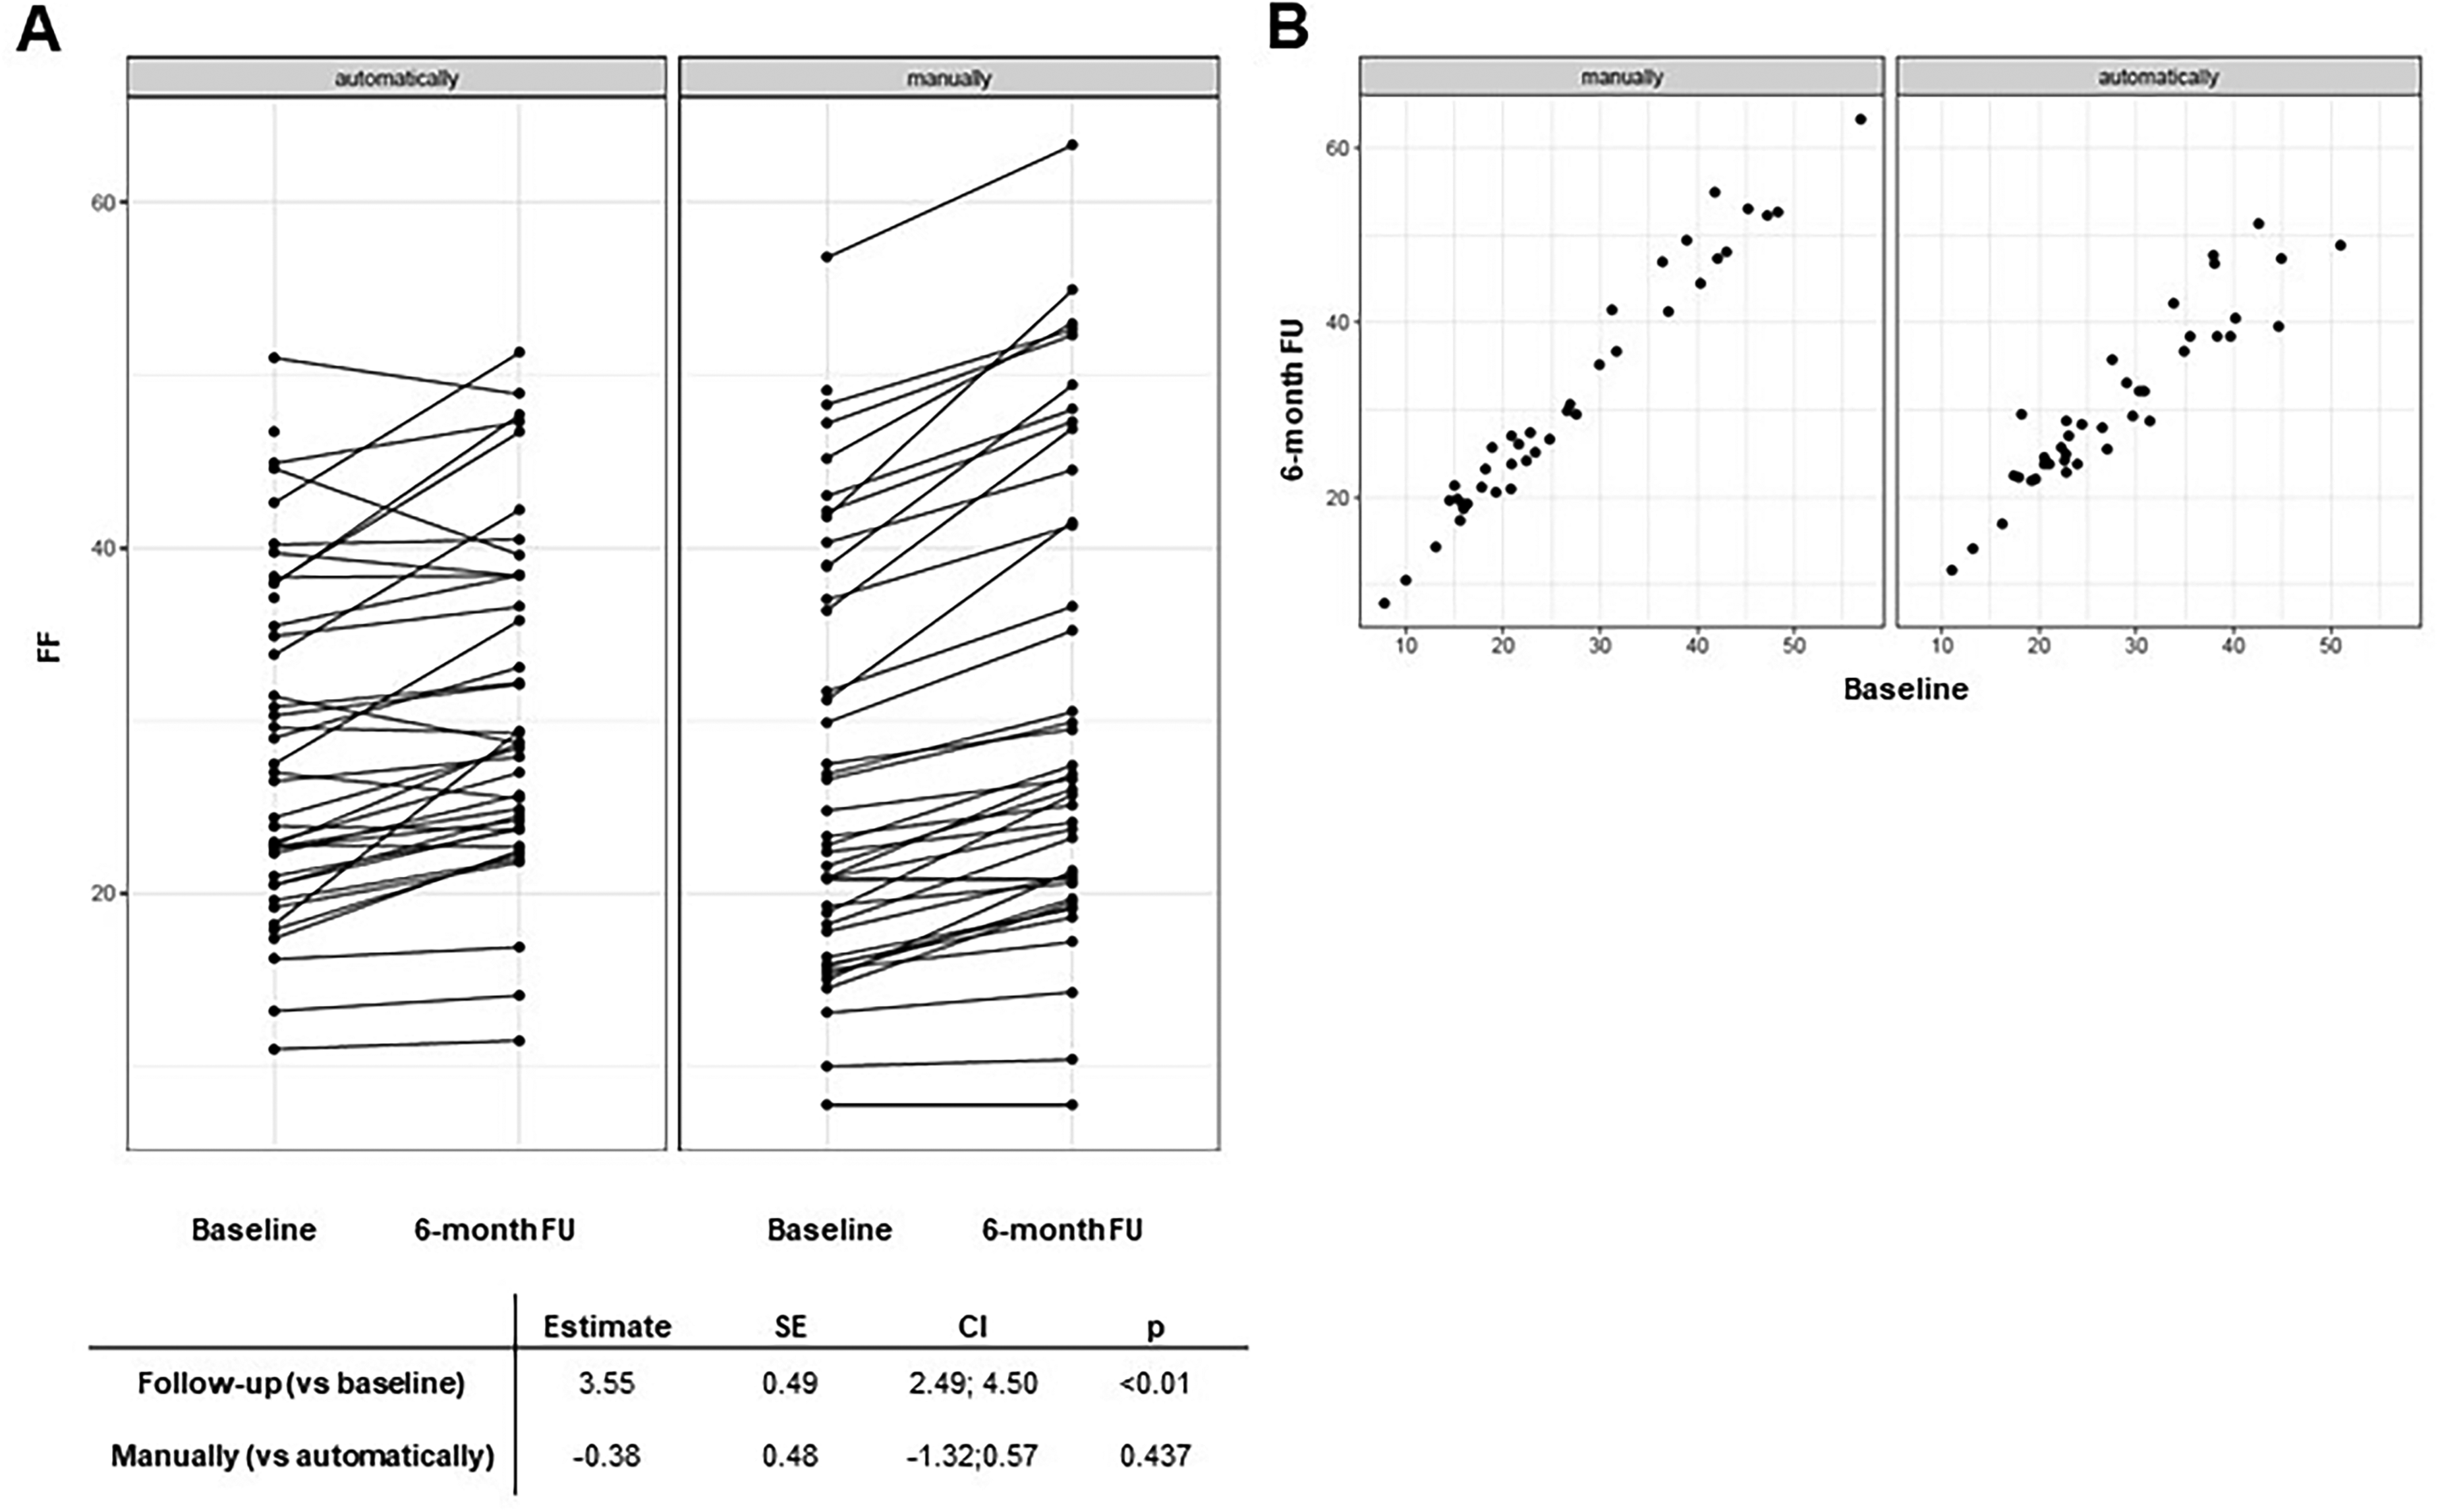
Radiological progression within 6 months measured by manual and automated segmentation. Both the automated and manual segmentation techniques showed signs of progression at 6 months compared to baseline (A); however, the correlation between mean fat fraction at baseline and follow-up was stronger when manual segmentation was used (B).
Validation of automated qMRI analysis using longitudinal correlation of mean ff with clinical outcomes
Longitudinal changes in mean FF were associated with clinical progression measured by the MFM and its D1 domain. Both clinical outcomes correlated well with the automated and manual segmentation data, with no significant difference between the two methods (Table 1). When age at baseline was included as an additional covariate, no change was observed in the results (data not shown).
Association between fat fraction measured by manual and automated segmentation and clinical outcomes.
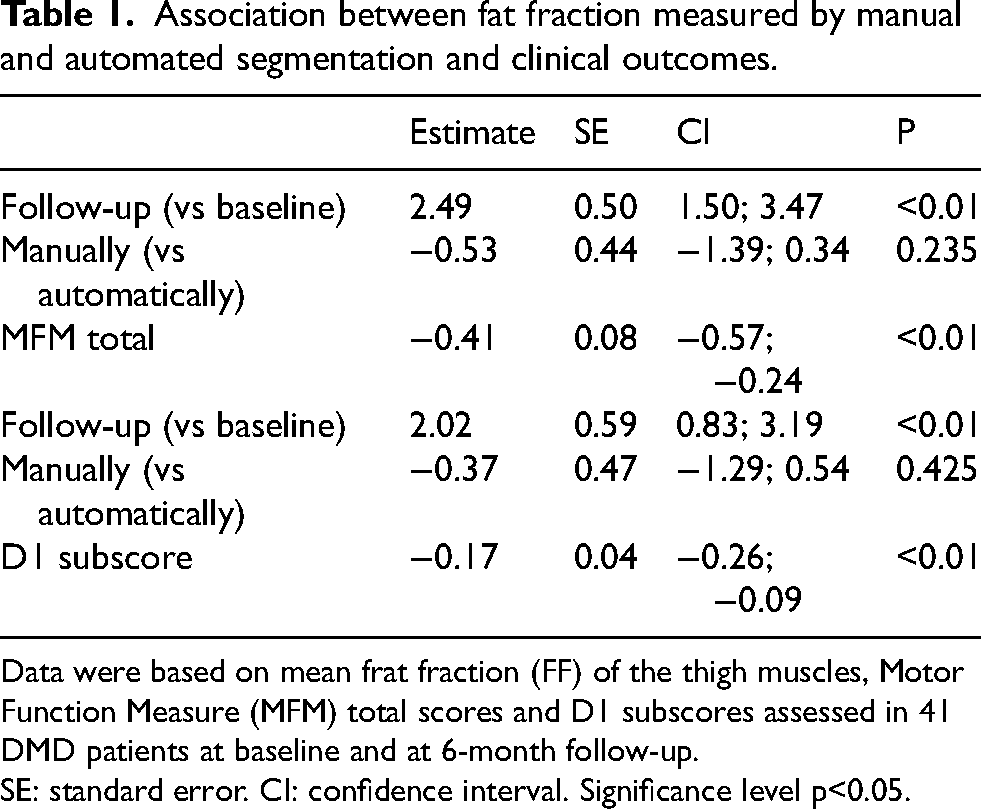
Data were based on mean frat fraction (FF) of the thigh muscles, Motor Function Measure (MFM) total scores and D1 subscores assessed in 41 DMD patients at baseline and at 6-month follow-up.
SE: standard error. CI: confidence interval. Significance level p<0.05.
Agreement between automated and manual segmentation
The agreement between the two methods at baseline and at 6-month follow-up was further analysed using the Bland-Altman plot. Despite the strong correlation between the two methods, Figure 3 represents that automated analysis tends to bias the results toward average FF values, whereas the manual segmentation has greater precision in capturing extreme FF values. As a result, the differences between the methods become more pronounced for very high or very low FF values.
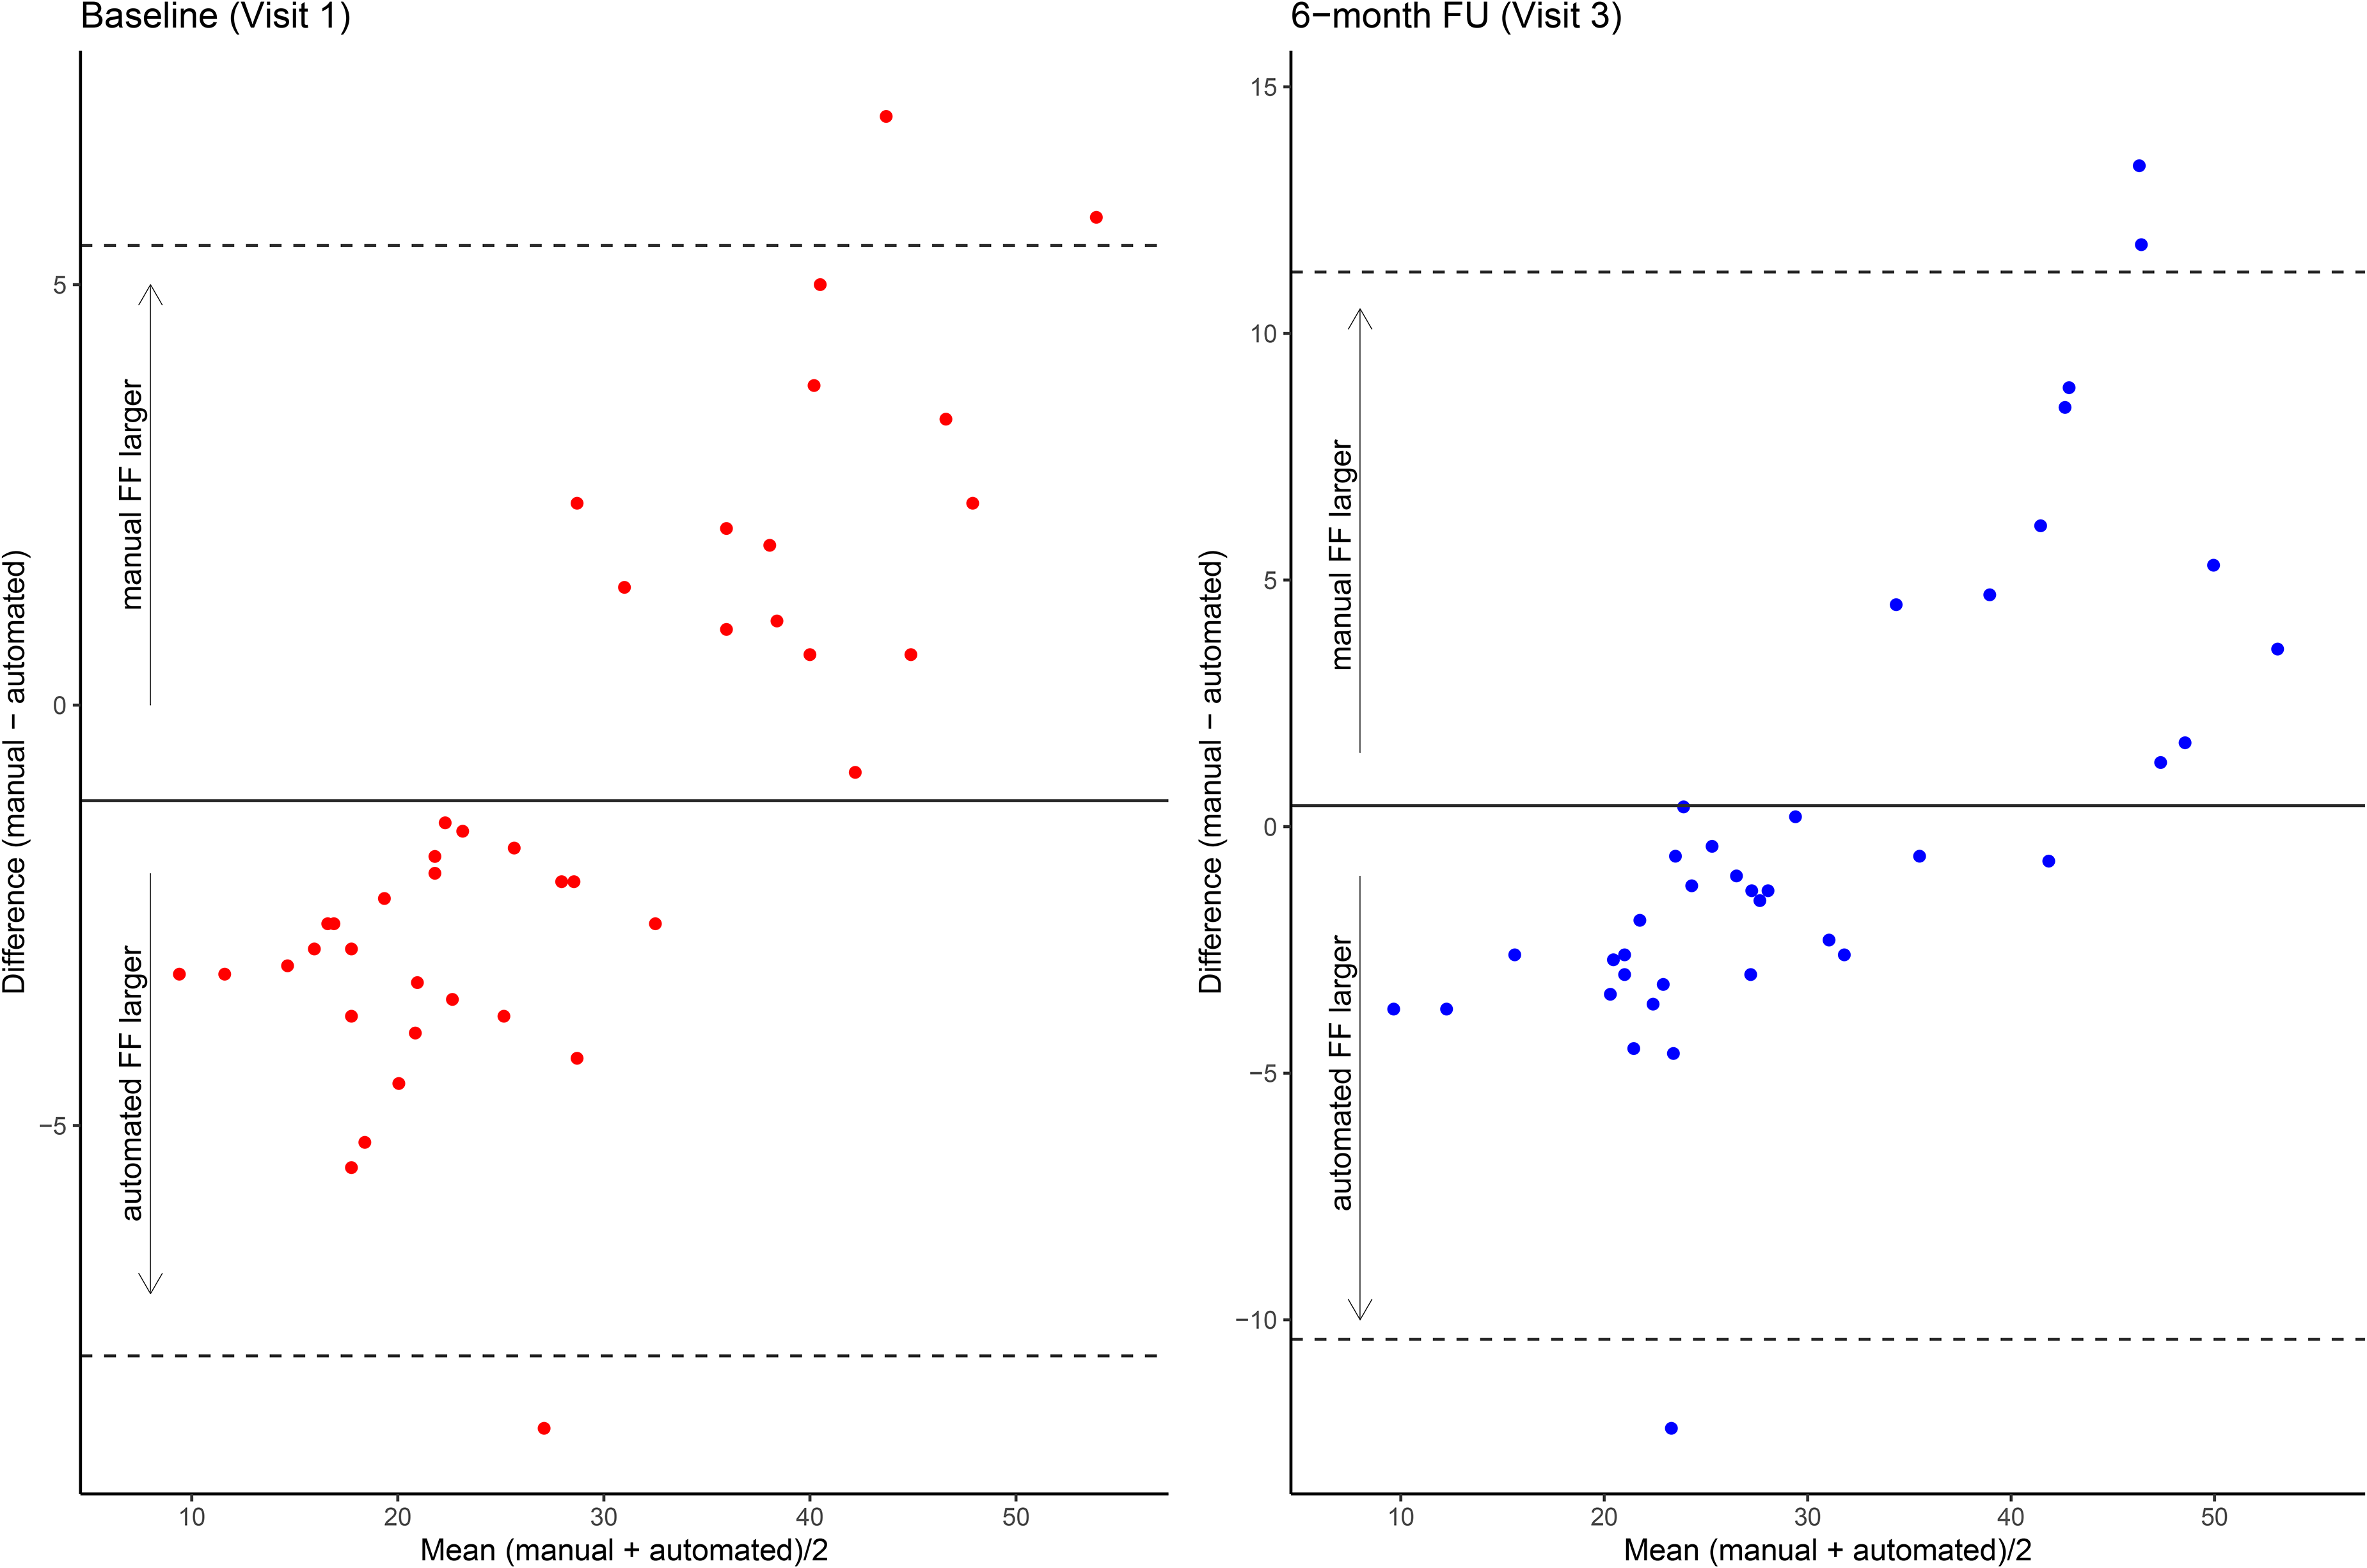
Bland-Altman plot representing the agreement between the automated and manual segmentation method.
Hypothetical sample sizes
For the calculation of hypothetical sample sizes, we assumed a reduction in the mean FF increase of 2% or 4% with active treatment. Additionally, we assumed a correlation between baseline and 6-month follow-up as observed in our data (0.98 for manual evaluation and 0.93 for automated evaluation). Accordingly, after adjusting for FF at baseline, the required sample sizes were smaller for manual segmentation due to the strong correlation between baseline and follow-up values in this group (49 vs. 100 assuming a 2% change, and 13 vs. 26 assuming a 4% change, respectively).
Discussion
In this study, we presented an automated segmentation technique using the k-means clustering algorithm on quantitative muscle MRI in 41 ambulant patients with DMD and tested its reliability against the results obtained by an expert radiologist manually segmenting the same data. Our automated segmentation technique: 1) required only limited manual input to place a rough ROI around the entire muscle area in three axial slices; 2) took less than five minutes to perform, significantly reducing time per MRI study of thigh muscles; 3) reliably detected subclinical progression within six months; and 4) correlated well with manual segmentation and clinical outcomes measured by MFM and its D1 domain. The automated segmentation yielded smaller sample size calculations compared to manual segmentation. However, when adjusting for baseline values, the power gain was significantly larger with manual evaluation. This outcome can be attributed to the strong correlation between baseline and follow-up measurements, facilitated by manual adjustment of ROIs at follow-up using baseline ROIs as a reference. Manual segmentation allows better separation of segmented muscle tissues (bone, fat, connective tissue), enabling more precise ROI definition, even in advanced disease stages. In contrast, automated analysis can struggle with movement artifacts and high muscle fat content in severely affected patients, leading to less accurate segmentation, as the method fails to separate individual muscles and includes intramuscular fat in the analysis (Fig. 4). Consequently, the increase in mean FF assessed by manual segmentation at six months was 2.5%, while the automated segmentation revealed a nearly 5% difference from baseline FF measurements. Nevertheless, we demonstrated that the automated method showed no significant difference in detecting subclinical progression or correlating with clinical outcomes compared to manual segmentation. Furthermore, the observed increase in mean FF aligns with previously reported annual increases in muscle thigh FF ranging from 3.2% to 9.1%, depending on the patients’ age.6,8 As shown in Figure 3, our automated algorithm is designed to find patterns representing most of the data, leading to a bias toward average FF values. This discrepancy becomes even more pronounced at follow-up, where the increased fat content further reduces the automated method's ability to accurately segment individual muscles, and includes both intra- und intermuscular fat. This tendency is part of the noise reduction technique used to smooth extreme values, a phenomenon commonly seen in automated segmentation techniques, including deep learning methods. This issue can be controlled by refining the algorithm or using techniques that specifically address capturing extreme values.
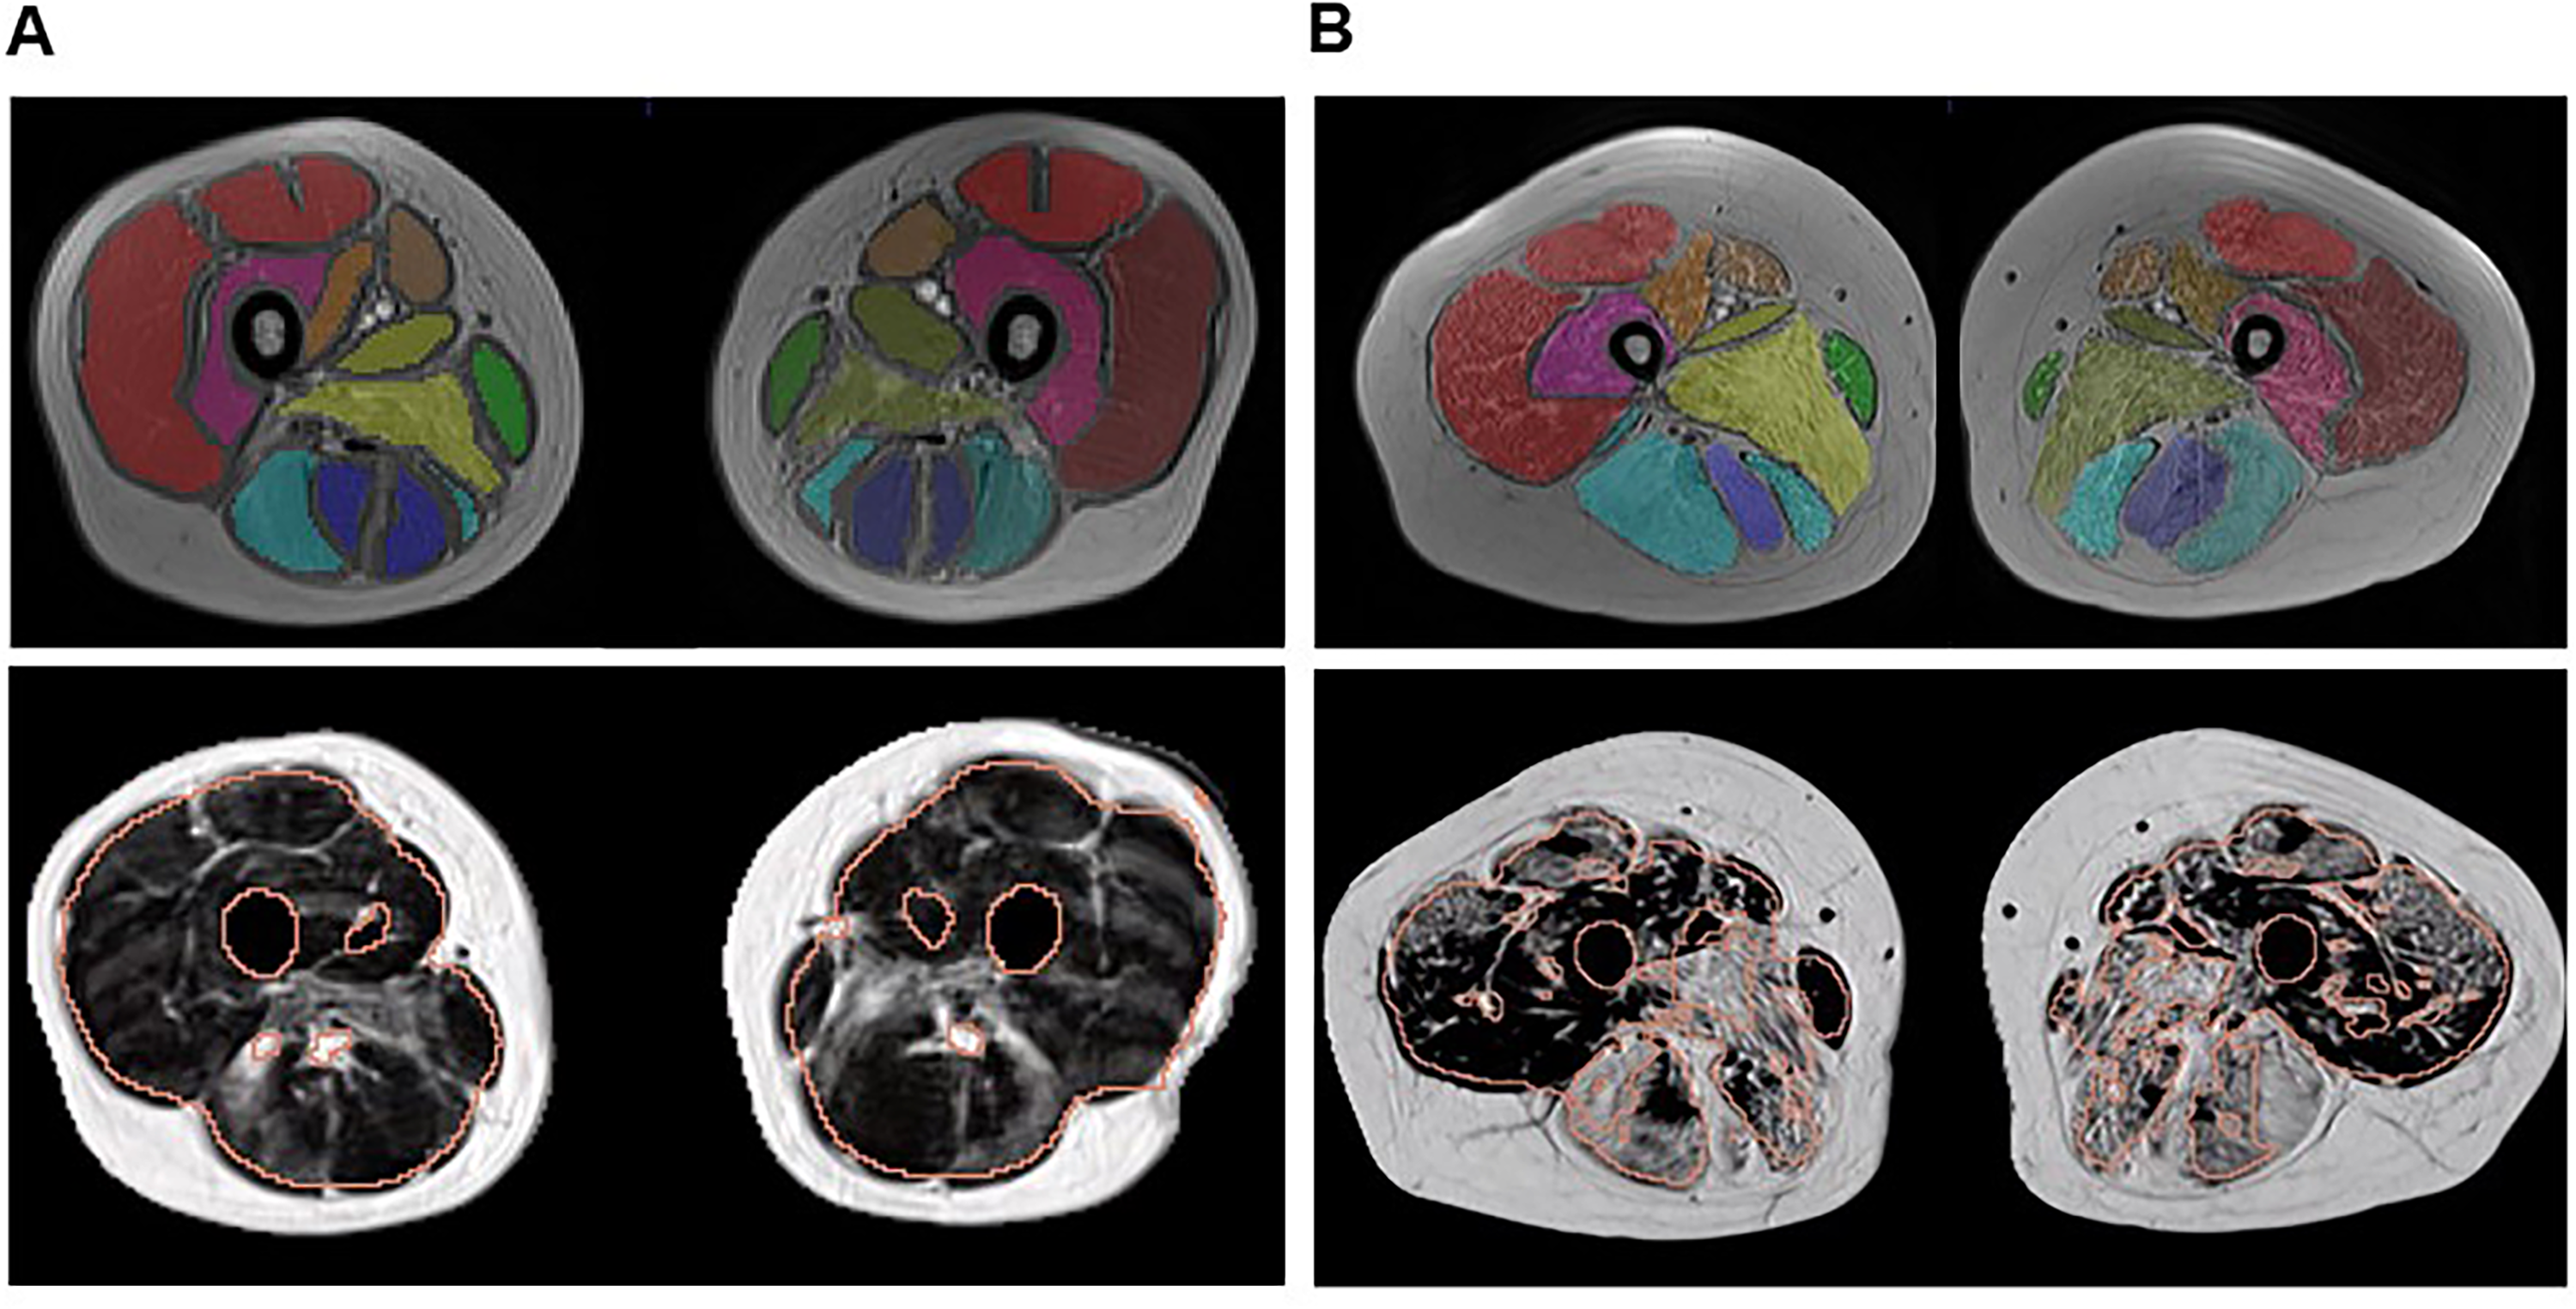
Manual and automated segmentation in two representative patients with DMD.
The main limitation of this method, similar to other automated techniques, is its sensitivity to motion artifacts, image distortions, and individual anatomical variations. Differentiating intramuscular from subcutaneous fat is challenging in cases of severe fatty replacement with high FF, particularly in smaller muscle groups. Thus, short visual quality control and possible adjustment of segmentation results are necessary, even when using automated methods in research or clinical practice. Additionally, the imaging protocol and analysis technique were not specifically designed to measure ongoing muscle inflammation but aimed to minimize the protocol, and consequently, reduce acquisition time, which is particularly important for pediatric patients. This approach, however, does not compromise reliability in assessing disease progression, as previous findings suggest that changes in muscle FF correspond to disease progression, while inflammation remains minimal. 38
The presented segmentation technique was not designed to analyse individual muscles. Future studies should focus on segmenting single thigh muscles in DMD patients, as individual muscles may show varying correlations with clinical outcomes. Nevertheless, reliable automated segmentation of individual muscles in neuromuscular disease remains challenging due to high fat content and individual anatomical differences, often requiring manual steps despite attempts to automate the process. Further research into improved segmentation models is necessary.
Combining different imaging modalities could provide a more comprehensive picture of disease progression and function in neuromuscular conditions, improving diagnosis, monitoring, and understanding of disease mechanisms. MR spectroscopy has identified metabolic markers seen before fat replacement in DMD patients, which can be used as early indicators. 39 Mechanical changes in muscle groups can be detected with MR elastography, while diffusion tensor imaging shows promise for assessing disease severity.40,41 Non-invasive imaging methods for assessing muscle fibrosis are also under investigation, with the potential to improve therapy response assessments in neuromuscular conditions like muscular dystrophies, spinal muscular atrophy, and neuropathies.42,43
Although larger sample sizes and more longitudinal studies are necessary to confirm our findings, the presented automated segmentation technique is still a promising tool for qMRI analysis, particularly in less severely affected patients, who currently form the majority of participants in clinical trials. This segmentation approach is among the few studies validated with manual segmentation in patients with neuromuscular conditions. With further refinement, the automated method has the potential to become a useful surrogate marker for disease progression in neuromuscular disorders. This technique could support clinical trial design, patient stratification, and treatment efficacy assessments, optimizing clinical trials in this field.
Supplemental Material
sj-docx-1-jnd-10.1177_22143602251319184 - Supplemental material for Automated analysis of quantitative muscle MRI and its reliability in patients with Duchenne muscular dystrophy
Supplemental material, sj-docx-1-jnd-10.1177_22143602251319184 for Automated analysis of quantitative muscle MRI and its reliability in patients with Duchenne muscular dystrophy by Sara Nagy, Olga Kubassova, Patricia Hafner, Sabine Schädelin, Simone Schmidt, Michael Sinnreich, Jonas Schröder, Oliver Bieri, Mikael Boesen and Dirk Fischer in Journal of Neuromuscular Diseases
Supplemental Material
sj-pdf-2-jnd-10.1177_22143602251319184 - Supplemental material for Automated analysis of quantitative muscle MRI and its reliability in patients with Duchenne muscular dystrophy
Supplemental material, sj-pdf-2-jnd-10.1177_22143602251319184 for Automated analysis of quantitative muscle MRI and its reliability in patients with Duchenne muscular dystrophy by Sara Nagy, Olga Kubassova, Patricia Hafner, Sabine Schädelin, Simone Schmidt, Michael Sinnreich, Jonas Schröder, Oliver Bieri, Mikael Boesen and Dirk Fischer in Journal of Neuromuscular Diseases
Supplemental Material
sj-jpg-3-jnd-10.1177_22143602251319184 - Supplemental material for Automated analysis of quantitative muscle MRI and its reliability in patients with Duchenne muscular dystrophy
Supplemental material, sj-jpg-3-jnd-10.1177_22143602251319184 for Automated analysis of quantitative muscle MRI and its reliability in patients with Duchenne muscular dystrophy by Sara Nagy, Olga Kubassova, Patricia Hafner, Sabine Schädelin, Simone Schmidt, Michael Sinnreich, Jonas Schröder, Oliver Bieri, Mikael Boesen and Dirk Fischer in Journal of Neuromuscular Diseases
Footnotes
Acknowledgements
The authors are grateful to the patients and their families for their participation in the study.
Funding
The authors received no financial support for the research, authorship, and/or publication of this article.
Declaration of conflicting interests
The authors declared no potential conflicts of interest with respect to the research, authorship, and/or publication of this article.
Data availability
The data supporting the findings of this study are available upon request from the corresponding author. The segmentation code may also be shared with any qualified investigator upon request.
Supplemental material
Supplemental material for this article is available online.
References
Supplementary Material
Please find the following supplemental material available below.
For Open Access articles published under a Creative Commons License, all supplemental material carries the same license as the article it is associated with.
For non-Open Access articles published, all supplemental material carries a non-exclusive license, and permission requests for re-use of supplemental material or any part of supplemental material shall be sent directly to the copyright owner as specified in the copyright notice associated with the article.