
Abstract
With the medical internet of things, many automated diagnostic models related to eye diseases are easier. The doctors could quickly contrast and compare retina fundus images. The retina image contains a lot of information in the image. The task of detecting diabetic macular edema from retinal images in the healthcare system is difficult because the details in these images are very small. This paper proposed the new model based on the medical internet of things for predicting diabetic macular edema in retina fundus images. The method called DMER (Diabetic Macular Edema in Retina fundus images) to detect diabetic macular edema in retina fundus images based on improving deep residual network being combined with feature pyramid network in the context of the medical internet of things. The DMER method includes the following stages: (i) ResNet101 improved combining with feature pyramid network is used to extract features of the image and obtain the map of these features; (ii) a region proposal network to look for potential anomalies; and (iii) the predicted bounding boxes against the true bounding box by the regression method to certify the capability of macular edema. The MESSIDOR and DIARETDB1 datasets are used for testing with evaluation criteria such as sensitivity, specificity, and accuracy. The accuracy of the DMER method is about 98.08% with MESSIDOR dataset and 98.92% with DIARETDB1 dataset. The results of the method DMER are better than those of the other methods up to the present time with the above datasets.
Keywords
Introduction
Diabetes is an increasingly common and rapidly growing metabolic disorder. The World Health Organization estimated that in 2011 there were about 366 million people worldwide with diabetes. And they predicted that by 2030, the number of people with diabetes worldwide would be 552 million people (80% of the population with diabetes living in low-income countries, 50% of whom are not examined and treated) [1]. Diabetes causes many vascular and microvascular complications in target organs such as the kidneys, heart, and eyes. In the eyes, diabetes causes many complications such as ophthalmoplegia, cataracts, and neovascular glaucoma, especially diabetic retinopathy, diabetic macular edema. Diabetic macular edema is a common disease that causes vision loss in the early stages in diabetic patients.
Patients with macular edema often have no obvious symptoms in the early stages. When the blood vessels around the retina are damaged, fluid appears. This fluid has no outlet, so it stagnates at the macula. There are many causes leading to the damage to retinal blood vessels such as complications of diabetes, retinal vein occlusion, retinal vasculitis, etc. In addition, the age can cause the degeneration of macula because of the stagnation of fluid here. The main cause of diabetic macular edema comes from a long-term state of high blood pressure. Vascular endothelial growth factor plays a key role in the pathogenesis through promoting new angiogenesis and disrupting the reticular barrier altering the tight junctions between retinal endothelial cells. This leads to leakage and accumulation of fluid in the macular region.
Machine learning and deep learning applications have been applied by researchers to solve the problem of detecting disc edema [2–5]. This is a difficult job and challenge because the details in the image are very small. If the image is not processed well, the information in the image will be lost. Therefore, detecting anomalies in images may give poor results. To solve this challenge, this paper proposed the DMER method to look for these irregularities in retina fundus images for diabetic macular edema based on optimized deep residual network techniques on the medical internet of things. The method has three stages: (i) the improved ResNet101 combines with feature pyramid network to extract features of the image, to obtain the map of the features; (ii) a region proposal network to look for potential anomalies; and (iii) the predicted bounding boxes against the true bounding box by the regression method to certify the capability of macular edema. To evaluate the results of the method of DMER with the other methods, the MESSIDOR and DIARETDB1 datasets, which are used for scientific research purposes and freely downloaded, are used to test with the evaluation criteria such as sensitivity, specificity, and accuracy. The principal contributions of this paper are as the following:
The process of diagnosing retinopathy remotely via the cloud has been explained. This procedure can help ophthalmologists remotely diagnose eye diseases, especially predicting diabetic macular edema in retina fundus images. Proposing the deep residual network to match diabetic macular edema detection on medical internet of things in the healthcare system. Increasing the accuracy of the diabetic macular edema detection by improving ResNet with 101 classes combined with feature pyramid networks.
The rest of the paper is organized as the following: the literature review is presented in Section 2. The medical internet of things in the healthcare system is presented in Section 3. The experimentation and evaluation results are presented in Section 4. Finally, Section 5 is conclusions and future works.
Literature review
Recently, applying machine learning to solve medical problems is a rapidly developing trend [6–8]. These techniques have been applied in different fields such as: radiology [9], hypertension classification [10], pathology dermatology [11], age-related macular degeneration and premature retinopathy [7, 8], classify arterioles and venules in retina fundus images [12], pancreas segmentation [13], etc. Last time, there were many articles which had applied machine learning to detect diabetic macular edema (DME) from retinal images.
Zou [2] proposed a method to detect the DME from fundus images by using the support vector machine to combine the feature and position properties. After that, the position of the DME is defined by using the Bayesian probability theory. The advantage of this method is to run well for DME influent images. However, its performance needs to be enhanced in the future.
Marin [3] used the Gaussian and the difference of Gaussian filter banks to build a DME detection method. The possible DME regions are classified by applying the regularized local regression classifier. With a sample of 1058 fundus images, the proposed method can operate with a high sensitivity (≈90%). However, the improvement of the proposed method needs to be enhanced for accuracy.
Gargeya [14] proposed a fully automated framework to recognize diabetic retinopathy (DR) based on applying the deep learning method which proved a 10-layer convolutional neural network (CNN) framework to serve various tasks such as: hemorrhages, differentiating exudates and microaneurysms. The results of this method achieved a 0.94 and 0.95 AUC score with MESSIDOR 2 and E-Ophtha databases, respectively. However, the weak point is that it is expensive to build the decision tree.
Perdomo [16] introduced a framework for DR screening which was built based on a two-stage CNN architecture such as deep features calculation and DME classification. Firstly, an eight layered CNN framework is used to calculate deep features from input images. Finally, AlexNet technique is trained to distinguish the healthy and DME influenced images. The result proposed method is effective to detect normal subjects in eye fundus images. However, the proposed method depends on first locating exudates. So, it is not easy to detect the first location exudates with a complex object.
Aqsa [18] reviewed many macular edema detection methods, including both traditional and modern methods. In this research, the authors conducted a total of 143 peer-reviewed articles published from 2000 to 2020 which have relevant macular edema and DME. The authors presented the advantages as well as disadvantages being from the different algorithms. Furthermore, the paper also gave some limitations and further development.
Seoud [19] based on the dynamic shape features to automatically classify DR lesions technically. The features are removed by using a multi-scale ring shaped matched filter. To classify lesions and non-lesion, the random forest classifier is applied. The advantage of this method is that it can detect lesions with high accuracy in various cases, such as resolution differences and light presence in input images. However, the disadvantage was that they did not detect other lesions without red lesions.
Yesilyurt [20] used U-Net combined with DeepLabV3+ to segment the retinal layers and fluid for diagnosing eye diseases. With the experimental results, the Dice score (65.94%) was obtained for fluid segmentation. However, the complexity of the method is large and consumes a lot of resources.
Vo [21] proposes a method for diabetic retinopathy classification using saliency combined with deep Bottleneck U-Net and support vector machines in retinal blood vessels. In this method, to increase the characteristics, the authors used the multi levels of the encoder in two blocks. The important area prediction is kernels for SVM to classify. However, this method could not be to classify different types of diabetic retinopathy.
Imani [22] proved a technique for locating and classifying DR lesions. This technique includes the pre-processed and morphological method. Firstly, Otsu thresholding algorithm was used to deploy the input images to get the green channel and eliminate the unwanted artifacts. After that, the features are calculated by using the morphological component analysis combined with a support-vector machine classifier. This method depends on the test data set. Hower, the authors used global transforms to separate lesions and vessels. They may not be the precision of vessels and lesions separation. So, the selected transforms is not satisfactory.
Albahli [23] proposed a method to segment different types of disease patterns using retina images. The authors used ResNet50, VGG16, and VGG19 models to determine the severity of the retinopathy and macular edema. They used the U-Net model to segment different types of diseases. Although this method can detect different types of disease, this method is complex and the cost for implementation is high.
Tuyet [24] proposed a method to classify diabetic retinopathy based on curvelet saliency for segmentation. The author calculated the saliency map based on curvelet coefficients and classifying by VGG16. The experimental results with STARE and HRF datasets have accuracy about 98.42% and 97.96%. The author chose the Green color channel combined division level saliency of the curvelet transform to increase the accuracy. However, updating the number of blocks in the deep learning models is not easy.
Additionally, many DR and DME detection methods could not obtain better classification performance because of over complex input retinal images. Each DME detection method in these articles has its own advantages and disadvantages.”
Additionally, many DR and DME detection methods could not obtain better classification performance because of over complex input retinal images. Each DME detection method in these articles has its own advantages and disadvantages.
The process of diagnosing retinopathy remotely via the cloud.
The process of diagnosing retinopathy remotely via the cloud
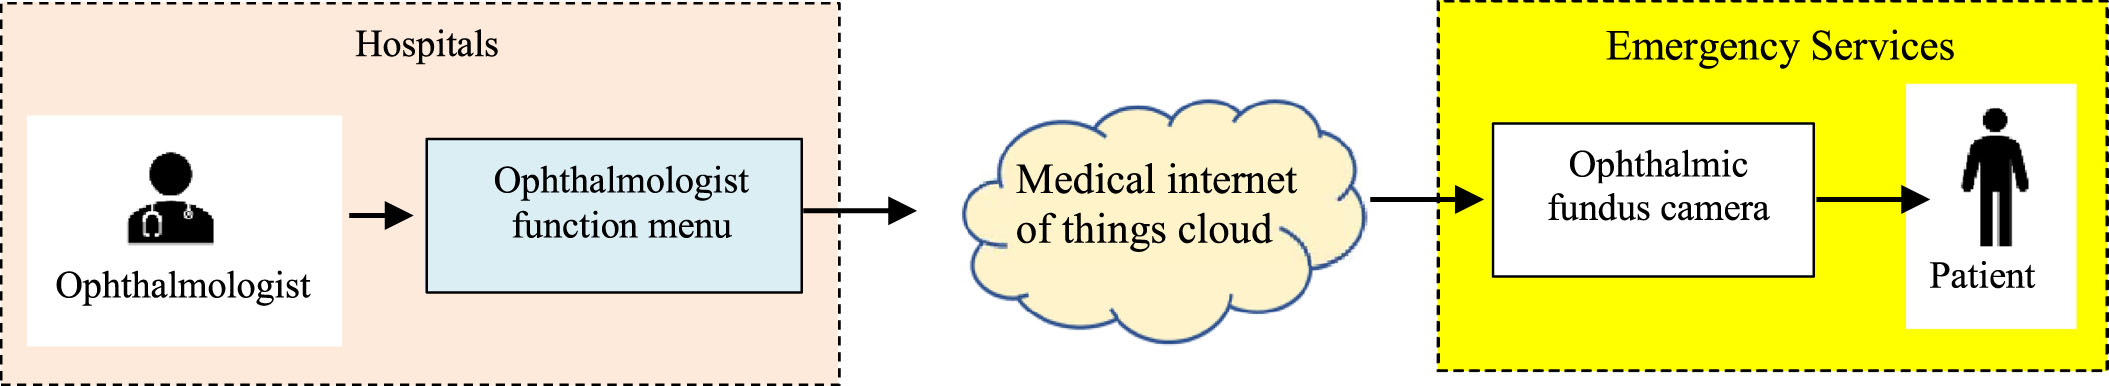
Many advantages of using the medical internet of things cloud in healthcare are the automation of data collection and processing of patient retina fundus images. Figure 1 shows the process of diagnosing retinopathy remotely via the cloud.
An ophthalmologist diagnoses and treats all eye diseases such as glaucoma, medical retina, cornea, uveitis, oculoplastic, etc. The ophthalmologist function menu performs diagnostic functions remotely via the cloud. Medical internet of things cloud in healthcare has strong points such as high reliability, high efficiency and scalability. It can help to improve resource sharing. The layers in the medical internet of things cloud in healthcare presents as Fig. 2. Ophthalmic fundus cameras acquire fundus images. The fundus camera captures the images of the retina, macula, retinal blood vessels, choroid, and the vitreous. It helps the ophthalmologist in the detection and diagnosis of various causes of notably diabetic retinopathy, age-related macular degeneration, etc. A characteristic of ocular fundus images is resolution. The patient is someone who wants to remotely diagnose eye diseases from the ophthalmologist.
Big data in the healthcare system is any data related to health status. It includes clinical metrics, health, and more. This data can be collected from many sources such as sensors, measuring equipment in the hospital (X-ray machine, magnetic resonance imaging machine, eye diagnostic equipment,⋯). It is because the data is collected from many different sources that the data is heterogeneous in structure and complex. The characteristics of big data include: variety, volume, veracity and velocity. Variety adverts to the type’s number of data. Volume adverts to the amount of data. Veracity adverts to both data availability and quality. Velocity adverts to the speed of data processing. These data are stored in the database. Data analytics is the process of mining and analyzing large data sets to find hidden patterns and uncover correlations to gain valuable insights to aid in disease diagnosis. It includes the tasks such as: query, analysis tools, training data, reports, etc.
In the gateway layer, the perception layer will be responsible for predicting diabetic macular edema from the input retinal fundus image. The process of predicting diabetic macular edema in the perception layer includes:
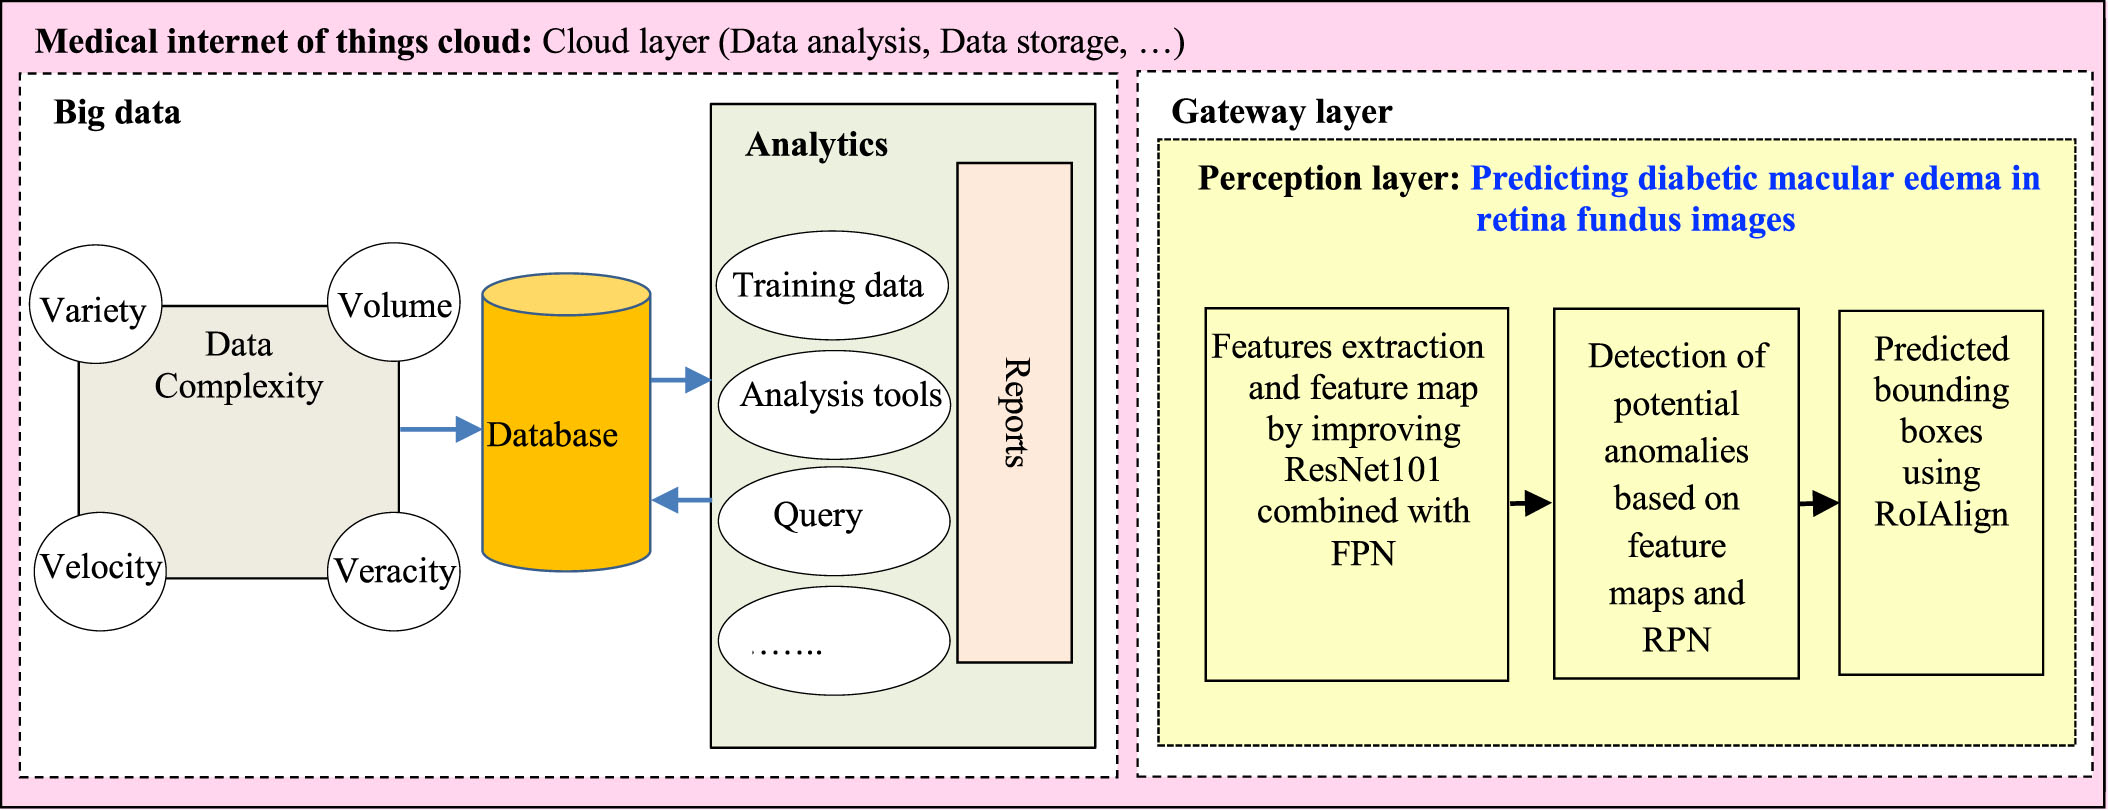
The layers in the medical internet of things cloud in healthcare.
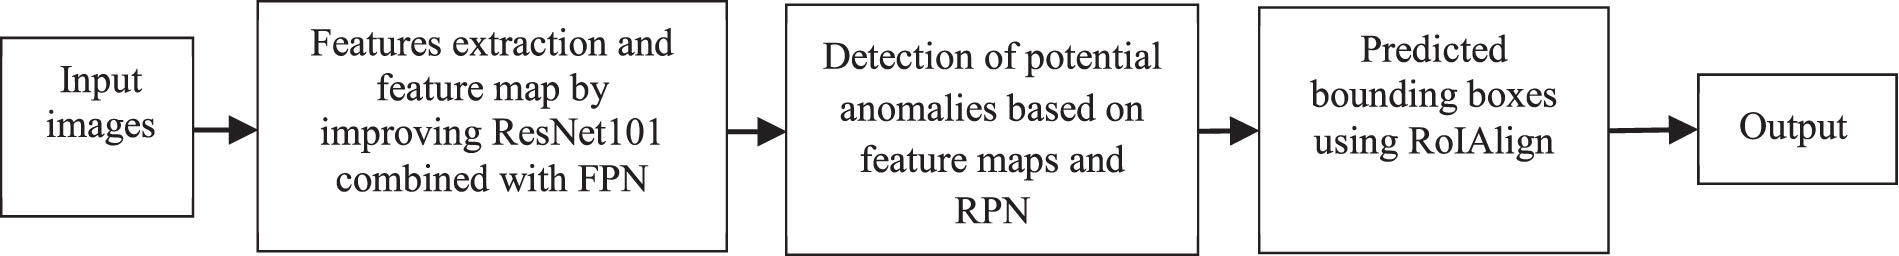
The proposed method DMER for macular edema detection.
Feature extraction and feature map by improving ResNet101 combined with FPN Detection of potential anomalies based on feature maps and RPNs Bounding boxes are predicted using ROI alignment
Details of the processes are presented in section 3.2.
The remote medical internet of things in the healthcare system must diagnose various diseases in real-time. In the perception layer in Fig. 2, we proposed the DMER method to look for these irregularities in retina fundus images for diabetic macular edema. Currently, there are many methods to extract features of images such as VGGNet [25], GoogleNet [26], ResNet [27], DensetNet [28], etc. In the deep complex neural network, researchers usually stack more layers to get highly accurate results. As the number of layers of a neural network increases, the level of accuracy may become saturated and gradually decrease. So, the performance of the model in both training and test data decreases. ResNet101 solved this problem. Deep residual mesh utilizes residual blocks to improve model accuracy. The concept of skip connection at the core of the remaining blocks is the strong point of this type of neural network.
There have been various architectures of the pyramid structure such as: Featurized image pyramid, Single (scale) feature maps, Pyramidal feature hierarchy and Feature Pyramid Network (FPN) [29]. However, every architecture has its advantages and disadvantages. The featurized image pyramid is computed intensively. In the single feature maps, pyramids needed to get the most accurate results. The pyramidal feature hierarchy has not been taken to reuse the multi-scale feature maps from different layers [29]. Here, the proposed method used FPN because: at all levels, the architecture of the FPN was created with much semantics. They combine semantic weak features of high resolution and semantic strong features of low resolution.
In the DMER method, ResNet with 101 classes (ResNet101) combined with Feature Pyramid Networks [30] selected to extract features of the image.
The DMER method presented as in Fig. 3. Firstly, the input image will be reduced to a fixed size. Then, ResNet101 combined with feature pyramid network (FPN) is used to extract features of the image to obtain a feature map. The feature maps will be added to a region proposal network (RPN) to find potential anomalies. Finally, the areas will be classified by using the softmax function and corrected by the predicted bounding boxes against the true bounding box by regression method. Detailed steps are presented below.
a. Features extraction and feature map by improving ResNet101 combined with FPN
Features extraction by improving ResNet101 combined with FPN is the first stage of the proposed method DMER. The ResNet101 network uses many jump connections. So, the total number of required parameters is reduced. The ResNet101 network obtains strong generalization performance, it is not prone to overfitting problems. A retina fundus image contains a lot of useful information, which is necessary in the process of diagnosis and treatment of disease. In this stage, improving feature pyramid network architecture for the steps of feature extraction and feature map is presented in Fig. 4.
To avoid loss of information in the image, ResNet101 architecture in the phase 1 has five layers as follows:
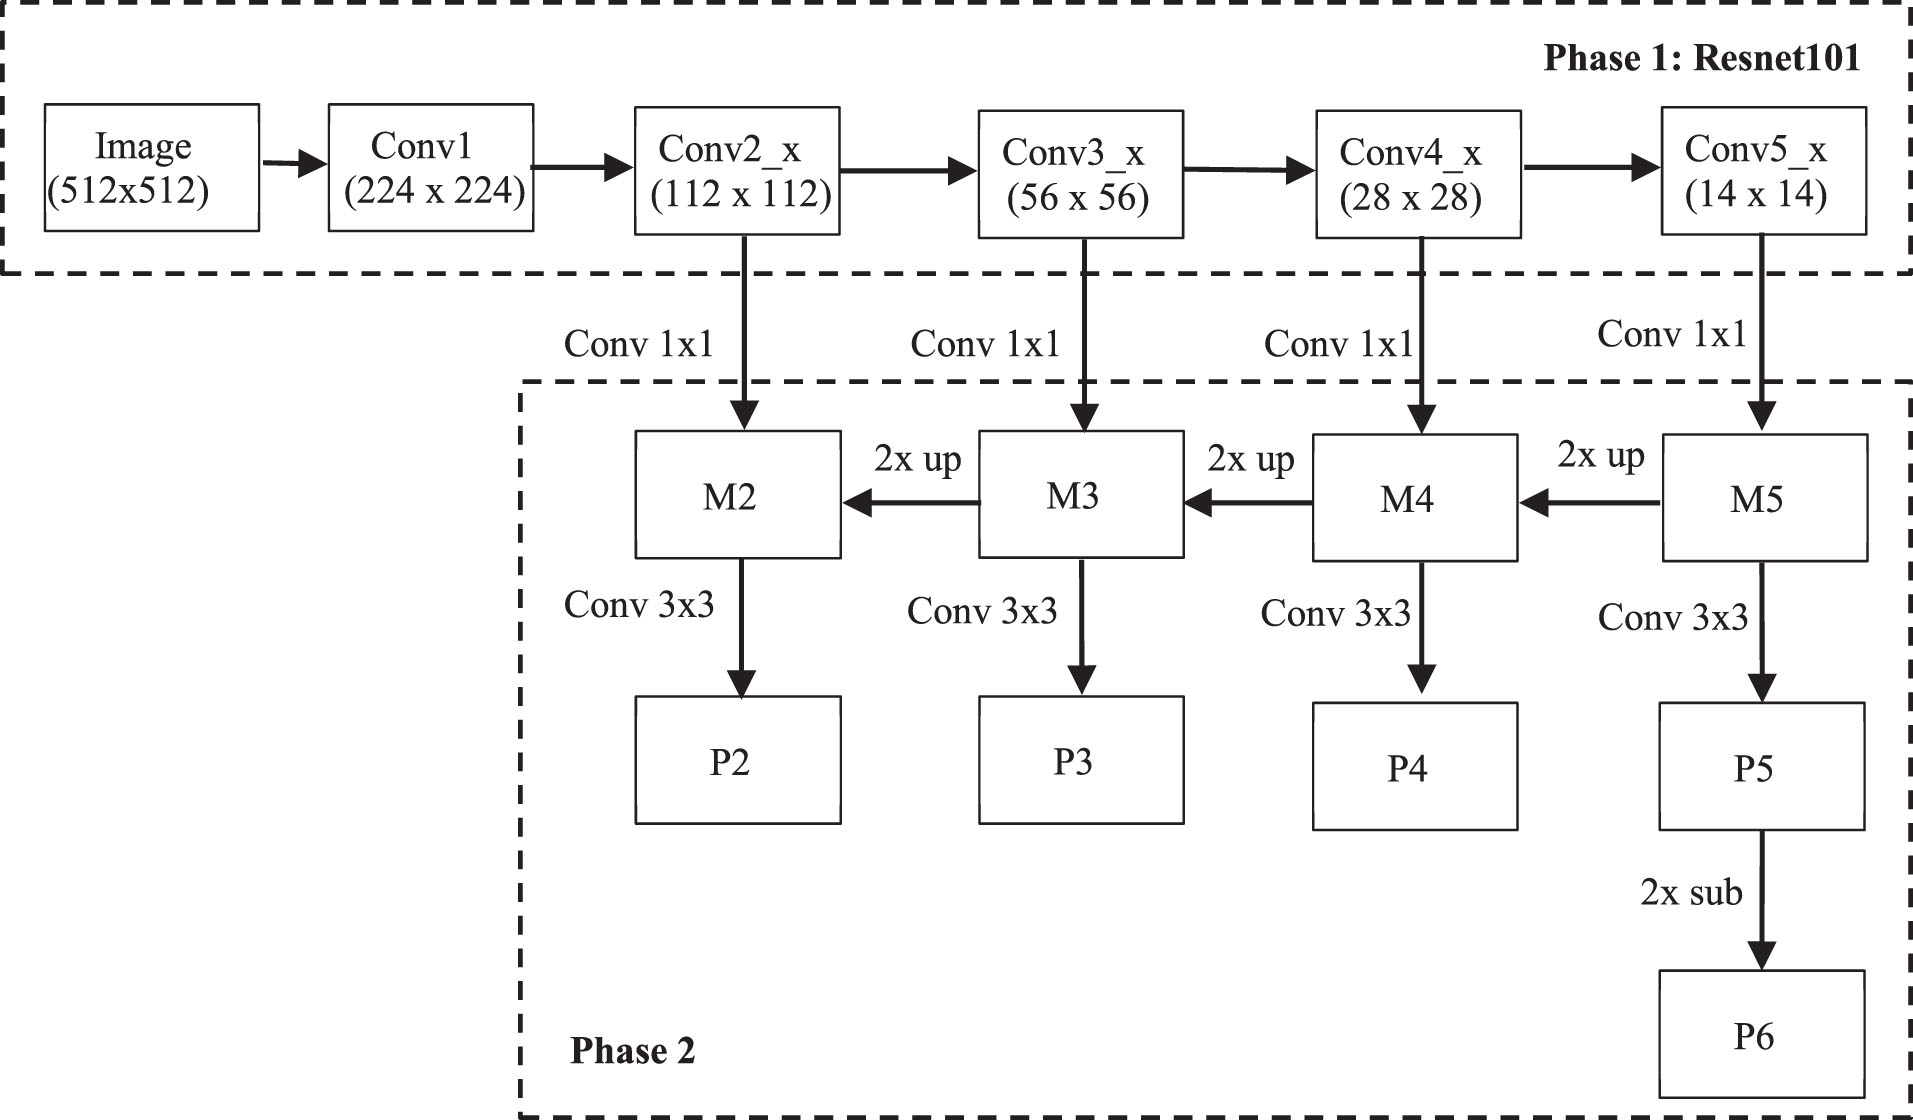
Improving feature pyramid network architecture.
Conv1 consists of a convolution layer with 64 filters, size 7×7, using stride = 2, BatchNorm and MaxPooling of size 3×3.
Conv2_x has 9 convolution layers including 3 residual blocks. Each residual block consists of 1 conv block and 2 identity blocks using 3 convolution layers as 64 filters of size 1×1, 64 filters of size 3×3 and 256 filters of size 1×1 with stride = 1.
Conv3_x has 12 convolutional layers consisting of 4 residual blocks. Each residual block consists of 1 conv block and 3 identity blocks, using 3 convolution layers such as 128 filters of size 1×1, 128 filters of size 3×3 and 512 filters of size 1×1 with stride = 2.
Conv4_x has 69 convolutional layers including 23 residual blocks. Each residual block has 1 conv block and 22 identity blocks, using 3 convolution layers such as 256 filters of size 1×1, 256 filters of size 3×3 and 1024 filters of size 1×1 with stride = 2.
Conv_5 has 9 convolution layers including 3 residual blocks. Each residual block consists of 1 conv block and 2 identity blocks, using 3 convolution layers such as 512 filters of size 1×1, 512 filters of size 3×3 and 2048 filters of size 1×1 with stride = 2.
Table 1 presents the details of convolutional layers of ResNet101. The output of each step in RestNet101 will be used in the phase 2 as follows:
Convolutional layers of ResNet101
Firstly, the convolution with 256 1×1 filters is used to reduce the Conv5_x depth to 256 channels to produce M5. Then, using nearest upsampling combined with convolution of 256 filters of size 1×1 produces M4. Secondly, repeat the same process for M3 and M2. However, it is only done up to M2 because the space size of Conv1 is too large, if executed, it will slow down the processing. Finally, apply a convolution of 256 filters of size 3×3 to all M to obtain P2 to P5. However, FPN requires 5 P layers, so P6 is generated by subsampling from P5 with stride 2.
b. Detection of potential anomalies based on feature maps and RPN
All Ps are pyramid feature maps with 256 channels and used as input to the region proposal network (RPN). After features are extracted from the image, the RPN is used to generate regions of interest (RoI) by using a sliding-window of size n×n sliding over the feature map.
Res [17] uses 3 different anchor sizes, including 1 square, 2 rectangles with a width and length ratio of 1-2, 2-1, along with 3 different ratios. Therefore, there are 3×3 = 9 anchors corresponding to each pixel.
In this proposed method DMER, a square uses 3 different proportions. Therefore, there are only 3 corresponding anchors. The number of anchors in a feature map is calculated based on the size of the feature map, it is equal to W×H×C, where W×H is the size of the feature map, C is the number of anchors corresponding to the feature map pixel.
Suppose that the size of the input image is 448×448 pixels. After the feature extraction, the first layer of the feature map will be 112×112 pixels. We have 112×112 = 12544 pixels, at each pixel we apply anchors of 3 different ratios. As a result, there are 12544×3 = 37632 anchors. Similarly, the 2nd tier will have 56×56×3 = 9408 anchors, the 3rd tier will have 28×28×3 = 2352 anchors, the 4th tier will have 14×14×3 = 588 anchors and the last tier will have 7×7×3 = 147 anchors. A total of 50127 anchors were created.
c. Predicted bounding boxes using ROI align
Intersection over Union (IoU) metric is used to measure the accuracy of an object detector on a particular dataset. IoU is a number from 0 to 1, it specifies the amount of overlap between the predicted and ground truth bounding box. If there is no overlap between the boxes, IoU equals 0. And, if the union of the boxes is the same as their overlap indicating that they are completely overlapping, IoU equals 1.
These anchors will be labeled as positive or negative, based on the overlapping area of the anchors with the actual bounding box of the object as follows:
Anchors are classified as positive if their IoU ratio is greater than or equal to 0.7. Anchors are classified as negative if their IoU value is less than 0.3.
Anchors that do not satisfy the above two conditions are ignored and not used during model training.
After using RPN, the obtained RoIs may be overlapped. Therefore, we need to use Non-Maximum Suppression (NMS) algorithm [31] to remove overlapping RoIs on the same object. The idea of using NMS is as follows:
Firstly, initialization: Suppose A is the set of RoIs obtained. S is the set of confidence scores corresponding to the RoIs in A. T is the NMS threshold. Secondly, create an empty set E Thirdly, choose RoI with the highest confidence score, remove from A and add to E. Fourthly, compare the newly added RoI in E with all the existing RoIs in A by calculating the IoU value. If the IoU value is greater than T, then remove RoI from A. Finally, continue making RoI selections and comparisons until there are no more elements in A.
The proposed object detection areas in the image need to go through a fully connected layer for classification. However, this class requires a fixed input size. The features passing through the RPN yield different size RoIs. Therefore, these RoIs must go through a RoI Pooling layer, called RoI Align, to make them get the same size before entering the fully connected layer.
RoI Align calculates the value of each sampling point by bilinear interpolation from neighboring points using Equation (1) [32] in the feature map. Then, Max Pooling is used to obtain a feature map with a fixed size of output.
These feature maps will be flattened and passed through 2 fully connected layer branches:
First branch is used to classify objects with (N + 1) class, where N is the total number of classes and 1 is the background. Second branch is bounding box regression to fit the obtained coordinates of the RoI regions to the actual bounding box, consisting of 4-D N output nodes, representing the 4 offset coordinates (x, y, w, h).
Datasets for predicting diabetic macular edema
Experiments are developed in Python with the computer configuration of Intel core i7, 2.9 GHz CPU,16 GB DDR2 memory. The MESSIDOR dataset [15] and DIARETDB1 dataset [37] are used for experimentation. These databases are used for scientific research purposes and freely downloaded. The MESSIDOR database contains the 1200 eye fundus color numerical images. The size of images is 8 bits per color plane at 1440×960, 2240×1488 and 2304×1536 pixels [15]. These images were acquired by the color video 3CCD camera and a Topcon TRC NW6 non-mydriatic retinography with a 45 degrees field of view. Each image has been defined under tiff format. In this dataset, hard exudates have been used to grade the risk of macular edema [15].
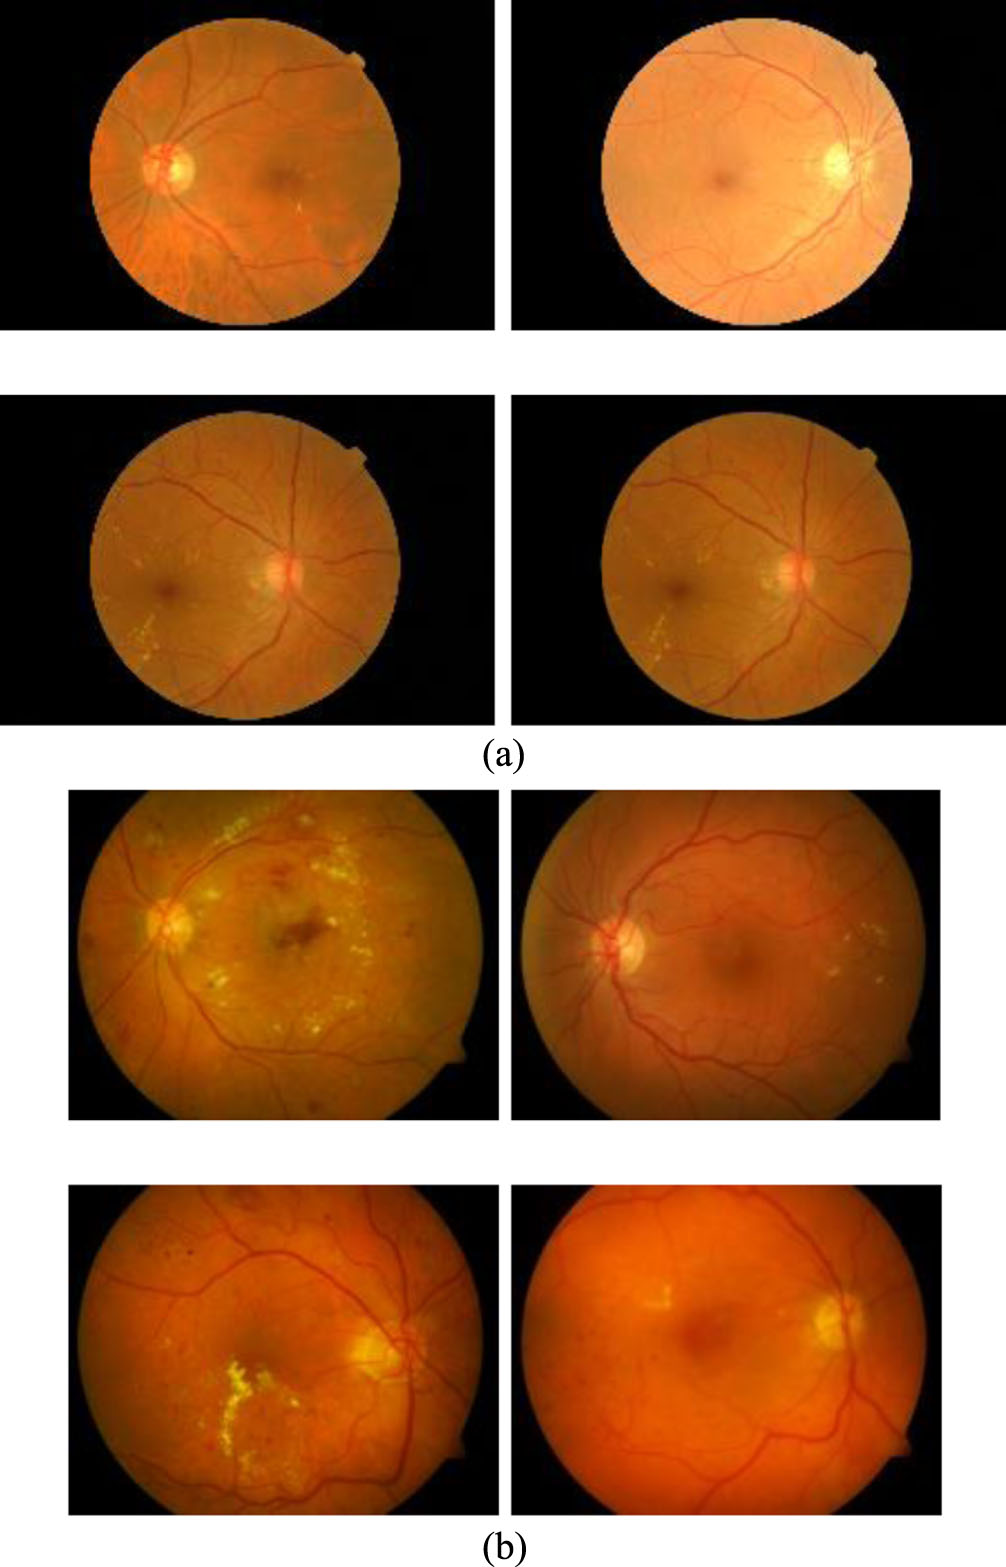
The DIARETDB1 dataset has 84 images containing non-proliferative diabetic retinopathy symptoms and the other 5 non-diseased fundus images according to all experts who participated in the evaluation. Each image was captured at 1500 by 1152 pixels under png format [37]. Some of images of these datasets have been presented in the Fig. 5.
With each of the above dataset, the experimentation used 70% dataset for training and 30% for testing to evaluate the results. The images are cropped to the size of 512×512. And these images augmented the dataset by rotation, scaling, clipping, etc. as presented in Table 2. Consequently, the size of the training dataset is expanded to 1500 images. Some retinal blood vessel images in the MESSIDOR dataset [15] and DIARETDB1 dataset [37] are presented in the Fig. 5.
Data augmentation parameters
To evaluate the results of the detection process, the true positive rate (TPR) and accuracy are used to evaluate the metrics of the results of the DMER method.
Sensitivity (Se) defines the ability to detect macular edema images and ranges from 0 to 1. It is the ratio between the numbers of macular edema images detected by the proposed method DMER and the total number of macular edema images in the test dataset. The value of sensitivity range is calculated as in the Equation (2)
where, TP is the number of true positives and FN is the number of false negatives. P and N are the total number of non-responsive and responsive samples in the dataset, respectively.
Specificity (Sp) defines the ability to distinguish images that have macular edema or not and ranges from 0 to 1. It is the ratio between the number of normal images that the proposed method can distinguish and the total number of normal images in the test dataset. The value of specificity ranges is calculated as in the Equation (3).
where, TN is the number of true negatives, FP is the number of false positives.
Accuracy (Acc) represents the result accuracy of the proposed method DMER in the test dataset, and ranges from 0 to 1 (equivalent in the range from 0% to 100%). The accuracy values are calculated as in the Equation (4).
The experimentations are implemented with all the images in the above datasets. This section only presents two case studies as in Figs. 6 and 7.
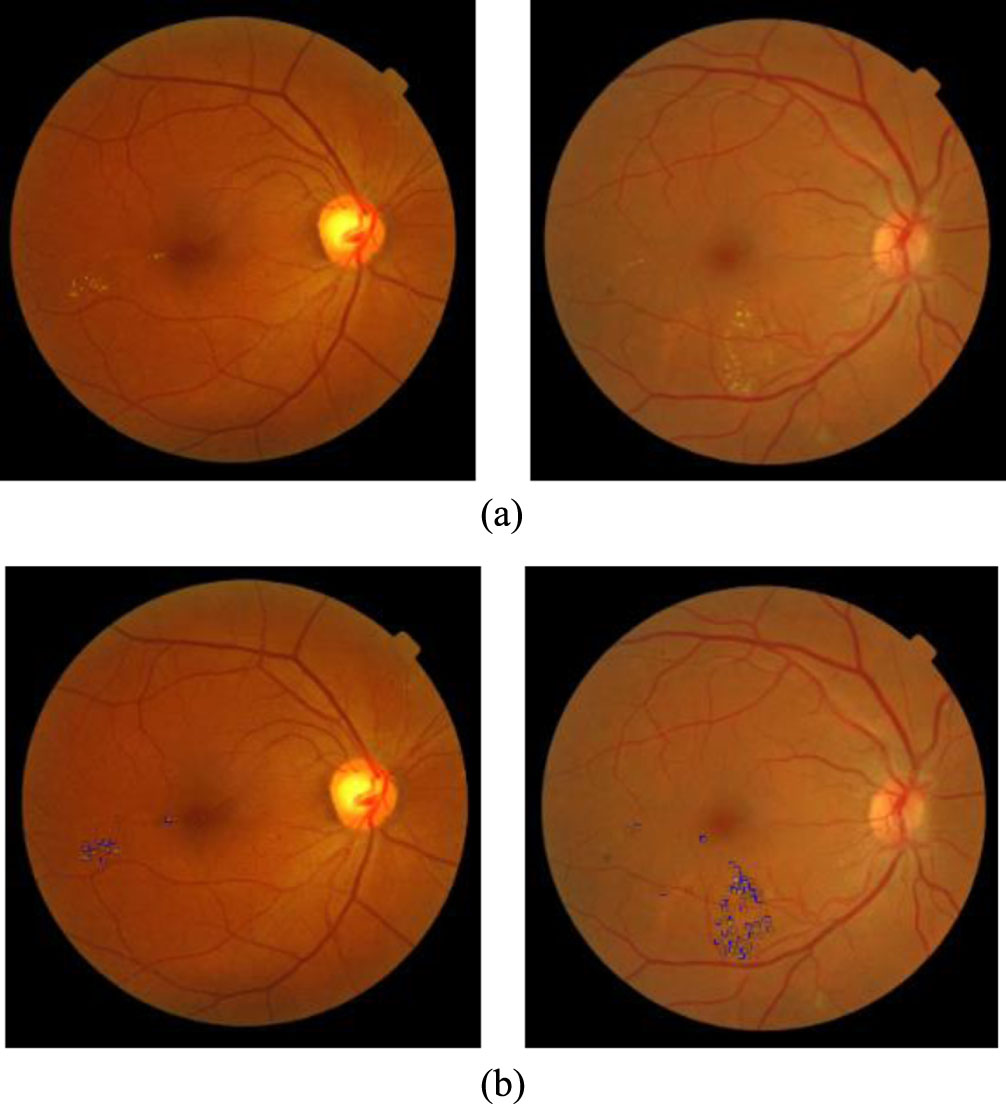
Some images results of the DMER method from the MESSIDOR [15] test dataset. (a). Original image. (b) Diabetic macular edema detection.
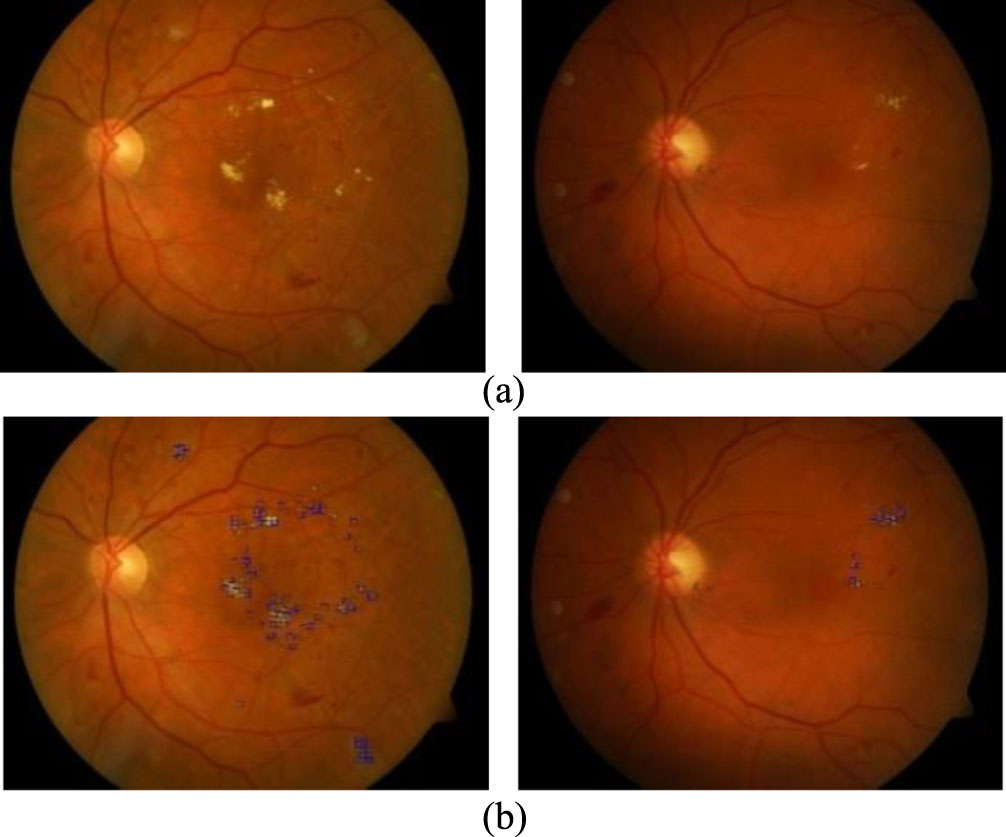
Some images results of the DMER method from the DIARETDB1 [37] test dataset. (a). Original image. (b) Diabetic macular edema detection.
Figures 6 and 7 presented some image results of the proposed method DMER when using the MESSIDOR and DIARETDB1 test datasets, respectively. From the above experiments and others, the DMER method works well and gives reliable results. Figures 8 and 9 presented the images partially extracted from the datasets, respectively.
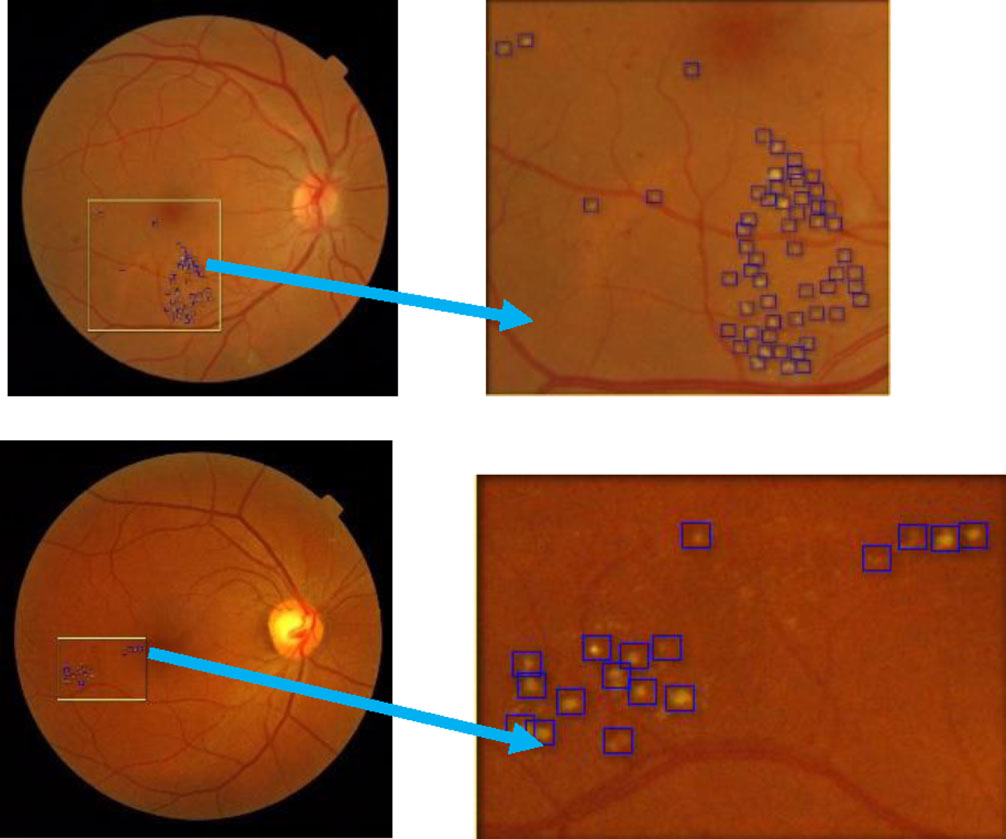
Partially extracted image from the image in the MESSIDOR test dataset.
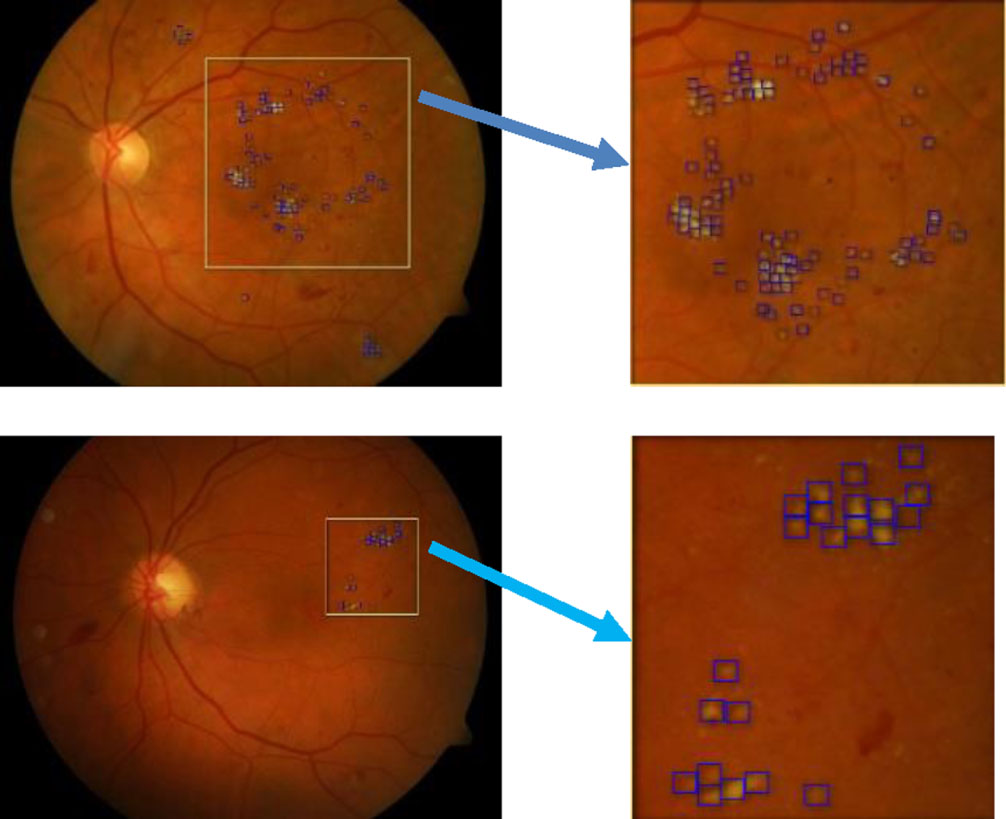
Partially extracted image from the image in the DIARETDB1 test dataset.
The test results over the MESSIDOR dataset with sensitivity, specificity and accuracy evaluation
The test results over the DIARETDB1 dataset with sensitivity, specificity and accuracy evaluation
In Figs. 8 and 9, we see the results of the DMER method detect diabetic macular edema in retina fundus images with high accuracy. Tables 3 and 4 presented the results of the evaluation of the proposed method DMER on the above datasets. Time for test in the tables expresses the duration we try each image in the test datasets mentioned.
In Tables 3 and 4, after twenty experiments, the average of accuracy was high, with 98.08% and 98.92% when using the MESSIDOR and DIARETDB1 test datasets, respectively. As shown in Tables 3 and 4, the average execution time of the proposed method with MESSIDOR dataset and DIARETDB1 data set (tested in 20 images of each data set) is 0.1990 and 0.1975 seconds, respectively. The computer configuration for the experimentations is Intel core i7, 2.9GHz CPU, 16 GB DDR2 memory. Low execution time proves that the proposed method is effective in predicting diabetic macular edema in retina fundus.
Tables 5 and 6 presented the results of the evaluation of the DMER method over the above datasets with other methods.
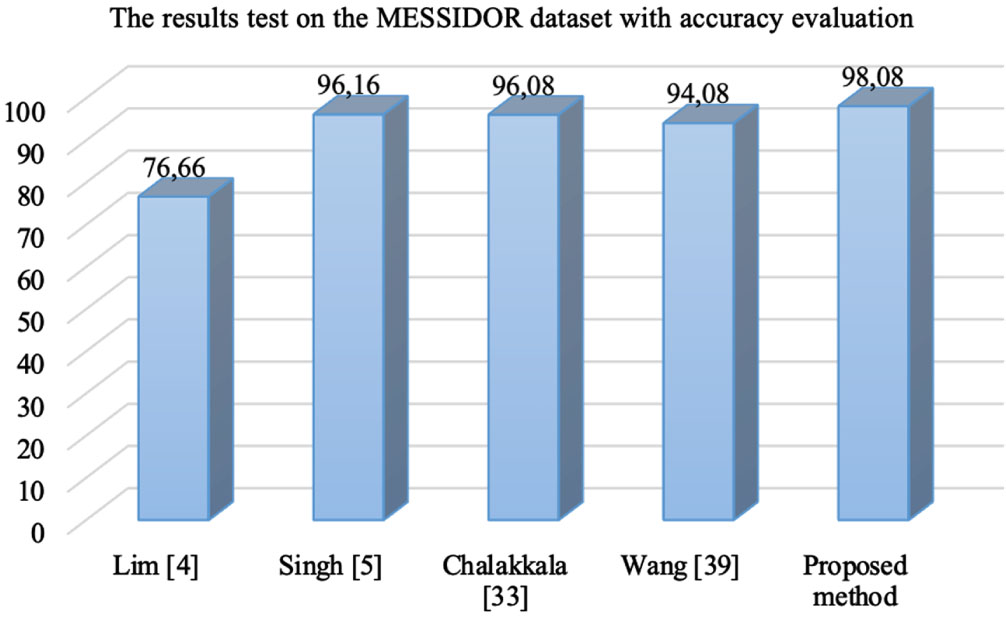
In the Table 5, with MESSIDOR dataset, Lim method [4] used local binary pattern and support vector machine classifier for diabetic macular edema classification with the accuracy of 76.66%. Singh [5] used the DMENet algorithm and hierarchical ensemble of CNNs for diabetic macular edema diagnosis with the accuracy 96.16%. Chalakkala [33] used to combine a pre-trained deep neural network with meta-heuristic feature selection for automated screening of clinically significant macular edema with the accuracy 96.08%. Wang [39] proposed a fusion model simultaneously for diabetic macular edema classification and hard exudate lesion detection with the accuracy 94.08%. The weak point of this method was that it did not integrate the fusion model and anatomical landmark detector together. The accuracy of the proposed method DMER is 98.08%. The accuracy values in Table 5 presented visually as in Fig. 8.
The test results over the MESSIDOR dataset with sensitivity, specificity and accuracy evaluation
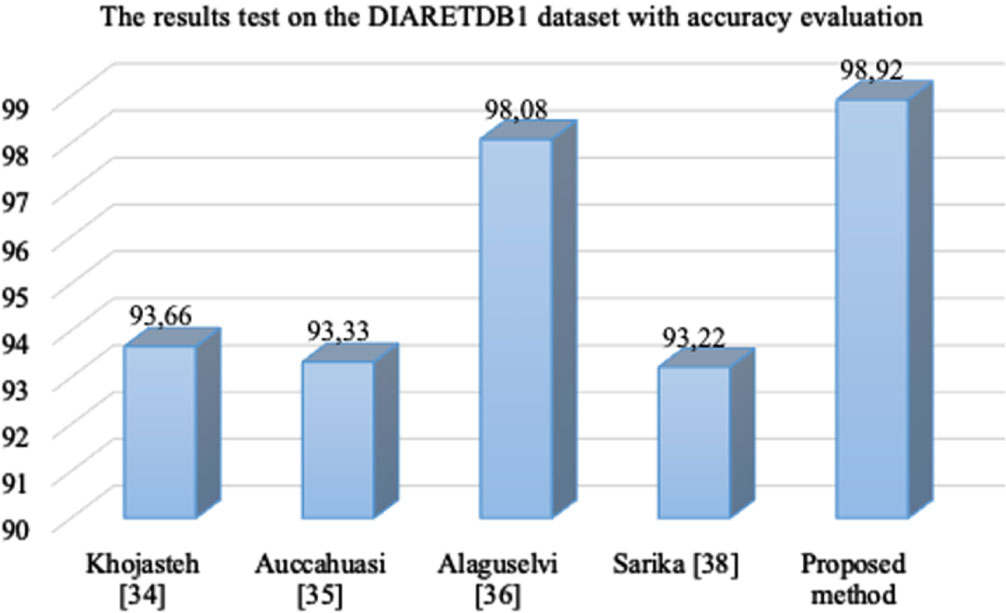
In the Table 6, with DIARETDB1 dataset, Khojasteh [34] used convolutional neural networks for automatic analysis of fundus images to detect signs of diabetic retinopathy with the accuracy 93.66%. Auccahuasi [35] used CNN for the automatic recognition of hard exudates in retinal images with the accuracy 93.33%. Alaguselvi [36] proposed the method to detect lesions in the fundus retinal images by matching filter with morphological operation with the accuracy 98.08%, Sarika [38] combinated CLAHE, morphological operations, and Kirsch’s mask with the accuracy 93.22% while the accuracy of the proposed method DMER over this dataset is 98.92%. The accuracy values of all methods in Table 6 are also presented visually in Fig. 9.
The test results over the DIARETDB1 dataset with sensitivity, specificity and accuracy evaluation
From Figs. 10 and 11, we see the results of the proposed method DMER are better than those of the other methods over both MESSIDOR and DIARETDB1 datasets. As presented in Section 3, the researchers usually stack more layers to get highly accurate results. Once the number of layers of a neural network increases, the level of accuracy becomes saturated and gradually decreases. ResNet101 solved this problem by combining with FPN, which is used to extract the features of an image and to obtain the feature map. So, the proposed method DMER can find more features of abnormality in retinal images. Moreover, at all levels, the architecture of the FPN was created with much semantics. They combine high-resolution semantic weak features and low-resolution semantic strong features. These are the reasons why the method DMER gives better results versus the other methods.
The accuracy values of the methods over MESSIDOR dataset.
The accuracy values of the methods over the DIARETDB1 dataset.
Diabetic macular edema detection is a difficult task because the details in retina images are really tiny. The application of deep learning networks to solve these tasks is an inevitable trend. The process of diagnosing retinopathy remotely via the cloud can help ophthalmologists remotely diagnose eye diseases, especially predicting diabetic macular edema in retina fundus images. At first, the patient used an ophthalmic fundus camera to take a retina fundus image. To conduct diagnosis, the fundus image is stored in the cloud database server. The ophthalmologist function menu performs diagnostic functions remotely via the cloud. The layers in the medical internet of things cloud in healthcare contain the tools for data analysis and diabetic macular edema detection. In this paper, predicting diabetic macular edema in retina fundus images based on optimized deep residual network techniques on the medical internet of things model was proposed. At the perception layer, the DMER method is a contribution for diabetic macular edema detection in retina fundus images in the trend. The process of training over very deep neural networks is complicated because of the vanishing/exploding gradient problem. When we stack more layers in a convolution neural network then, in theory, the training error should decrease. However, in practice, adding more layers in the CNN (making the CNN deeper), the training error would increase instead. In the ResNet network, stacking layers will not degrade network performance. ResNet combined with FPN is used to extract features of an image and obtain a feature map giving good results for diabetic macular edema detection. The results of the proposed method DMER are better than those of the other methods as presented above. In the future work, the application of other deep learning models will be extended to increase the accuracy of this task.
Conflicts of interest
The authors declare that they have no conflicts of interest.
Footnotes
Acknowledgments
We acknowledge the support of time and facilities from Ho Chi Minh City University of Technology (HCMUT), VNU-HCM and Ho Chi Minh City University of Foreign Languages and Information Technology (HUFLIT) for this study.