
Abstract
The prediction of power demand for unmanned aerial vehicles (UAV) is an essential basis to ensure the rational distribution of the energy system and stable economic flight. In order to accurately predict the demand power of oil-electric hybrid UAV, a method based on variational mode decomposition (VMD) and Sparrow Search Algorithm (SSA) is proposed to optimize the hybrid prediction model composed of long-short term memory (LSTM) and Least Squares Support Vector Machine (LSSVM). Firstly, perform VMD decomposition on the raw demand power data and use the sample entropy method to classify the feature-distinct mode components into high-frequency and low-frequency categories. Then, each modality component was separately input into the mixed model for rolling prediction. The LSSVM model and LSTM model were used to process low-frequency and high-frequency components, respectively. Finally, the predicted values for each modal component are linearly combined to obtain the final predicted value for power demand. Compared with the current models, the prediction model constructed in this paper stands out for its superior ability to track the changing trends of power demand and achieve the highest level of prediction accuracy.
Keywords
Introduction
Along with the rapid development of science and technology, the application of drones in fields such as agriculture, disaster management, and emergency rescue are becoming increasingly widespread [1, 3]. Especially in the civilian sector, driven by diverse needs from individuals, businesses, and governments, the development of drones has made it one of the most promising fields [4]. Gupta proposed using UAVs to deploy wireless networks to build smart dense urban areas [5]. Khan conducted research on various current applications of UAVs in natural disaster management [6]. However, most UAVs are battery-powered. Due to the low energy density of storage batteries, it is difficult to ensure long-duration flights for drones. The oil-electric hybrid power system combines the internal combustion engine and the energy storage battery, which ensures the UAVs’ endurance and solves the engine’s lag and low efficiency [7, 8]. Ausserer and Molesworth have successfully simulated the flight of their gas-electric hybrid drone [9]. So far, the “ALTI Transition” drone developed in collaboration between ALTI UAS and UST can fly for up to 12 hours in an unloaded condition [10].
Energy management strategy is crucial to ensure the scientific scheduling between hybrid propulsion systems and realize the stable and economical flight of UAVs. At present, energy management techniques can be divided into rule-based and optimization-based [11]. The rule-based strategy includes state machine strategy and fuzzy logic control strategy. Boukoberine combined the genetic algorithm to optimize the rule-based strategy and reduced fuel consumption by 5.1% [12]. Zhang used fuzzy control of the output power of the fuel cell in the hybrid power system to reduce hydrogen consumption effectively [13]. Due to the limitation of engineering experience, the rule-based strategy is difficult to achieve the global optimal power allocation. Optimization-based strategies mainly cover dynamic programming (DP), Pontryagin minimum-principle (PMP), equivalent consumption minimum strategy (ECMS), and model predictive control (MPC). Quan adopted an optimized strategy based on direction prediction optimal search algorithm (OFA/DP) to improve energy utilization and endurance [14]. Ref. [15] improves battery life and reduces energy consumption through current limitation based on PMP. Schmid proposed to combine DP with PMP and verified the advantages of this algorithm [16]. However, the above strategies only apply to offline optimization, which have disadvantages such as poor real-time performance and a huge amount of calculation. The learning-based strategy introduces machine learning into the traditional strategy and combines historical data to learn and predict the control quantity, enhancing the real-time and robustness of the controlled system. Yang proposed an energy management strategy for hybrid systems based on reinforcement learning and used Markov chains to predict velocity [17]. Yao uses a grey Markov prediction model to track the output power of UAV fuel cells, proving that this prediction model has a good prediction effect [18]. The demand power prediction model based on reinforcement learning has defects such as low data utilization rate and lack of prediction efficiency. Li constructed a hybrid model of BP and SVM to predict vehicle speed characteristics [19]. Zhang proposed a short-term velocity prediction method based on LSTM [20]. Sun proposed an energy management strategy based on LSTM and improved MPC, proving that the algorithm has good robustness [21]. Nevertheless, ignoring the internal variation characteristics of the original data and the lack of generalization performance of the prediction model are the main problems that make it difficult to achieve the optimal distribution of energy systems. It is vital to construct a reliable demand power prediction model for optimal energy allocation and economical flight of UAVs.
In learning-based energy management strategies, the accuracy of predictive models is highly critical. A single LSTM requires a lot of time for model training to get a good prediction effect. To further improve the prediction speed and performance of the model, a hybrid model can be used for prediction. Ref. [22] proposes a hybrid model of LSSVM-RBFNN based on independent weights. Ref. [23] proposed a hybrid prediction model based on LSTM-LSSVM. LSSVM has a short training time and a better prediction effect for low-frequency and regular data. Therefore, the LSTM-LSSVM model can be used for joint forecasting. But manually selecting hyperparameters of the model can easily result in falling into a local optimum. The global search for hyperparameters of the model can be combined with artificial intelligence algorithms to improve accuracy [24, 25]. In order to obtain better prediction accuracy, the SSA algorithm can be used to search the hyperparameters of the hybrid prediction model [26].
During flight, the demand power of UAVs is nonlinear and random due to climatic conditions, flight state changes, and other factors. Signal decomposition methods are used to decompose the original data set, which can mine the internal information, reduce the difficulty of prediction, and improve the accuracy of prediction. The methods mainly include empirical mode decomposition (EMD) and variational mode decomposition (VMD) [27, 28]. Ref. [29] used the EMD algorithm to divide the sequence of environmental factors and then obtain input feature variables with significant features. Ref. [30] proposed an improved empirical mode decomposition (IEMD) method to eliminate the pseudo-components that are less similar to the original signal. However, the EMD decomposition method can easily cause mode aliasing, which leads to the absence of the original signal. Ref. [31] proposed a VMD load sequence decomposition method based on PE algorithm optimization, which decomposed complex original data into simple modal sequences, greatly reducing prediction difficulty. Therefore, the VMD decomposition method has a better decomposition effect than EMD decomposition, which can be used to decompose the demand power of UAVs.
In order to solve the complexity of UAVs demand power fluctuations and the limitations of a single forecasting model, this paper proposes a hybrid prediction model based on VMD decomposition and SSA-Optimized LSTM-LSSVM. The first step is to decompose the original data using VMD, then calculate the sample entropy values of each mode component and classify them into high-frequency and low-frequency categories. The next step is to create a combined LSTM-LSSVM predictive model using the SSA algorithm to search for the best learning parameters. This model will make separate predictions for both high and low frequencies. Finally, the predicted values of each mode component are linearly superimposed to obtain the predicted values of the final power demand. The main contributions of this paper are as follows: The VMD is used to decompose the raw data with random fluctuations deeply, and the sample entropy is combined to classify modal variables into high and low frequencies, effectively reducing the complexity of the prediction process. A hybrid prediction model consisting of LSTM and LSSVM models has been constructed to solve the problem of poor performance in single prediction models, improving the prediction efficiency of the model. The SSA algorithm is used to intelligently search for the optimal learning parameters of the prediction model, which can further improve the prediction accuracy of the model. Experimental results have shown that the proposed prediction method based on VMD and SSA-optimized hybrid model has the best prediction effect and robustness.
The following is the rest of this article. Section 2 introduces the fluctuating characteristics of demand power for UAV, and methods of signal decomposition and frequency division. Section 3 describes the mechanism of the hybrid model optimization based on SSA. Section 4 verifies the effectiveness of the model proposed in this article through actual operational data. Finally, conclusions are drawn in Section 5.
Power decomposition and frequency division
Demand power and mechanism analysis
The demand power of a hybrid-powered UAV is the power required to sustain the continuous and stable flight of the UAV. The power mainly comes from electric regulation, propeller, and motor conversion. During the flight of the UAV in the air, its two-dimensional plane is shown in Fig. 1. Assuming that the drone is in a stable state of flight, the physical relationship between the required power and the relevant kinematic characteristics of the UAV can be obtained through the general planar motion equation. The specific motion equation is as follows:
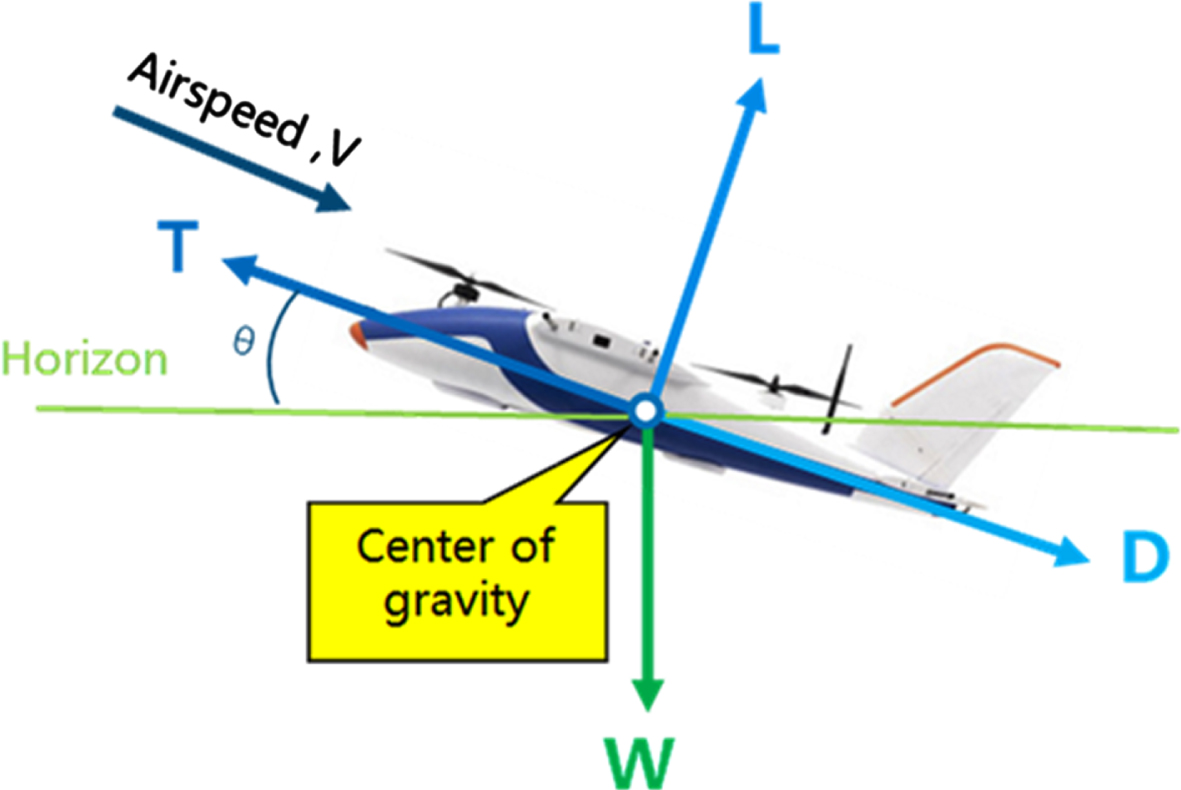
Flight force analysis diagram.
The demand power of the UAV is not only related to the traveling speed and flight state, but the weather conditions are the main influencing factors. When the UAV is cruising, the physical relationship between the demand power and the wind speed is shown as Equation (2). The demand power of UAVs has a complex nonlinear relationship with wind speed. The experiment shows that the energy consumption of UAV will change with the wind speed and direction. When the UAV flies upwind, its energy consumption will increase as the wind speed increases [32].
The routine flight missions of large UAVs consist of takeoff, low and high-speed cruise, landing [33]. For UAVs used for logistics transportation, fixed point rescue [34, 35], their power requirements under fixed flight tasks have similar internal characteristics. Fully understanding and mastering these internal characteristics will greatly affect the safety, stability and economy of UAV navigation. However, due to the change of flight state, the randomness of climate conditions, the weight change of UAV and other factors, the demand power of UAV presents the characteristics of non-stationarity and time-varying. Ignoring the internal variation law of the demand power and directly inputting the raw data into the prediction model without processing will inevitably lead to the decline of the prediction accuracy of the model.
Variational mode decomposition (VMD) is a non-recursive signal processing technology developed in recent years as an adaptive approach, which overcomes the endpoint effects and mode mixing issues of the traditional EMD decomposition method. It achieves this by constructing a constrained variational model that adaptively searches for complex signals’ optimal center frequency and bandwidth. VMD can decompose the demand power sequence of UAVs with frequent fluctuation and nonlinear into a set of modal components with a certain regularity in different frequency bands, which greatly reduces the complexity of the input time series. The process is as follows: Construct the constraint model of variational mode decomposition: Add penalty factor and Lagrange multiplier transforms Equation (4) into an unconstrained variational mode equation:
Using the alternating multiplier algorithm, the optimal IMF variational mode components {IMF
i
, i = 1, 2, …, k} and their corresponding central frequencies can be obtained by solving the saddle point problem in Equation (4). The number of components generated after signal decomposition is denoted by k.
Sample Entropy (SE) is a measure of the complexity of timing signals improved by approximate entropy, which not only reduces the error of approximate entropy but also has better consistency [36]. When the value of sample entropy is larger, it represents the complexity of time series. Suppose there is a set of time sequence data X ={ x1, x2, …, x
N
}, and its specific implementation process is as follows: Convert time series to a sequence of m-dimensional subsamples:
Calculate the distance between each sequence and all sequences, and find the maximum absolute value of the element-wise interpolation between the two time series:
Given threshold α, for each row sequence in matrix D, calculate the ratio
Increase dimension m by 1 and repeat (i) to (iii) to obtain the mean value Φm+1 of m+1 dimension. Sample entropy can be expressed as:
After classifying the modal components into high and low-frequency ranges using sample entropy, inputting the low-frequency components and high-frequency components into different prediction models for training can ensure prediction accuracy and greatly improve prediction speed.
Long-short term memory
Long-Short Term Memory (LSTM) neural networks continue the ability of RNN to process sequential data and selectively memorize information from the previous level network by adding forget gates, input gates, and output gates to the memory unit. LSTM effectively solves the vanishing and exploding gradient problems in RNN [37, 38]. Figure 2 shows the basic unit structure of LSTM. Where x t is the input at the current time. f t , i t , and o t are the forget gate, input gate, and output gate in the gate units. c t is the memory cell.
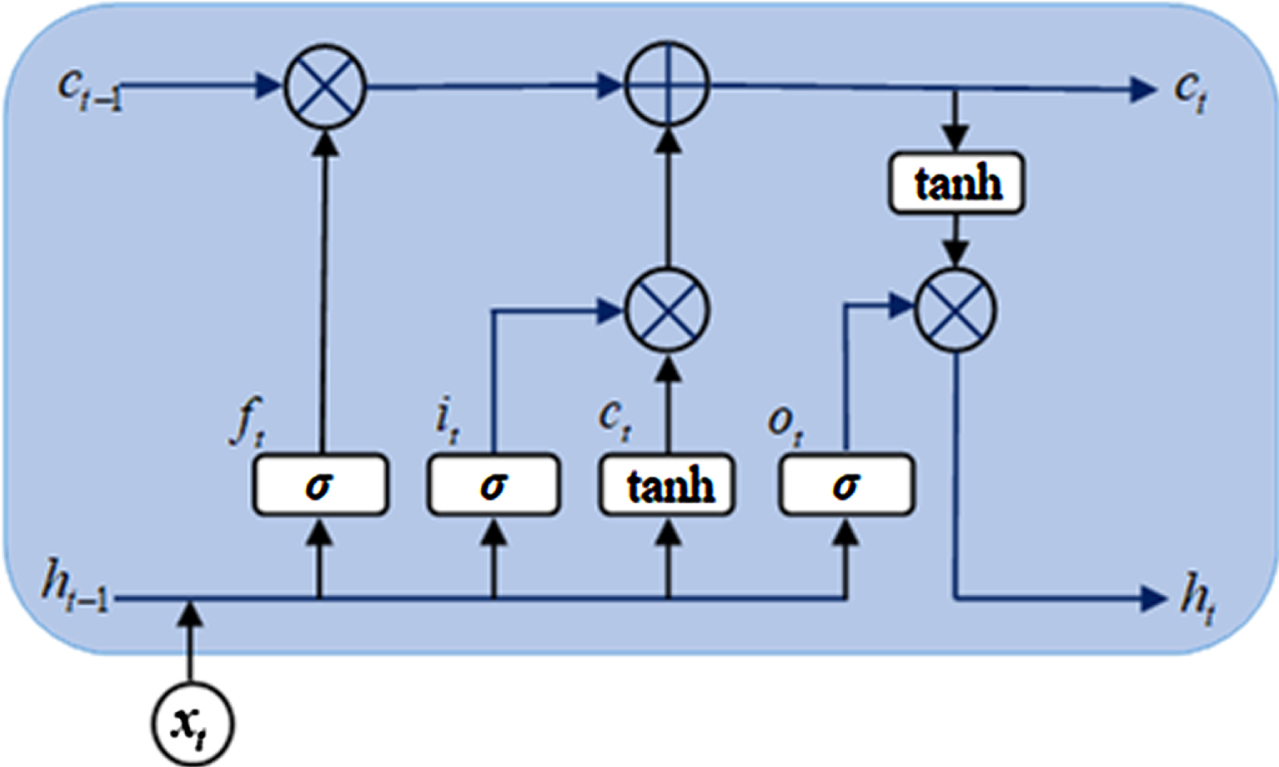
LSTM cell structure diagram.
Least square support vector machine (LSSVM) is an improved Support Vector Machine (SVM), which replaces quadratic programming solution with linear equation to solve optimization problems [39]. LSSVM exhibits excellent training speed and demonstrates good performance in processing low-frequency signals. Suppose there is a set of training data S ={ (x
i
, y
i
) , x
i
∈ R
n
, y
i
∈ R }, where x
i
is the n-dimensional input sample and y
i
is the corresponding output variable, i = 1, 2, … N. The process is as follows: Construct the objective function j and constraints for the LSSVM optimization problem: Introduce Lagrange function to transform Equation (10) into:
Take partial derivatives of the weight ω, bias b, sample error e
i
, and Lagrange multiplier λ
i
in Equation (11) using the KKT conditions, and solve for λ
i
and b using the least squares method, then obtain the LSSVM regression function:
Sparrow Search Algorithm (SSA) is a new intelligent optimization algorithm inspired by the foraging and antipredator behavior of sparrows. Compared to traditional algorithms, SSA has advantages such as strong search ability, rapid convergence, and less susceptibility to getting stuck in local optima. The algorithm has been widely used in UAV trajectory planning and other fields. The detailed steps are as follows:
Firstly, determine the initial position X of the sparrows and fitness function F X .
The individual with the highest fitness value is selected as the leader of the population, and their position is updated using Equation (16):
When R2 < ST, it means that the population has not encountered natural enemies, and the leader can continue to search. When R2 > ST, it means that some individuals of the population have found predators and issued an alarm, and the population needs to move to other safe places for foraging. The position of followers in the population is updated as follows:
Before conducting prediction, hyperparameters must be set in the prediction model, such as the number of neurons and learning rate in LSTM models and the kernel function parameter and penalty coefficient in LSSVM models. Manually selecting different hyperparameters to improve model performance will easily lead to local optimal solutions. The SSA algorithm can be used to optimize learning parameters in the prediction model to improve the model’s predictive performance. The specific steps are as follows:
The error evaluation index is an important tool for testing the performance of prediction models. In this paper, root mean square error (RMSE), mean absolute error (MAE), and symmetric mean absolute percentage error (SMAPE) are used to verify and evaluate the performance of the demand power prediction model, as shown in Equations (19) to (21):
From the above analysis, this paper, this paper proposes a hybrid UAV-based demand power prediction method based on VMD and SSA algorithm. Figure 3 is the overall flow chart of the model.
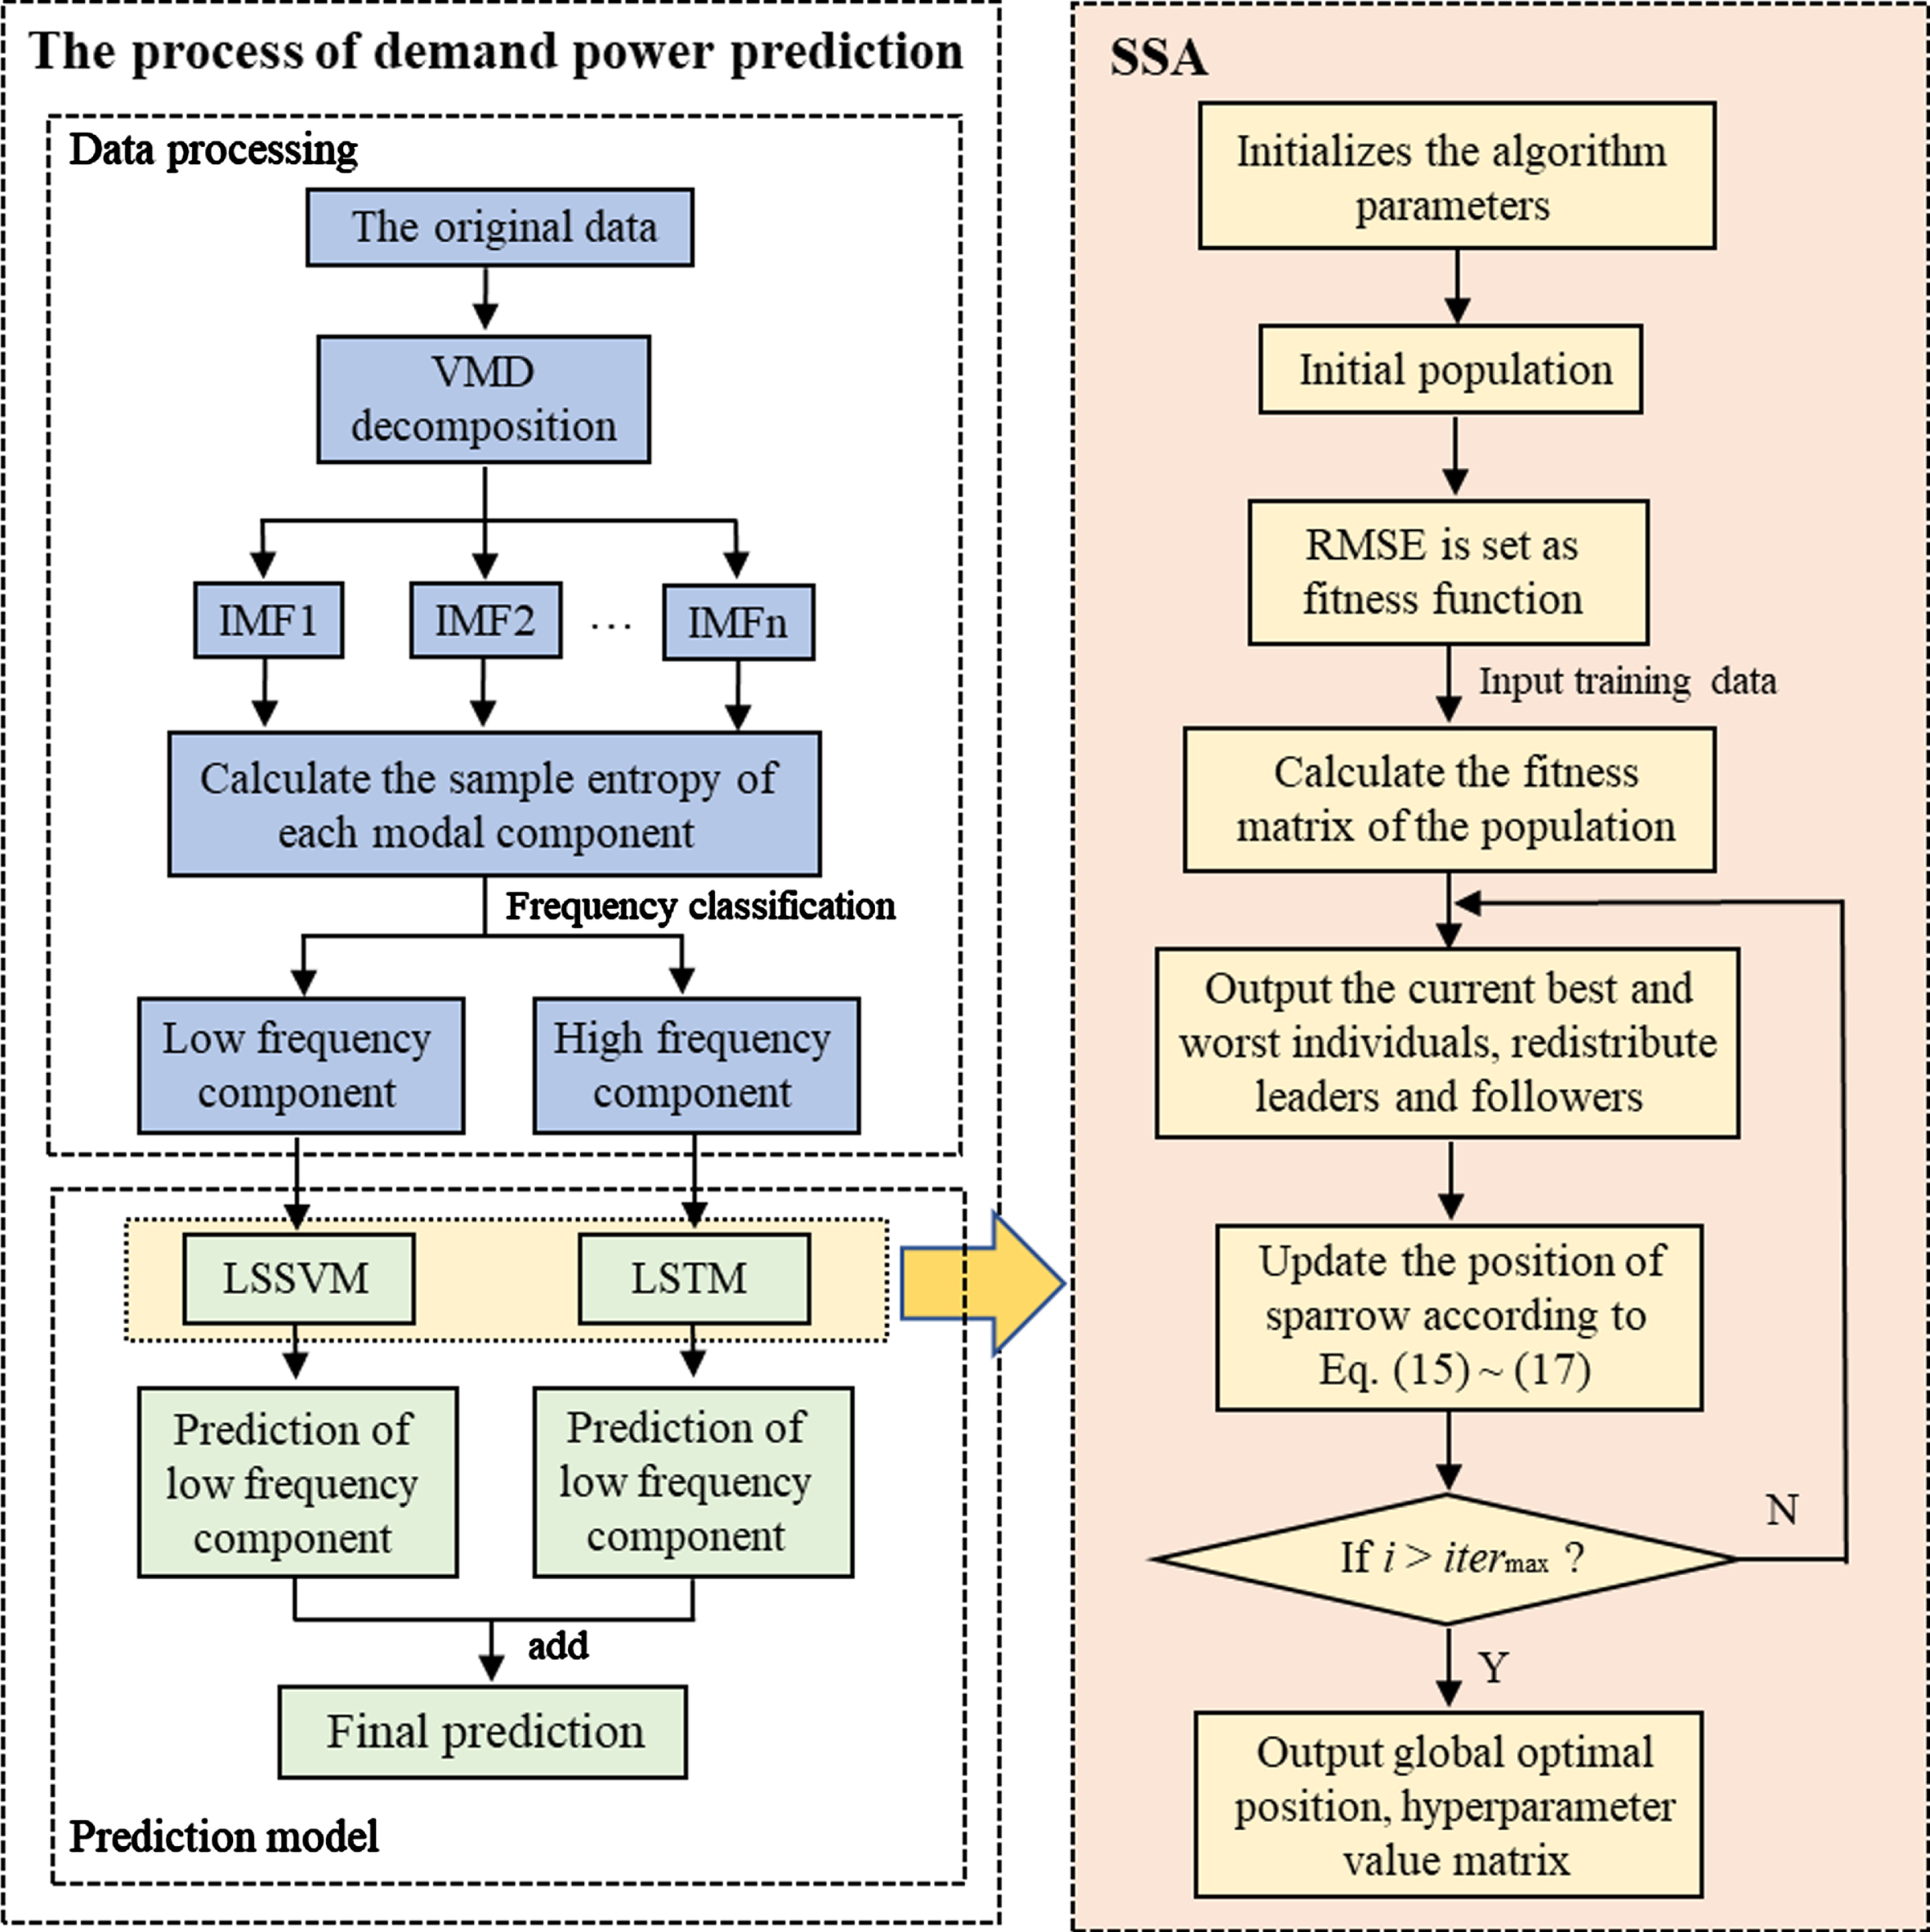
Flowchart of the proposed VMD-SSA-LSSVM-LSTM.
Experimental arrangement and data collection
The experiment built a hybrid prediction mathematical model in MATLAB. The data set came from flight experiments on a 100 kg petrol-electric hybrid drone. The specific flight parameters are shown in Table 1. With fixed take-off weights, landing points and flight missions, the demand power of the UAV was measured and recorded in real-time. In order to verify the reliability of the proposed algorithm under different weather conditions, ten fixed flight missions were arranged under light and moderate winds, respectively, according to the weather forecast.
However, data may be missing during the data collection and processing process. Therefore, the original operational data was processed using the mean interpolation method. Under light wind conditions, nine groups of a total of 5769 sampling points were randomly selected as the training set, and the remaining one group of 563 sampling points was used as the test set. Under moderate wind conditions, nine groups of a total of 6314 sampling points were randomly selected as the training set, and the remaining one group of 632 sampling points was used as the test set, as shown in Fig. 4.
Decomposition and classification of demand power
Firstly, the demand power raw data is decomposed using the VMD method. According to the observation of the center frequency of each modal component, the optimal decomposition layers and regularization coefficients are set as 7 and 2000, respectively. The decomposition results of the required power timing series data at different wind speed levels are shown in Fig. 5. As can be seen from the figure, the modal components IMF1-IMf5 in (a) and IMF1-IMF4 in (b) belong to periodic fluctuations, which represent the stable trend variation component of the demand power of UAV during flight. The remaining modal components reflect the rapid fluctuations and some random characteristics of the demand power in the high-frequency section, including the inherent changes such as changes in flight attitude and sudden gust disturbances. To reduce the complexity of prediction, sample entropy values of each modal component under light and moderate winds were calculated respectively and divided into high-frequency and low- frequency parts. Table 2 shows the calculation and classification results of each modal component.
Operating parameters of UAV
Operating parameters of UAV
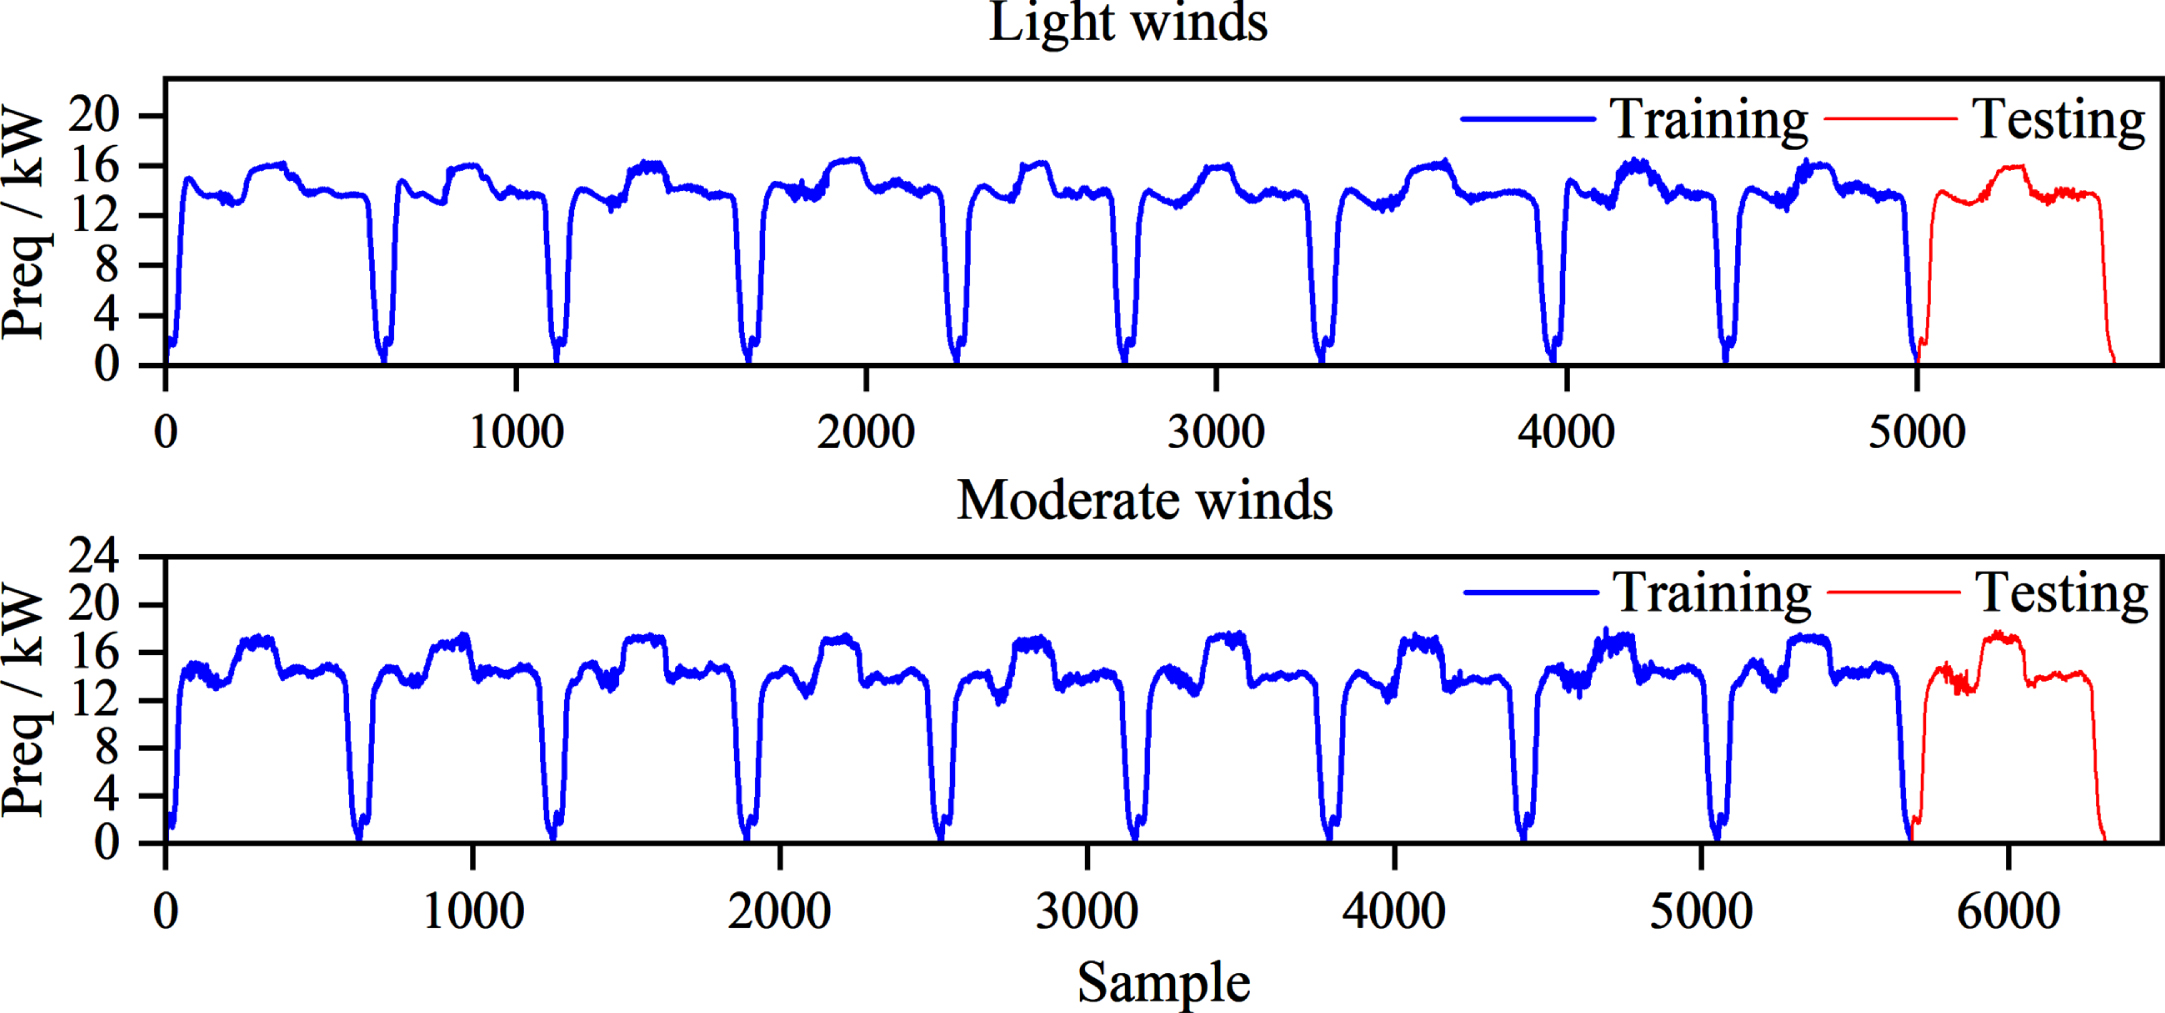
Training data and test data.
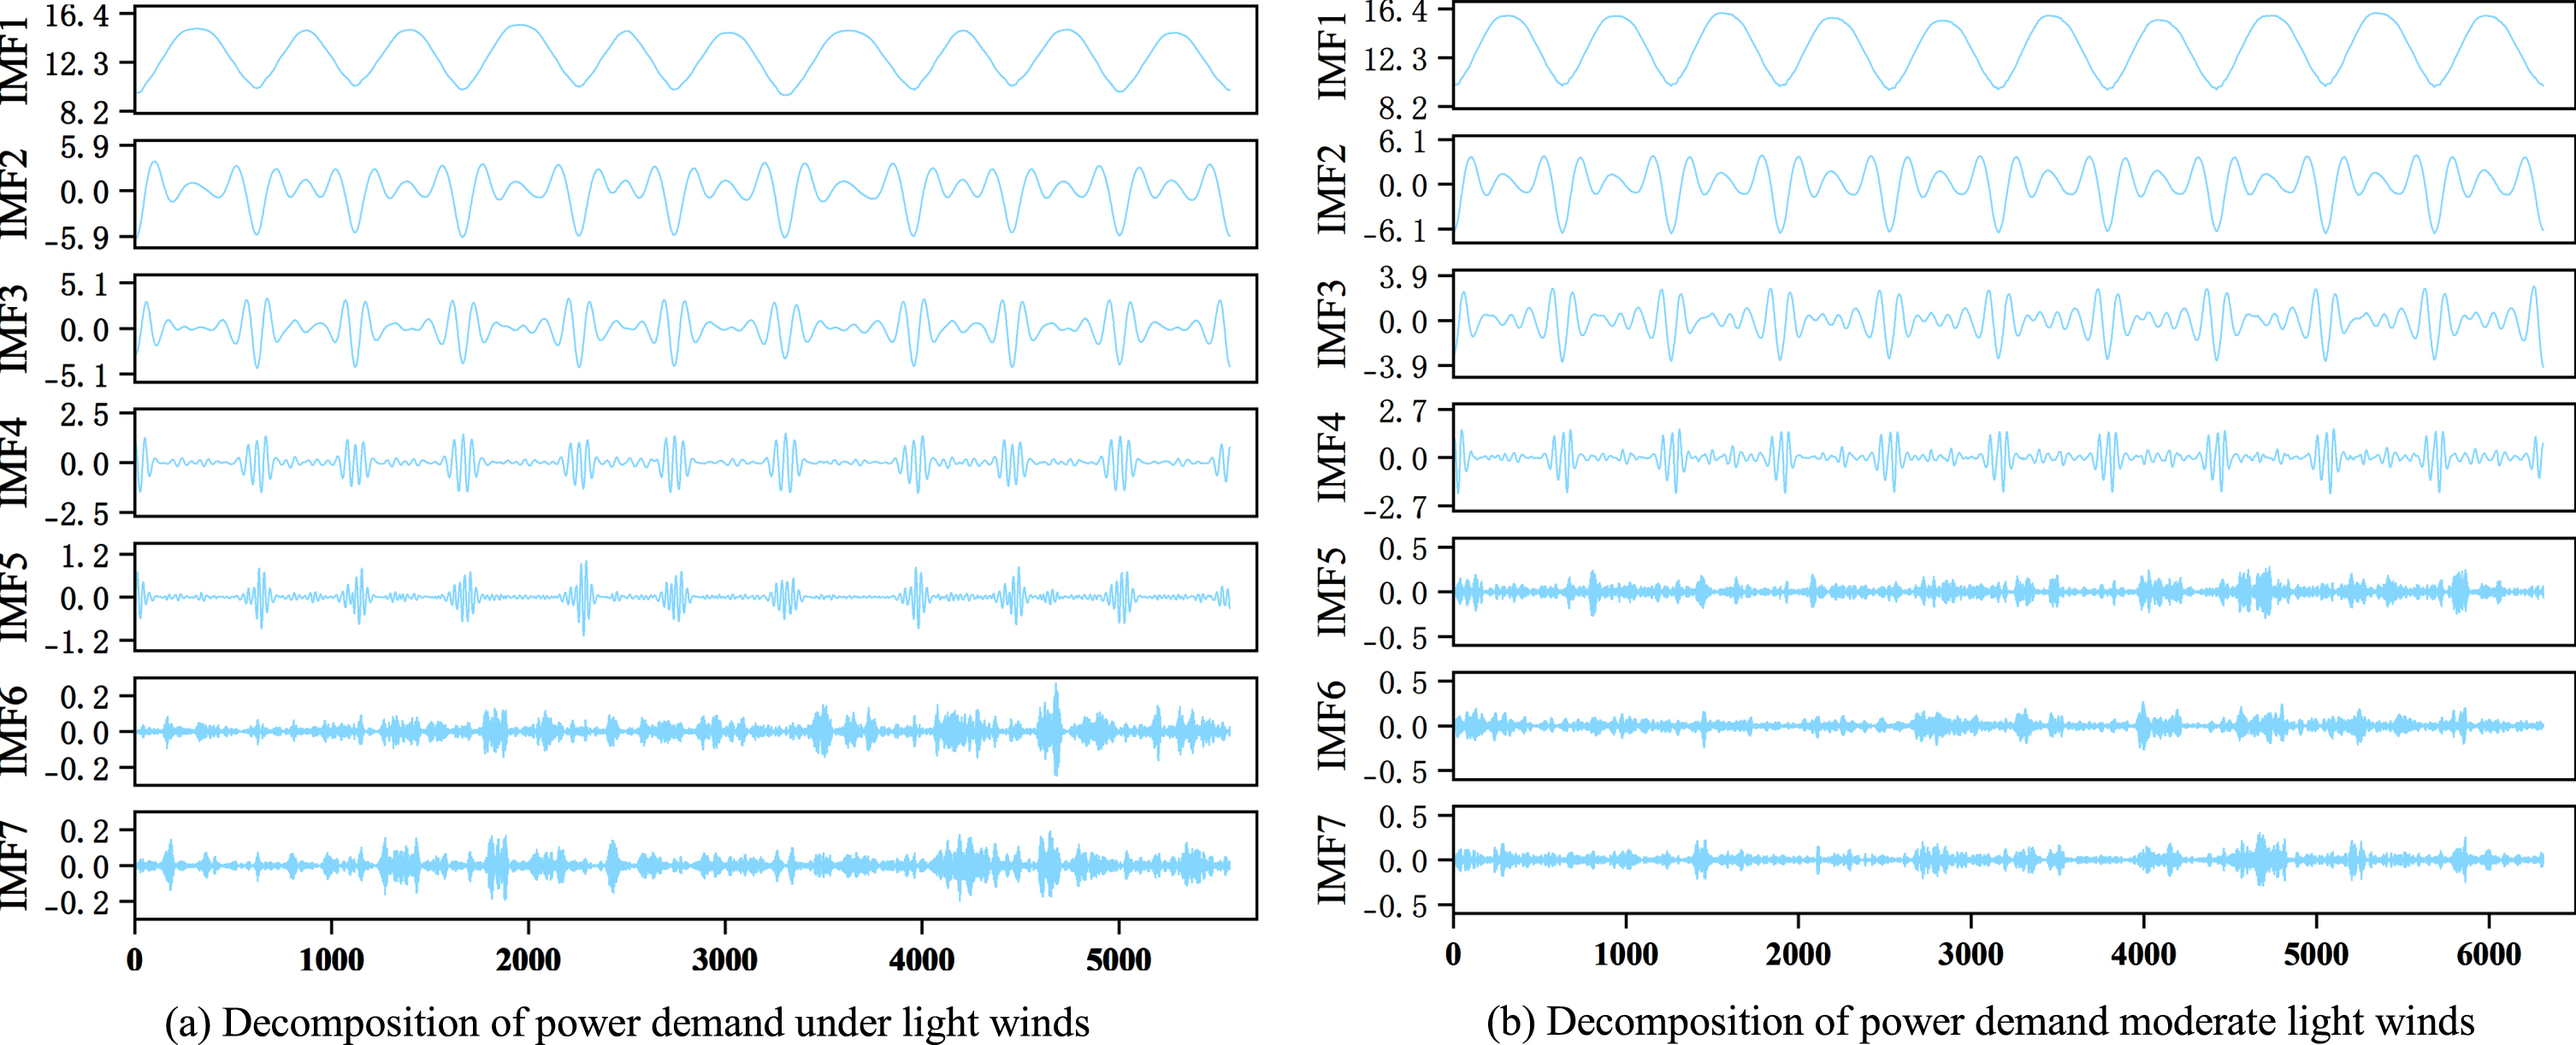
Decomposition of power demand under different weather conditions.
Sample entropy of IMFs under different weather condition
The signal decomposition method can improve the utilization of data set and the prediction efficiency of the model by analyzing the change trend of the original data. To verify the superiority of the VMD, the raw demand power data of UAVs obtained under light wind and moderate wind conditions were respectively subjected to non-decomposition, EMD decomposition, and VMD decomposition, and then input into LSTM and LSSVM prediction models for comparison. The prediction results are shown in Tables 3 and 4. As the table shows, the prediction accuracy of the original data is significantly improved after VMD decomposition, and the prediction error is minimal.
Comparison of predicted results in LSSVM
“No” express as non-decomposition.
Comparison of predicted results in LSTM
“No” express as non-decomposition.
To verify the validity of the proposed model, this paper compares the proposed model SSA-VMD-LSSVM-LSTM with the grey Markov model [18], the LSTM model [21], and the LSTM-LSSVM model [23]. Each model adopts rolling prediction mode, and the time window step length is 10. In the SSA algorithm, the population size was 500, the maximum number of iterations was 30, and the proportions of warning value, leader ratio and warning sparrow were 0.2, 0.2 and 0.2, respectively. Figure 6 shows the prediction curves of each algorithm under different weather conditions. Compared with the traditional benchmark model, the proposed model has the slightest deviation from the real value and the best effect in tracking the changing trend of demand power.
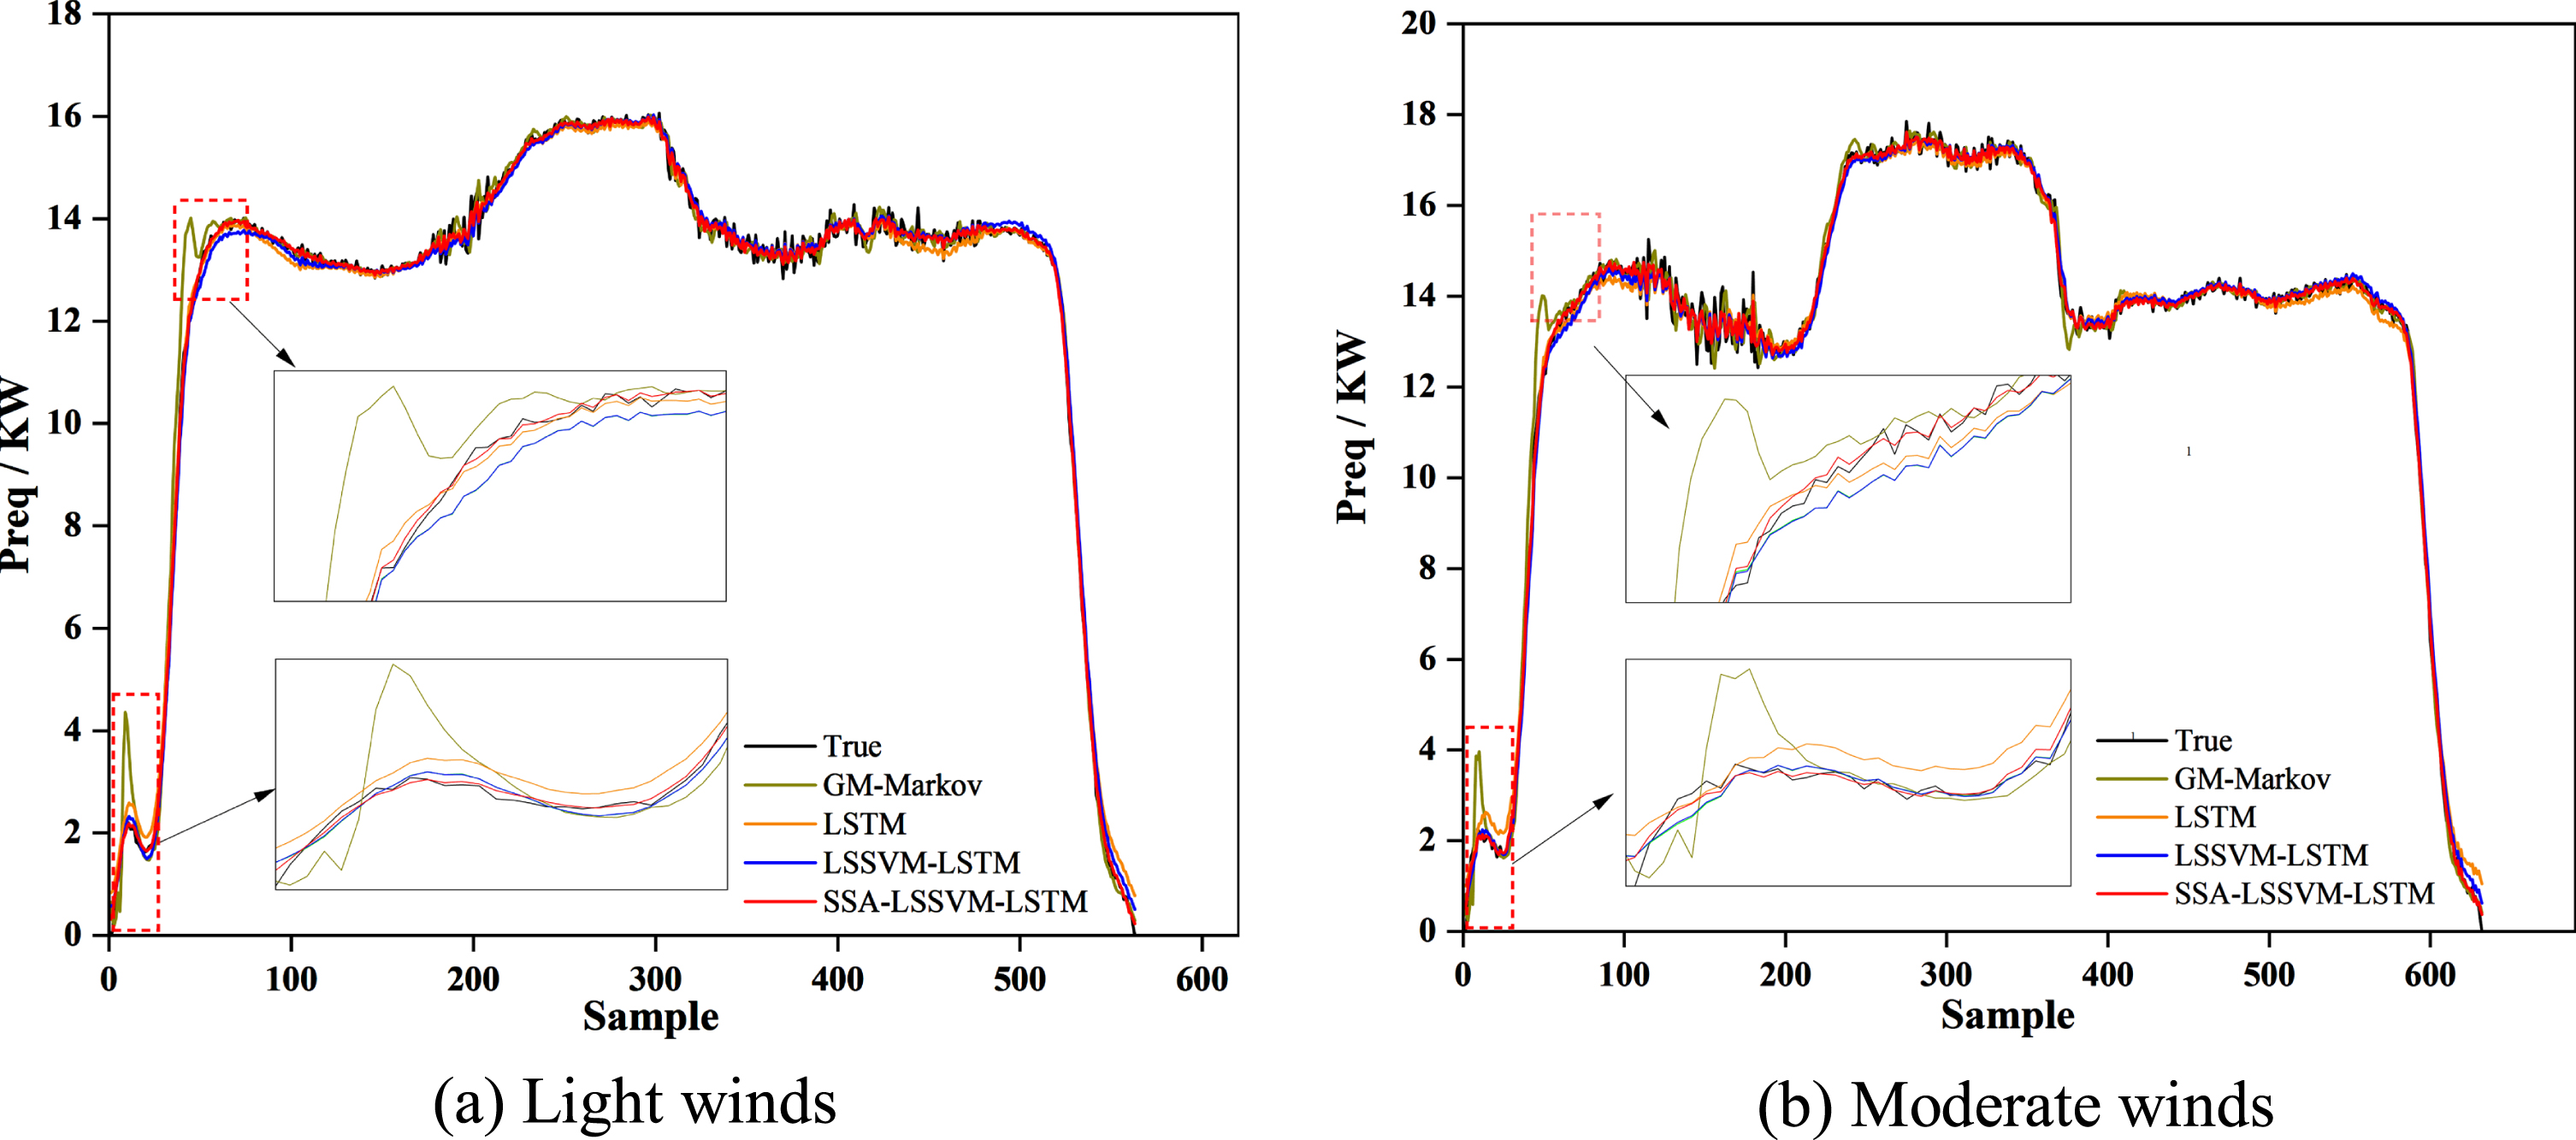
Forecast results of each model under light and moderate winds.
According to the error evaluation indexes of each model in Table 5 and Fig. 7, the VMD-SSA-LSTM-LSSVM hybrid prediction model has the smallest error and the best prediction effect. According to the prediction curve and error index of various models, the following analysis is carried out:
Comparison of predicted results in LSSVM
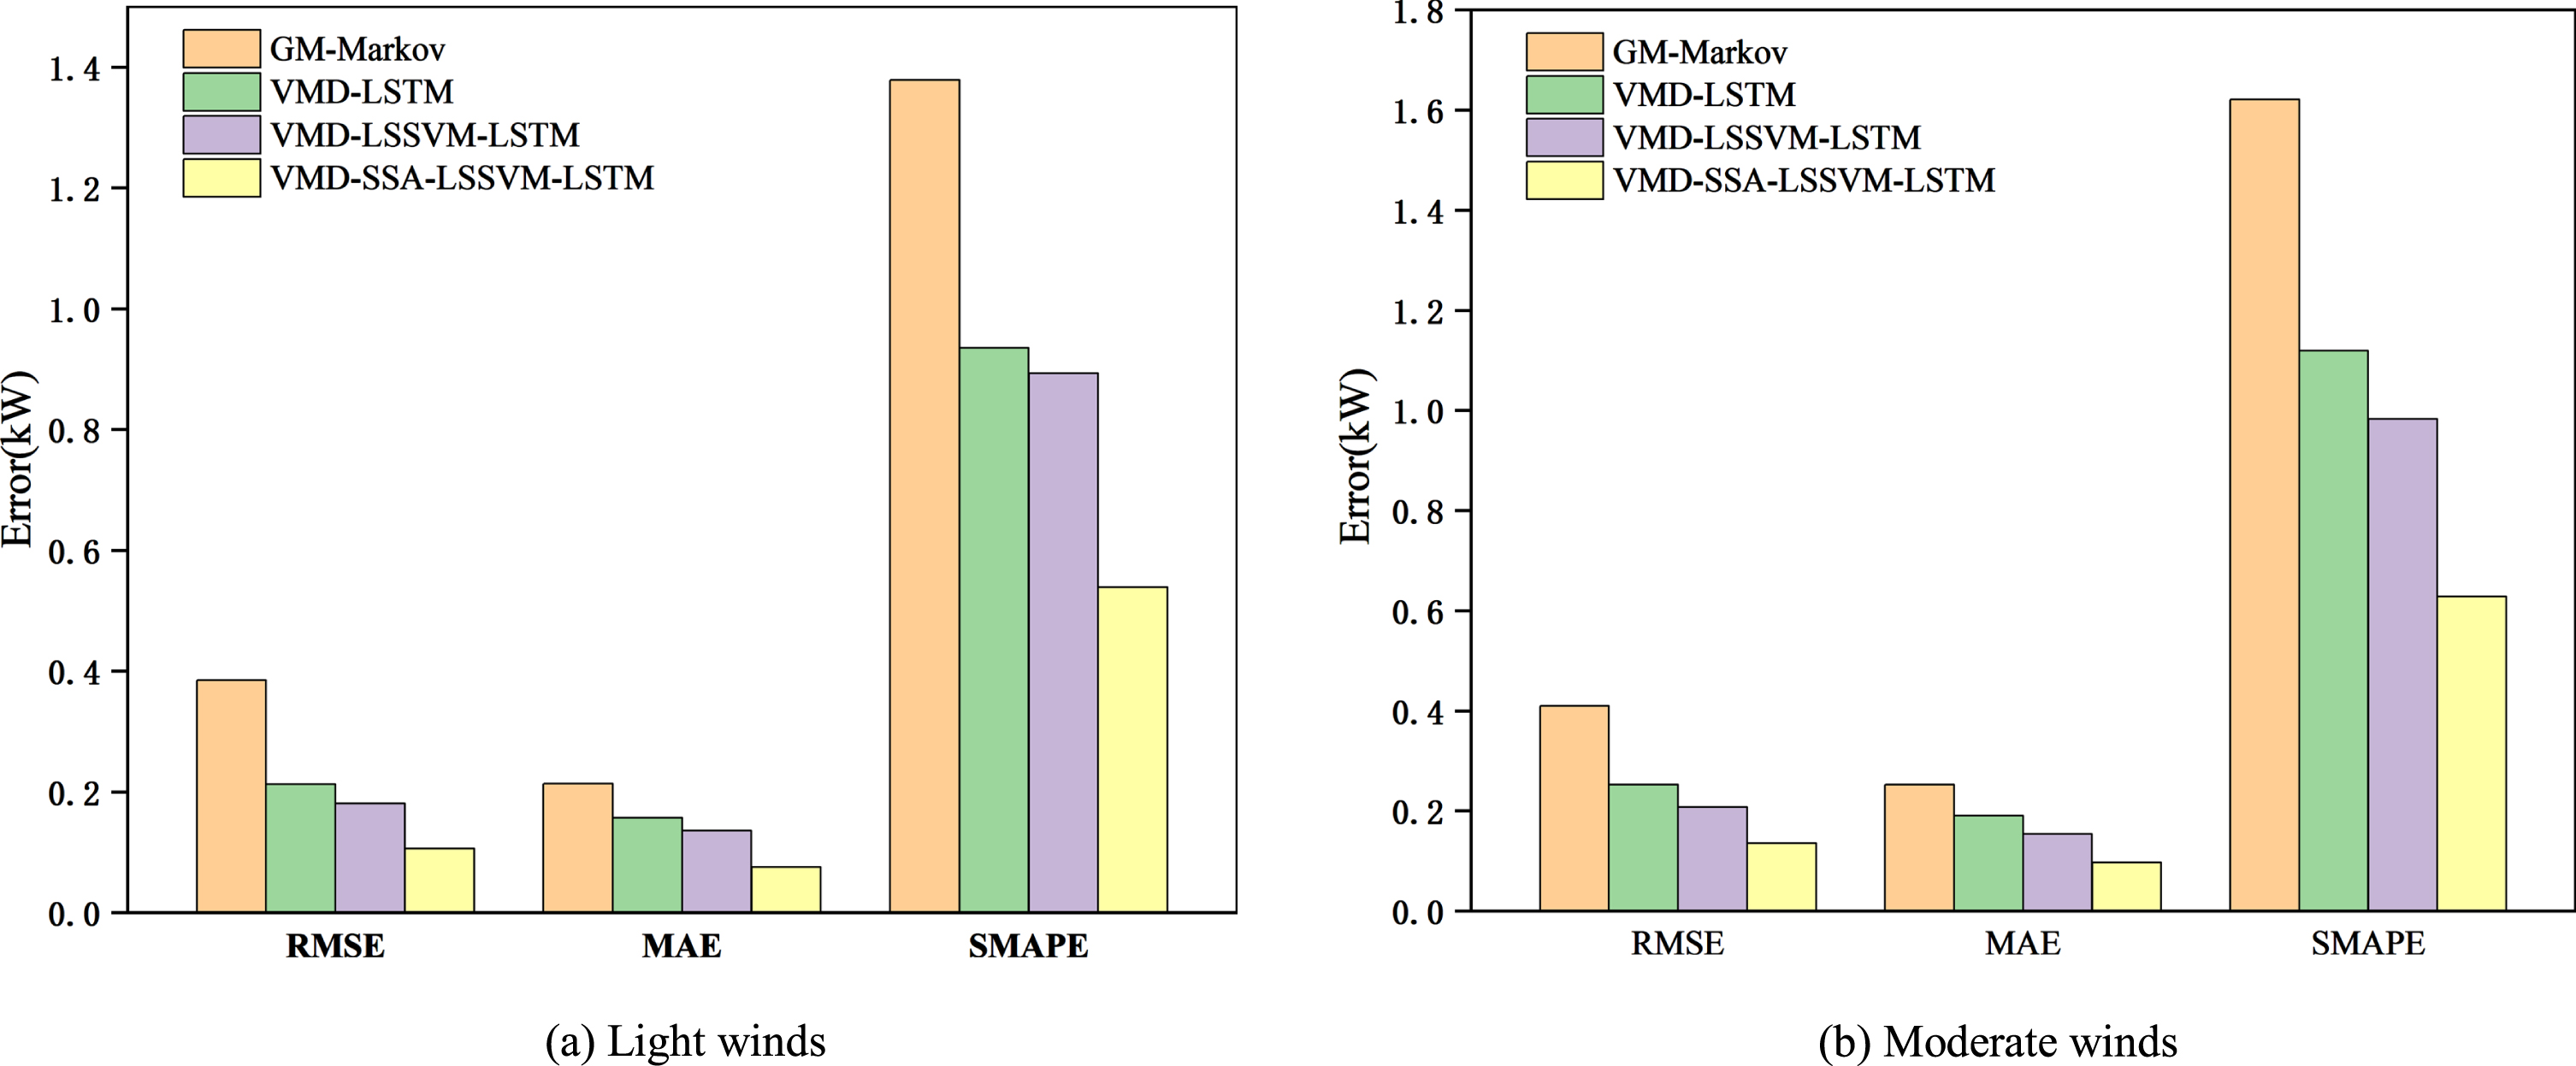
Error indexes of each model under light and moderate winds.
Under light and moderate wind, the model constructed in this paper has the smallest error indexes and the highest prediction accuracy, which has the best prediction effect and robustness.
The grey Markov chain model has a large deviation at a large power change quickly, and the ability of tracking the data change trend and forecasting performance is the weakest.
Compared with the grey Markov chain model, the LSTM model combined with multi-dimensional running features improves the prediction accuracy. In the LSTM model, the error evaluation indicators are reduced by 44.73%, 26.53%, and 32.15% under light wind and 38.39%, 24.71%, and 30.94% under moderate wind.
In the LSSVM-LSTM hybrid prediction model, after sample entropy processing of the original data, the low-frequency component corresponds to the LSSVM model and the high-frequency component corresponds to the LSTM model. The error indicators of the LSSVM-LSTM model are reduced by 15.23%, 13.39%, and 4.5164% under light winds by 17.85%, 19.45%, and 12.18% under moderate winds, compared to the previous level.
Using SSA to optimize the learning parameters of the composite prediction model, it solves the problem that the learning parameters of the artificially set model are easy to fall into the local optimal. The performance of the model is better than that of the manually adjusted model. Each error index decreased by 41.21%, 44.2% and 39.66% in light wind condition by 34.53%, 36.7% and 36.12% in moderate wind condition.
In order to more intuitively show the prediction effect of VMD-SSA-LSTM-LSSVM mixed model and other models, Figure 8 shows the prediction errors of different models. Figure 9 shows the linear regression analysis scatter diagram between the predicted value and the real value of each model. From Fig. 8, VMD-SSA-LSTM-LSSVM model has the smallest error fluctuation range in the whole forecasting process. In Fig. 9, VMD-SSA-LSTM-LSSVM model has the smallest error, the predicted value is closest to the actual value, and the fitting effect is the best. Therefore, the prediction model constructed in this paper has the best fitting effect to the demand power data and has the best prediction performance.
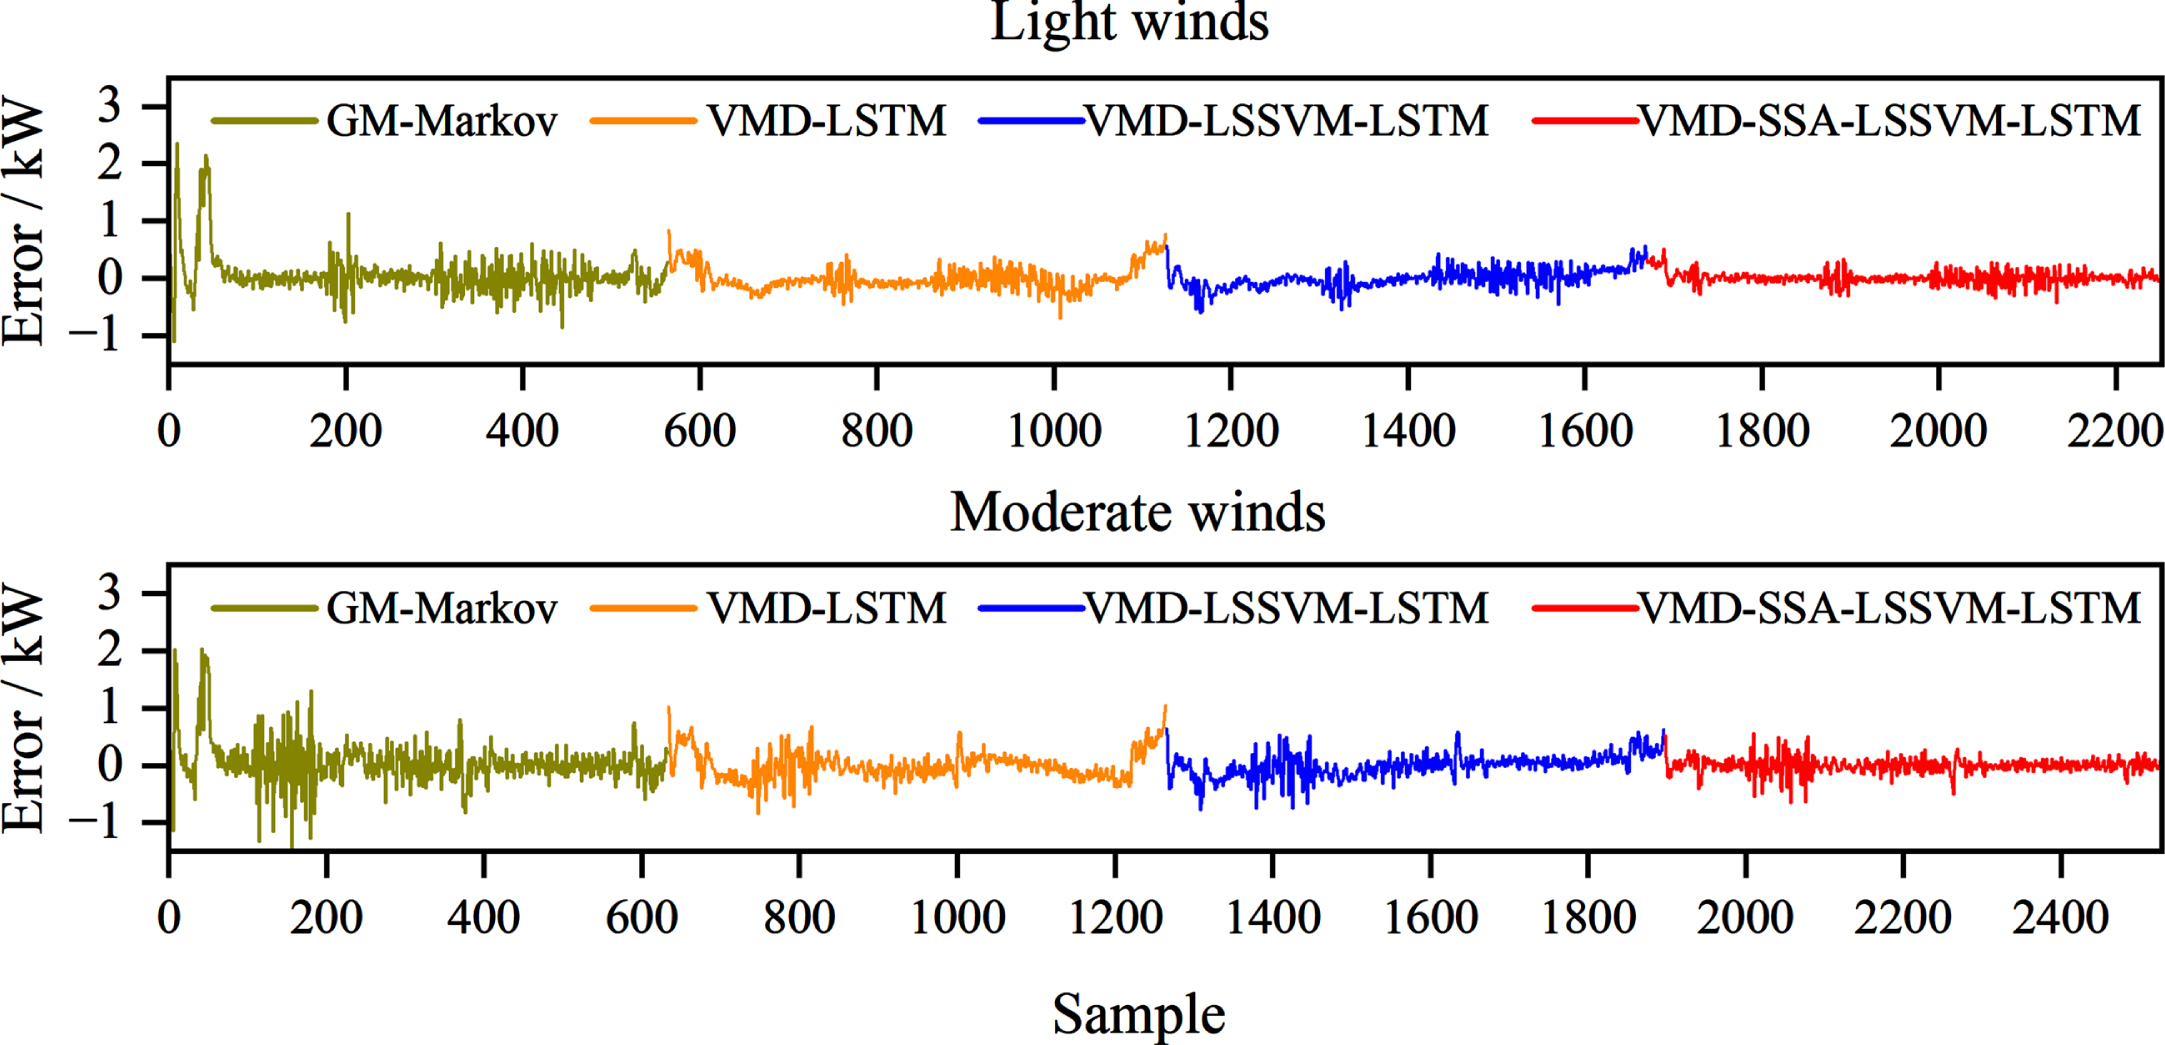
The prediction errors of different models.
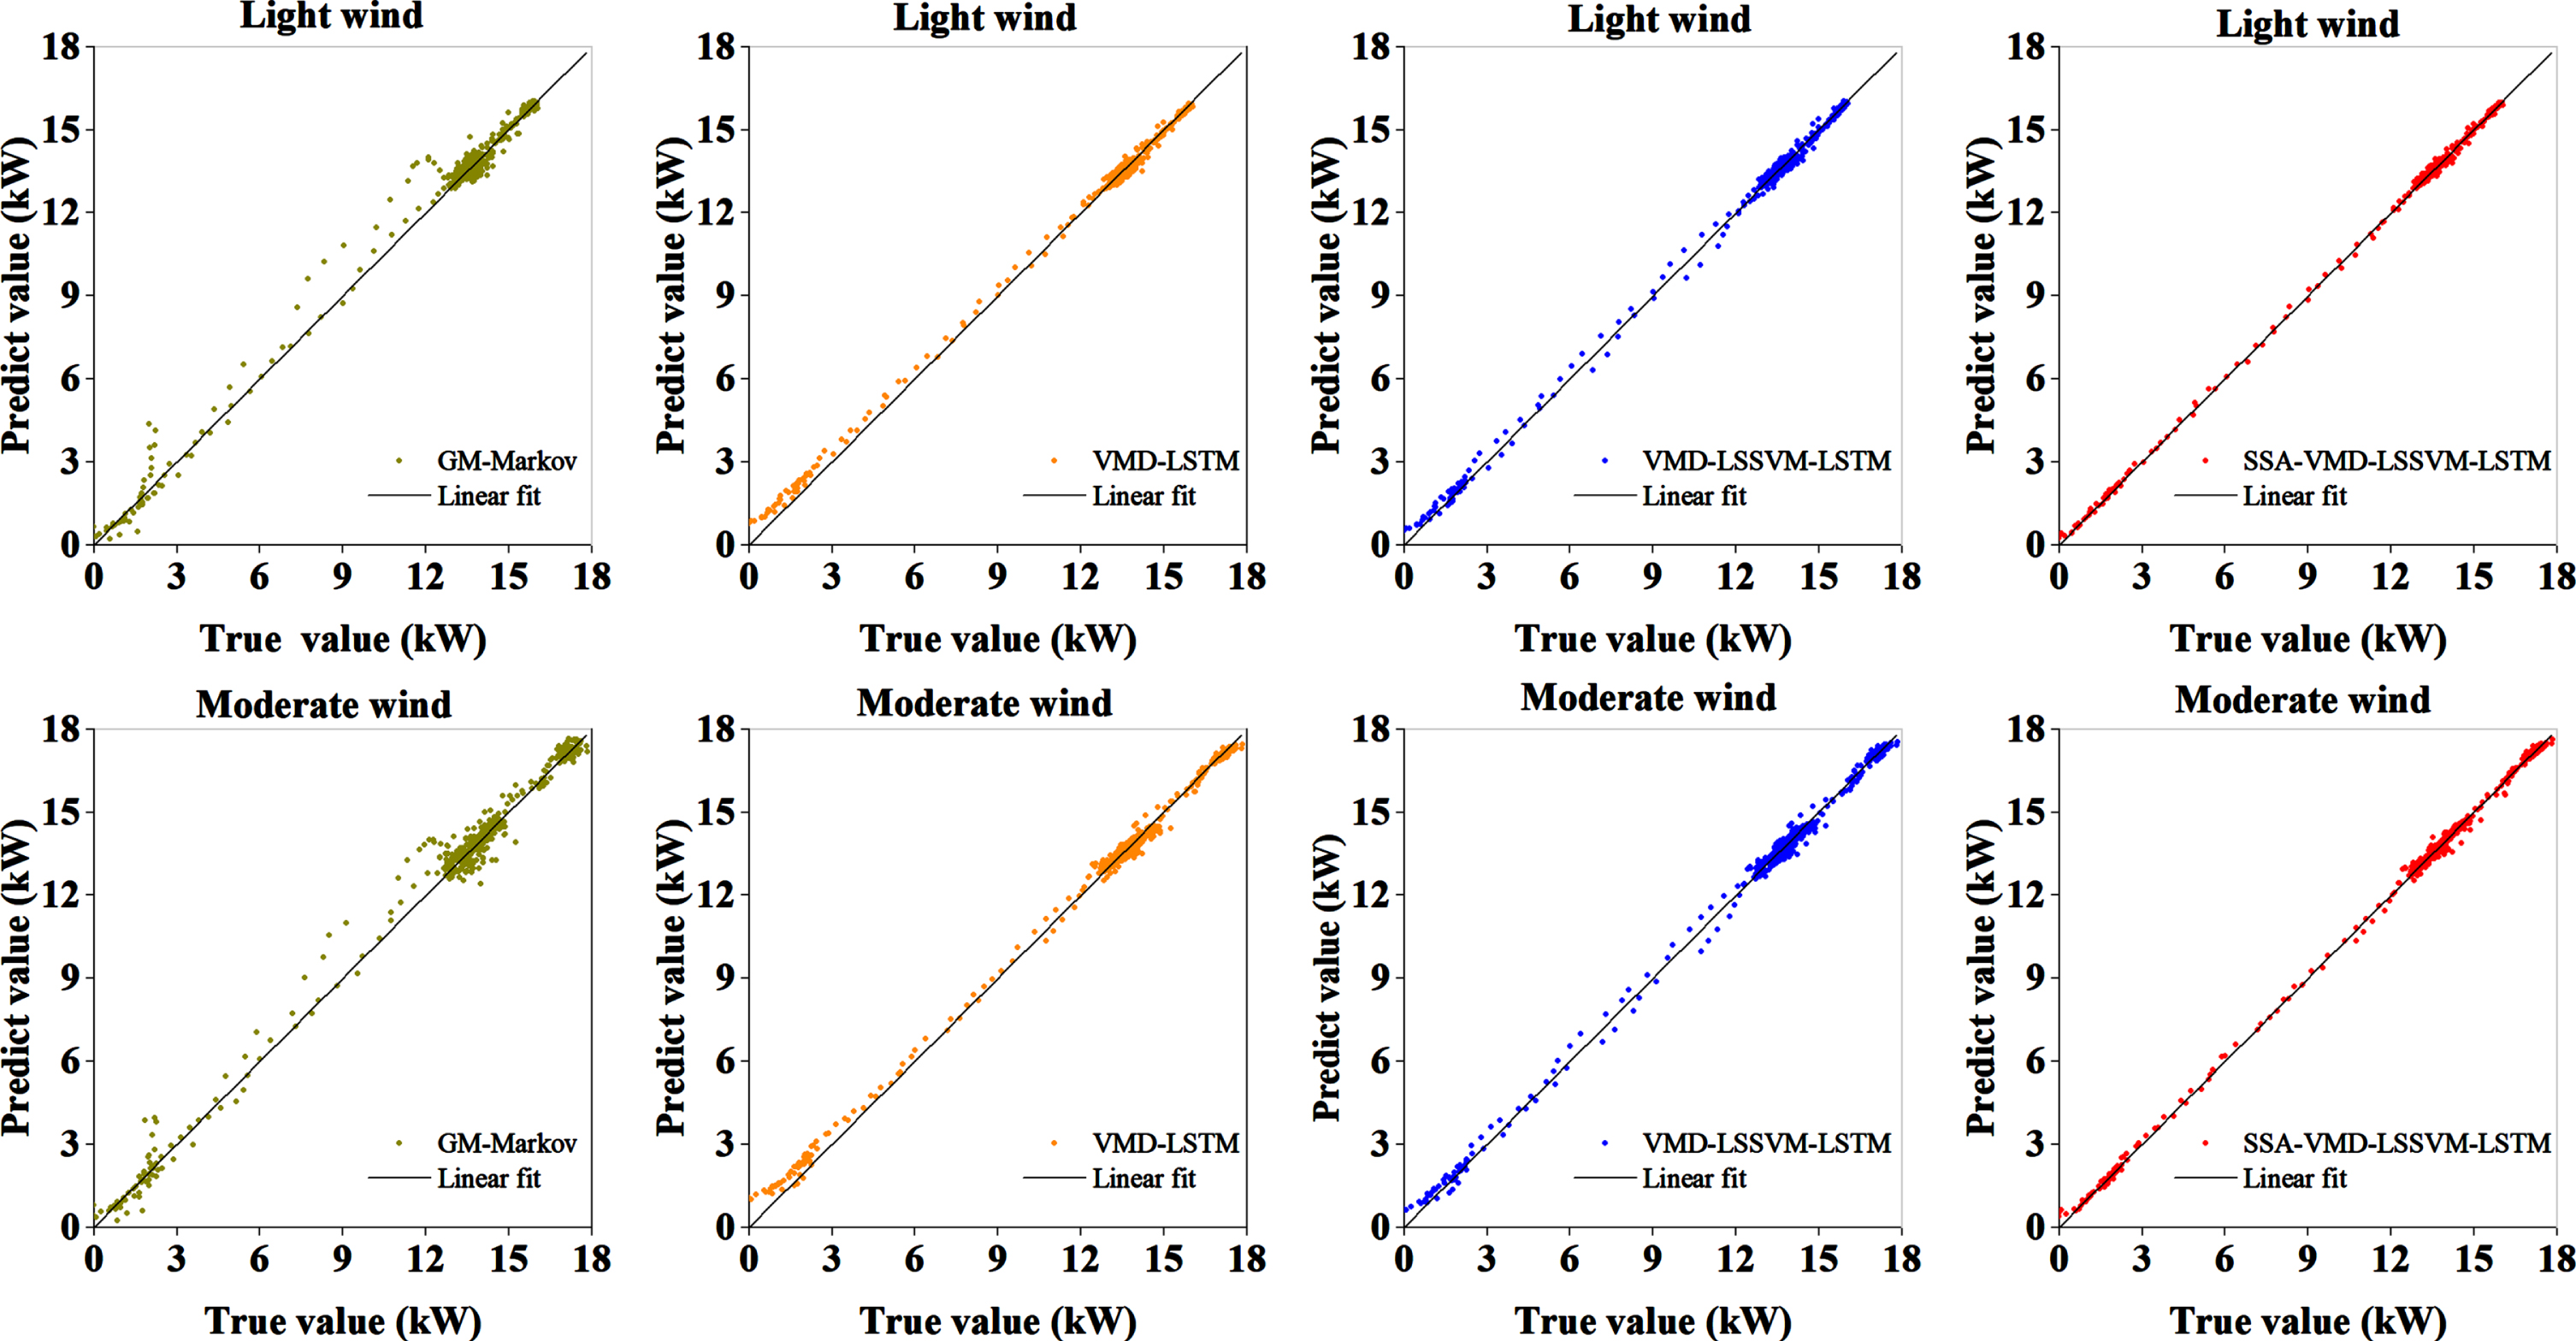
Linear regression analysis of predicted value and true.
To solve the problem that the demand power of hybrid UAV is complex and the traditional prediction model is single, this paper constructs a hybrid power prediction model based on VMD-SSA-LSTM-LSSVM. According to the measured flight data and model demonstration and analysis, the following conclusions are drawn:
VMD can effectively decompose the demand power time sequence signal with complex characteristic changes and greatly reduce the complexity of prediction engineering. The modal components are classified into low-frequency and high-frequency components based on sample entropy. Then each component is fed into a hybrid prediction model composed of LSSVM and LSTM. The hybrid model exhibits better prediction performance compared to traditional single prediction models. By utilizing the SSA optimization algorithm to search for learning parameters globally, the accuracy of the prediction model surpasses the accuracy of the previous models by 72.46%, 50.16%, and 41.2% in light wind conditions, and by 66.87%, 46.22%, and 34.53% in moderate wind conditions. The results show that the proposed VMD-SSA-LSTM-LSSVM hybrid prediction model has excellent predictive abilities.
Footnotes
Acknowledgments
This work was supported in part by the National Natural Science Foundation of China under Grant No.62273142, in part by the science and technology innovation Program of Hunan Province under Grant No.2021GK2010, in part by the Hunan Province Natural Science Foundation under Grant No.2023JJ30437.