
Abstract
Fault detection in rotating machinery is critical to reliability and safety. However, it faces difficulties due to complex, noisy fault signatures, non-stationary behavior, and the impracticality of obtaining large labeled datasets, limiting the effectiveness of both traditional and deep learning-based methods in real-world applications. This paper introduces a novel approach that combines Variational Mode Decomposition (VMD) and Long Short-Term Memory (LSTM) networks to improve gear and bearing defect detection, filling a gap in fault diagnostics by effectively handling limited training data. VMD decomposes signals into intrinsic mode functions (IMFs), while LSTM classifies fault types and severity levels based on time-domain features extracted from the IMFs. Tested on the Case Western Reserve University Dataset (CWRUDS) for bearing defects and the Laboratory of Mechanics and Structures Dataset (LMSDS) for combined gear and bearing defects, the method outperforms vibratory analysis and conventional classifiers such as MLP, 1D-CNN, 2D-CNN, and standalone LSTM. The results show that the VMD-LSTM model is superior at reliably detecting defects and accurately diagnosing faults in complex, data-limited scenarios, making it a promising solution for machinery health monitoring.
Keywords
Introduction
In industrial settings, fault detection in rotating machinery must be reliable and timely in order to ensure operational safety and reduce unplanned downtime. Despite the importance of this task, traditional methods frequently fail to accurately diagnose faults due to the complexity of fault patterns and the difficulties posed by noisy, non-stationary signals. Traditionally, vibration analysis has been a cornerstone of fault diagnosis, employing signal processing techniques to detect irregularities in machine operation. For instance, Kebabsa et al. 1 applied spectral analysis to monitor machine conditions and implement predictive maintenance in industrial settings. While such methods are useful in some situations, they frequently struggle with complex fault signatures that are influenced by noise, overlapping frequency components, and variations in operating conditions.
To address these limitations, researchers investigated advanced signal processing techniques. The wavelet transform, 2 empirical mode decomposition (EMD), 3 and its variations, such as ensemble EMD, 4 complete ensemble EMD with adaptive noise, 5 and improved complete ensemble EMD with adaptive noise, 6 have all been extensively studied. Although these methods are more adaptable and noise-resistant than traditional spectral analysis, they still struggle with highly non-stationary signals and overlapping fault frequencies. Other techniques, such as high-frequency resonance analysis, 7 cyclostationary analysis, 8 and kurtogram analysis, 9 have demonstrated promise but are frequently limited by computational complexity and parameter selection sensitivity.
Variational Mode Decomposition (VMD) 10 is a recent advancement in signal decomposition that has gained popularity for its ability to adaptively decompose signals into oscillatory modes with distinct frequencies and amplitudes. Choudhury et al. 11 found that VMD outperformed EMD for Tacho-Less Order Tracking in gear fault detection. VMD’s noise tolerance makes it ideal for diagnosing faults in rotating machinery, as demonstrated by Mohanty et al. 12 The authors used VMD to diagnose ball-bearing defects, demonstrating its effectiveness in signal decomposition. Sharma and Parey 13 applied VMD to extract weak fault transients, enabling the detection of gearbox defects under varying speed conditions. Sharma 14 expanded this work by proposing a VMD-based approach combined with permutation entropy for gear fault detection in real-speed applications and successfully validated its effectiveness in diagnosing planetary gearbox faults. Chen et al. 15 introduced a VMD-acoustic emission technique for gearbox fault detection, concluding that the method could generate distinct features representing various fault conditions. Zhang et al. 16 also developed a refined Coarse-to-fine VMD approach aimed at improving pattern recognition accuracy and parameter selection, demonstrating its effectiveness through experimental results.
In parallel, the integration of artificial intelligence (AI) techniques has emerged as a powerful tool for fault detection, offering improved feature extraction and classification capabilities. Unsupervised learning 17 methods, such as Principal Component Analysis (PCA), 18 Competitive Learning, 19 and Self-Organizing Maps (SOM), 20 have been used to identify patterns in unlabeled data.
However, these methods frequently necessitate extensive preprocessing and may struggle with complex, multi-dimensional data. On the other hand, supervised learning 21 approaches, including Support Vector Machines (SVM), 22 Convolutional Neural Networks (CNN), 23 and Nearest Neighbor algorithms, 24 have shown greater promise in fault classification. Long Short-Term Memory (LSTM) networks, 25 a type of recurrent neural network (RNN), have received special attention for their ability to capture long-term dependencies in sequential data, making them extremely useful for fault prognosis in complex systems.
Xie and Zhang 26 demonstrated that LSTM outperforms other methods in machine prognosis for complex bearing systems. Anwarsha and Narendiranath Babu 27 further validated the effectiveness of LSTM networks in detecting faults across various components of rotating machinery. To assess LSTM’s performance in real-world applications, Cao et al. 28 employed it for diagnosing wind turbine gearbox faults, confirming its capability for accurate fault detection. Additionally, Masri and Al-Jabi 29 utilized LSTM-based neural networks to develop analytical predictive models for wind speed, direction, and mechanical power, achieving an average error of less than 3% and an R-squared value of 0.95, demonstrating the model’s precision.
Despite these advances, a significant challenge persists: the reliance on large labeled datasets, which is frequently impractical in industrial settings due to time, cost, and sensor limitations. This limitation has prompted the creation of hybrid approaches that combine advanced signal processing and AI techniques. Several studies investigated hybrid approaches. Damou et al. 30 proposed an approach combining ensemble empirical mode decomposition, wavelet packet transform, and random forest for bearing fault diagnosis, achieving high accuracy in identifying defects. Moumene and Ouelaa 31 combined wavelet transform and pattern recognition to detect faults in gears and bearings, resulting in high accuracy in identifying combined fault types.
Gu et al. 32 enhanced fault detection by combining VMD and Continuous Wavelet Transform (CWT) to improve CNN-based diagnosis. Li et al. 33 utilized wavelet packet decomposition and support vector machines (SVMs) to detect aero-engine bearing faults, concluding that their approach was both accurate and easy to implement. In an experimental study, Almutairi and Sinha 34 applied vibration-based machine learning (VML) to classify rotor and bearing faults, evaluating their method at two different speeds. Furthermore, Tong et al. 35 proposed a novel fault diagnosis framework for rolling element bearings that combines dual-tree complex wavelet packet transform, improved intrinsic time-scale decomposition, singular value decomposition, and an online sequential extreme learning machine to effectively extract meaningful fault features and identify fault patterns from vibration signals. While these hybrid methods are promising, they still require significant computational resources and may not perform well in data-limited scenarios.
Despite advances in fault detection methods for rotating machinery, complex fault patterns and the need for large datasets continue to pose challenges. This reliance limits their practical use in industrial settings, where collecting large amounts of labeled data is costly and time-consuming. To address these issues, this paper proposes a novel approach that combines VMD and LSTM networks to improve fault detection in rotating machinery despite limited training data. VMD decomposes signals into intrinsic mode functions (IMFs), which LSTM then uses to classify fault types and severity levels. This approach takes advantage of the strengths of both methods: VMD’s ability to handle noisy, non-stationary signals and LSTM’s ability to learn complex temporal patterns. The proposed method, which reduces the reliance on large labeled datasets, provides a practical solution for real-time fault diagnosis in industrial applications where data availability is frequently limited.
The manuscript is structured as follows: Section “Introduction” introduces bibliographic research, followed by Sections “Proposed approach” and “Theoretical background,” which explain the proposed approach and methods. Section “Experimentation” covers the experimental part. Section “Results and discussion” contains the results and discussion section. Conclusions are presented in Section “Conclusion.”
Proposed approach
Traditional vibratory analysis is widely used for fault detection in rotating machinery; however, it often struggles with complex fault patterns, noise interference, and varying fault conditions, making accurate diagnosis challenging. While deep learning methods have been introduced to classify defects directly from raw signals, they typically require large labeled datasets, which are often impractical to obtain in industrial settings. To address these challenges, advanced signal decomposition techniques have been developed to extract meaningful fault signatures by breaking down complex signals into more interpretable components.
This paper proposes a novel integration of Variational Mode Decomposition (VMD) and Long Short-Term Memory (LSTM) networks that improves fault detection accuracy while using significantly fewer training samples. VMD adaptively decomposes vibration signals, revealing important fault-related information that would otherwise go undetected. The LSTM then uses sequential learning to classify fault types and severity levels, ensuring reliable performance even in small-data scenarios. By combining these two techniques, the proposed approach overcomes the limitations of both traditional vibratory analysis and deep learning models that require extensive training data, resulting in superior accuracy in complex fault diagnosis. Figure 1 depicts the proposed method in step-by-step detail:
➢ Data acquisition: This is the initial step in the workflow. Vibrational signals are repeatedly measured on the machine during various fault scenarios. These signals provide the raw input data for the fault detection process.
➢ Apply VMD: In this step, the measured vibrational signals are decomposed into intrinsic mode functions (IMFs) using the VMD technique. The number of IMFs denoted as K, is determined by calculating the mean value of the IMFs number for each signal using the work of Mnassri et al. 18 and Isham et al. 36
➢ Data splitting: Following decomposition, the dataset is split into three subsets: training (80%), validation (10%), and testing (10%). This division ensures that the model is trained on a large enough dataset while keeping separate subsets for validation and testing to prevent overfitting. Each signal in these subsets is represented by an IMF, which serves as the foundation for subsequent analysis. The training set teaches the model, the validation set fine-tunes hyperparameters, and the testing set evaluates the model’s performance on previously unseen data.
➢ Feature extraction: Scalar indicators are the most important features in the detection of faults in rotating machinery. Consequently, scalar indicators are calculated for all IMFs obtained in the three subsets.
➢ Training and classification: The features of the training and validation subsets are used to train the LSTM network, resulting in a reliable classification model. During training, the LSTM network learns to classify fault types and severity levels using the extracted features. Once trained, the model is used to classify the testing set based on the calculated features.
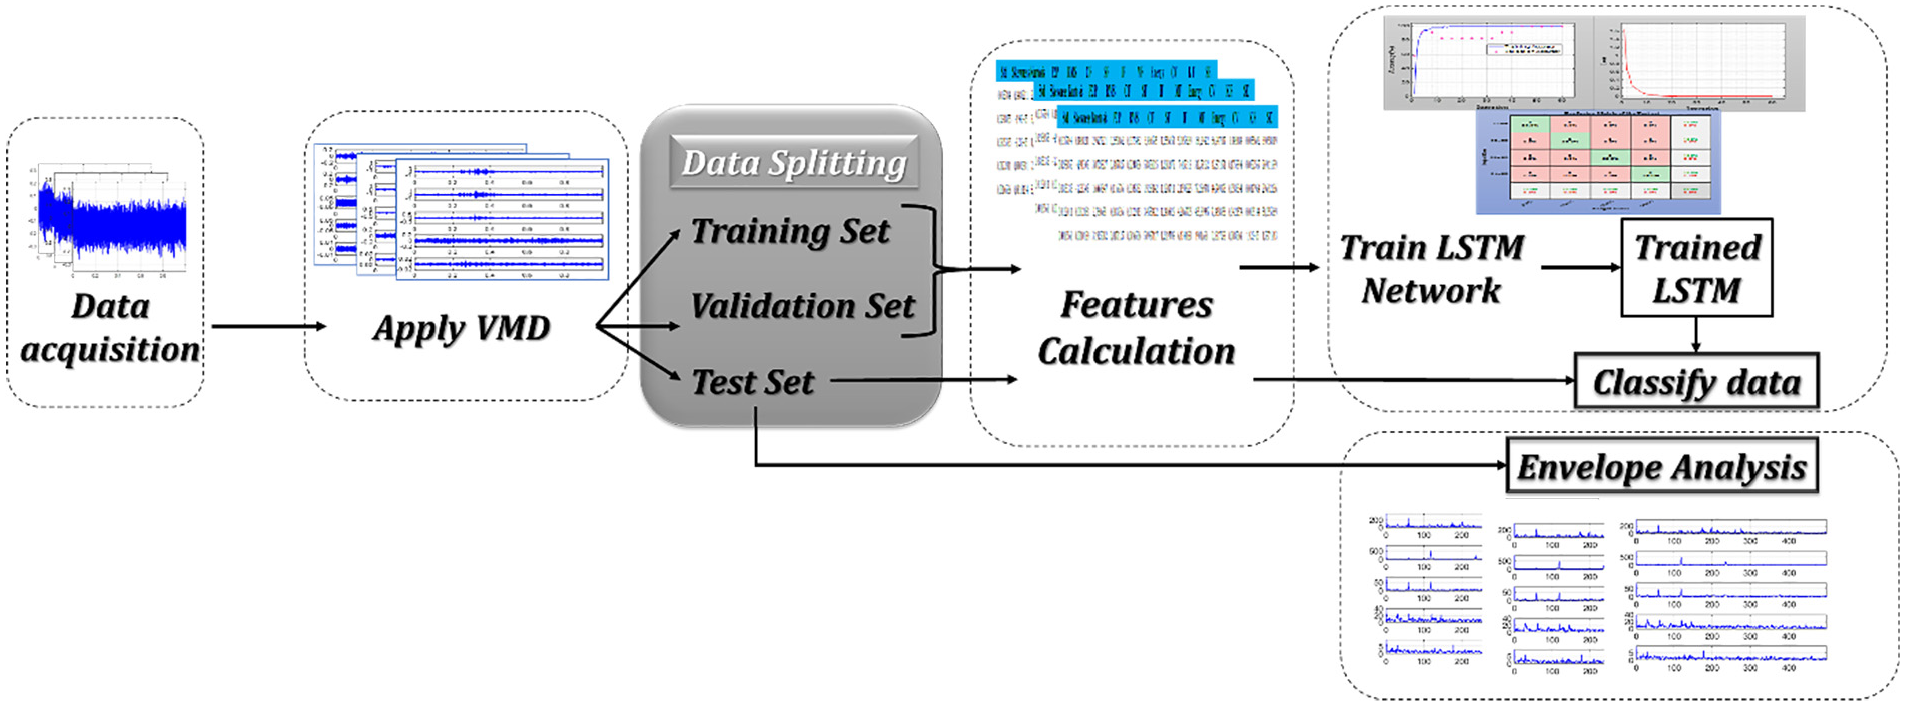
Flow chart of the proposed VMD-LSTM fault detection approach.
Finally, to confirm the superiority of the proposed approach over conventional vibration analysis, an envelope analysis is performed on the testing set’s IMFs to obtain envelope spectra and verify the potential detection of faults in these signals.
Theoretical background
Understanding the theoretical foundations is pivotal in comprehending the proposed approach for fault detection. This section briefly describes the basic principles of the methods used.
Variational mode decomposition
Variational Mode Decomposition is a signal processing technique used for adaptive decomposition of signals into a set of oscillatory components called Intrinsic Mode Functions (IMFs). The core principle of VMD is to optimize a cost function by decomposing a given signal x(t) into a sum of K narrowband oscillatory modes. This decomposition process can be represented mathematically as follows: given a signal x(t), the goal is to decompose it into K modes: u k (t) = 1, 2, …, K, and corresponding center frequencies f k .
The optimization problem to obtain the VMD can be formulated as 10 :

where, u
k
(t) represents the kth mode, and f
k
is the center frequency of the kth mode. The first term ensures the fidelity of the input signal reconstruction. The second term enforces a smooth variation in the center frequencies.
Long short-term memory
Long Short-Term Memory is a type of recurrent neural network (RNN) architecture designed to capture long-range dependencies in sequential data. The LSTM unit consists of various gates (input, forget, output) that regulate the flow of information within the network.
Mathematically, an LSTM unit for a given input sequence
Compute the input, forgot, and output gates:

Update the cell state C t and hidden state h t :


where, i t , f t , o t are the input, forget, and output gate vectors at time step t; W i , W f , W o , W C represent weight matrices; b i , b f , b o , b C are bias terms; σ denotes the sigmoid function, and tanh denotes the hyperbolic tangent function.
Time domain features
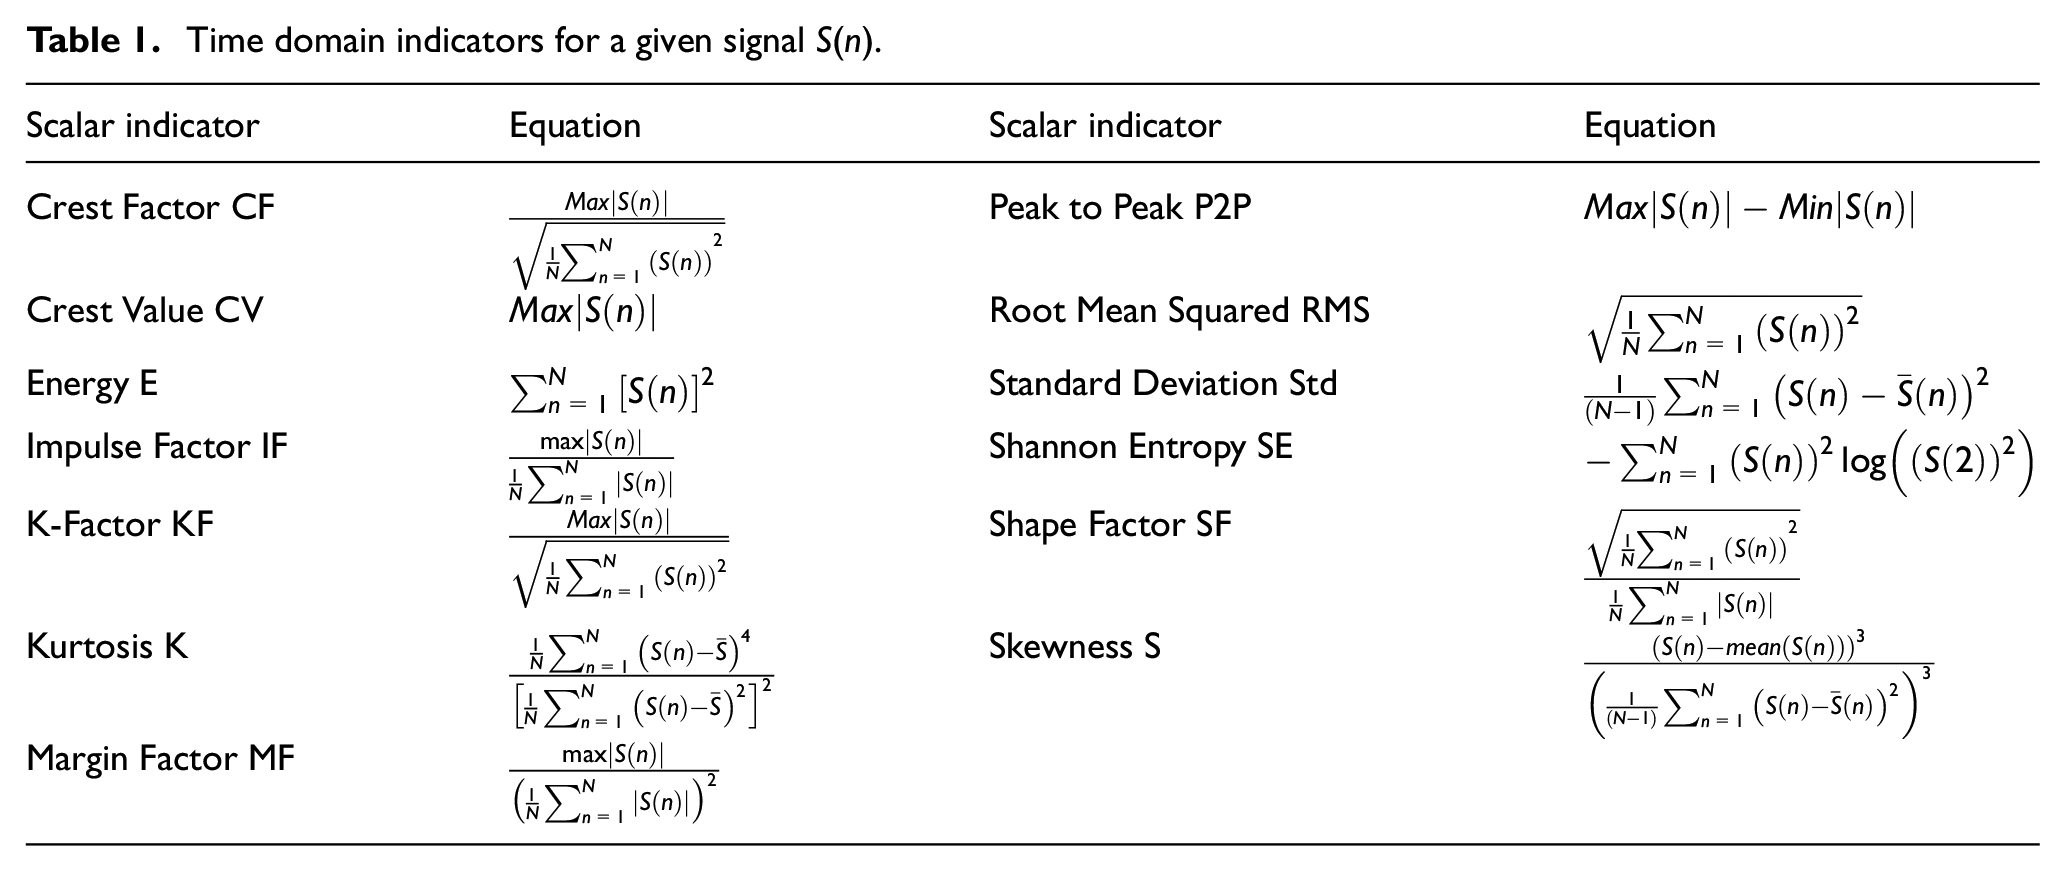
Time-domain indicators serve as crucial descriptors extracted from the intrinsic characteristics of signals, providing valuable information about fault conditions in rotating machines. Their importance lies in capturing nuanced fault signatures that might otherwise remain hidden, offering a concise yet informative representation of underlying fault conditions. Table 1 lists the thirteen scalar indicators used in this study.
Time domain indicators for a given signal S(n).
Experimentation
In the experimental phase, the proposed approach was tested on two distinct datasets. The first dataset, CWRUDS (Case Western Reserve University Dataset), 37 was obtained online from Case Western Reserve University and only included bearing defect signals. The second dataset, LMSDS (Laboratory of Mechanics and Structures Dataset), was created in the Laboratory of Mechanics and Structures at the University of Guelma in Algeria and includes a comprehensive collection of signals covering both bearing and gear defects. The use of these distinct datasets aimed to validate and demonstrate the approach’s efficacy in fault detection across different severities and types of defects.
CWRUDS
The Bearing Data Center at Case Western Reserve University 27 has a large database of vibration signals derived from various bearing types operating under different conditions and exhibiting multiple defects. This database contains signals from both normal and faulty bearings, allowing for a thorough investigation of bearing behavior under varying loads, speeds, and lubrication conditions. The signals were collected using a specialized test bench designed to generate typical bearing faults and then capture their characteristics. Figure 2 shows the test bench setup, which includes a motor on the left, a “transducer/encoder” coupling in the center, and a dynamometer on the right. In this study, signals were recorded at a sampling rate of 48 kHz, resulting in a 10-s signal for each case, which was segmented to yield a 1-s sample. This set included signals from both normal operating bearings and those with faults (ball defect, inner ring defect, outer ring defect), allowing for a thorough analysis across a wide range of operational conditions and fault scenarios.

Case Western Reserve University’s test bench.
LMSDS
The LMSDS included various vibration signals for gears and bearings in a variety of working states and conditions. The data were collected at the Laboratory of Mechanics and Structures (LMS), University of Guelma, Algeria, using the testing setup shown in Figure 3. This setup consists of an electrical motor with speed control, which allows for variable rotational frequencies. The flexible coupling transmits the motor’s rotational motion to the gearbox’s drive shaft. The gearbox consists of four spur gears arranged on three shafts (drive, middle, and driven), which are guided by six housing bearings fixed to a steel box. The Plexiglas top face makes it easier to create gear faults and replace gears, as well as apply lubrication. An electromagnetic brake connected to the third shaft creates a load that simulates transmission pressure. Defects were simulated on gears 2 and 4, as well as the middle shaft bearing. The vibration data were collected under identical load conditions induced by the brake. The data were sampled at 16,384 Hz with a recording time of 1 s.
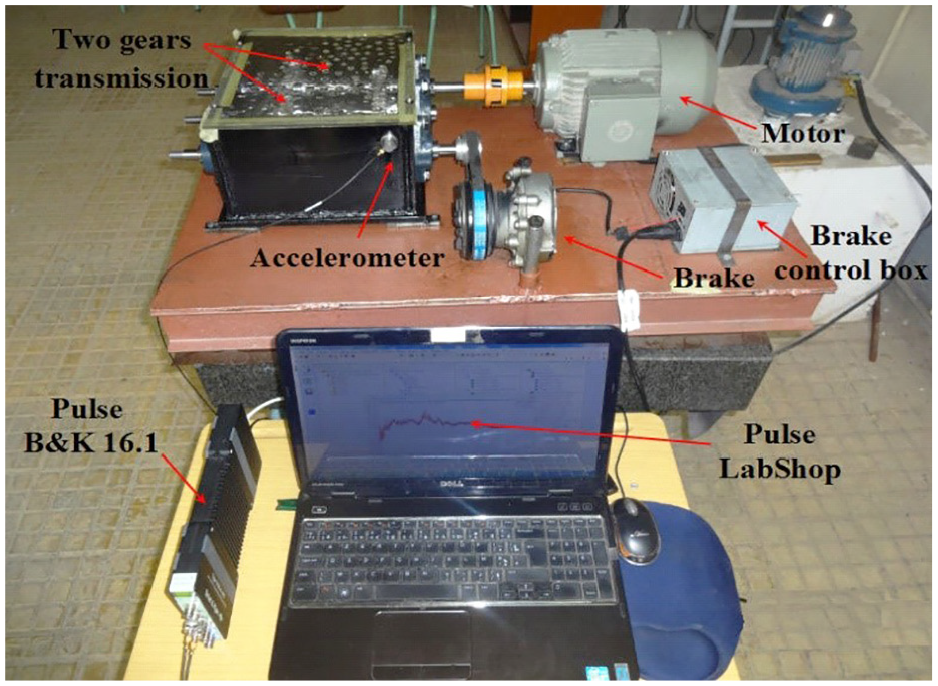
Laboratory of Mechanics and Structures’ test bench.
Table 2 displays the frequency characteristics required for fault detection, including the rotation frequencies Fr and calculated frequencies of the bearings (outer race defect BPFO, inner race defect BPFI, ball defect BPF, and cage defect CF).
Frequency characteristics of the defects for both sets.
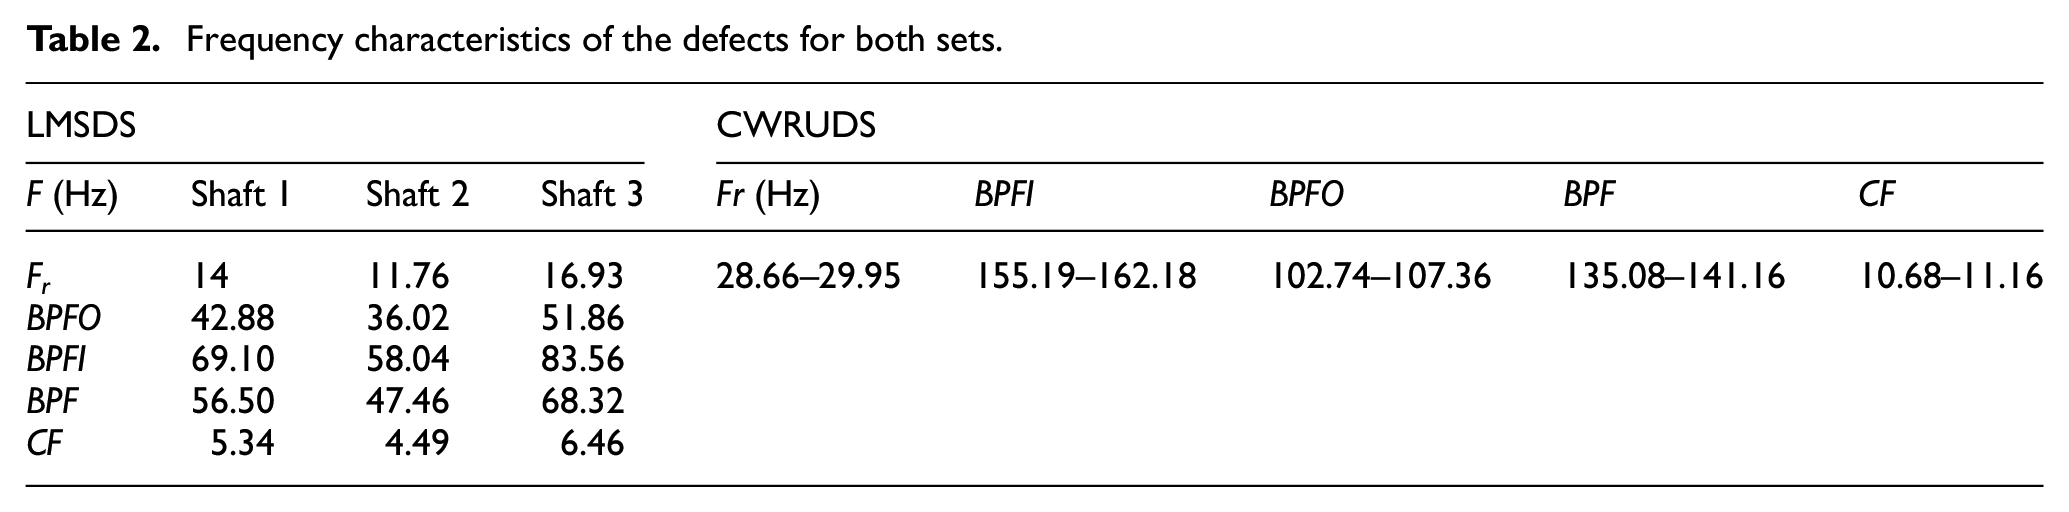
Table 3 provides the complete compositions of the samples present from the two datasets: SD (Small Defect), AD (Average Defect), and CD (Critical Defect). Each severity of the dataset has 30 samples with a duration of 1 s each, divided into 24 for training, 3 for validation, and 3 for testing.
Total compositions of the datasets used (CWRUDS on the left and LMSDS on the right).

Each vibration signal was segmented into 1-s samples, with CWRUDS sampled at 48 kHz and LMSDS at 16,384 Hz. The dataset was split into 80% training, 10% validation, and 10% testing subsets. The LSTM model was trained using two LSTM layers (each with 64 hidden units), a dropout layer (0.2), and a fully connected SoftMax layer. The model was optimized using the Adam optimizer (learning rate = 0.001, batch size = 32, and a range of 60–100 epochs) with early stopping to prevent overfitting.
Results and discussion
Vibratory analysis
This section presents a conventional vibration analysis of the testing sets. The VMD decomposition parameters (K, α) were set based on Isham et al. 36 and Feng et al., 38 resulting in an average number of IMFs equal to 5. Out of the large number of samples treated, the ball bearing defects and the gear defects of the CWRUDS and LMSDS, respectively, are presented below.
Figure 4 depicts the analysis procedure, with Figure 4(a) showing the time domain representation of three signals with small ball defects, Figure 4(b) presenting the resulted IMFs for each signal, and Figure 4(c) displaying the signals’ envelope spectrum. By analyzing the envelope spectrum in Figure 4(c), we can clearly see that there are no fault characteristics of the ball defect BPF. Despite the presence of some peaks in IMFs 2 and 3 of the first signal and IMF 3 of the second signal, these peaks correspond to the rotation frequency Fr and do not provide us with a diagnosis of the bearing’s condition.

Vibratory analysis of small ball defect of CWRUDS: (a) time domain representation, (b) resulting IMFs, and (c) envelope spectrum of the IMFs.
Figure 5 shows the envelope spectrum of the remaining gravities in the ball defect. Figure 5(a) depicts various samples of the average defect, while Figure 5(b) examines the critical defect. The absence of the BPF is also evident in these envelope spectrums. Despite the VMD’s robustness for fault detection, which allowed it to detect both inner and outer ring defects in the same dataset, diagnosing the ball defect in all three severity levels proved impossible in this case. These findings are highly consistent and confirm the works of Nouioua et al. 39 and Smith and Randall. 40

IMFs’ envelope spectrum of ball bearing defect signals from CWRUDS: (a) average ball defect and (b) critical ball defect.
The signals of the LMSDS contain noise, making the detection more difficult. It was impossible to detect in all cases. The VMD is an effective signal processing tool, but the measured signals in this case presented a challenge. In the case of gear defects, analysis of the small defect signals shown in Figure 6 yielded no results. Figure 6(a) depicts the time domain representation of the three signals, and it is clear that the signals are corrupted with high levels of noise.

Vibratory analysis of small gear defect of LMSDS: (a) time domain representation, (b) resulting IMFs, and (c) envelope spectrum of the IMFs.
The resulting IMFs in Figure 6(b) are analyzed using an envelope analysis to produce the spectrum in Figure 6(c). The analysis of these spectra reveals the presence of some peaks corresponding to Fr1 and its harmonics (x2, x3, …) that correspond to the first shaft, which can be translated into the presence of misalignment on the input shaft, whereas the spectrum in Figure 6(c) revealed the absence of Fr2, which is related to the defected gear.
The analysis of the remaining gear defects in Figure 7 continues without yielding any clear indications of the defects. In Figure 7(a) and (b), the presence of F r 1 and its harmonics confirms the misalignment diagnosis for average and critical gear defects where the harmonics’ amplitude exceeds the rotation frequency.

IMFs’ envelope spectrum of gear defect signals from LMSDS: (a) average gear defect and (b) critical gear defect.
Figure 8(a) to (c) show the analysis of combined gear defects, which represent critical and small, critical and average, and critical and critical defects, respectively. Some F r 2 peaks can be seen, but there are no harmonics, and F r 3 is completely absent, making it impossible to detect gear defects.
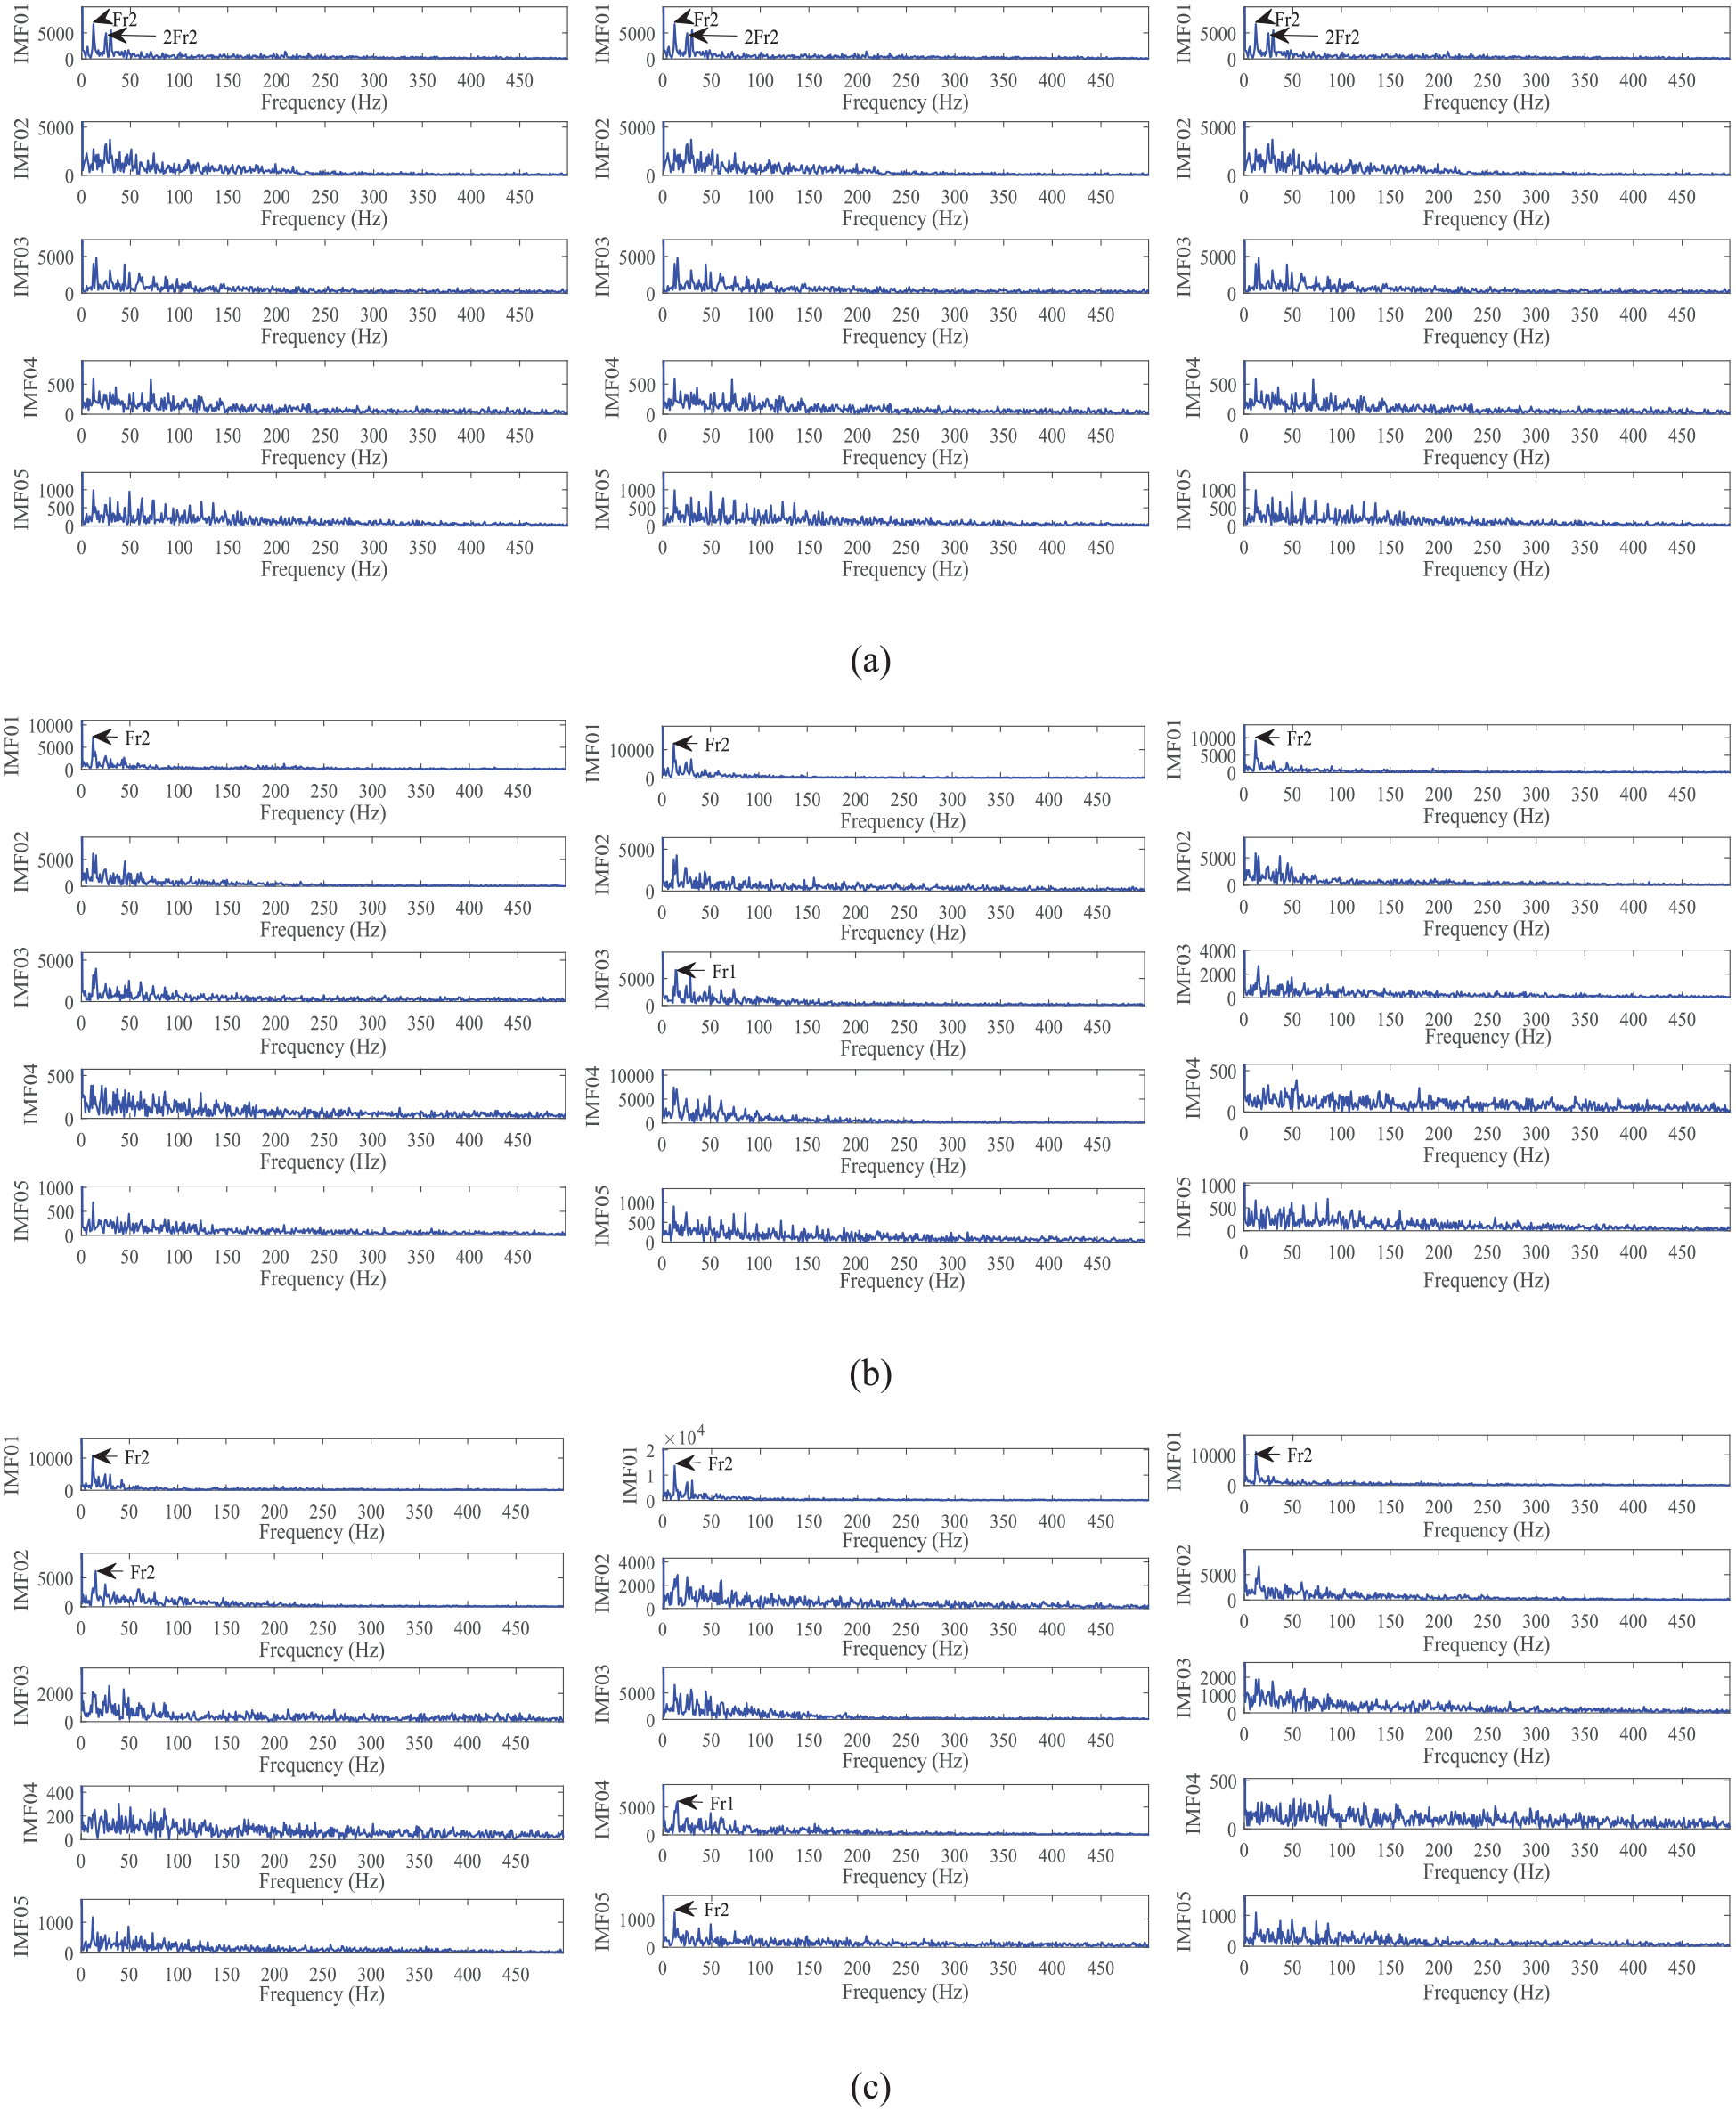
IMFs’ envelope spectrum of combined gear defect signals from LMSDS: (a) critical and small defects, (b) critical and average defects, and (c) critical and critical defects.
The diagnostic process for the two datasets containing gear and bearing defects revealed that traditional VMD analysis struggled to accurately detect the majority of fault types, with the exception of inner and outer ring defects. While acknowledging these limitations, it is important to emphasize the inherent complexity and variability of fault signatures, which may render traditional methods ineffective in certain scenarios.
Application of the VMD-LSTM combination
This section presents the results of the classification and fault diagnosis of gear and bearing defects found in both sets. This manuscript provides a comprehensive investigation of the sets using multiple recursive neural networks (RNNs) to detect faults correctly. The RNNs are created by feeding the feature matrix obtained from the calculation of the scalar indicators of the IMFs produced by the VMD decomposition to the LSTM networks. Table 4 provides a comprehensive overview of the feature matrix extracted from CWRUDS signals that are free of defects. The feature matrix includes a wide range of signal-derived parameters, providing useful information about the machine’s condition. The feature matrix captures a wide range of parameters, allowing the LSTM network to learn complex relationships and temporal dependencies in data. Each element of the feature matrix adds valuable information to the underlying vibrational characteristics of the machinery. Using Table 4 as the feature matrix input allows the LSTM network to effectively learn and adapt to the complexities of the data, resulting in robust fault detection capabilities. The model’s predictive accuracy can be refined through iterative training and validation processes, resulting in actionable insights for proactive maintenance and condition monitoring of rotating machinery.
Feature matrix of a signal without defect from the CWRUDS.

Figure 9 shows that the RNNs trained for the CWRUDS start with defect type classification (RNN1) and then proceed to severity classification of each type of defect (RNN2, RNN3, RNN4). Finally, to test the proposed approach further, a classification of all classes from this set was performed (RNN5). This last section includes the procedure used by the previous RNNs (RNN1, RNN2, and RNN3) to provide a direct fault type and its corresponding severity.
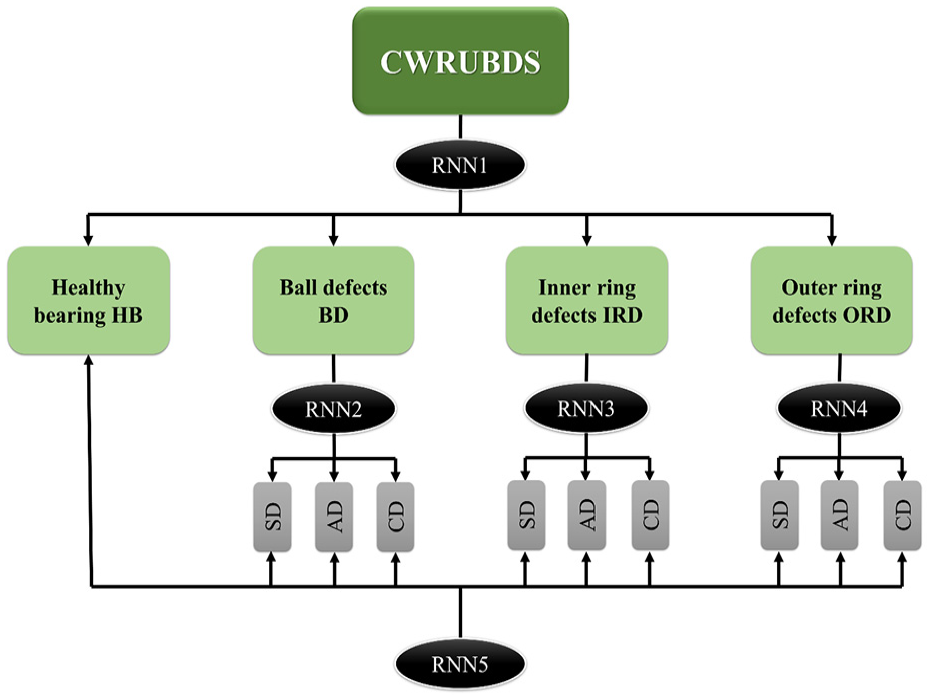
Trained RNNs for fault detection of CWRUDS.
The RNNs trained for the LMSDS shown in Figure 10 were built using the same concept as the previous one. The initial step is to determine the defect type (RNN6). The next step was to determine the defect’s severity of the bearing and gear defects (RNN7, RNN8). Finally, a classification of the combination of the two defects was conducted (RNN9) to obtain a complete diagnosis.

Trained RNNs for fault detection of LMSDS.
This study presents the RNNs that were used to classify the defect types in both sets (RNN1 and RNN6). For the severity classification, we chose ball defects from CWRUDS (RNN2) and gear defects from LMSDS (RNN8) in accordance with the previous vibratory analysis. Figure 11 shows the training progress of RNN1. The total number of iterations was set to 60, and the training accuracy reached 100% before the end of the process, despite some disruption at the start of the training process, as shown in Figure 11. The model initially had high variance, but as progress was made and the performance of the LSTM networks in sequential training improved, the RNN converged, and both training accuracy and validation (Figure 11(a)) reached 100% and stabilized before the end of learning. The loss function in Figure 11(b) confirms the model’s convergence, as we can see a good concordance with the training process and lower loss values.

Training progress of RNN1: (a) training accuracy and (b) loss.
Figure 12 depicts the trained RNN1’s confusion matrix for detecting CWRUDS fault types. The strong diagonal concentration demonstrates the RNN1’s performance in identifying various states of the machine’s health. Even with multiple states, the trained network correctly predicted each target class. Despite the limitations of traditional vibratory analysis using VMD, the proposed approach accurately diagnosed the health condition, providing an intelligent fault detection approach for bearing faults.

The confusion matrix resulted from the trained RNN1 for defect type classification of CWRUDS.
Figure 13 displays the performance of the remaining trained RNNs for the CWRUDS. Figure 13(a) to (c) show the classification results for the severity detection of various bearing defects found in the CWRUDS, which supplement the results from RNN1. Figure 13(a) depicts the confusion matrix for RNN2 detection of the ball defect. The classification accuracy was 100%, demonstrating the proposed approach’s ability to detect ball defects accurately, even in early stages, such as small defects. Figure 13(b) and (c) show the results of RNNs 3 and 4, and the classification is 100% accurate. This result confirms those obtained from classical vibratory analysis, in which VMD was able to detect defects in both the inner and outer rings.
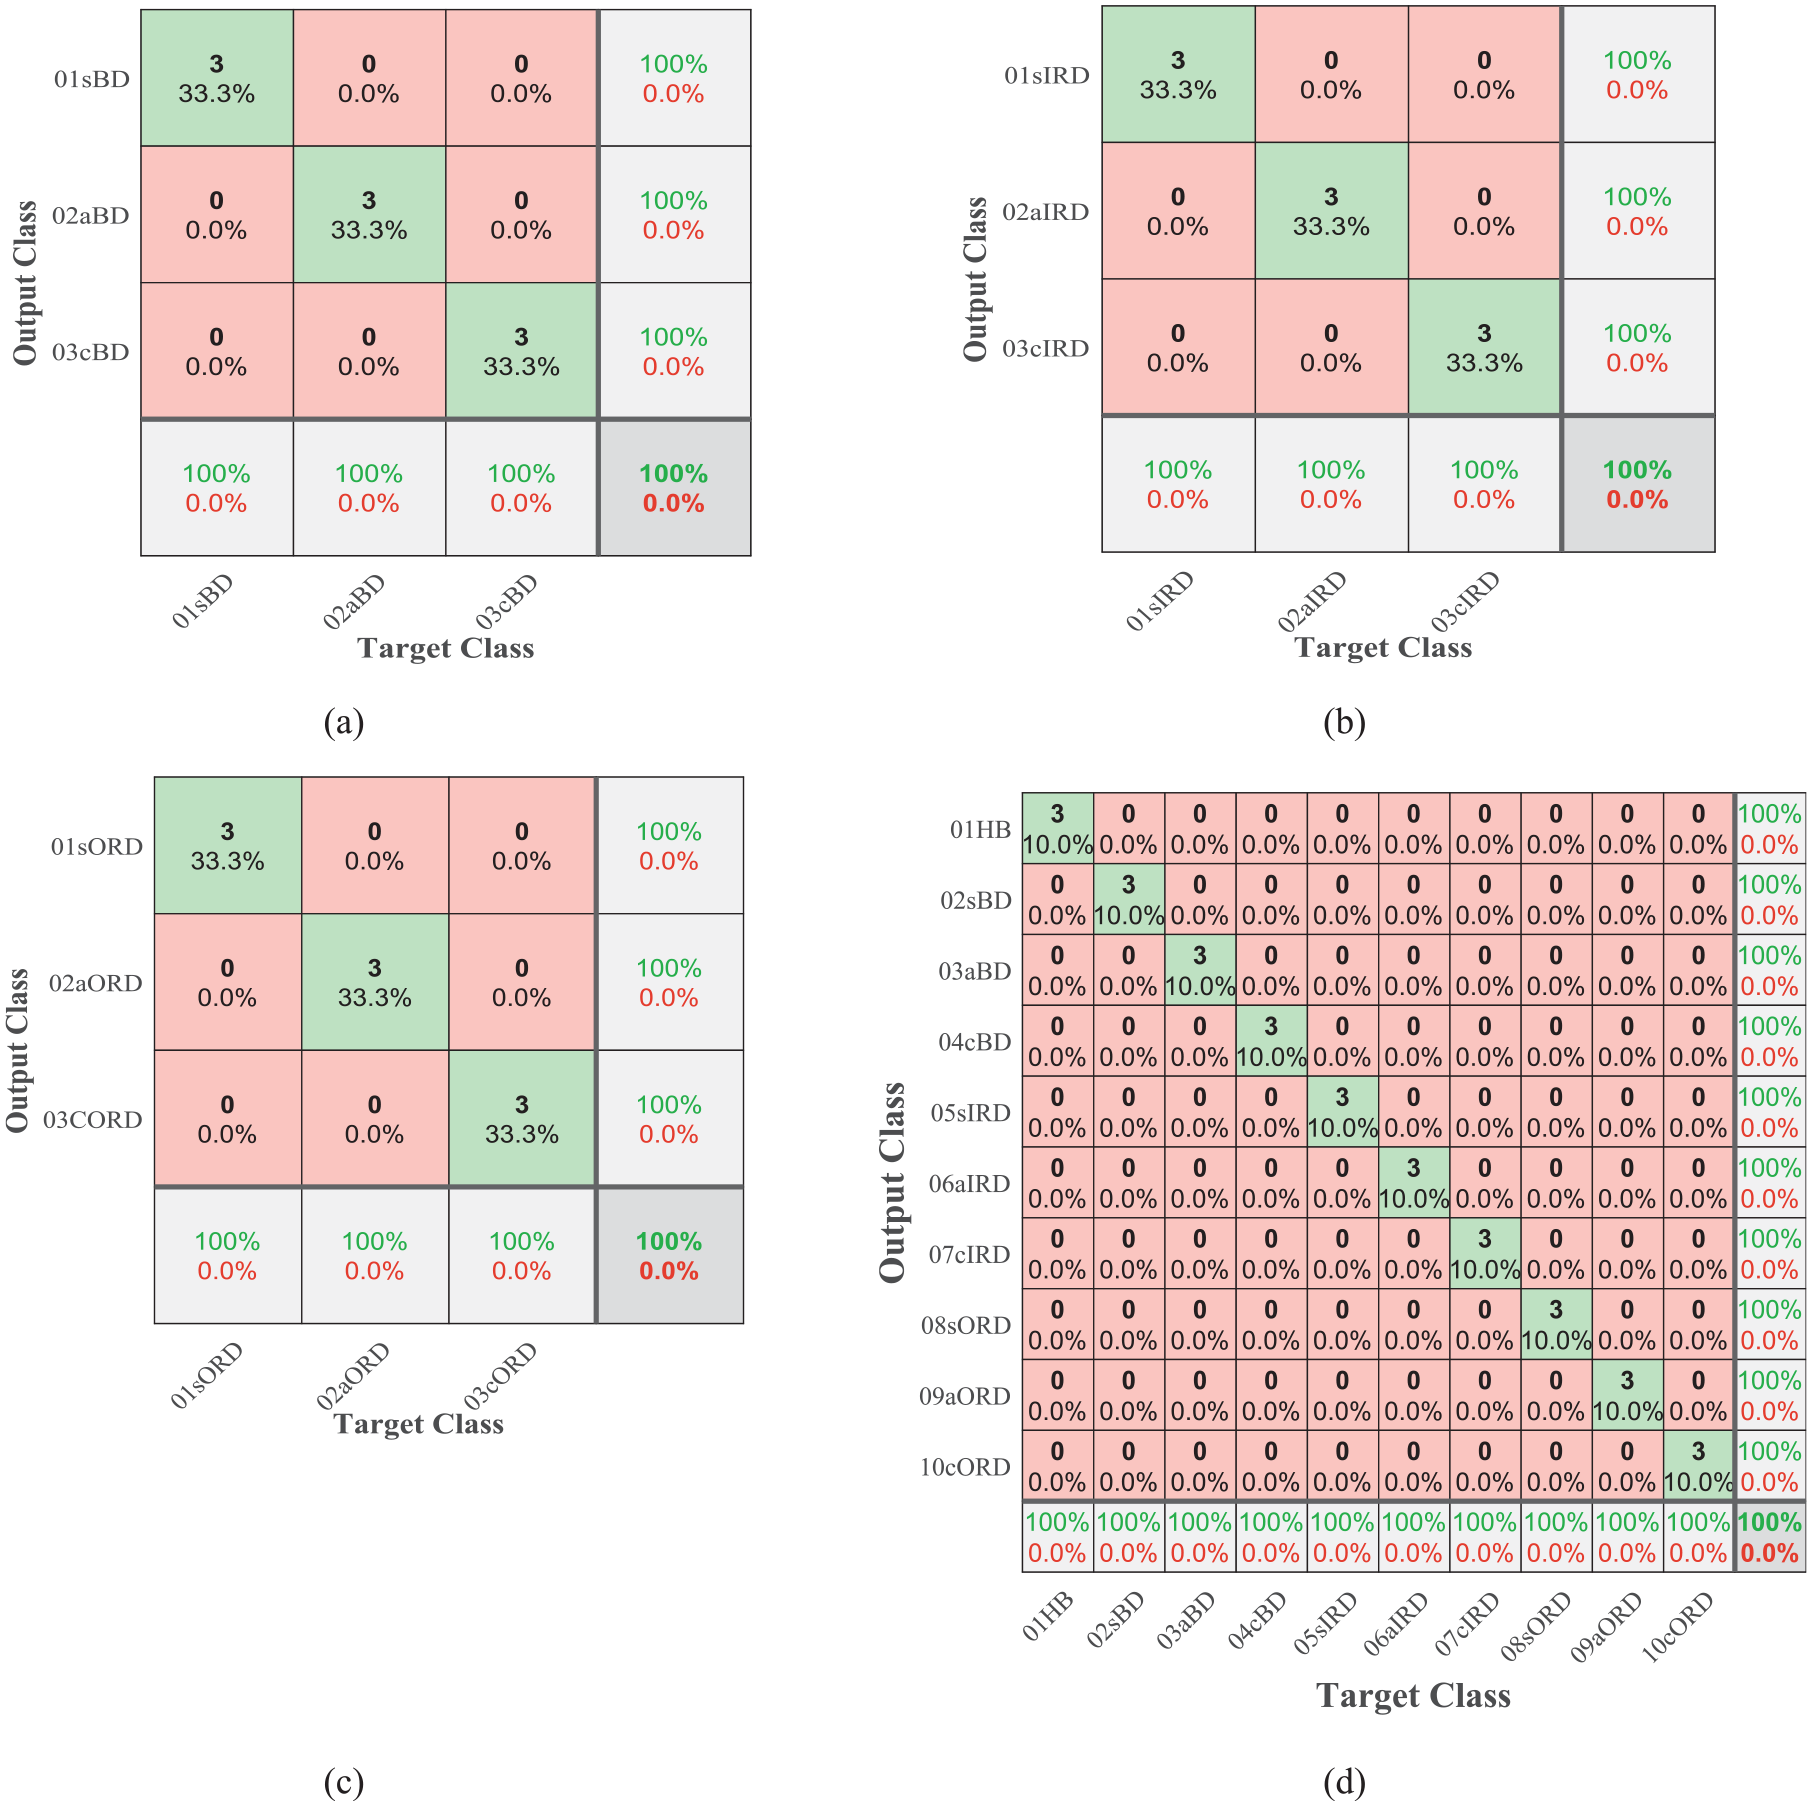
Confusion matrix resulted from the classification of CWRUDS: (a) RNN2, (b) RNN3, (c) RNN4, and (d) RNN5.
Figure 13(d), on the other hand, shows the results for the classification using RNN4, in which the proposed approach performed admirably in detecting bearing defects in the CWRUDS. The classification was performed on all 10 cases in the data set, and the accuracy was 100%, demonstrating the proposed approach’s ability to monitor machine conditions and diagnose defects. The output class correctly classified each target class, from healthy bearing to various defects (ball, inner ring, outer ring), as well as the three gravities of the defect (small, average, critical).
Figure 14 shows the progress of the LMSDS’s RNN6 training for defect-type classification. The learning accuracy reached 100% before the end of iterations, which is consistent with the validation accuracy shown in Figure 14(a). Both training and validation results indicate that the trained RNN6 has learned the characteristics. The loss shown in Figure 14(b) is also consistent with both of them, as we can see that the loss has dropped to nearly zero.

Training progress of RNN6: (a) training accuracy and (b) loss.
Figure 15 shows the classification results for RNN6. The confusion matrix shows a complete concentration on the diagonal, all of the target classes were correctly predicted, and the proposed approach was able to identify and classify different machine cases, even in the presence of gears and bearings defects.
The confusion matrix resulted from the trained RNN6 for defect type classification of LMSDS.
Figure 16 illustrates the performance evaluation of the LMSDS using confusion matrices generated from three different fault severity categorization scenarios. First, Figure 16(a) depicts the confusion matrix for bearing severity classification generated by RNN7, which demonstrates an impressive 100% accuracy. This demonstrates the effectiveness of combining VMD and LSTM in accurately classifying the severity levels of bearing defects.

Confusion matrix resulted from the classification of LMSDS: (a) results of RNN7, (b) results of RNN8, and (c) results of RNN9.
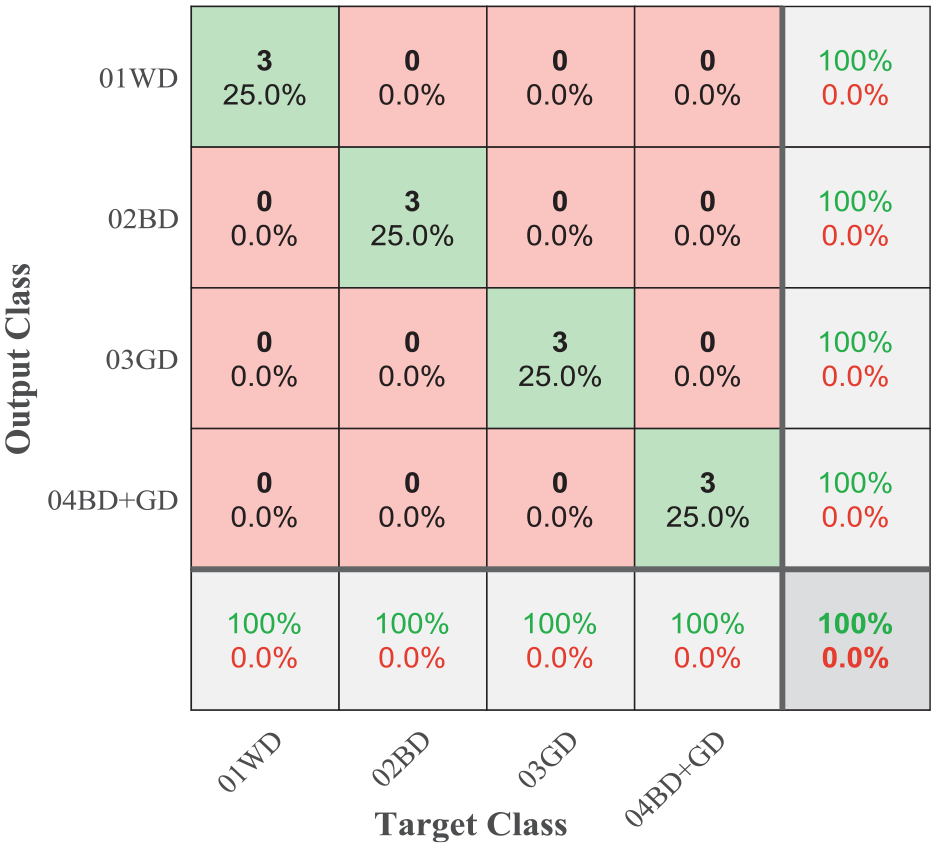
Similarly, Figure 16(b) depicts the confusion matrix from RNN8 for gear defect severity classification, which achieves a remarkable accuracy of 100% and detects all gear faults. Even when combined defects are present, the proposed approach is capable of correctly classifying the severity levels of gear defects. However, when confronted with the challenge of classifying mixed gears and bearing defects, as shown in Figure 16(c), RNN9 results in a slight decrease in accuracy to 83.3%. This decrease in accuracy is due to the inherent complexity associated with the combined nature of gears and bearing defects. Overall, the use of VMD-LSTM as a combined approach is robust and reliable for fault type detection and severity classification in rotating machinery. Its ability to accurately identify fault types and severity levels, even in the presence of multiple defects, demonstrates its potential as a powerful tool for proactive maintenance and condition monitoring in industrial applications.
This approach’s key novelty is its ability to achieve high fault detection accuracy using a small dataset for training, reducing the need for extensive data that conventional deep learning models require. Using the VMD’s ability to extract meaningful features from signals, the LSTM can efficiently classify fault types and severity levels, even with a limited training dataset. This makes the proposed method especially useful in industrial applications where obtaining large labeled datasets is impractical. The method’s ability to handle small datasets is demonstrated by its high classification accuracy, which was validated by two separate datasets: bearing defects from CWRUDS and combined gear and bearing defects from LMSDS.
Performance evaluation of the proposed approach
Table 5 summarizes the results of vibratory analysis and the VMD-LSTM method for fault detection across two different datasets: CWRUDS and LMSDS. In the case of vibratory analysis with VMD, it is clear that while the method was effective in detecting inner and outer ring defects in the CWRUDS dataset, it had limitations in diagnosing other fault types.
Results of vibratory analysis and VMD-LSTM approach.
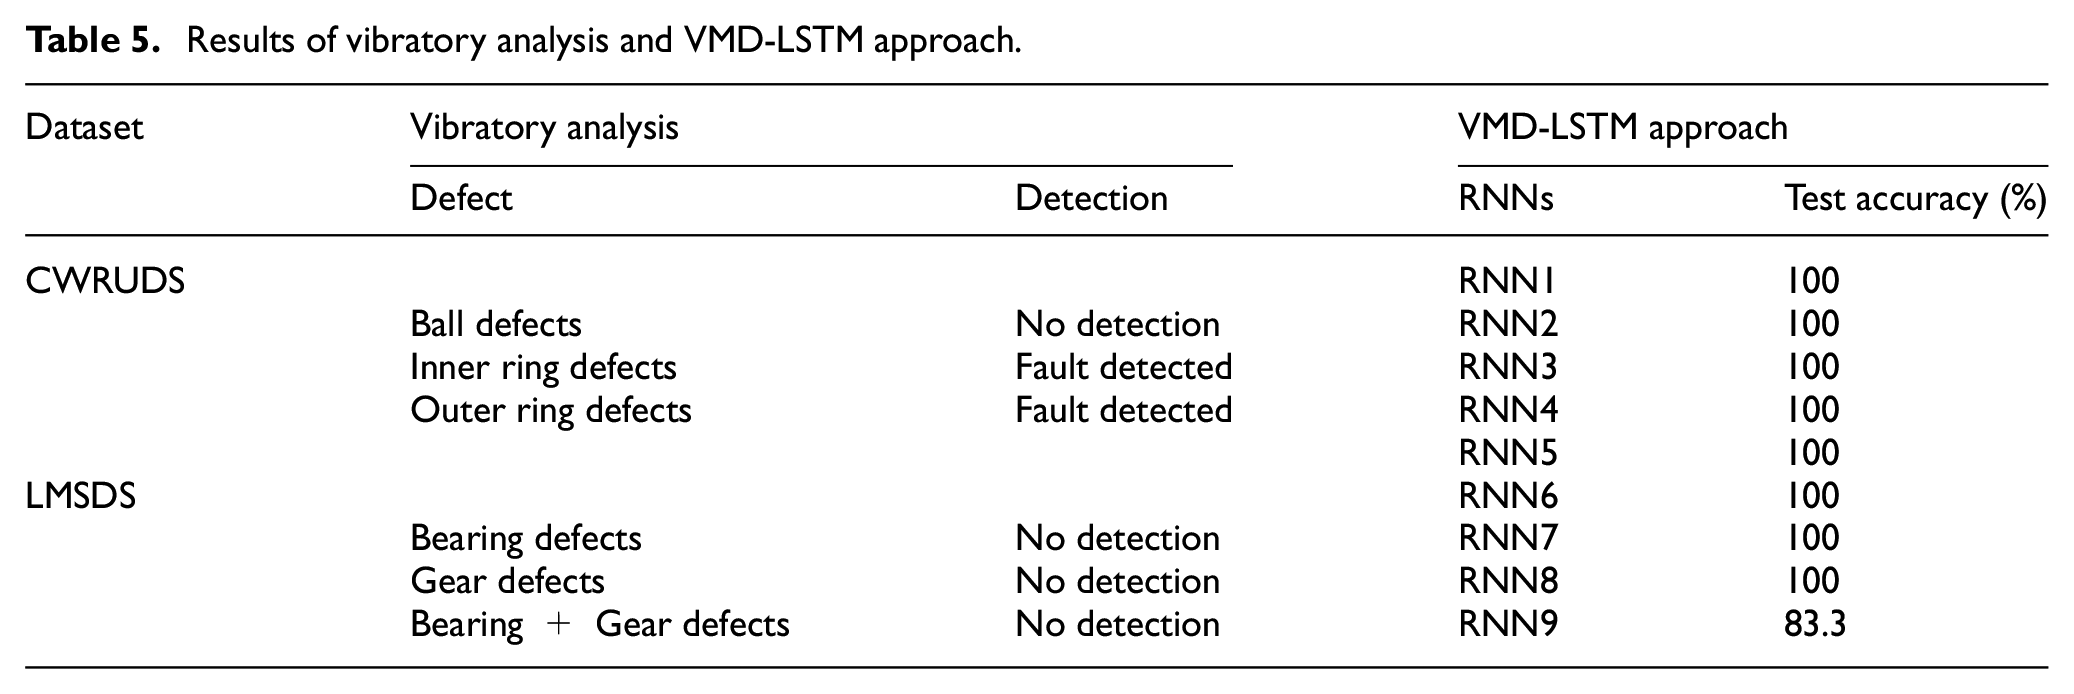
Specifically, VMD failed to diagnose ball defects in the CWRUDS because ball defects are difficult to detect, and it did not provide a diagnosis for any fault cases within the LMSDS. This set’s signals were corrupted with noise. In contrast, the proposed VMD-LSTM approach proved to be a strong substitute, outperforming both datasets. The VMD-LSTM method outperformed traditional vibratory analysis by detecting all fault types in the CWRUDS with 100% accuracy, including ball faults that classical VMD analysis failed to detect. Furthermore, the VMD-LSTM approach maintained its strong performance in fault detection within the LMSDS, achieving 100% accuracy for all fault types except combined gears and bearings, where it still achieved 83.3% accuracy because gear defects are typically more prevalent than bearing defects.
Using a small set of training samples, the proposed VMD-LSTM approach is compared to several other well-established methods, including Long Short-Term Memory (LSTM), 41 Multi-Layer Perceptron (MLP), 42 One-Dimensional Convolutional Neural Network (1D-CNN), 43 and Two-Dimensional Convolutional Neural Network (2D-CNN). 44 The parameters for each method were obtained from previous works to ensure a fair and consistent comparison.
The comparison demonstrates the effectiveness of the VMD-LSTM approach in fault detection and severity classification, especially in data-constrained scenarios. Table 6 summarizes the performance of each classifier on the CWRUDS dataset across different defect types, demonstrating that the VMD-LSTM model outperforms other classifiers by achieving 100% accuracy across all defect types and the entire dataset.
Results for the classification models of the CWRUDS.

While MLP and 1D-CNN have relatively low overall accuracy (46.66% and 53.33%), with particular difficulties in detecting inner ring defects, 2D-CNN and LSTM perform better, with total accuracies of 75.00% and 73.33%, respectively. However, neither can match the perfect classification achieved by VMD-LSTM, demonstrating its efficacy in fault detection in rotating machinery.
Table 7, on the other hand, compares the classification performance of various models on the LMSDS dataset for bearing defects, gear defects, and combined gear and bearing defects. The VMD-LSTM method achieves 100% accuracy for bearing and gear defects and 83.3% accuracy for combined defects, demonstrating its robustness. In contrast, MLP has the lowest overall performance, particularly in detecting bearing defects (55.56%) and combined defects (60.41%). 1D-CNN and LSTM perform moderately, with accuracies ranging from 66.70% to 77.77% for bearing and gear defects but lower for combined defects. 2D-CNN achieves high accuracy, particularly for gear defects (94.44%) and bearing defects (88.88%), but falls short of VMD-LSTM performance. Overall, VMD-LSTM is the most effective model for fault detection in this dataset.
Results for the classification models of the LMSDS.

The VMD-LSTM approach combines the strengths of VMD’s signal decomposition with LSTM’s sequential learning capabilities to provide a powerful and dependable framework for identifying fault patterns and assessing fault severity. This method not only overcomes the limitations of traditional vibratory analysis techniques but also excels at dealing with complex fault scenarios. Furthermore, it demonstrates consistent and superior diagnostic performance across a wide range of defect types, even when only minimal training data is used, making it especially useful in real-world applications where data is often limited.
Conclusion
This study described and evaluated a novel method for detecting defects in rotating machinery gears and bearings that combines Variational Mode Decomposition (VMD) with Long Short-Term Memory (LSTM) networks. The proposed VMD-LSTM framework outperformed classical vibratory methods and conventional classifiers in detecting a wide range of gear and bearing defects. The proposed approach was tested on two distinct datasets: the first (CWRUDS) from Case Western Reserve University, which contained bearing defects, and the second (LMSDS) from the Laboratory of Mechanics and Structure at the University of Guelma in Algeria, which contained gear and bearing defects.
VMD performed well in fault detection, detecting inner and outer ring defects in the CWRUDS, but it had limitations in identifying specific defect types, such as ball defects in the same set and all defects in the LMSDS noise signals. The limitations of conventional vibratory analysis are overcome by combining VMD’s adaptive signal decomposition capabilities with LSTM’s sequential learning abilities. The method accurately detects complex fault signatures and classifies defect types and severity. The VMD-LSTM combination produced promising results, particularly in detecting complex defects that are difficult to detect using individual methods.
In comparison to traditional classifiers such as MLP, 1D-CNN, 2D-CNN, and standalone LSTM, the VMD-LSTM model consistently performed better, particularly when dealing with complex fault signatures. The intelligent combination of advanced signal processing and deep learning techniques enables the proactive monitoring of rotating machinery.
This study presented a fundamental approach to fault detection in rotating machinery, particularly in data-limited scenarios. However, several promising research directions can help to increase its effectiveness. One important area is to optimize the VMD-LSTM fusion technique by investigating additional scalar indicators in the time, frequency, and time-frequency domains, which could improve feature extraction and classification accuracy. Another potential advancement is the incorporation of traditional classifiers, such as Support Vector Machines (SVM) and k-Nearest Neighbors (kNN), to assess their compatibility with deep learning algorithms. Finally, implementing the proposed approach in real-time industrial settings would demonstrate its practical applicability and enable proactive fault detection in machinery systems.
Footnotes
Handling Editor: Divyam Semwal
Funding
The author(s) disclosed receipt of the following financial support for the research, authorship, and/or publication of this article: The current research was conducted by the “Structural Dynamics & Industrial Maintenance” research group at the Mechanics & Structures Laboratory (LMS) of the University 8 Mai 1945, Guelma, Algeria, under the funding of the General Directorate of Scientific Research and Technological Development (DGRSDT) through the PRFU research project: A11N01UN240120220004.
Declaration of conflicting interests
The author(s) declared no potential conflicts of interest with respect to the research, authorship, and/or publication of this article.