
Abstract
An increasing number of fake news combining text, images and other forms of multimedia are spreading rapidly across social platforms, leading to misinformation and negative impacts. Therefore, the automatic identification of multimodal fake news has become an important research hotspot in academia and industry. The key to multimedia fake news detection is to accurately extract features of both text and visual information, as well as to mine the correlation between them. However, most of the existing methods merely fuse the features of different modal information without fully extracting intra- and inter-modal connections and complementary information. In this work, we learn physical tampered cues for images in the frequency domain to supplement information in the image space domain, and propose a novel multimodal frequency-aware cross-attention network (MFCAN) that fuses the representations of text and image by jointly modelling intra- and inter-modal relationships between text and visual information whin a unified deep framework. In addition, we devise a new cross-modal fusion block based on the cross-attention mechanism that can leverage inter-modal relationships as well as intra-modal relationships to complement and enhance the features matching of text and image for fake news detection. We evaluated our approach on two publicly available datasets and the experimental results show that our proposed model outperforms existing baseline methods.
Introduction
Social networks have become an important platform for people to express and exchange information due to their low cost, convenience, and rapid dissemination, but the lack of effective regulatory measures has also resulted in the proliferation of fake news. The massive amount of online fake news spreading uncontrollably in social media will bring negative impact on individuals and damage the stability and harmony of society [1]. For example, during the 2016 US presidential election, fake news was more popular and spread more widely on Facebook than real news [2], and during the COVID-19 pandemic, a large amount of inaccurate information also caused social panic [3, 4]. Detecting fake news is therefore essential to building a credible social news system.
In addition, along with the development of Internet technology, news has evolved from unimodal to multimodal, i.e., multimedia news with pictures or videos. Multimedia news brings a richer news reading experience, and news with visual content not only attracts more attention but also increases the credibility of the news [5]. However, fake news has also taken advantage of this, often using distorted or even faked images or videos to attract and mislead readers, thus spreading more quickly than real news [6]. Figure 1 depicts four examples of fake news stories. The text in Fig. 1(a) and 1(b) appear normal, but the images are obviously fabricated. In Fig. 1(c), the image appears authentic, but the accompanying text reveals that it is a forgery. In Fig. 1(d), the image and the text apparently convey the same meaning, but it is actually taken out of context. From the above examples it can be concluded that it is difficult to detect fake news from a single pattern of data. Generally, fake news creators produce fake news by expressing strong emotions through textual descriptions and mis-matching irrelevant images or fabricating images that are visually striking [7]. Therefore, each modality of data can provide different degrees of information about rumours, and it is important to consider the fusion of multimodal data to detect fake news.
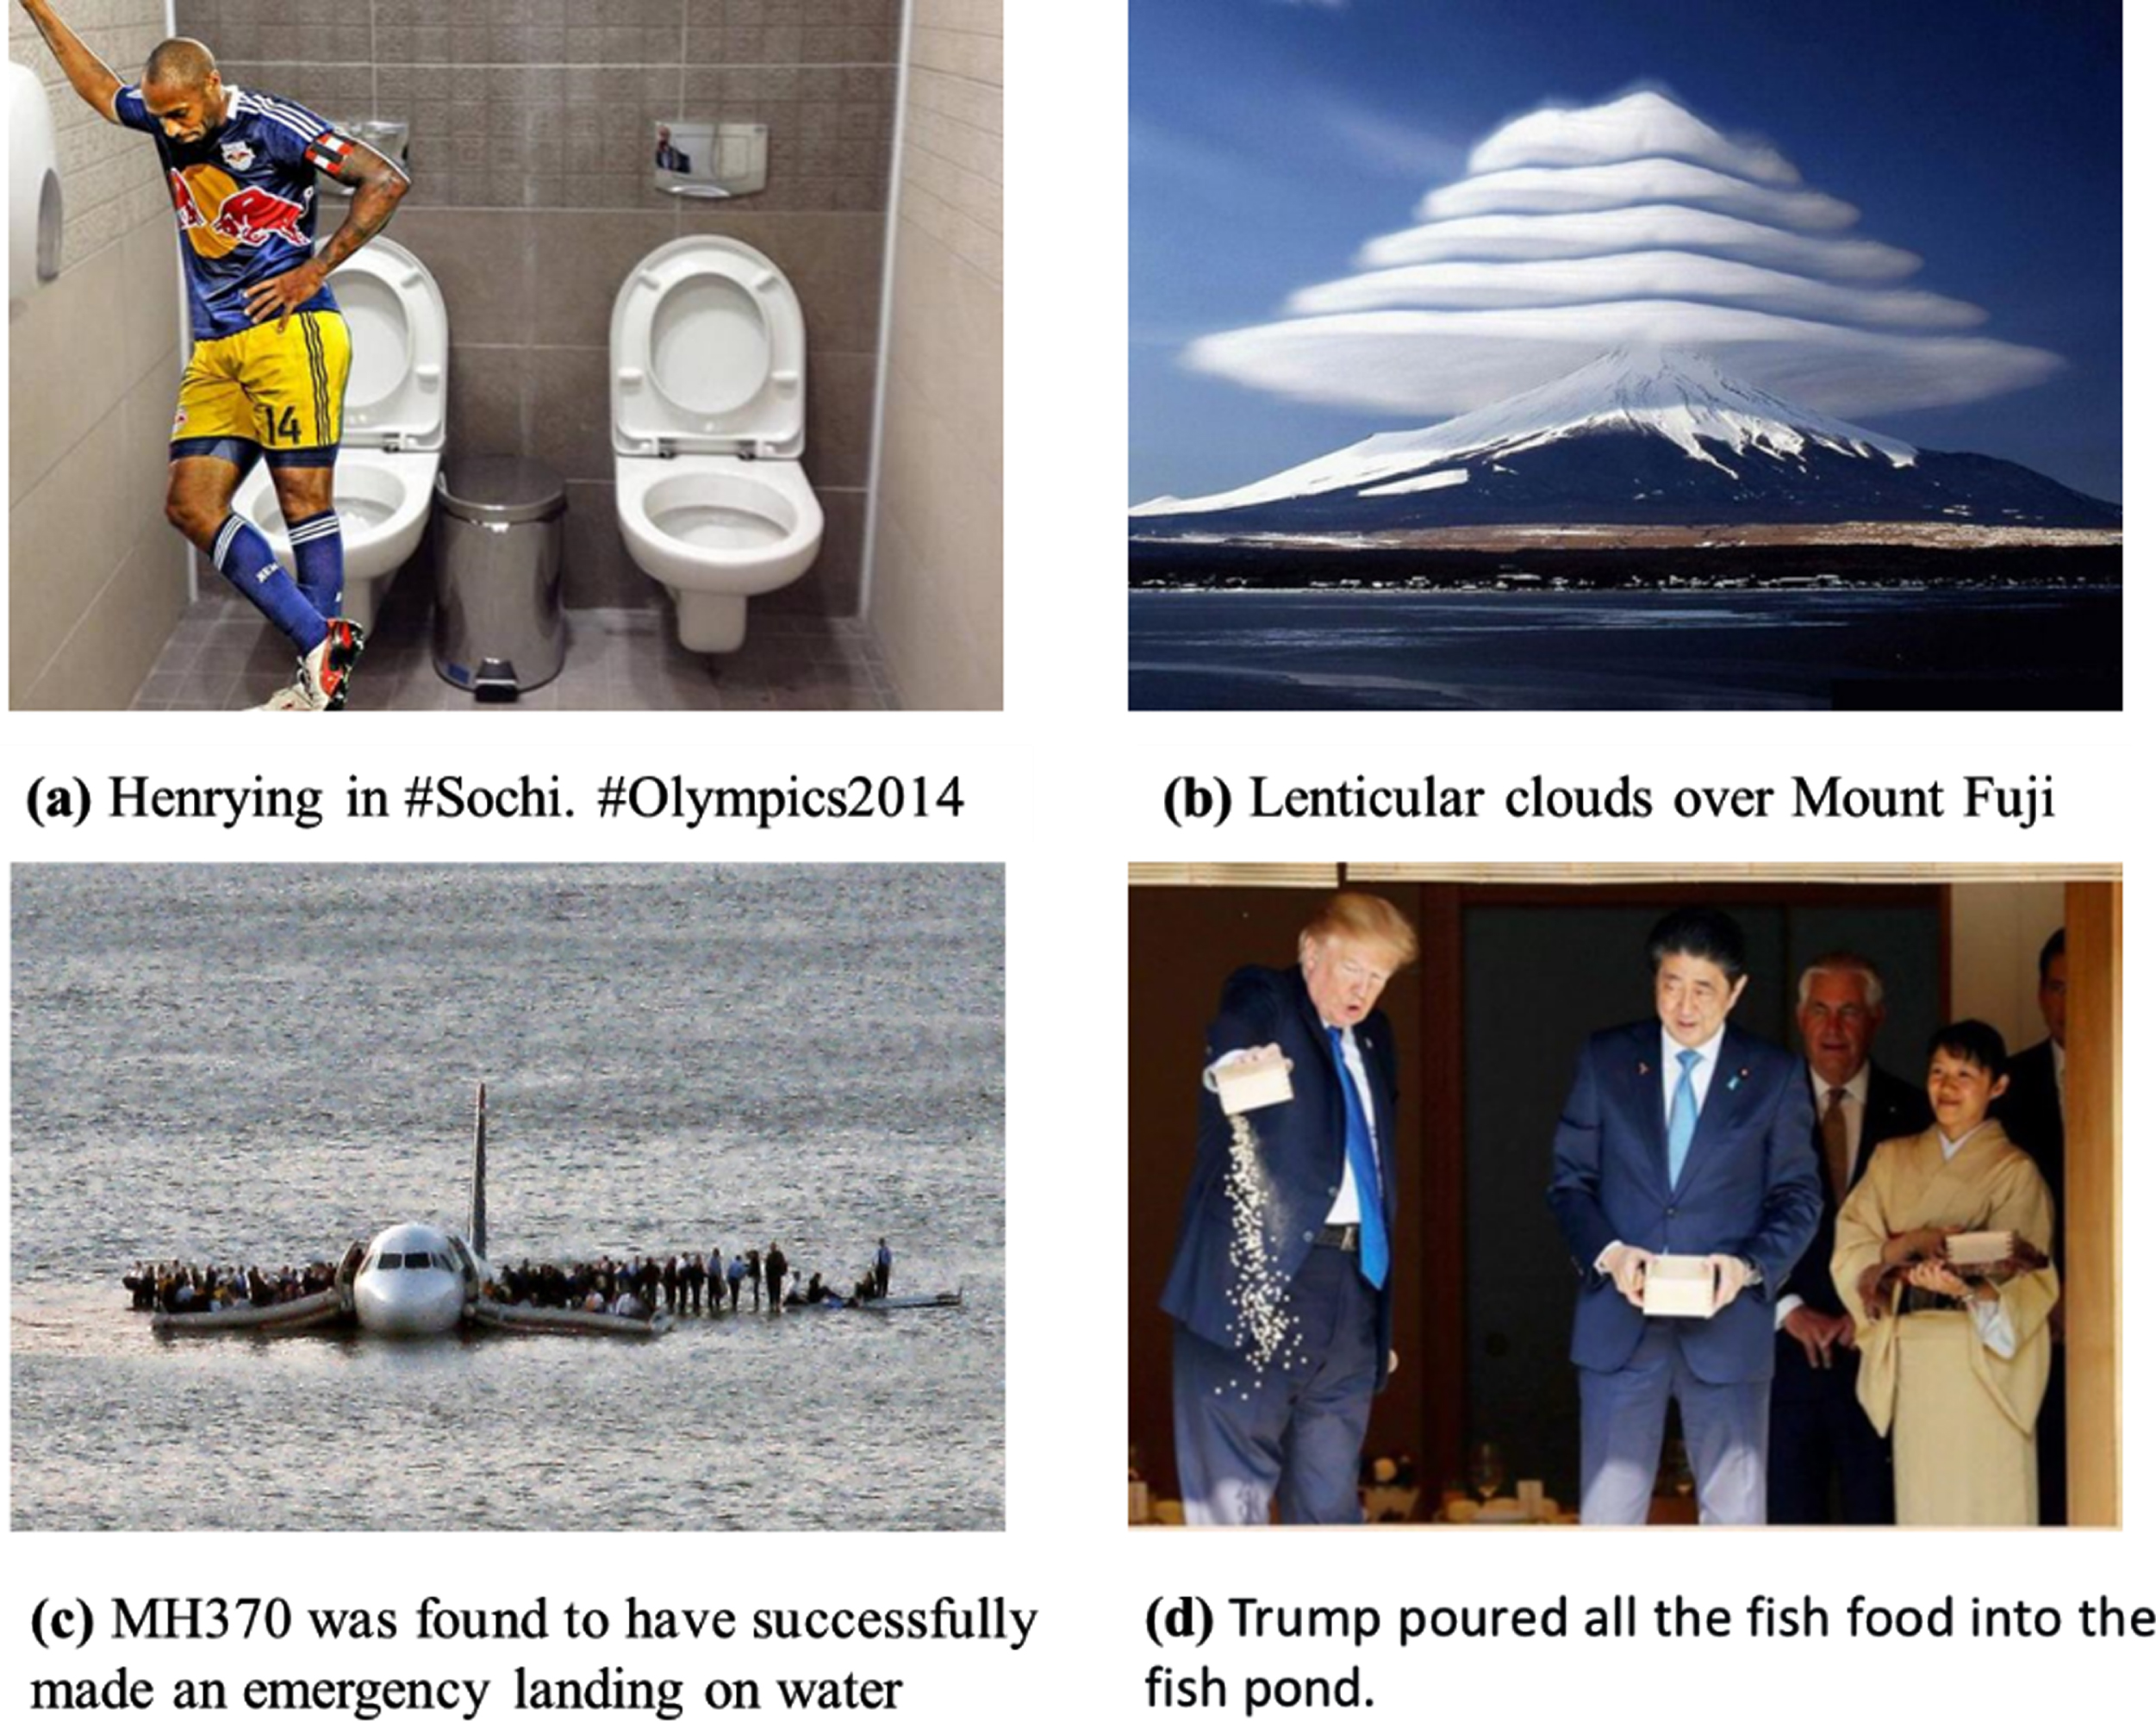
Some examples of fake news images. (a) and (b) are manipulated photographs in which (a) a picture of football star Henry is spliced into a hotel room to represent his participation in the Sochi Winter Olympics, and (b) depicts prismatic cloud formations on Japan’s Mount Fuji. (c) An image of the 2009 New York air crash was widely disseminated as Malaysia Airlines Flight 370, which crashed in 2014. (d) Trump’s feeding of the fish was misconstrued as dumping fish food, when in fact he was imitating Shinzo Abe by dumping the remaining fish food.
Recent studies have demonstrated the increasing importance of combining image data to detect fake news. According to previous studies, fake news images can be broadly classified as misleading images and manipulated images. Misleading images are those that are not related to the news text in terms of content or semantics, or those that are genuine and used without permission. Images that have been modified using image editing software are tampered. Copy-move and splicing are two common methods of image tampering operations. In Fig. 2, the first column is the original real image, the second column is a fake news image synthesized by copying and moving objects from the same photo or splicing them with objects from another photo, and the third column represents the manipulated area. Due to the quantized compression of the discrete cosine transform (DCT), misleading images, after downloaded and re-uploaded, typically leave more apparent compression artifacts than the real picture. The tampered images also leave manipulation traces. However, existing work gives little consideration to the detection of image tampering features and neglects to effectively model the spatial domain features and frequency domain features of images. For the exploitation of visual information, the majority of these approaches [5, 9] use pre-trained models, such as VGG19 [10], to extract higher-order semantic information in the spatial domain, while ignoring the effective modelling of tampered physical features of fake images, such as compression artifacts after splice forgery and copy-shift forgery features reflected in the frequency domain [11]. Moreover, traces of physical induced by image editing that are perceptible in the frequency domain are no longer discernible in the spatial domain (RGB domain) [12–14]. This necessitates a multimodal method that simultaneously models the RGB domain and the frequency domain to detect traces of delicate manipulation.
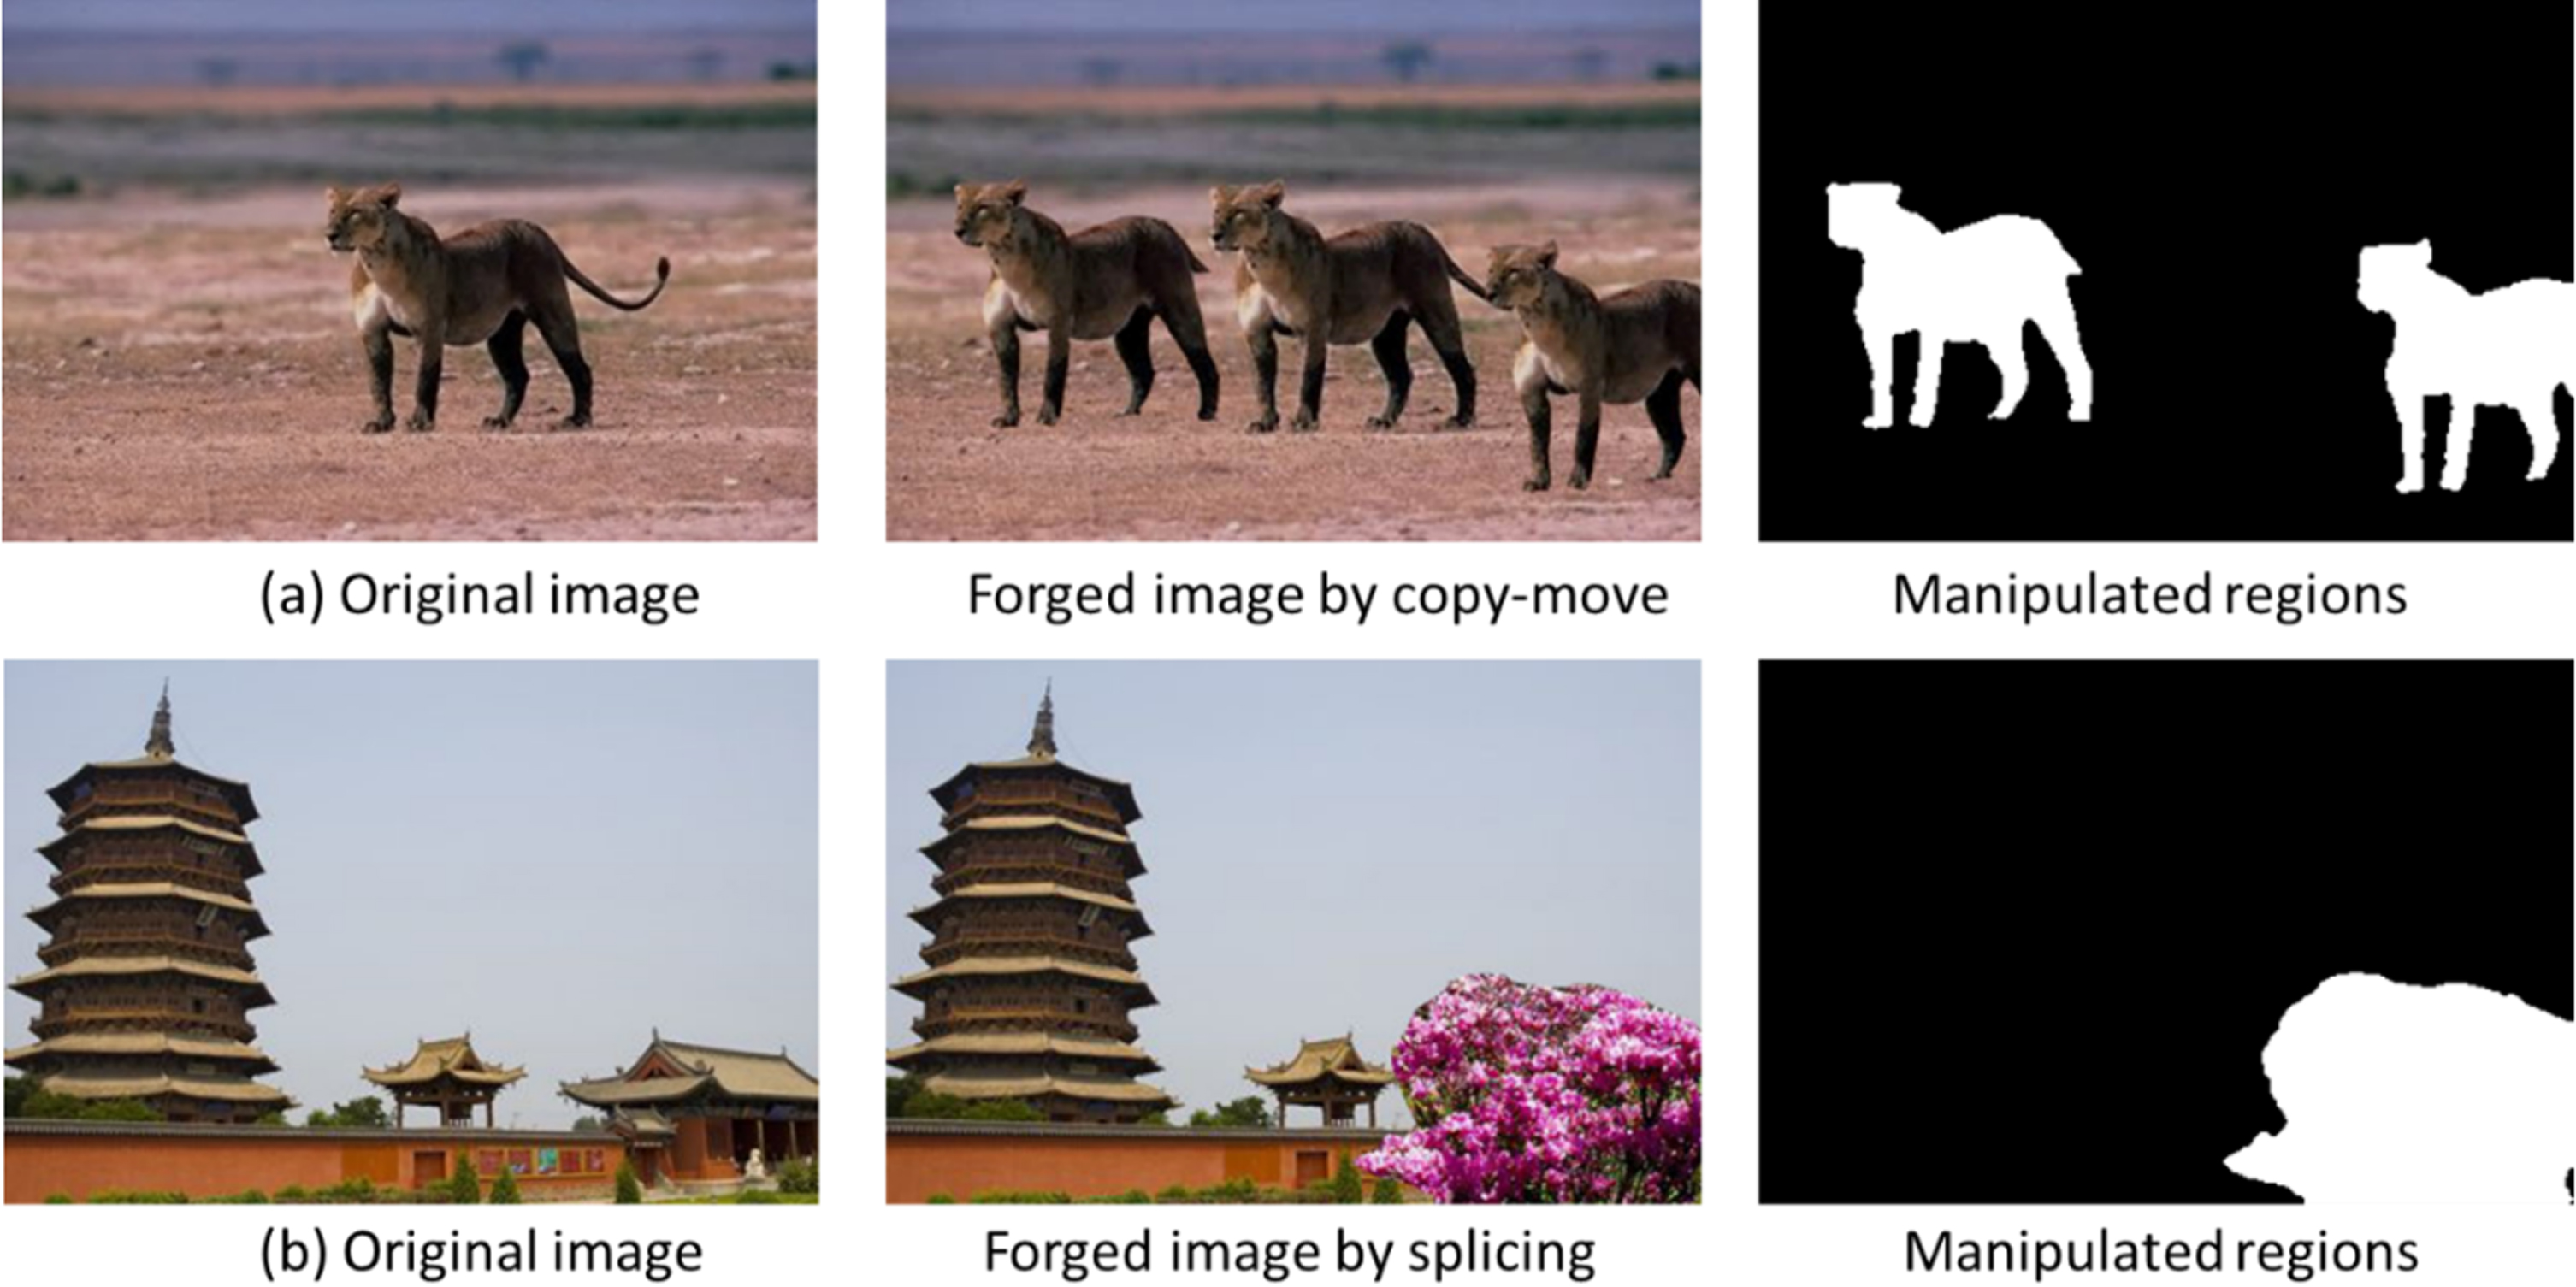
Examples of image copy-move and splicing.
In addition, the interactions and relationships between text and visual features (spatial domain and frequency domain features) have not been adequately investigated in prior research. Some models [8, 16] simply concatenate text features and visual features to obtain fusion features at a later point in the model, without mining the semantic complementarity of text and images, in particular, which can result in information loss. For example, [9] obtained a shared representation of text and visual information for classification by jointly training an encoder, decoder and classifier. [5] used an attention mechanism to merge the image fea-tures extracted by the pre-trained model into the joint features of text and social context fused by the LSTM for rumor detection. Consequently, the ability to effectively combine the textual and visual information of a post is the key to detecting false news. Typically, when evaluating the credibility of news, people first examine the images and then the text [17]. Images of news posts usually contain much visual content, without the guidance of textual information, it is difficult to grasp the key points of images at one time, and similarly, without the clues hidden in the images, news posts with incomplete text or ambiguous language are hard to follow. By repeatedly observing images and texts, people gradually deepen their understanding and eventually determine the truthfulness of the news. Intuitively, there is an interconnection between the semantic information of images and text, and the interaction and fusion between different modal data contributes to multimodal fake news detection.
To address these constraints, we introduce MFCAN, a framework for multi-modal fake news detection. MFCAN uses a dual stream architecture, with the textual stream extracting features of the text content and the visual stream divided into two branches, where the spatial domain branch captures representation of original images. The frequency-aware branch employs base filters and learnable filters to discover forged features in the frequency domain.
We also develop a cross-modal fusion module to efficiently fuse information from multiple modalities in an interactive manner. First, we fuse frequency-aware branch features with spatial domain branch features to produce visual stream features, and then we merge text features with visual stream features to generate combined features. The integrated features are finally fed into a fully connected classifier to get prediction results.
The following are brief summary of the key findings from this study: We present a new end-to-end multimodal method for detecting fake news that explores the inherent features of fake news images at both semantic and physical levels from the spatial and frequency domains respectively. The proposed MFCAN exploits a well-designed attention fusion network to gradually fuse textual and visual features, which can learn the saliency representations of fake news from intra-dependencies and relationship of intra- and inter-modality effectively. Our proposed generic architecture for detecting fake news is feasible and flexible in engineer-ing practice. The MFCAN can be realized in engineering by the idea of modular design in software engineering. Each component of the MFCAN framework can be developed and tested as an independent module, and each module can be connected through interfaces to finally realize the overall function of MFCAN. In addtion, we can choose a flexible method for each module according to the scale of the project, the condition of the hardware and so on. The Resnet50 network for extracting visual semantic features in this paper can be replaced by other classical models (Inception, ResNeXt, etc.), or lightweight models (MobileNet, SqueezeNet, etc.), or by ViT and its various variants. Bert can also be substituted in the project by other word vector-based methods (word2vec, LSTM, etc.) or pre-training methods (XLNet, BART, etc.). Experimental results on two public benchmark datasets show that our approach outperforms the best baseline. The visual representation of the frequency domain learned by the model provides additional complementary information for fake news detection, and the cross-modal fusion module helps to improve the overall detection performance.
The remaining sections of this article are organized as follows. In Section 2, we provide an overview of previous research findings regarding the detection of false news. Section 3 defines the issue. Section 4 provides a comprehensive description of the proposed model. Section 5 provides the dataset, benchmarks, and experimental results. The study is summarised in Section 6.
False news can refer to a variety of misinformation and disinformation [18], such as biassed news, imposter content, manipulated content, and satire. However, a general definition of fake news has yet to be established [19]. Similar to prior research [20, 21], we define fake news as “deliberately and verifiably false news articles”. On the basis of the differences between the models, we can generally classify existing fake news detection models as either unimodal or multimodal.
Single-modal fake news detection
Unimodal analysis concentrates on extracting textual features from the content (textual or visual information) or social context of a post. Various studies have extracted content features from different perspectives, including statistical features such as the percentage of negatives [22, 23], the number of paragraphs in the text [24], etc.; the number of verbs and nouns, the number of emotional and casual phrases [25], lexical and syntactic features [26–30], and other writing styles. However, these features are manually designed and are not flexible or generalisable, so in order to automatically extract high-level features, deep learning models such as LSTM+CNN [31], GNN [32],GAN [33] have been proposed. Social context-based research investigates the social connections between users and tweets, such as user profiles and the characteristics of news diffusion. [34] utilises user profiles along the news dissemination path to determine the authenticity of news. Some other work [35–37] build the heterogeneous credibility networks to model the propagation patterns.
Multimodal fake news detection
The rapid growth of fake news posts consisting of multimedia content has prompted a shift towards multimodality in the analysis of fake news. Some early investigations employed statistical image features as complementary features, such as the image type [6], number of images [38, 39] and the popularity of the image. However, these statistical features just learn simple patterns which are not sufficient to capture the nuanced differences between real and fake news images.
Recent work has attempted to introduce pre-trained models, such as BERT [40], VGG19, to extract high-level semantic features of text or vision, and to uncover connections between text and visual features through attentional mechanisms. Specifically, [8] learns distinguishable representations for identifying fake news, while event classification is introduced as a supplementary task for learning common features that are invariant to events. Variational autoencoders are employed in [9] to learn visual and textual correlations in order to obtain their shared representations and feed them into a classifier to detect fake news. Without relying on any subtasks, [41] utilised pre-trained BERT and VGG19 models to learn textual and visual features respectively and feed them in concatenation into a classifier for prediction. [15] applied a neural network to extract multimodal textual and visual features separately and used cross-modal correlations between them to identify fake news. [5] employed an attention mechanism to fuse visual features into the joint features of text and social context for fusion classification. [42] supplemented the semantic representation of text with conceptual knowledge retrieved from knowledge graphs and learned event invariant features to jointly improve rumour detection. However, these methods primarily consider the semantic features of images in the spatial domain and do not adequately investigate the correlation between multimodal features.
Frequency domain learning
Frequency analysis is a powerful tool in the field of image processing and digital signal processing and has been l widely used. In recent years, several studies of frequency analysis have been introduced in the field of deep learning, such as image classification [43], super-resolution [44] and detection of falsified regions [45]. Some studies have attempted to use frequency cues for forgery detection. [46] uses deep convolutional networks to learn frequency-domain image features, demonstrating the generalisability and effectiveness of frequency-domain features for classification, detection, and separation tasks. [47] uses CNNs to learn the difference between the histogram of discrete cosine transform coefficients in the tampered region (single compressed region) and the untampered region (double compressed region) for dual JPEG compression detection and forgery localisation. [48] investigates aligned and unaligned double JPEG detection in the pixel and frequency domains, which embeds the computation of the DCT coefficient histograms into the CNN structure and uses two-dimensional convolution in the CNN to capture possible correlations between the DCT coefficient histograms. [49] utilises histogram features as input to a CNN network, while merging quantization table vectors in the fully connected layer of the CNN network to improve the network’s ability to distinguish between single or double JPEG blocks.
Problem formulation
The detection of fake news can be classifiedinto post level (identifying individual posts as fake/true news) [5, 9] and event level (identifying news posts contained in events as fake/true) [33, 42]. This study followed the former. The text and image of a news article P = (T, I) are denoted by T and I, respectively, and t ∈ R d and v ∈ R d represent the corresponding representations, where t = F t (T, θ t ) and v = F v (V, θ v ) , θ* are the parameters to be learned. Our research aims to use the text and image features of a post and their relationship to infer the veracity of P, that is F p : (t, v, θ t , θ i ) → y ∈ (0, 1).
Methodology
Model overview
An overview of the MFCAN framework is presented in Fig. 3. It consists of five modules, which are (1) the text feature extractor (Sec. 4.2). (2) the visual semantic feature extractor (Sec. 4.3). (3) the frequency-aware tamper feature extractor (Sec. 4.4). (4) the cross-modality fusion module (Sec. 4.5). (5) the fake news detector (Sec. 4.6). The BERT model generates the text embedding vector, and the image is fed to two distinct branches for feature extraction. In the first branch, the image is directly fed into the pre-trained model ResNet50 to extract spatial region features, whereas in the second branch, the image is fed into the frequency-aware tamper feature extractor for transformation in order to extract frequency-aware features. Then a cross-modality attention fusion network consisting of two Modality Fusion Block is used to fuse features of different modalities hierarchically. The proposed Modality Fusion Block explores intra- and inter-modal relationships and generates fused representations across modalities.
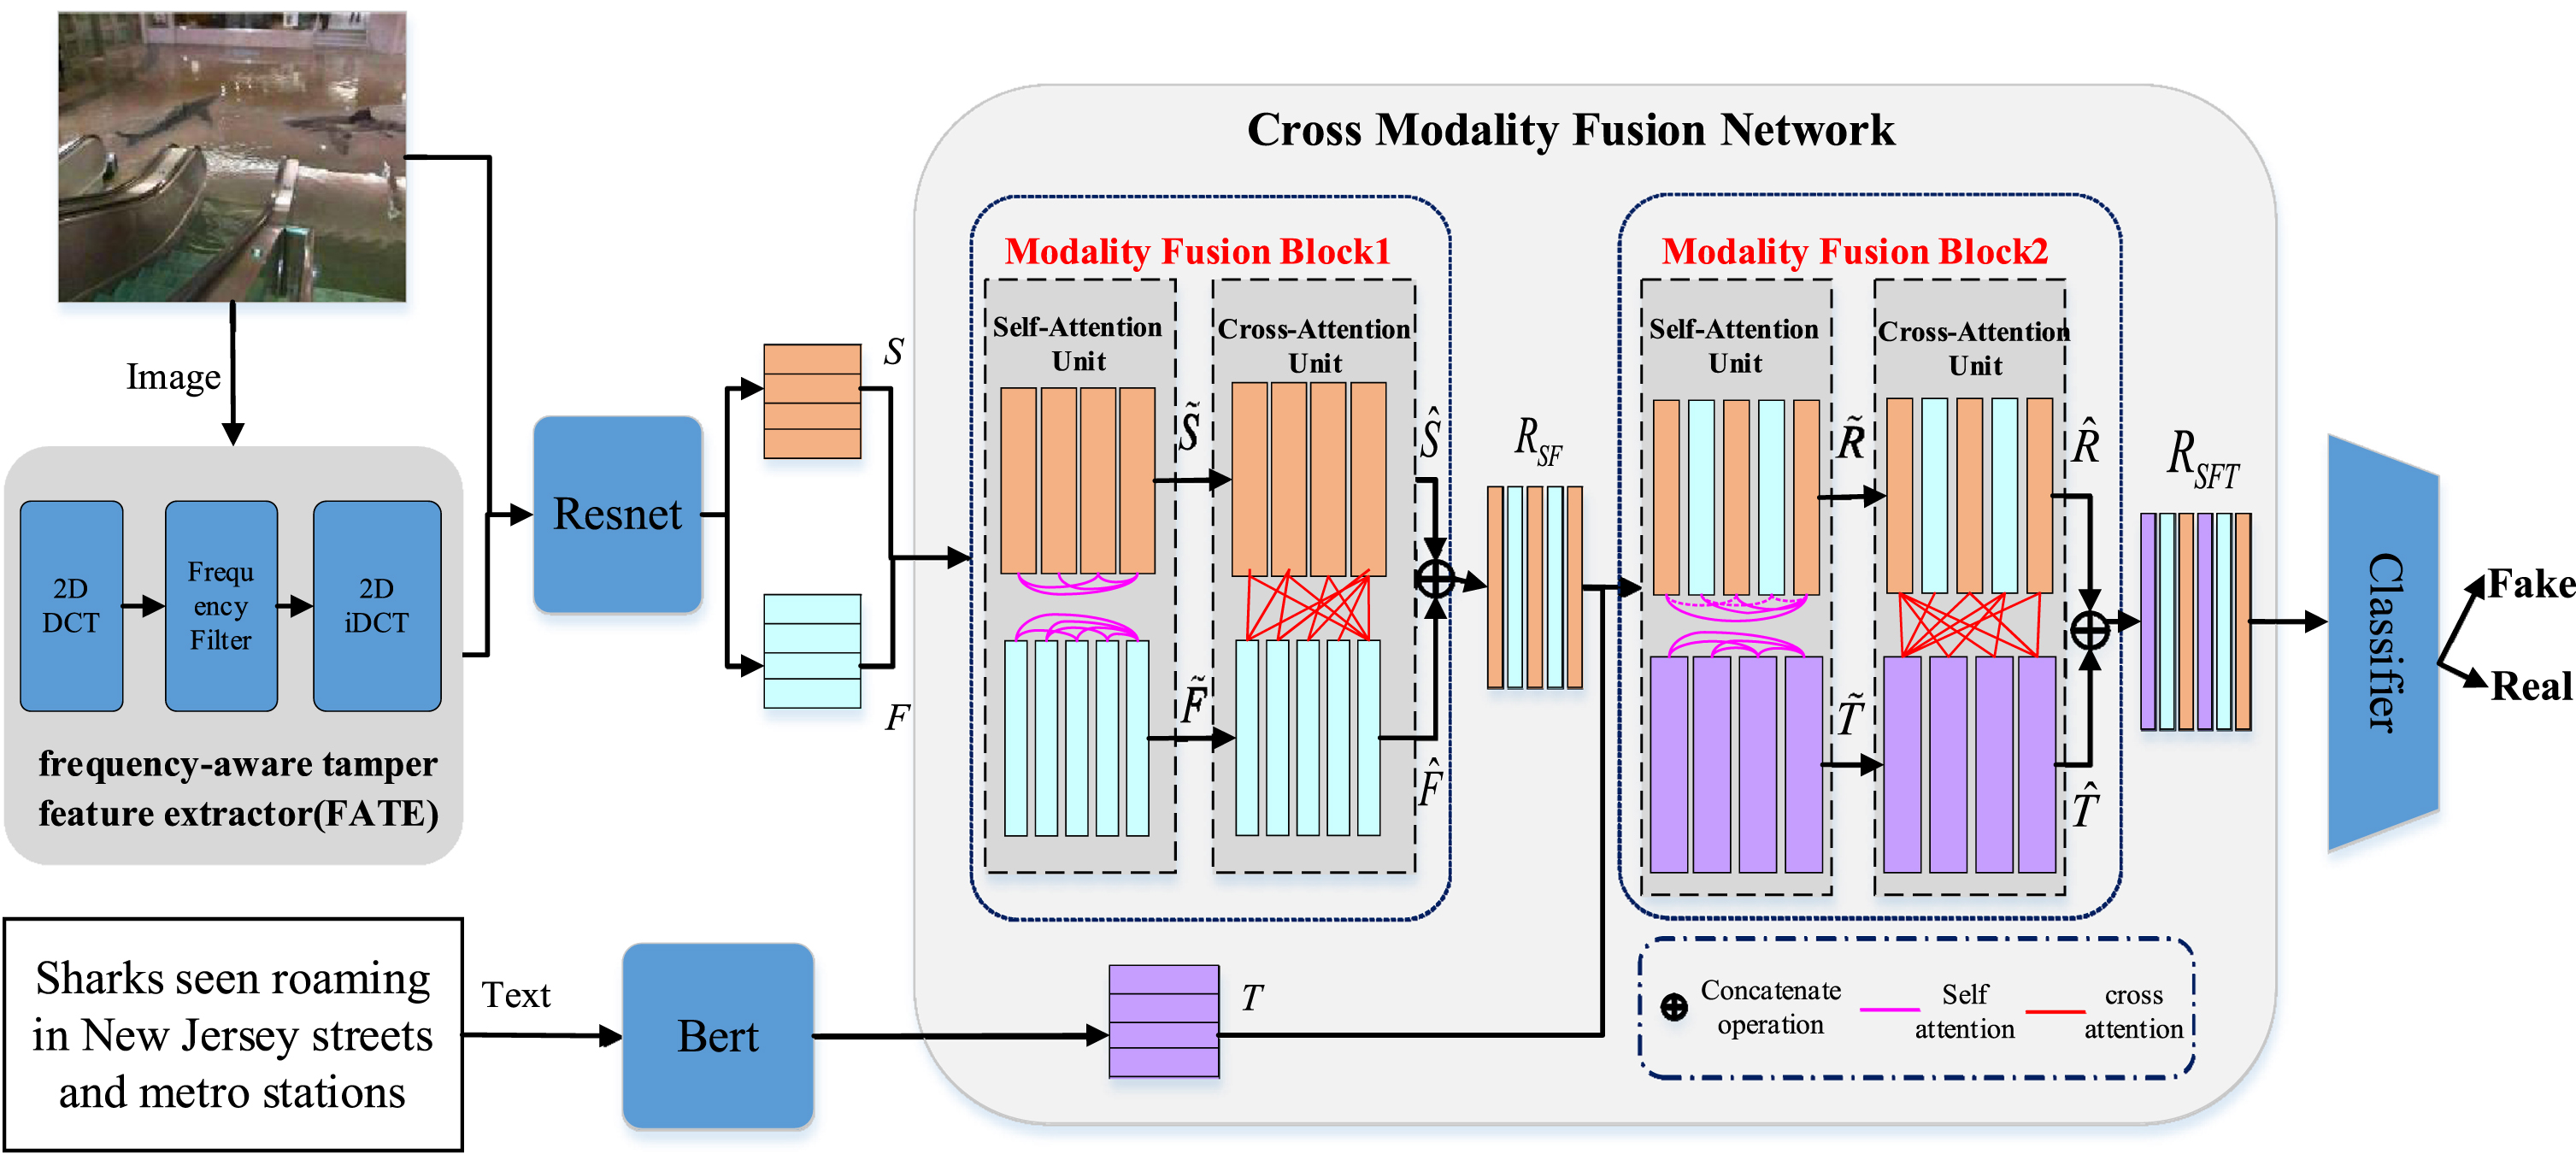
Illustration of the Multi-Modality Frequency-aware Cross-attention Network (MFCAN) architecture.
Pre-trained on a large corpus, the BERT [40] model is capable of capturing the interrelationships between words in a sentence and the semantic importance of each word in order to generate feature representations with underlying semantic and contextual information. The BERT model has demonstrated powerful performance in a variety of natural language processing tasks, including text classification [50, 51].
For a news text W ={ w1, w2, …, w
n
} consisting of a sequence of n words, which are first mapped to the corresponding index by a BERT predefined vocabulary [40], and then processed by BERT to generate a sequence representation T ={ t1, t2, …, t
m
} of W. t
i
corresponding to the transformed feature of w
i
. The text lengths of all news are uniformly padded or truncated to the same length m. The above process is shown in Equation 1:
According to research [11], in the spatial domain (the RGB domain), fake news images exhibit some distinct characteristics compared to real news images, such as being visually impactful and emotionally provocative. These features have been associated with a variety of low-level to high-level visual factors [21]. Thus, we apply the ResNet50 [52] network, as depicted in Fig. 3, to fully capture the visual features of different semantic levels of the spatial domain. The last classification layer of original ResNet50 is replaced by a fully connected d-dimensional layer with RELU activation function which generates a u × d
s
dimensional feature as the final visual representation of spatial domain for the input image, the process is shown in Equation 2:
Compared to real news images, fake news images are usually uploaded and downloaded multiple times on social media platforms, and have more severe recompression artifacts, such as the block effect. In addition, some fake news images inevitably have traces of manipulation, such as splicing or copy-move. [53–55] demonstrate that artifacts of fake photos cannot be detected in the spatial domain due to perturbations such as JPEG compression, but they can be detected in the frequency domain. On this basis, we extract features from the frequency domain to provide additional clues for detecting fake news.
We present a novel frequency-aware tamper feature extractor (FATE) that uses a learnable frequency filter to perform adaptive segmentation of the input image in the frequency domain, which as seen in Fig. 3. Frequency-aware visual components are produced by inverting the decomposed frequency components to the spatial domain. After this, ResNet50 is employed to mine forgery patterns. D indicates the application of the Discrete Cosine Transform (DCT). D-1 indicates the application of the Inversed Discrete Cosine Transform (IDCT).
DCT is widely applied in image processing, such as JPEG and H.264 compression algorithms [56]. The DCT transform of an image can be expressed as follows.
Where F is the d × d image patch. And A is determined by the DCT transformation matrix:
Specifically, taking the image I as input, we start with some pre-processing, such as the standard transformation, resize, cropping as described in [57]. The DCT then transforms the spatial domain image to the frequency domain along the spatial dimension:
Process of extracting salient frequency features using the proposed frequency-aware tamper feature extractor (FATE).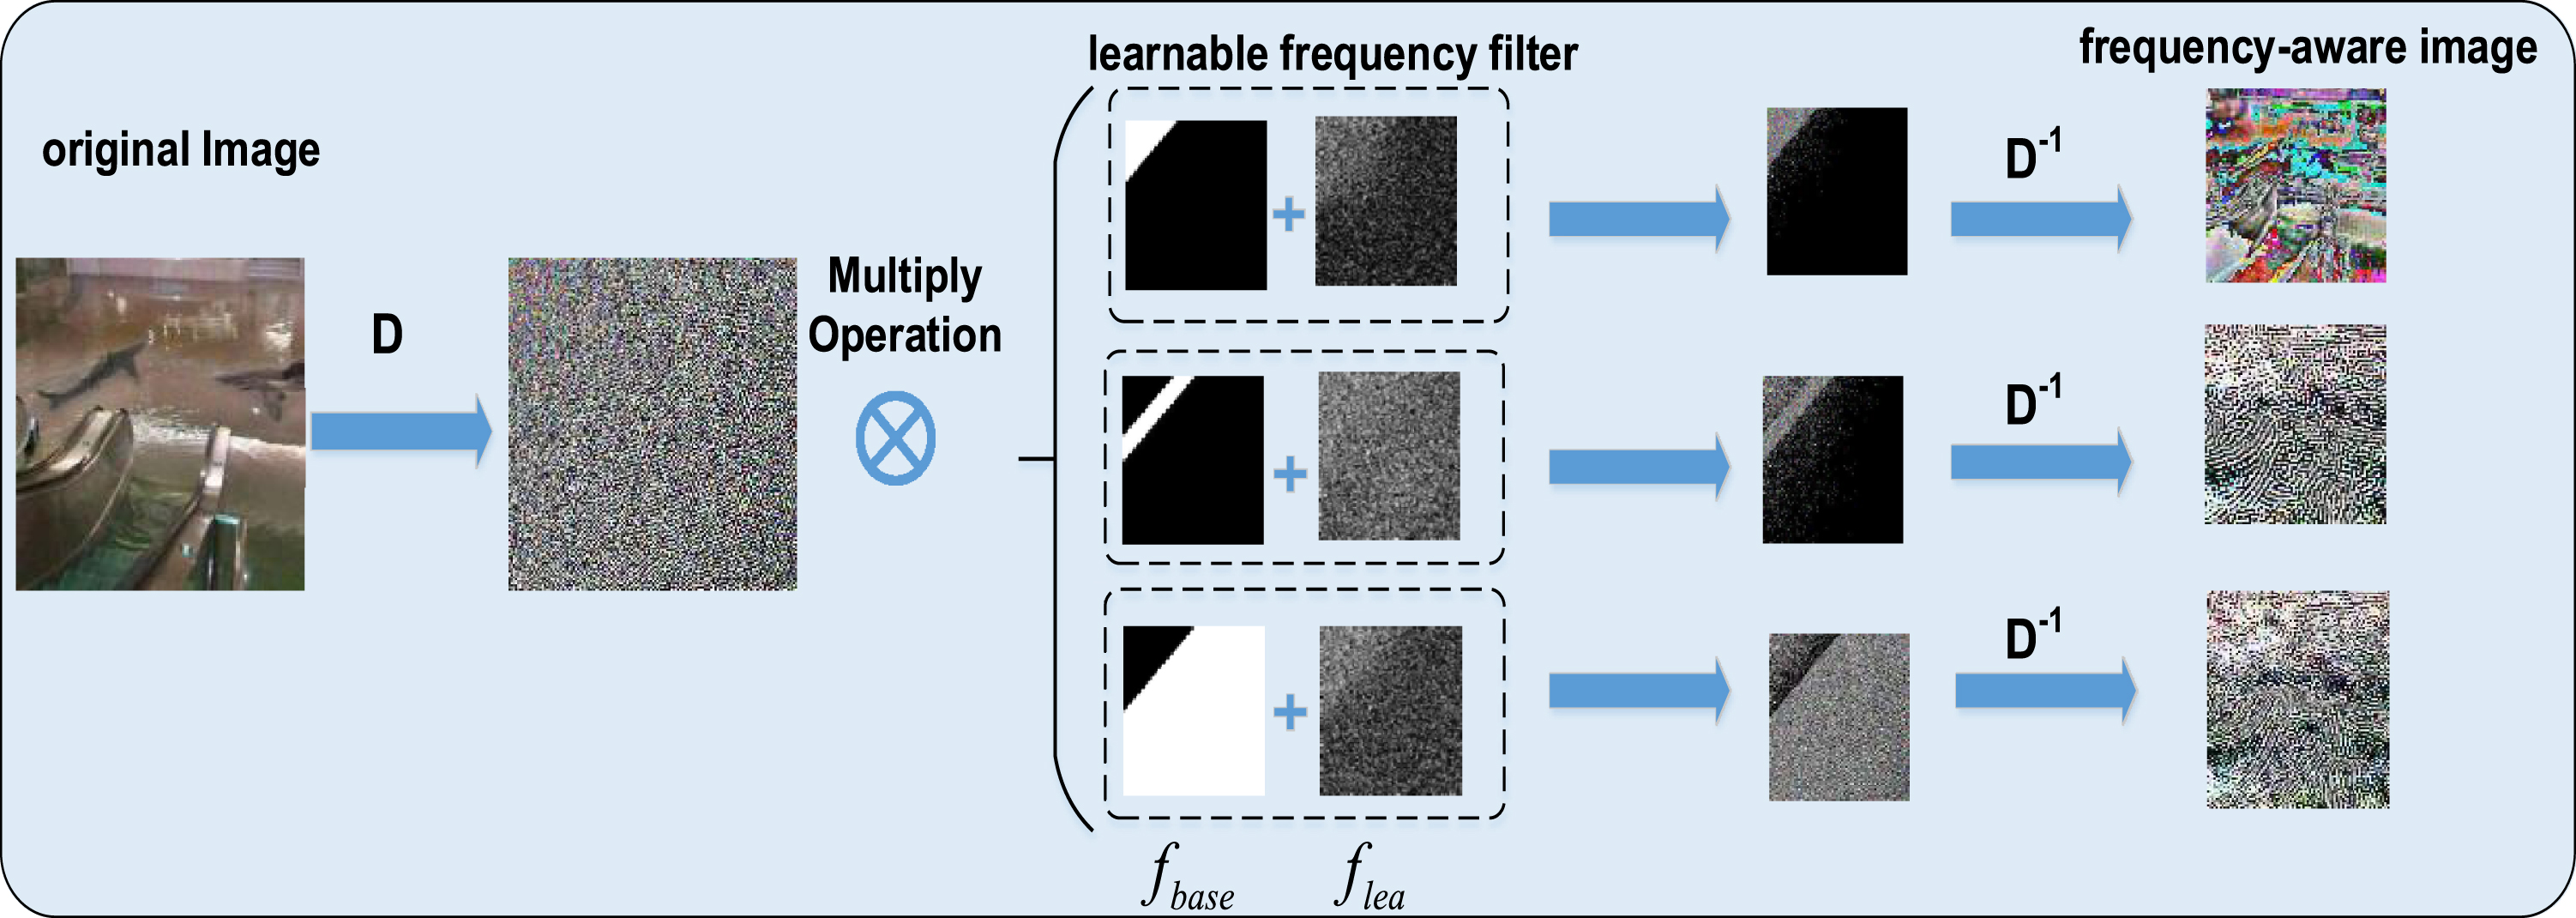
where
The frequency region features obtained are denoted as
In this section, we proposed applying a cross-modality fusion network on visual features and textual features (S, F, T) to capture the relationship of inter-modality and intra-modality in a post. As shown in Fig. 3, the cross-modality fusion network consists of two blocks (Modality Fusion Block1 and Modality Fusion Block2), Modality Fusion Block1(MFB1) is utilized to fuse two visual modalities information (spatial and frequency), Modality Fusion Block2(MFB2) focuses on blending the representation of visual and textual modalities.
Inspired by the self-attention mechanism in transformer structures [58], we use the query-key-value mechanism to design the Modality Fusion Block, which consists of two types of attention unit: Self-Attention Unit and Cross-Attention Unit.
The Self-Attention Unit (SAU) and Cross-Attention Unit (CAU) are based on a multi-headed attention mechanism, which is depicted in detail in Fig. 5. We propose the Self-Attention Unit (SAU) to model such within-modality relationships which have been shown to be effective in object detection [59], image captioning and word embedding pre training of BERT. SAU take data from same modalities as input, which capture the importance between visual regions and between textual words.
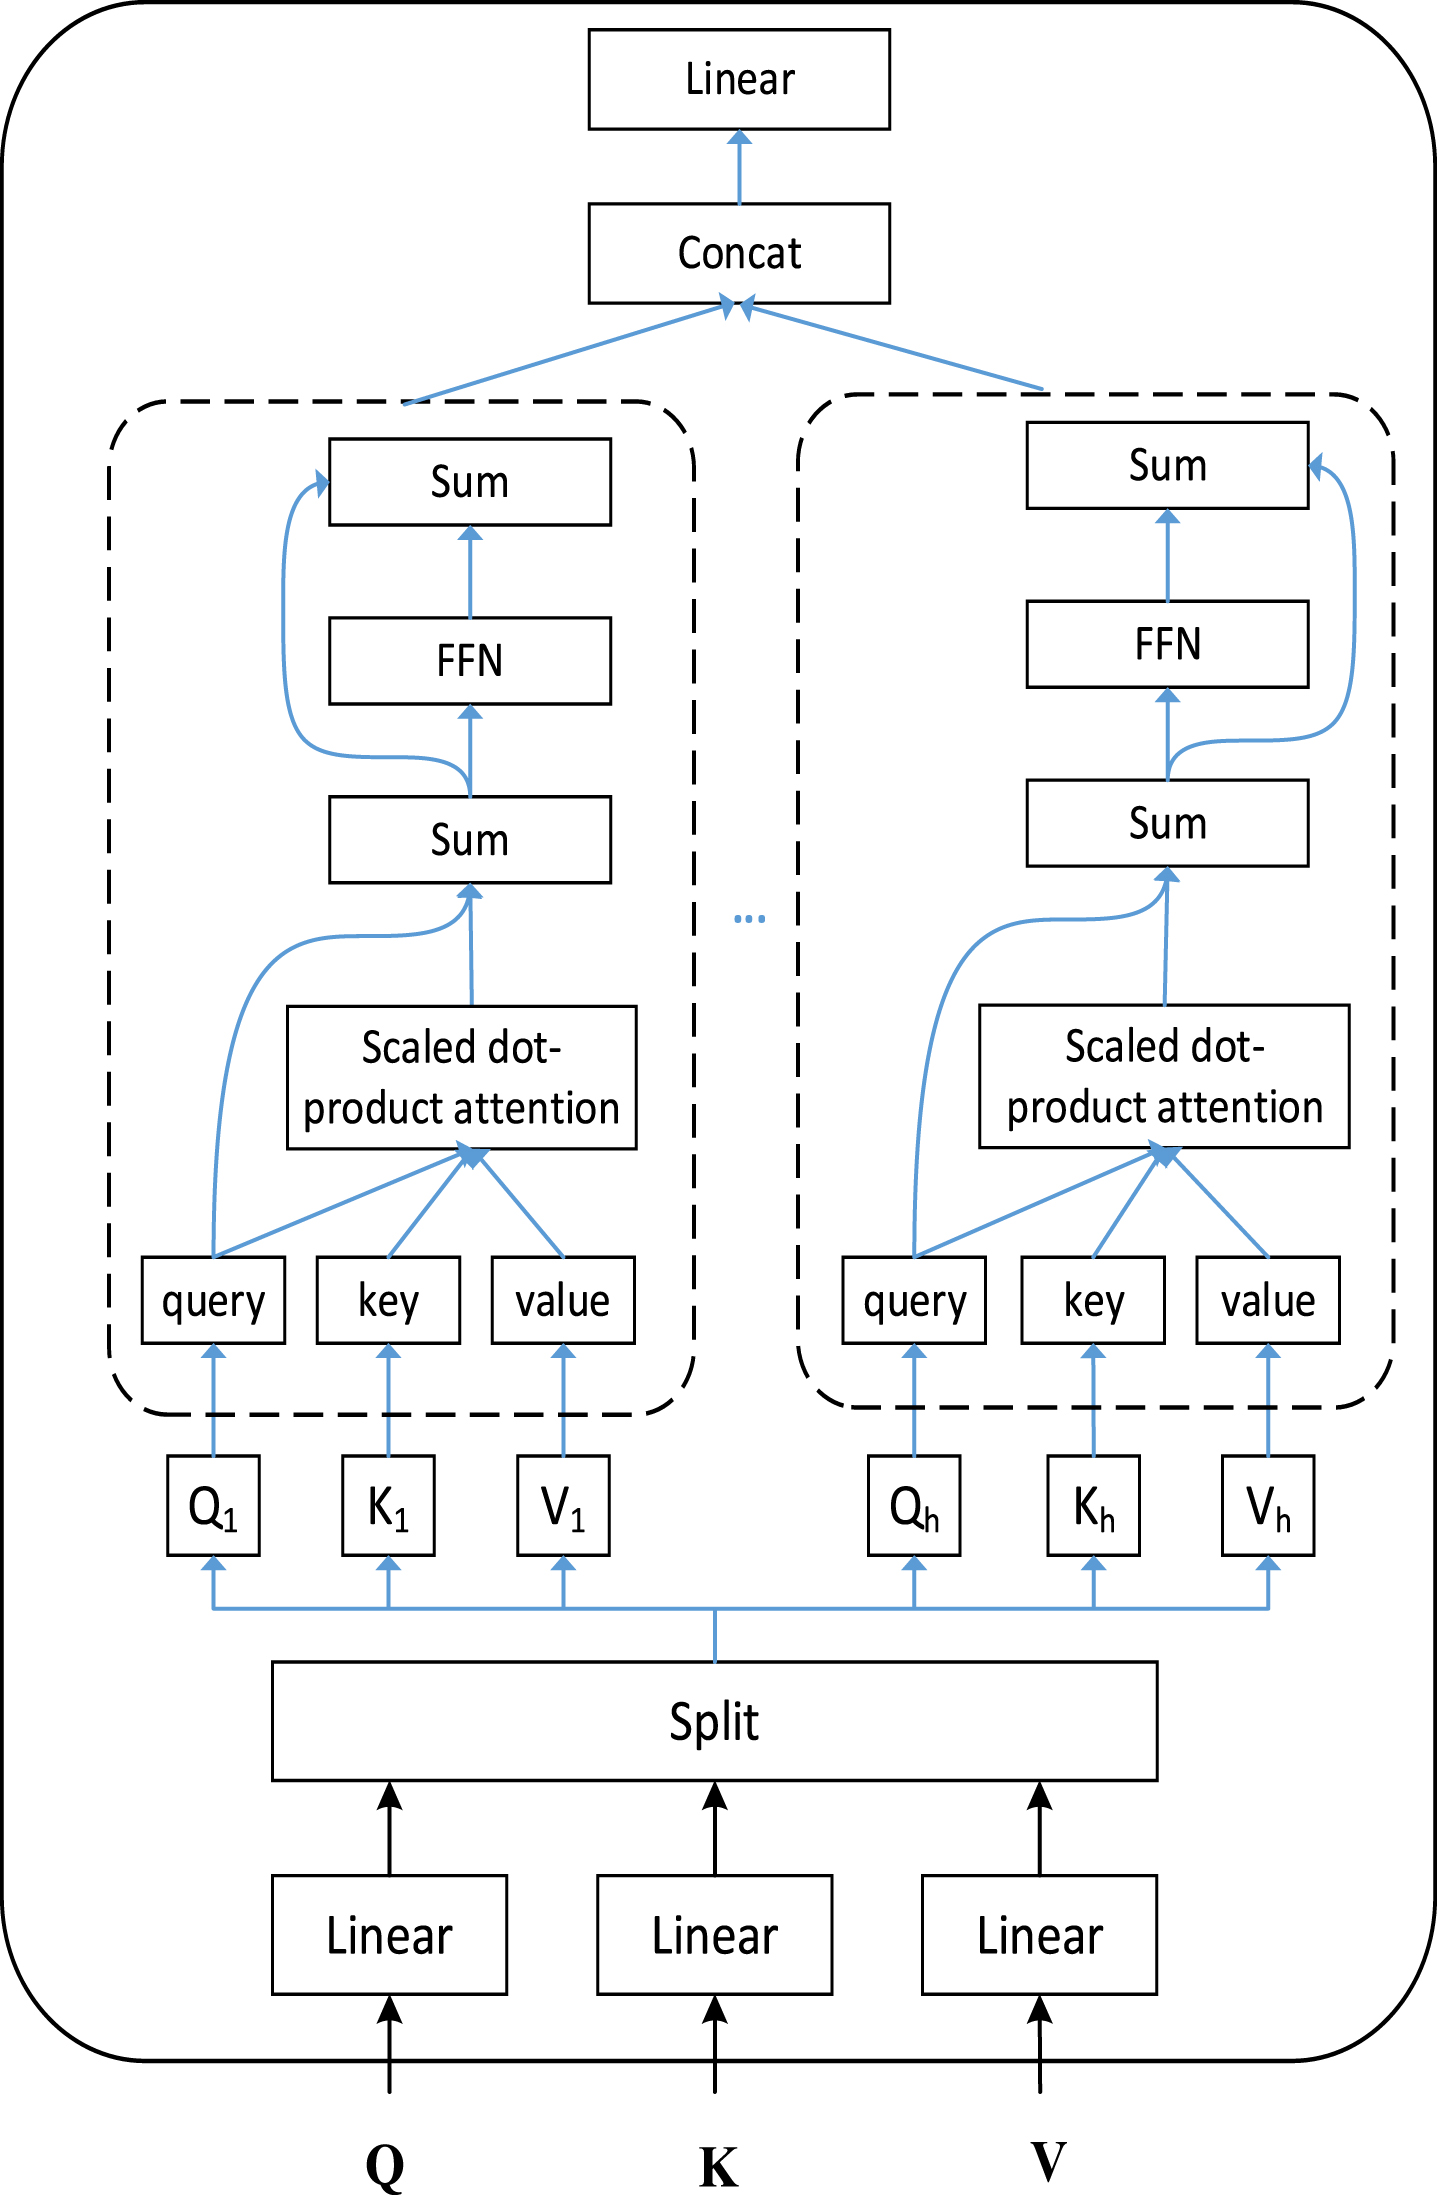
Illustration of the multi-headed attention mechanism.
The Cross-Attention Unit (CAU) first learns to capture the importance between two modality features. It then aggregates and updates one modality features through information flows passed from another modality according to the learned importance weights. Such a process of information flow is able to identify cross-modal relations.
Taking Modality Fusion Block1(MFB1) as an example, the inputs are spatial region features S and frequency tamper features F, respectively. First, Self-Attention Unit (SAU) is utilized to learn the representation of intra-modality. Specifically, we compute the query, key, and value by using different learnable linear projections of the input, where the transformed spatial visual features are denoted as The scaled dot-product attention.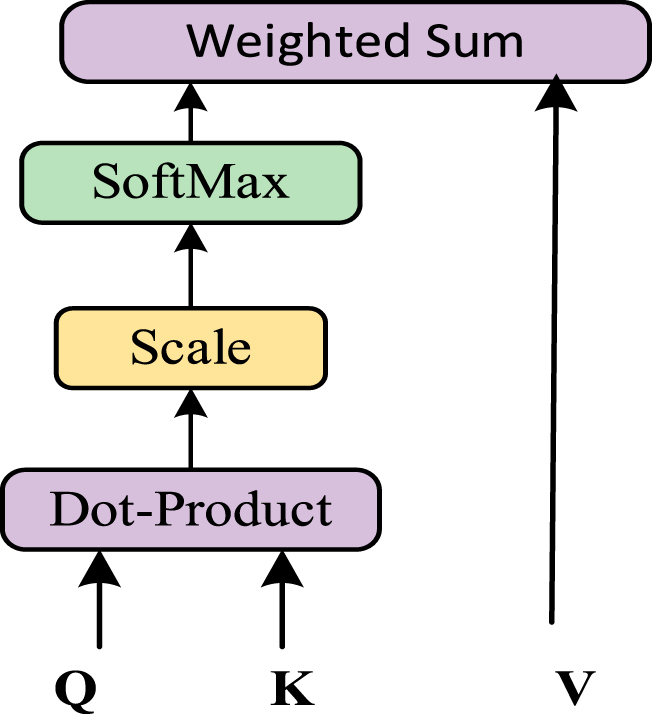
FC indicates a full-connected layer and layer_norm denotes the layer normalization. As shown in Fig. 3,
The spatial and frequency visual representation obtained from SAU are learned independently without considering each other. Therefore, the output features by the SAU would then be fed into the following CAU to further update spatial and frequency visual features.
Similarly to the way of SAU, we first get the transformed spatial visual features
Each row of
The process of updating spatial visual features and frequency visual features could be denoted as:
Finally,
Next, we utilize Modality Fusion Block2 (MFB2) to fuse the obtained frequency-aware visual features R SF and textual features T. Note that MFB2 and MFB1 have the same structure but do not share weights.
Specifically, we first perform a linear transformation on R
SF
and T, respectively. The transformed frequency-aware visual features and textual features are denoted as:
Next, we can acquire the affinity (or weight) matrix
Affinity (or weight) matrix
Furthermore, based on Rupdateand Tupdate, the final representation of the frequency-aware visual features and textual features can be updated hrough residuals, fully connected layers and layer normalisation operations.
As shown in Fig. 3,
We first obtain the transformed features
Each row of
Then, we obtain the final visual representation
Finally, we concatenate
With the previous four components, we obtained the final features R
SFT
of multimodal news, which incorporates cross-modal textual, visual spatial domain and frequency domain features. Our aim is to map the textual and visual features of news to their labels to determine whether they are fake news. A fake news detector consisting of a fully connected layer with an activation function implements the correspondence between features and labels.
In this section, we conduct experiments on two widely used datasets to evaluate the effectiveness of the proposed MFCAN. We initially describe the information of two social media datasets and provide an introduction about model settings and some baseline approaches for detecting fake news. Then we make comparisons between the MFCAN and baseline methods on two datasets and bring a detailed analysis for the ablation study. Finally, we investigated some typical cases to demonstrate the importance of multi-modal fake news detection.
Datasets
We conduct experiments on both the English (Twitter) and Chinese (Weibo) datasets to fairly evaluate the performance of the proposed model. D1[60]: Twitter dataset. As part of the MediaEval task, the Twitter dataset was used in a competition for the detection of fake content on Twitter. each post in the Twitter dataset contains textual content, relevant images/videos, and additional social contextual information. The original dataset was organised into two parts: a development set and a test set. We maintain the same data segmentation scheme as the benchmark, using the development set to train the model for feature learning and the test set for optimising parameters and testing. We only use the text and image information of the posts to match the research objectives of this paper. D2 [5]: Weibo dataset. It consists of textual content, user profiles and attached images. The real news on the Weibo dataset is collected from authoritative news sources in China, such as Xinhua News Agency. Fake news was sourced from data from the official fake news uncovering system of Sina Weibo from May 2012 to January 2016. With reference to previous studies, we first pre-processed the dataset to remove duplicate images and low-quality images to ensure the quality of the whole dataset. The entire dataset was then divided into training and test sets as in [9, 61].
Experimental setup
In this section, we present the implementation details of MFCAN. For the textual feature extractor, we utilize the pre-trained multilingual cased BERT to extract textual features on Twitter datasets, for the Weibo dataset, we use Chinese BERT-based model. After padding and truncation, the maximum length of the news text is 30 on the Twitter dataset and 200 on the Weibo dataset, and the dimensionality of the text embedding is 768. For the visual semantic feature extractor, all images are resized to 224×224×3, we use the output of the penultimate layer of the ResNet50 [54] pre-trained on ImageNet [62], and the dimension of visual vector is 2048, which is then reduced to a size of 768 by means of two fully connected layers.
The frequency-aware tamper feature extractor uses the same ResNet50 network as the forged feature extraction module. The weights of BERT and ResNet50 are frozen during the training phase on Twitter dataset due to over-fitting, whereas not on Weibo dataset.
In the cross-modality fusion module, for Self-Attention-Unit and Cross-Attention-Unit, the number of multi-heads is set to 12 and 8 on the Twitter and Weibo datasets respectively. The dimension of out feature is the same as input, here is 768. The fake news classifier consists of two fully connected layers of sizes 1536 and 512 respectively.
The dataset is divided into training, validation and test sets according to the ratio of 7:1:2. In the ablation analysis, we retrain them after removing some of the branching networks. To obtain a reliable result, we run each experiment for 5 times and report the performance of highest accuracy.
The initial learning rate of the Adam [64] optimizer is adjusted from 1e-6 to 1e-2 by grid search. The number of heads in the cross-attention unit is adjusted in 4,8,12,16. To prevent overfitting, we use L2-regularizer on the weights of our model. We experiment with a weight penalty of 0, 0.02,0.05, 0.1, 0.2. For the batch size of the dataset, we try 16,32,64,128. We search through the grid, adjust the hyperparameters based on the accuracy on the validation set, and evaluate the results on the test set. Finally, we train the model 100 epochs with a patience of 5, and the batch size is set as 32. Early stopping is also used to avoid overfitting. In each fully connected layer of the model except the final output layer, we applied the ReLU activation function and dropout technique with a dropout probability of 0.2. The learning rate of Adam is set as 1e-4 and a momentum of 0.9.
The statistics of the datasets
The statistics of the datasets
Figure 7 shows how the classification accuracy of MFCAN changes with the number of iterations during the training process. It can be found that when the number of iterations is between 90 and 110, the training basically converges, and the performance of MFCAN reaches the best.
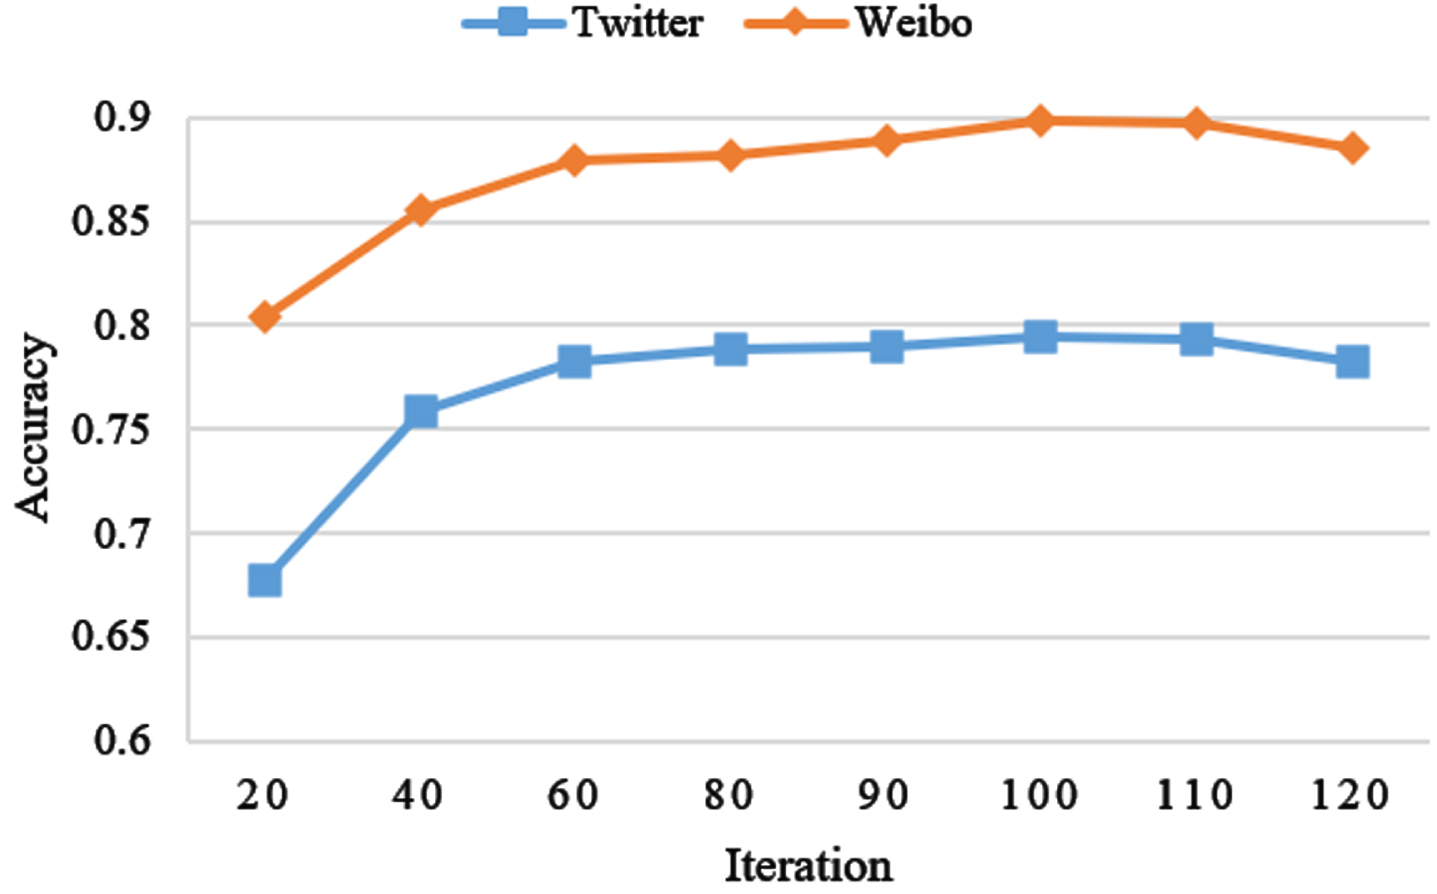
Accuracy changes with different iterations.
The proposed model is implemented in the PyTorch architecture [63] and the experiments are performed based on PyCharm 2022.3.2, Python 3.8.0, PyTorch 1.10.0, CUDA 10.2, and cuDNN 7.6.5.
The performance of the proposed MFCAN is contrasted with that of single-mode and multimode baseline models.
Single-modality models
We first contrast the proposed multi-modality approach with the following three single-modality models. Text: the model only analyzes textual information to detect fake news. The post’s text is represented by BERT as a 768-dimensional sequence of word vectors, are is then fed into a Bi-LSTM, whose output is sent into a 768-dimensional fully-connected layer to derive the overall text features for final prediction. Visual-S: this model is part of the proposed MFCAN. It uses only visual semantic features of images to recognize fake news. The pre-trained ResNet50 network is used to extract the visual features of the images, which are then fed into a 768-dimensional fully connected layer for prediction. Visual-F: the model employs only the frequency-aware tamper feature extractor of MFCAN to detect tampering components, and a fully-connected layer with 768-dimensional is used for making the prediction finally.
Multi-modality models
Multi-modality approaches typically use information from multiple modalities to detect fake news. The following multi-modal approaches are compared with our method. VQA [65]: Visual Question Answering is given an image to answer a question. The original VQA model was used for a multiclass classification task. We adapt the final multiclass layer of the original VQA model to our binary classification task by replacing it with a binary classification layer, using only one layer of the LSTM, which is set to 32 hidden units. NeuralTalk [66]: is a model that generates captions based on images. It uses a convolutional neural network to encode images into compact representations and then generates the corresponding sentences through the LSTM network. att-RNN [5]: att-RNN is a method that incorporates social contextual information into multimodal news detection. It first applies LSTM to obtain a fused representation of text and social information, and then explores the semantic association of text and visual information through an attention mechanism. In our experiments, we removed social contextual information for fair comparison. EANNs [8]: An event discriminator was added to the composition of EANNs in addition to a multimodal feature extractor and a fake news detector. The multimodal feature extractor obtains distinguishable textual and visual features from posts, and the event discriminator improves multimodal features by learning event invariant features based on adversarial ideas. We used a variant of EANN with the event discriminator removed for our experiments. MVAE [9]: obtains a shared representation of vision and text to detect fake news by jointly training an encoder, decoder and classifier. We use the official implementation of MVAE for our experiments. SAFE [15]: uses a pre-trained model to generate a textual description of an image and computes its semantic similarity to the textual representation, which is then combined with multimodal fusion features to detect falsity of news.
Evaluation metrics
Following the evaluation metrics commonly used for classification tasks, in our experiment, we used Accuracy, Precision, F1 score and Recalll to assess the performance of the various methods. The formulae for the evaluation are shown below.
Tables 2 and 3 show the results of performance comparison between the proposed MFCAN and the baselines on Twitter and Weibo datasets. Note that the experimental results for the baseline models are cited directly from previous papers. Based on the results of the tables, we have the following observations: MFCAN-concat outperforms single-modal models (i.e., Visual-S), indicating that multimodal methods are generally superior to single-modality methods. Introducing multimodality into a model is feasible, but not always effective in improving model performance, for example, the unimodal method “Text” performs better than MFCAN-concat on the Weibo dataset. Our proposed MFCAN performs better than MFCAN-concat and other multimodal models, demonstrating that our proposed strategy for fusing cross-modal features superior to simple connectivity methods. In comparison of multimodal models, att-RNN fuses textual and social contextual features through the attention mechanism and concatenates the fused textual features with image features, achieving better performance than VQA and NeuralTalk, demonstrating the effectiveness of the attention mechanism, but it does not directly use the attention mechanism to explore intra- and inter-modal associations of textual and visual information. The superior performance of the EVNN and MVAE models over the single-mode model suggests that visual information can provide complementary evidence for the analysis of fake news. SpotFake has better performance than all baselines on the two datasets, showing that the pre-trained BERT can learn more textual information to improve model performance. Spotfake, EANN, and MAVE, however, rely only on fused features obtained directly using concatenation or auxiliary tasks. These fused features do not provide enough discriminative power to classify fake news because the text and image features separately extracted are not in the same semantic space and the relevant information of the text and images is not well attended to during the fusion process. Therefore, the experimental results of these methods are unsatisfactory. With the comparison of Tables 2 and 3, the performance of the single-modality models Text (BERT), Visual-S(ResNet-50), and Visual-F(ResNet-50) on the Weibo dataset is significantly better than that on the Twitter dataset. The reason is due to issues with the Twitter dataset, such as post length and imbalance issue. Over 70% of the tweets in the Twitter dataset are related to a particular event. Therefore, the training data of BERT and ResNet50 are excessively similar, resulting in poor generalization capability. The average length of a tweet on Weibo dataset is significantly longer than that of a tweet on Twitter dataset, and the image is versatile, which could be useful in extracting discriminable representation of text and image.
Comparison results of different models on the Twitter dataset
Comparison results of different models on the Twitter dataset
Comparison results of different models on the Weibo dataset
On the Twitter dataset, our model outperforms the best model SpotFake by a margin of 1.1% in terms of accuracy. For the Weibo dataset, our model achieves performance improvement of 0.6%. Overall, these results demonstrate the advantages of the proposed MFCAN for multi-modal fake news detection. The performance improvement is attributed to the superiority of MFCAN. First, the physical tampering clues of fake images captured in the frequency domain could effectively complement the information in the spatial domain; second, the proposed cross-modal fusion network could fully utilize the intra- and inter-modal interactions to enhance the fused feature representation of text and images for more accurate fake news detection.
Effectiveness of MFCAN components
In this section, we devise ablation experiments to evaluate the efficacy of the various MFCAN components, beginning with the most fundamental configurations and progressively adding components until the entire model architecture is built up.
The results are exhibited in Tables 4-5. “T” denotes the text feature extractor, “S” stands for the visual semantic feature extractor, “F” refers to the frequency-aware tamper feature extractor, “Cross-att” stands for the cross-modality fusion module which fuse three modalities with attention mechanism, “Concat” denotes that the three modalities are merged with concatenate.
Architecture ablation analysis of MFCAN on Twitter dataset
Architecture ablation analysis of MFCAN on Twitter dataset
Architecture ablation analysis of MFCAN on Weibo dataset
We begin with the text feature extraction module (T) and gradually add new sub-networks. As shown in Tables 4-5, according to the first line of two datasets, the average accuracy achieved is 57.6%, 81.7% depending on the text characteristics. Then, we added the visual semantic feature extractor (S) and combined the textual and visual semantic features. Compared to the single module, the results improved by 18%, 2%, respectively. In addition, combining the textual feature with the tamper feature of the frequency-aware tamper feature extractor (F) leads to an improvement of 13.2% and 1.2%, respectively, when compared to just one module.
As a next step, we selected concatenate operation (Concat) to combine features of T, S, and F modules, this boosts recognition accuracy on average to 76.4% and 85.9%. Compared to T + S or T + F, the effect on Twitter is improved by 0.8% and 5.6%, respectively, and on Weibo by 2.2% and 3%. This also demonstrates that the frequency-aware tamper feature is beneficial to performance.
Finally, instead of concatenation, we use the attention module (Cross-att) to conduct experiments that leverage attention mechanisms to effectively blend intra- and inter-modal representations in the linguistic and visual domains. The experimental findings achieved the best performance of 79.4% and 89.8%. In comparison to the concatenate, the outcomes improve by 3% and 3.9%, respectively.
We display the findings to better illustrate the ablation experiment. As illustrated in Fig. 8, each component plays an important role in boosting MFCAN’s performance. T + S+F+C outperform T + S, indicating that frequency domain information has the potential to detect bogus news. T + S+F+A outscored T + S+F+C, indicating that the cross-attention method we advocated is effective. Textual information contributes less to the overall model on the Twitter dataset than visual representations, but the opposite is true on the Weibo dataset. This is due to the short length of most posts in the Twitter dataset, which makes learning the entire semantic in formation challenging. Furthermore, due to the balanced data distribution, eliminating one or two components from the Weibo dataset does not significantly reduce MFCAN performance.
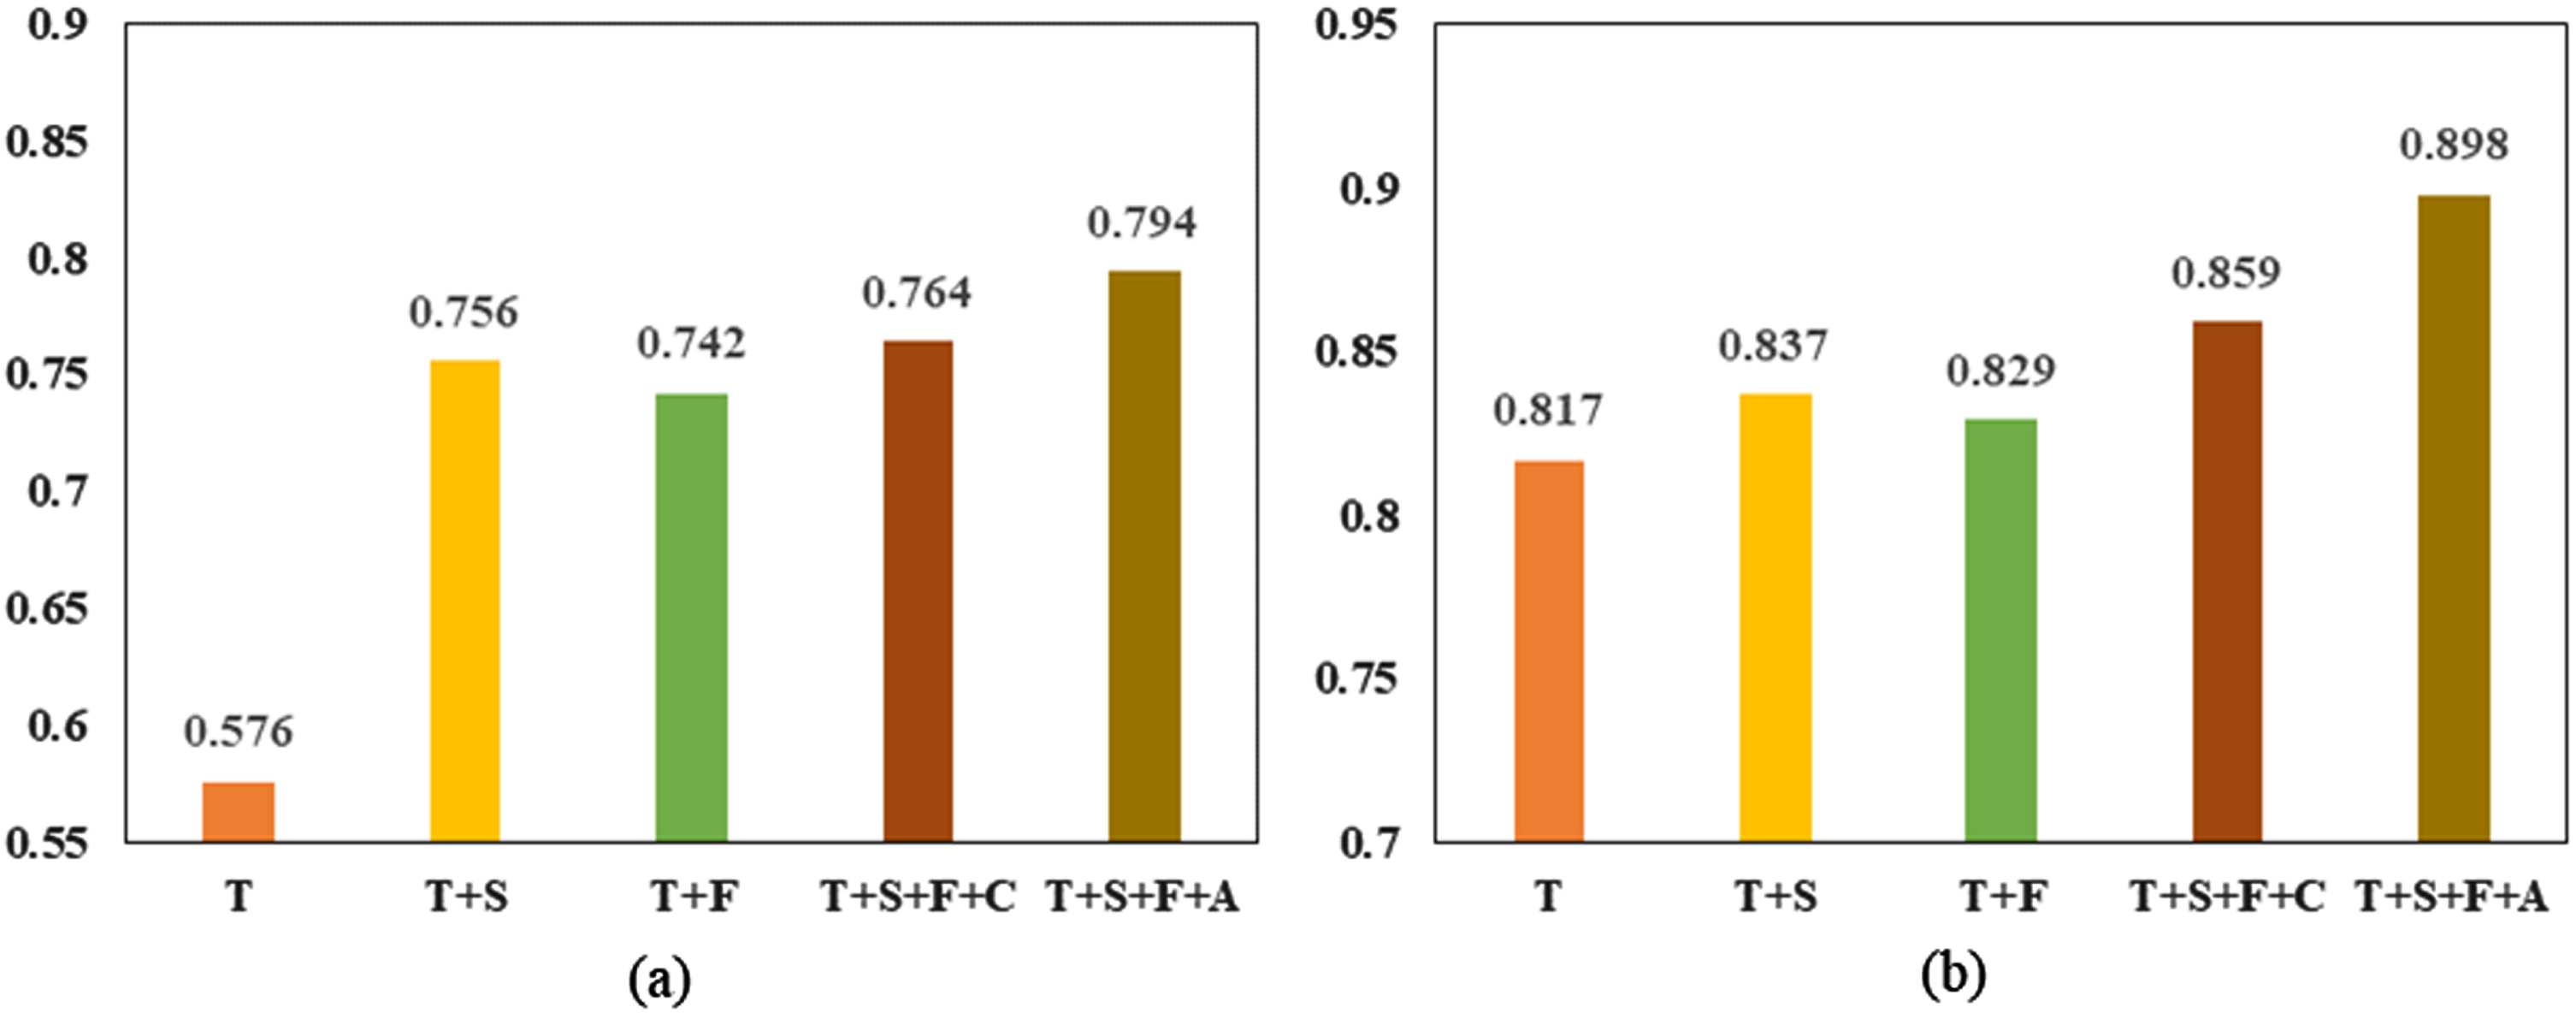
MFCAN ablation analysis in Accuracy. (a)Twitter. (b)Weibo.
In order to further investigate the effectiveness of low, mid and high frequency as well as full frequency information on FATE (frequency-aware tamper feature extractor) in falsifying feature extraction, we evaluate the proposed FATE by different frequency components, namely, 1) FATE-Low, a variant that extracts only low frequency band features; 2) FATE-Mid, a variant that extracts only mid frequency band features; 3) FATE-High, a variant that extracts only high frequency band features; 4) FATE-All, which extracts all band features.
Tables 6-7 present the experimental results for the variant of FATE in both datasets, showing that the variant FATE-High achieved the best results compared to FATE-Low and FATE-Mid due to the higher frequency band component containing richer information about the changes in the picture. This suggests that high-frequency cues in images undoubtedly contribute to the detection of forgeries. This is because high-frequency cues correspond to the edges, textures, and detailed parts of the image, which are sensitive areas for forgery, and FATE-All achieves the highest results by stringing together the three frequency bands to capture both low-frequency global information and to learn a small range of mid- and high-frequency details, which facilitates a more com prehensive mining of forgery patterns and benefits to obtain richer frequency-aware clues.
Ablation analysis of FATE on Twitter dataset
Ablation analysis of FATE on Twitter dataset
Ablation analysis of FATE on Weibo dataset
We selected several fake news images from the Twitter and Weibo datasets to visually demonstrate the effectiveness of FATE-All in capturing forgery traces. Note that according to the above ablation experiments, we only choose FATE-All for demonstration because the difference in performance between FATE-Low and FATE-Mid is not significant. Since the original authentic images cannot be found, we employ the detection results of the Error Level Analysis (ELA) algorithm as a comparison to show the the possible tampered regions. As shown in Fig. 9, the possible forged and non-forged regions of the second column of ELA-processed images are distinctly different in character, and the manipulated regions are generally highlighted. Our proposed FATE-ALL also captures similar regions, which are presented as heat maps where potential forgery regions are shown in red, with darker colors indicating more attention obtained.
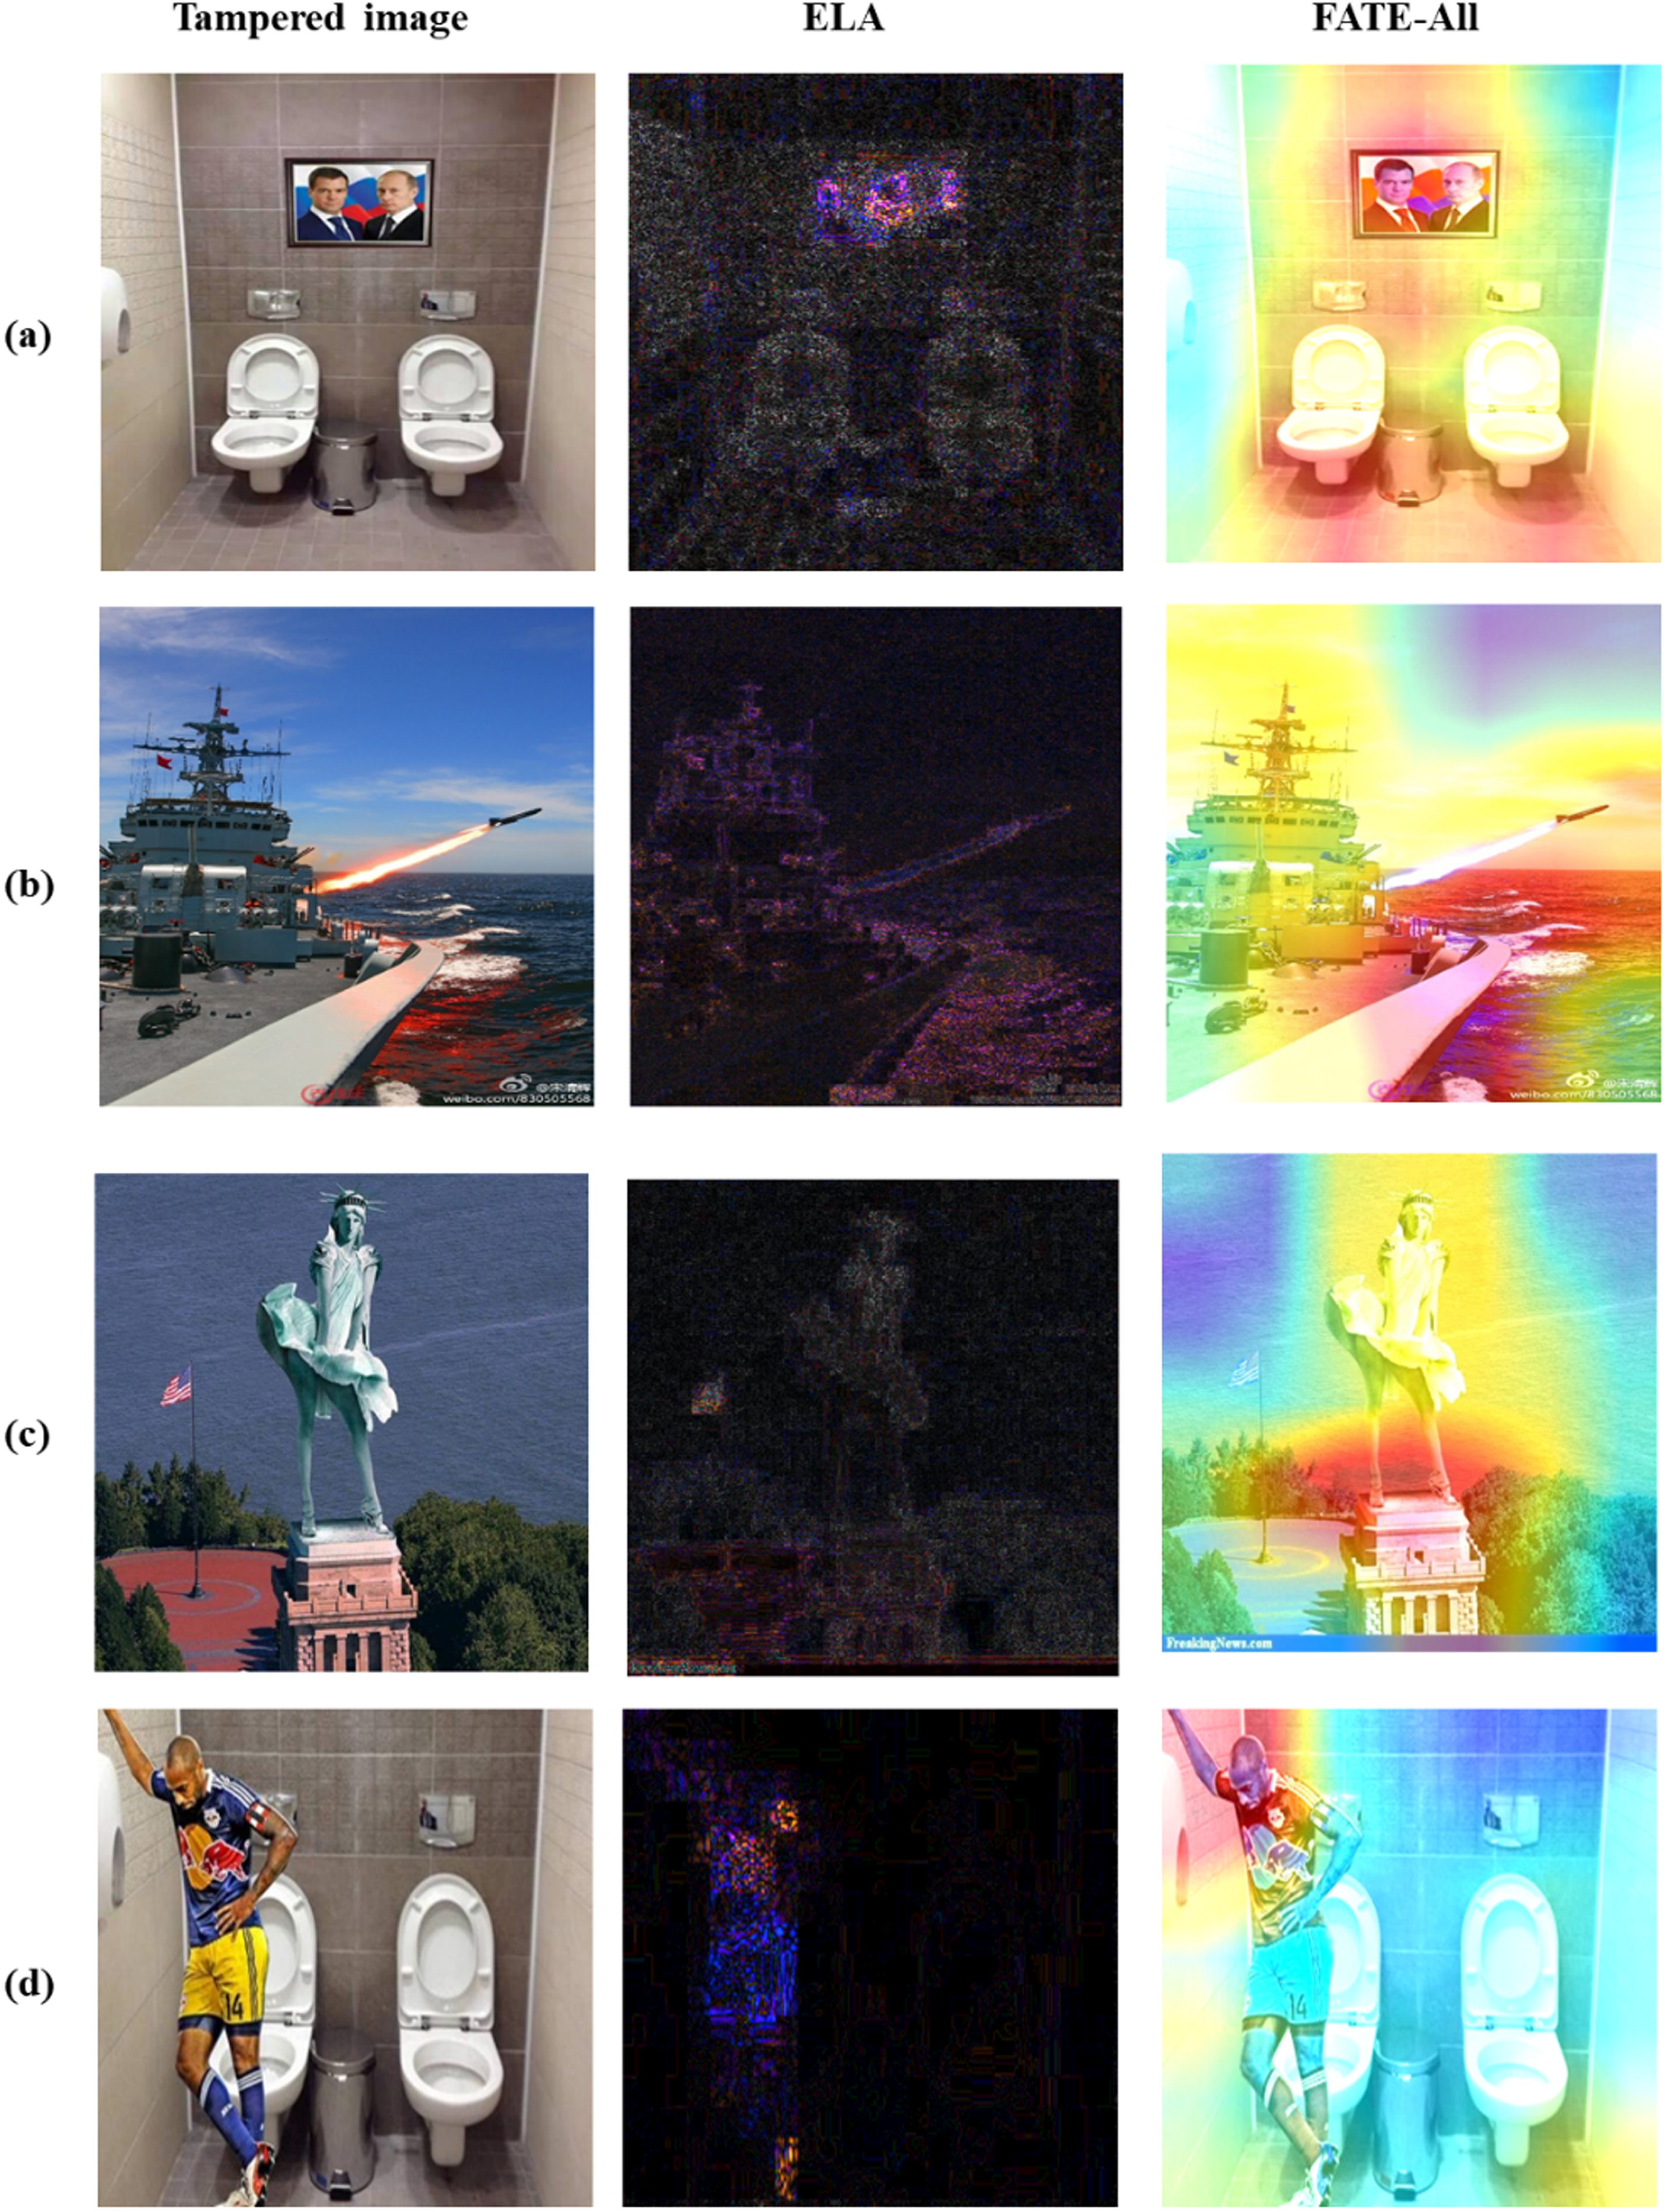
The results of image manipulation traces detection and localization. The first column shows the forged images, the second column is the first column images processed by ELA, and the third column is the first column images after FATE-All processing.
In this section, we investigate the influence of the number of cross-attention unit heads on the performance of the model. The range of the number of heads was set to [4, 16] due to the fact that the number of cross-attentive heads must be divisible by the size of the word vector. Figure 10 shows how the accuracy of MFCAN varies with different head counts. From this we can observe that the number of heads has little impact on the results and that the performance of MFCAN was the best on the Twitter and Weibo datasets at 8 and 12 heads respectively.
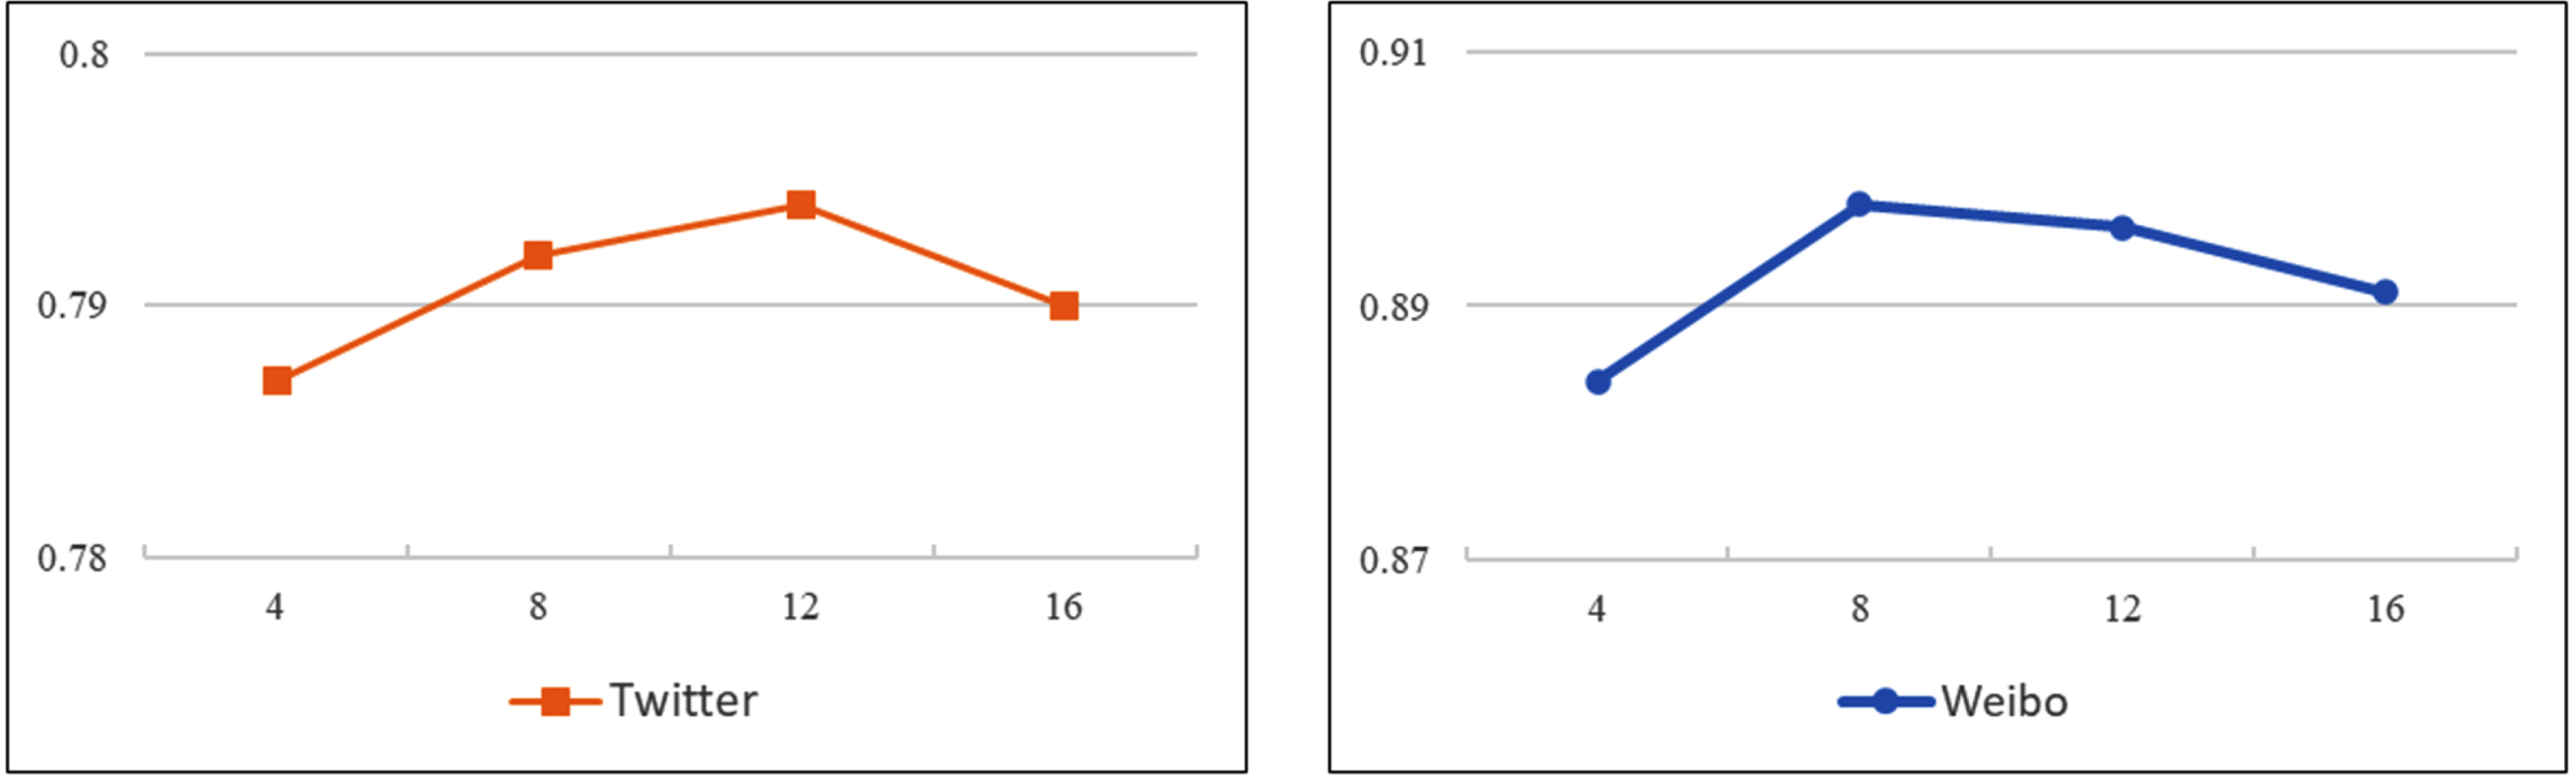
Experimental results of MFCAN at different numbers of cross-attention unit heads.
The time or computational complexity of deep neural networks (DNNs) is an issue. the computational complexity of DNNs is closely related to factors such as hardware execution, number of layers, and the number of operations required to produce results. So, we investigate the computational complexity of the model by tracking the training and prediction times of several MFCAN variants on GTX 3090 24G, which are presented in hour, minute, second, and millisecond formats (HH:MM: SS.ms). As seen in Table 8, the running time increases as the model components increase in size or complexity.
Training and prediction time for several variants of MFCAN
Training and prediction time for several variants of MFCAN
To visualize the features learned by our model on both datasets, Figs. 11-12 show visual depictions of t-SNE [67]. (a) and (b) in Figs. 11-12 are learned on the test set by fusing representations of the three modalities through the connection (MFCAN-Concat) and attention mechanisms (MFCAN-Cross_att), respectively.
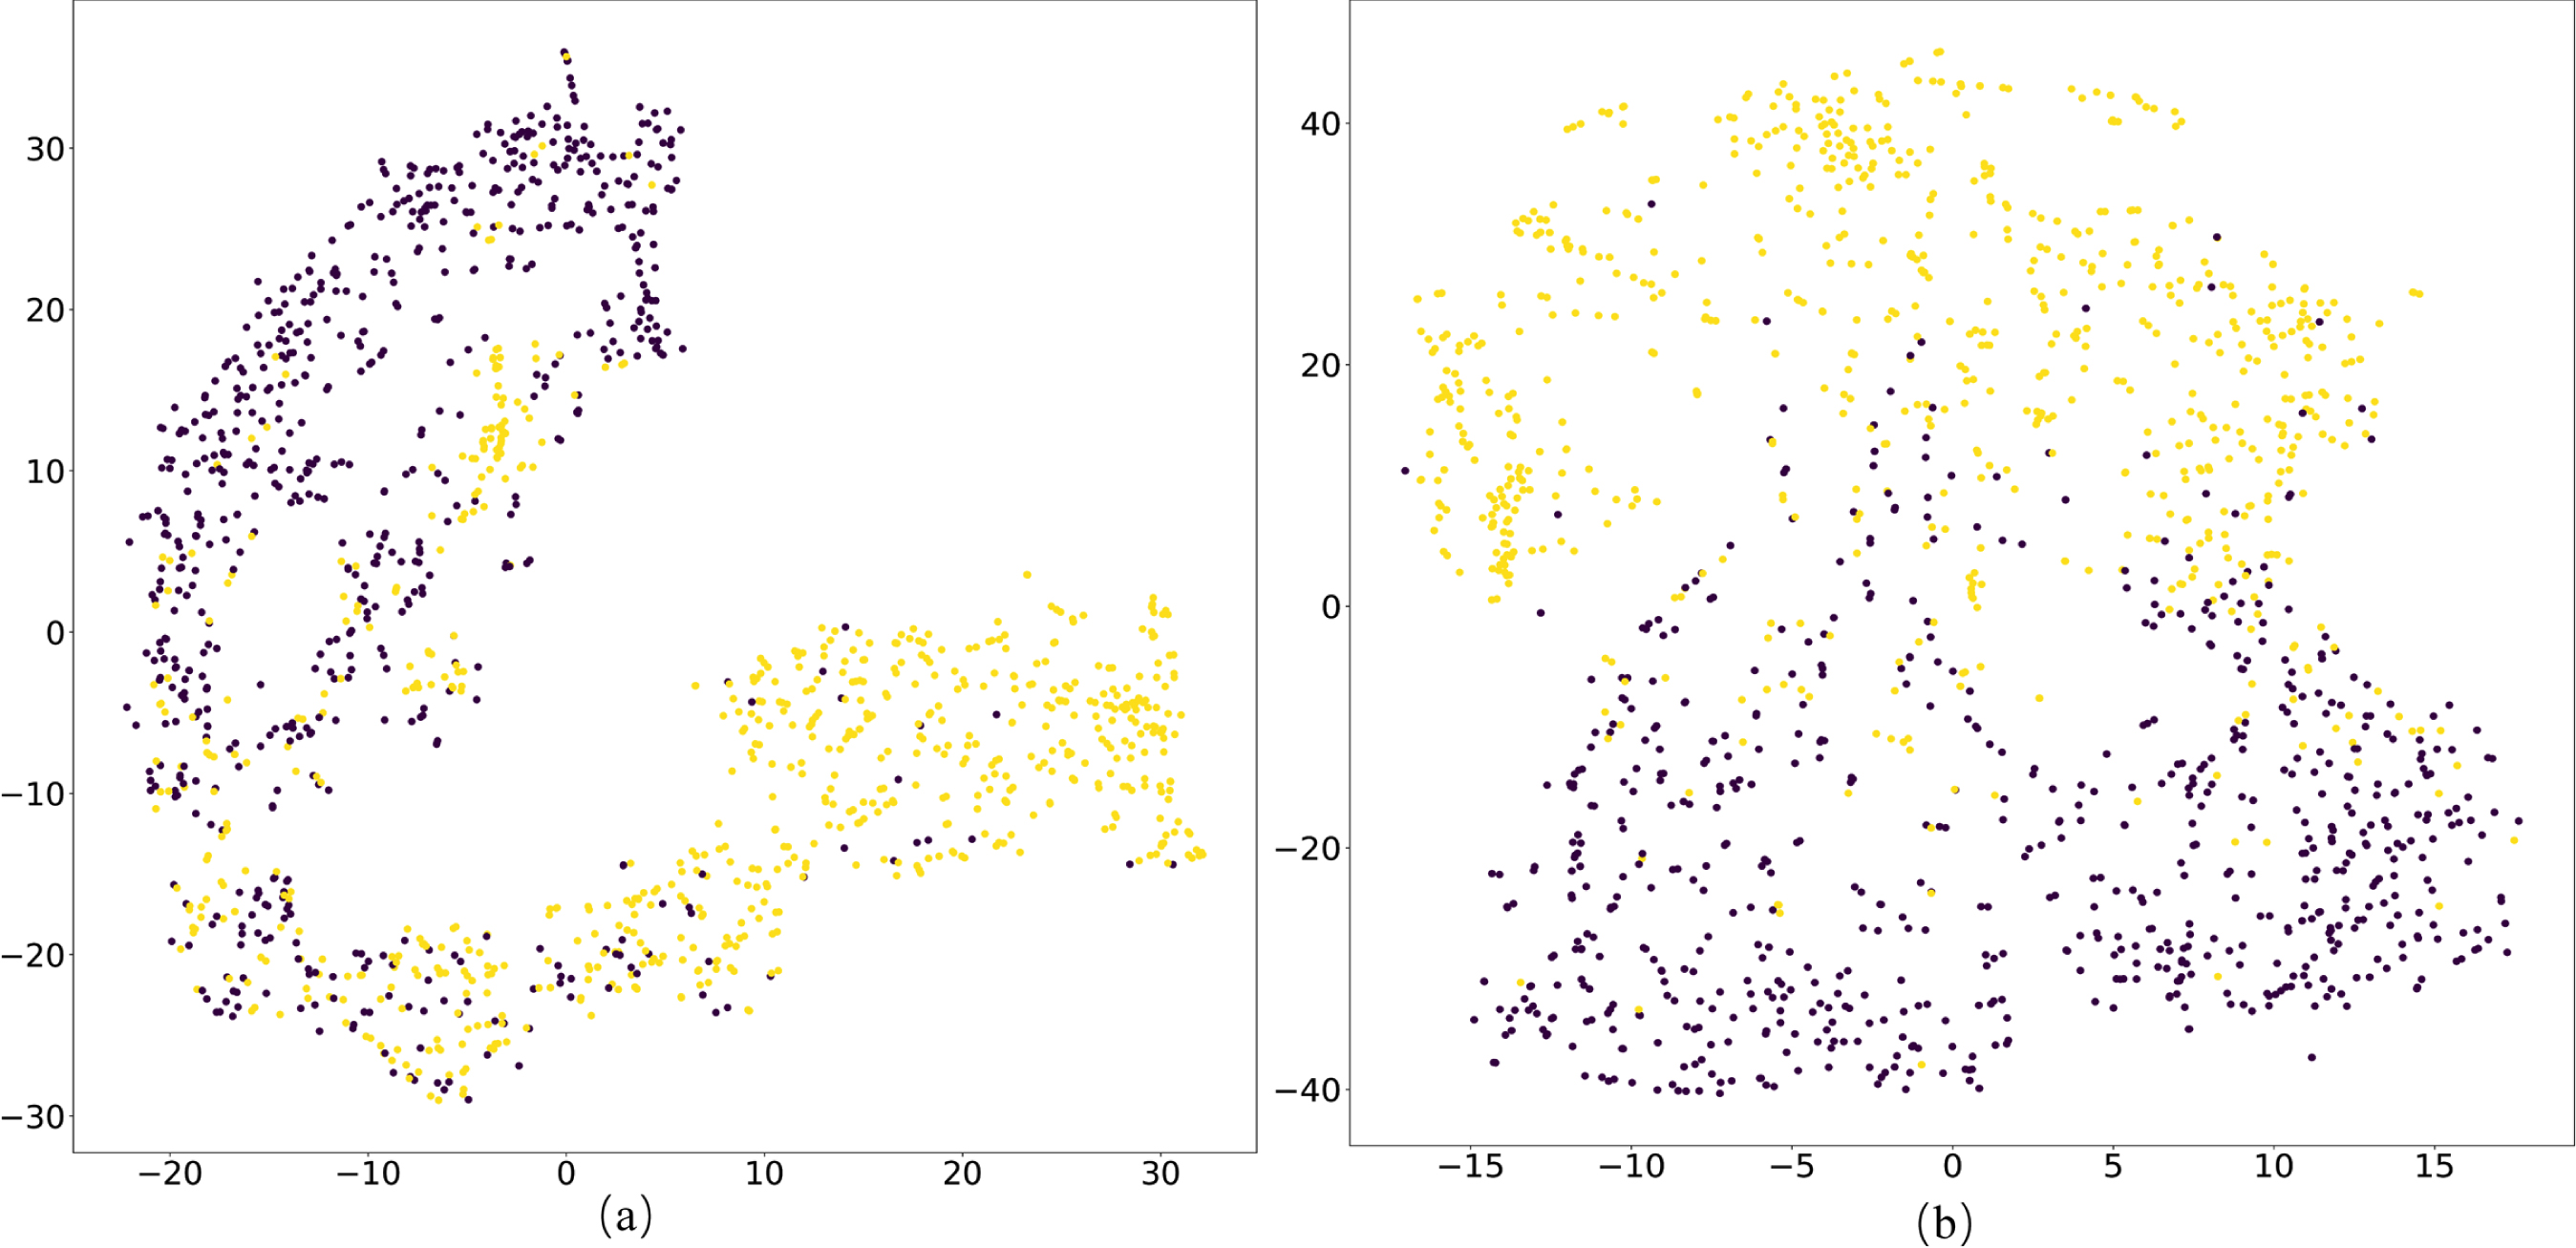
t-SNE feature visualization results on Weibo dataset. (a) MFCAN-Concat. (b) MFCAN-Cross_att.
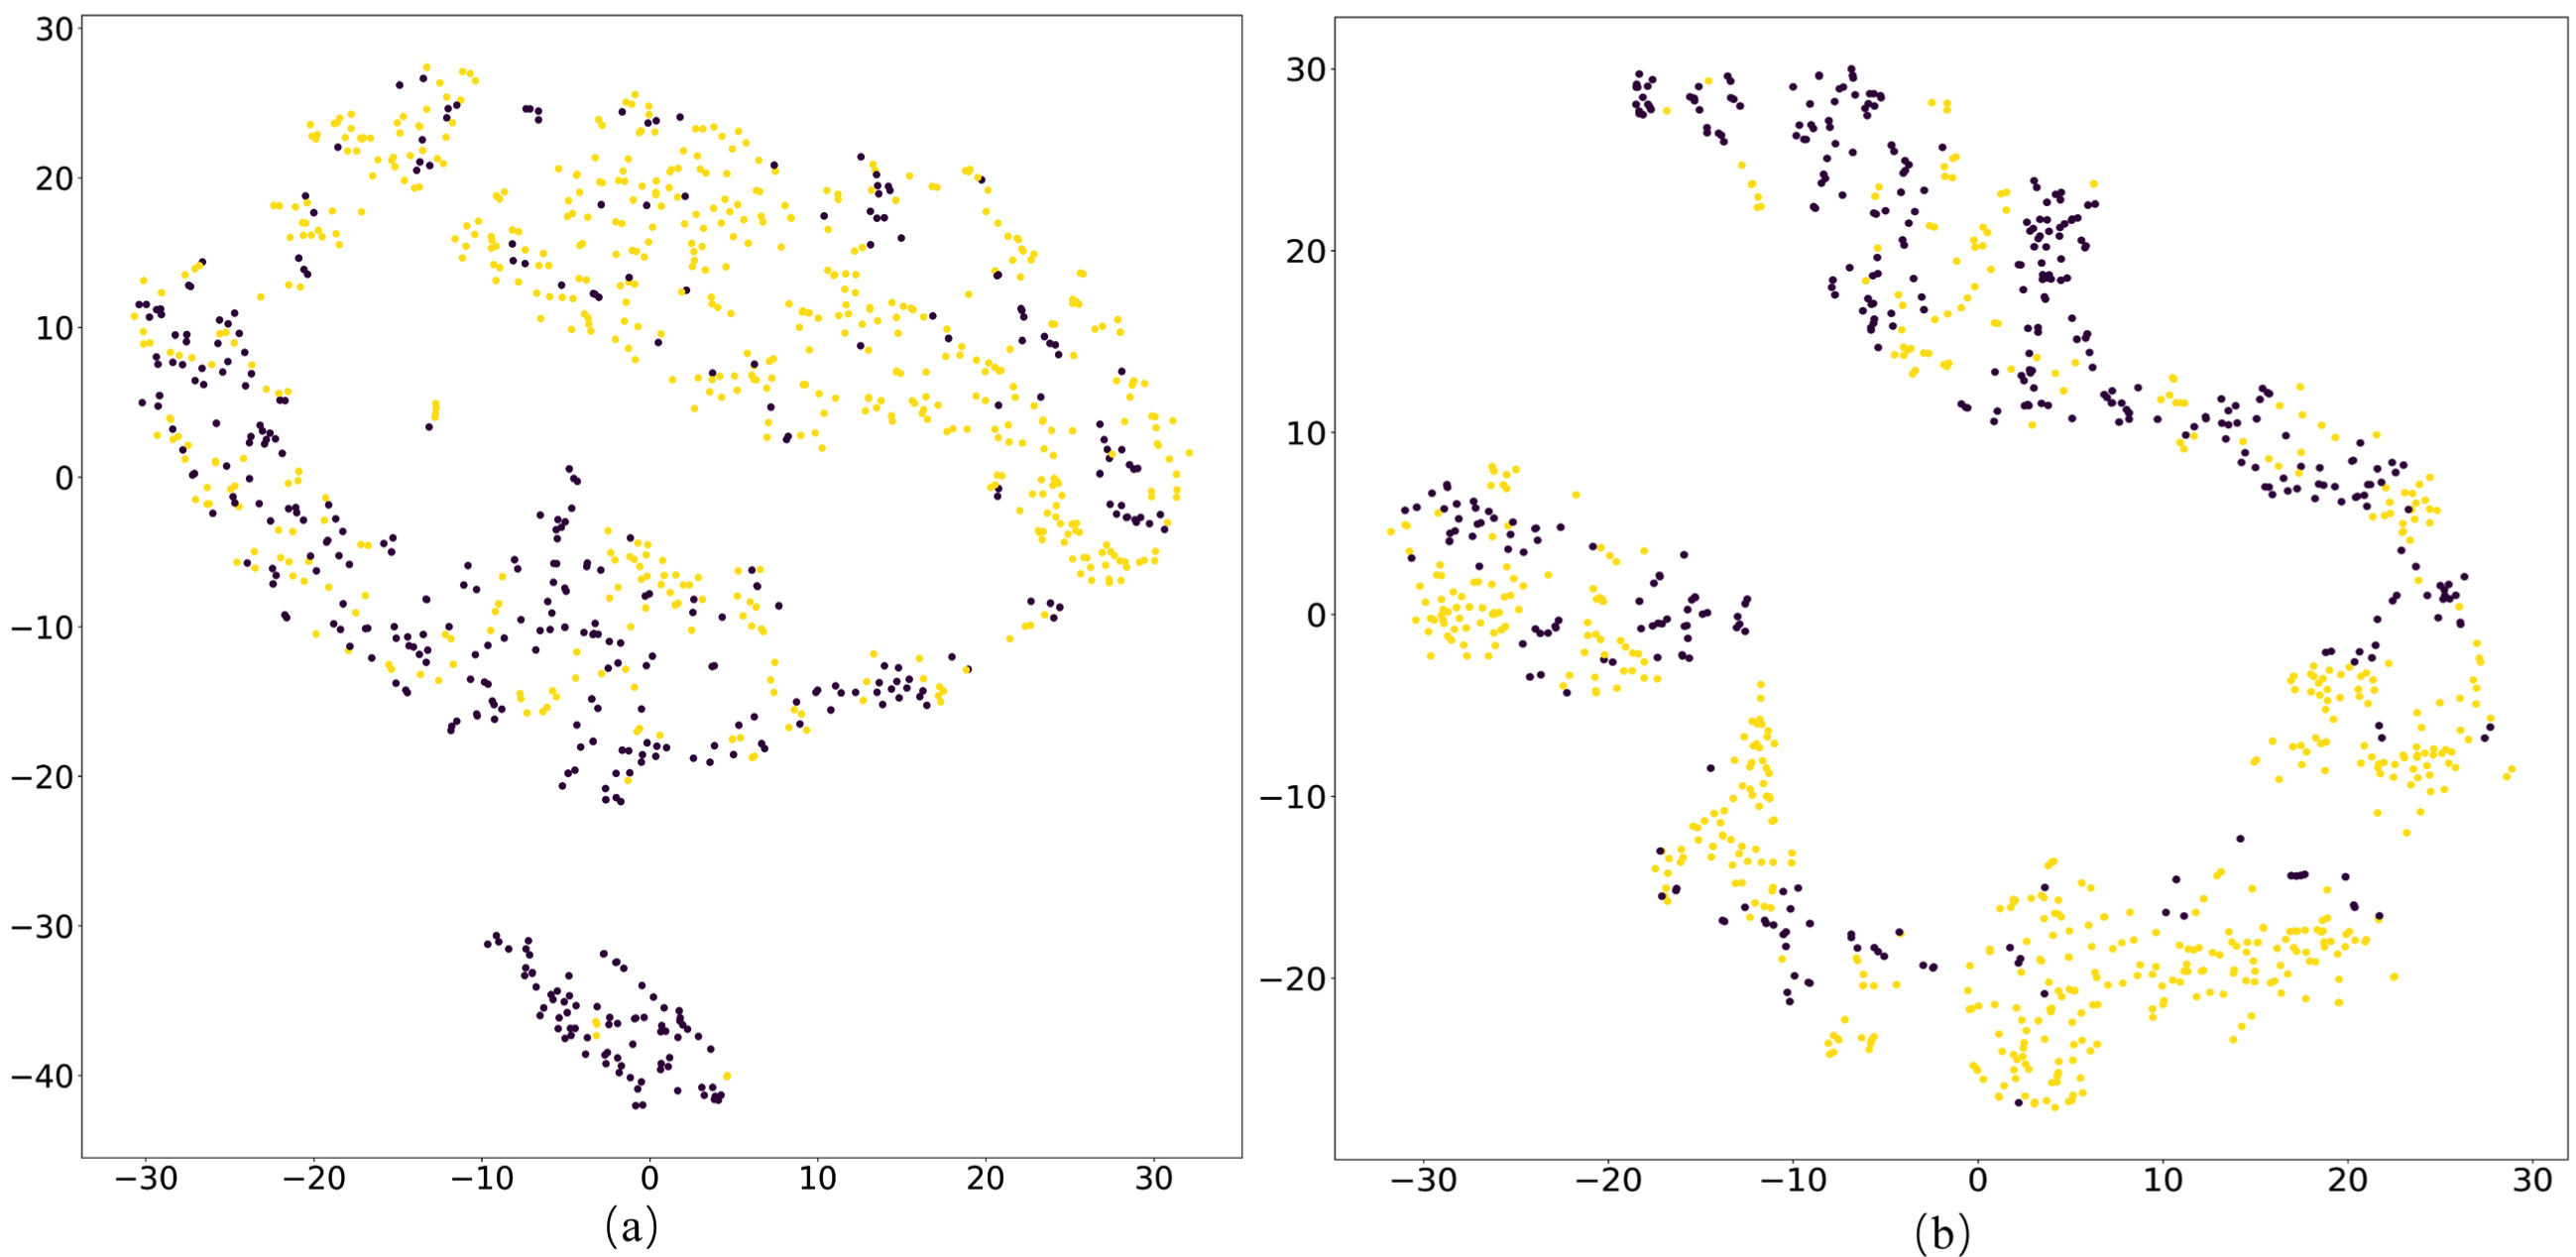
t-SNE feature visualization results on Twitter dataset. (a) MFCAN-Concat. (b) MFCAN-Cross_att.
As shown in Figs. 11-12, the separability of the feature representation of MFCAN-Cross_att is much superior to that of MFCAN-Concat. MFCAN-Concat can acquire distinguishing qualities, although many of them are easily misclassified, as shown in Figs. 11(a) and 12(a). The features learned by MFCAN-Cross_att are more discriminable with a wider zone of separation between two sample types in Figs. 11(b) and 12(b). This is due to the attention module of MFCAN-Cross_att, which gradually fuses intra- and inter-modal features of text and visuals and thoroughly combines the characteristics of three modalities.
Based on the phenomena, we can conclude that the clustering results obtained by integrating features from three modalities with an attention mechanism are more compact than those obtained by simple concatenation, further validating the efficacy of MFCAN in enhancing detection ability for fake news.
To further demonstrate the significance of multimodal features in detecting fake news and to see the advantages given by the attention mechanism in multimodal fusion, we generate the class activation maps using the Grad-cam [68] and interpret the findings. Specifically, the idea is to observe which image regions are contributing to classification, and these should ideally be textual objects or forged regions in forged images.
Now we will demonstrate some of the visual outputs typically used to demonstrate the interpretability of MFCAN models. As we observe in Fig. 13 the Grad-cam results are satisfactory. The Grad-cam generates the heat-map in the object region (streets and metro stations) and most likely the forged region (shark) well from Fig. 13(a). The heat map in Fig. 13(b) focuses on the “mount” area and, meanwhile, emphasizes the typical characteristics of the “lenticular cloud” zone that appears in the sentence, which is very likely to be the fabrication region. As seen in Fig. 13(c), the high intensity values of the heat-map (red) correspond precisely to the “Hurricane” and “Statue of Liberty” (located in New York) regions, which match the words “Hurricane” and “New York” in the text. Figure 13(d) demonstrates that our approach relies on the trunk and ears to identify elephant and recognize the features of the stone.
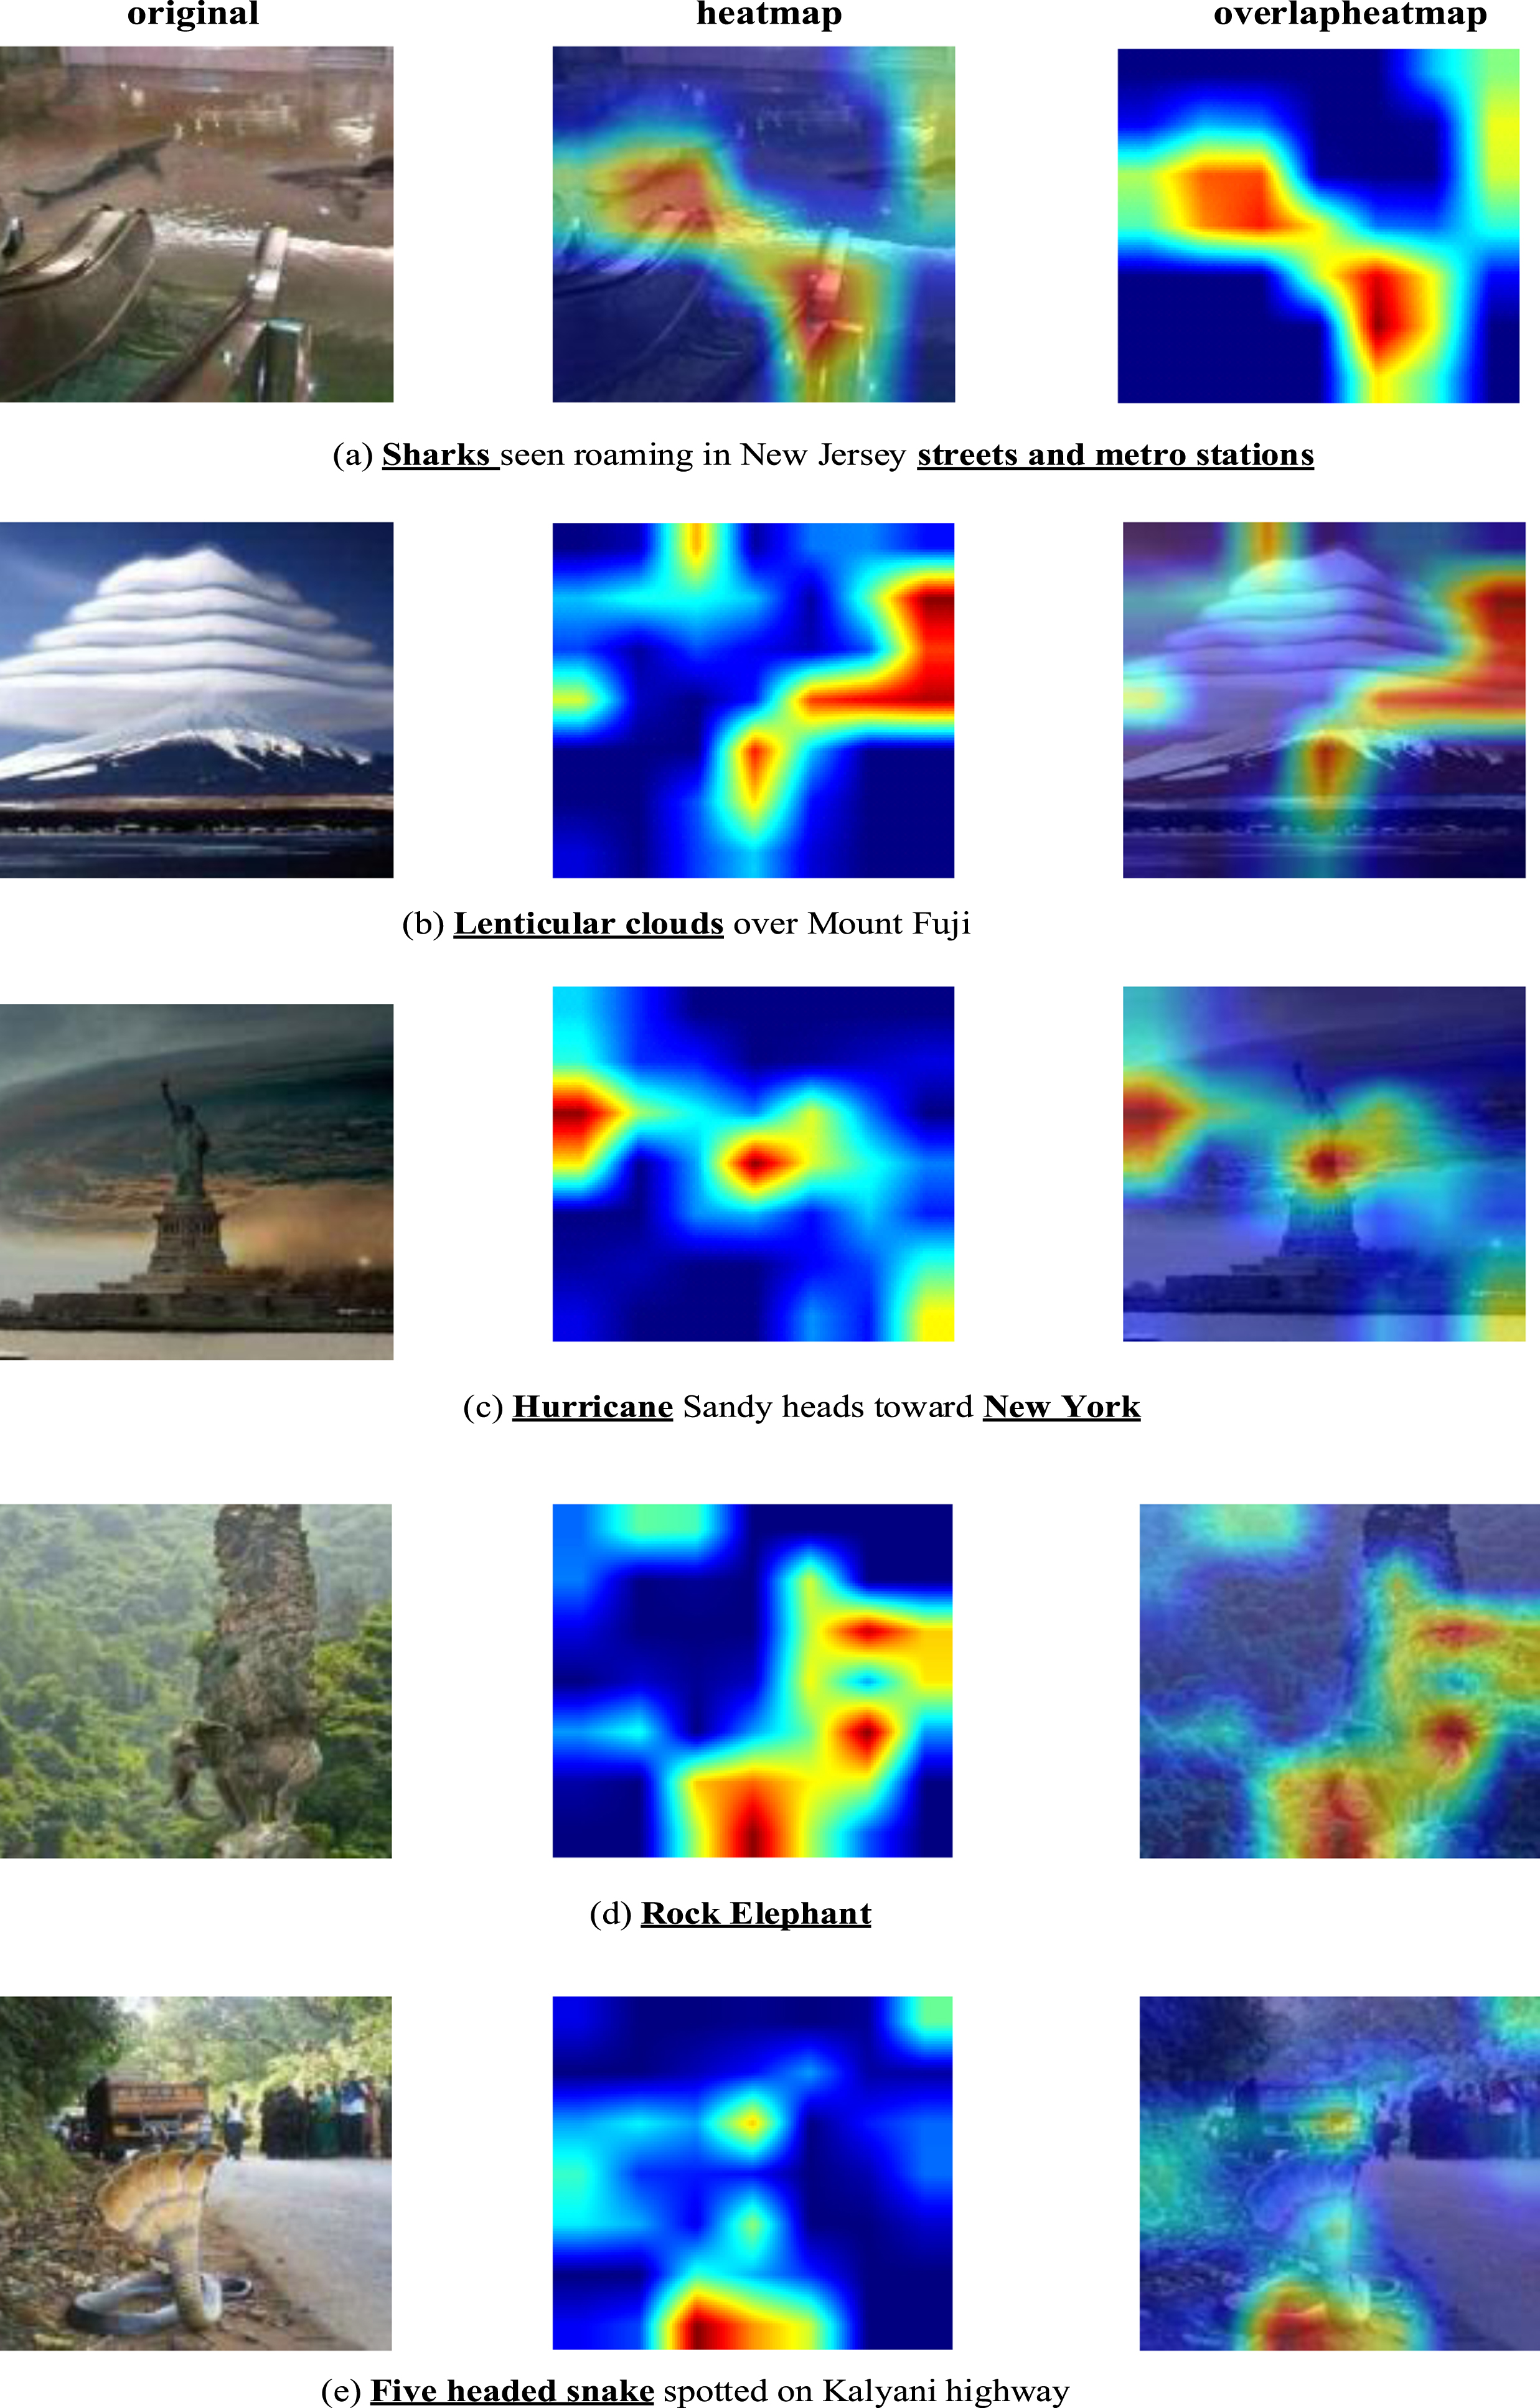
Some fake news on the Twitter dataset is detected by MFCAN but missed by the Text-only model.
According to Fig. 13(e), the heat map concentrates on the snake’s curl feature, followed by the snake’s head feature. These tweets above were recognized as fake by MFCAN but misclassified by the text-only model.
These visualizations highlight the complementary nature of textual and visual modalities and the ability of our model to learn the appropriate features from the input text and image and classify effectively using those features.
From the experimental results, it can be seen that MFCAN clearly outperforms other baseline methods. The main advantage of MFCAN over the baseline methods is that it takes into account not only the visual semantic information but also the physical falsification information of the image. The results of the ablation experiments are as we expected, T + S+F+C outperforms T + S suggesting that the frequency domain information provides complementary information that helps to detect falsifications. To further investigate the importance of different frequency components in tampering feature extraction, we quantitatively evaluated the effectiveness of low, medium, and high frequency as well as full-frequency information for tampering feature extraction. The results are in line with the expectation that full-frequency information linking low, medium, and high frequencies together helps provide richer frequency-aware cues and enables more comprehensive mining of forgery patterns.
In addition, to investigate the role of attentional mechanisms in the fusion of textual and visual information, we explored potential intramodal and intermodal correlation information. t + s+f+a outperformed t + s+f+c, a result that suggests that attentional mechanisms can effectively facilitate the interactive fusion of visual and textual information to enhance the expression of multi-modal features. In addition, we further study the effect of the number of heads in the cross-attention unit on the model performance. The results show that the model performance is best when the number of heads is set to 8 and 12 on the Twitter and Weibo datasets, respectively.
Model limitations
The proposed MFCAN also has limitations, for example, it is sensitive to an unbalanced Twitter dataset in which more than 70% of posts are related to a specific event, resulting in poor performance of model generalization. Our method relies on hand-crafted labeled datasets for training, which makes it hard and expensive to train on a substantial amount of labeled data. For this reason, [69] investigated a semi-supervised framework based on co-training to handle limited labeled data and improve co-training robustness on imbalanced data. [70] developed an effective semi-supervised feature selection framework for video semantic recognition tasks that utilises optimal neighbour assignment and adaptive loss measures to improve the accuracy and robustness of the model. Inspired by [70], news from the same event may have potentially similar features, and feature selection with the aid of event labels may bring enhancements to our model.
Conclusion
In this paper, we develop a new multimodal frequency-aware cross-attentive network (MFCAN) which performs fake news detection by mining features of textual and visual modalities and jointly establishing inter- and intra-modal relationships. We started by extracting salient features from the text, spatial and frequency domains using three sub-networks. Then, utilizing the proposed multimodal attention fusion module, we identify complicated fine-grained relationships between cross-modal features. Finally, we map the text and visual features into a fully connected network to obtain classification results. Experimental results and comparisons on two publicly available benchmark datasets for fake news detection demonstrate the effectiveness of the proposed MFCAN.
Our work shows that information cues mined from forged images in the frequency domain are useful complement to visual information, and that the fusion of features in the frequency and spatial domains facilitates model performance. Carefully constructed attention mechanisms to model intra- and inter-modal dependencies and to fuse textual and visual information are fruitful.
In subsequent work, we will continue to investigate and optimize feature fusion approaches for multimodal data based on this model, and we will also evaluate and enhance the applicability and robustness of the model by using various multimodal fake news datasets so that it can be adapted to more complicated problem scenarios.
Footnotes
Acknowledgments
This study was supported by the Key Cooperation Project of Chongqing Municipal Education Commission (HZ2021017, HZ2021008), and the “Fertilizer Robot” project of Chongqing Committee on Agriculture and Rural Affairs.