
Abstract
Arrhythmia is the medical term for any irregularities in the normal functioning of the heart. Due to their ease of use and non-invasive nature, electrocardiograms (ECGs) are frequently used to identify heart problems. Analyzing a huge number of ECG data manually by medical professionals uses excessive medical resources. Consequently, identifying ECG characteristics based on machine learning has become increasingly popular. However, these conventional methods have some limitations, including the need for manual feature recognition, complex models, and lengthy training periods. This research offers a unique hybrid POA-F3DCNN method for arrhythmia classification that combines the Pelican Optimisation algorithm with fuzzy-based 3D-CNN (F3DCNN) to alleviate the shortcomings of the existing methods. The POA is applied to hyper-tune the parameters of 3DCNN and determine the ideal parameters of the Gaussian Membership Functions used for FLSs. The experimental results were obtained by testing the performance of five and thirteen categories of arrhythmia classification, respectively, on UCI-arrhythmia and the MIT-BIH Arrhythmia datasets. Standard measures such as F1-score, Precision, Accuracy, Specificity, and Recall enabled the classification results to be expressed appropriately. The outcomes of the novel framework achieved testing average accuracies after ten-fold cross-validation are 98.96 % on the MIT-BIH dataset and 99.4% on the UCI arrhythmia datasets compared to state-of-the-art approaches.
Keywords
Introduction
Globally, cardiovascular diseases account for most human deaths and result in more than 17 million annual fatalities. According to a World Heart Federation study, almost 75% of all cardiovascular disease patients worldwide live in low-income areas [1,2, 1,2]. Physicians from various specialties employ electrocardiography (ECG), a significant non-invasive test, to identify various cardiac conditions, including rhythm disturbances, conduction anomalies, and myocardial ischemia or infarction. The prediction accuracy of diagnosis is still low and has to be improved, despite the development of a computer-based automated interpretation system integrated into the electrocardiography equipment [3,4, 3,4].A series of events, such as the polarisation and depolarization of heart tissue is represented by an ECG signal. These significant occurrences, known as waves are annotated as T, S, R, Q, and P. In addition to waves, there are also gaps between them. Therefore, the QRS complex is the term given to the combination of Q, R, and S waves together including the intervals, Q and T waves form the QT interval and the ST segment is the period among the completion of the S wave and the starting of the T wave [5-7]. Alteration in generating and propagating electrical impulses across the myocardial tissue results in cardiac arrhythmias. These irregular heartbeats, also known as cardiac dysrhythmias, may range in seriousness from completely being to arrhythmias that pose an urgent danger to life [8,9, 8,9]. Strong links exist between these abnormal beats and heart diseases such as sudden arrhythmic death syndrome. As a result, it is crucial to identify and characterize arrhythmias for the diagnosis of cardiac [10, 11].
Numerous techniques, including Bayesian classifiers, LDA, SVM, decision trees, NN, KNN,etc.,have been employed to analyze ECG information. SVM is the best classifier among the ML approach (supervised classifier), that is used in the categorization of the ECG wave for arrhythmia diagnosis. The performance of a classification system depends on Machine Language Program (MLP) and NN is superior to that of other feature extraction techniques [12-14]. Deep Learning techniques, such as ANN, are used well in applications such as language processing, target tracking, picture identification, and information retrieval. In Deep Learning, extracting features and classification are included in the model, that automatically selects the optimum attributes from the raw data. In recent research, DL has grown in popularity due to its enhanced performance in ECG arrhythmia categorization. Based on the training techniques, DL may be classified as LSTM, CNNs, DNNs and RNNs [15,16, 15,16]. In several research, CNN is utilized to extract the best ECG waveform characteristics and examine the retrieved attributes for different criteria, such as the identification of the QRS wave and ST segment. 1D CNN was trained for extracting the best properties from the ECG data and classify them into five distinct forms of arrhythmia. The wavelet method is used to eliminate noise from the waveform. The final layer of the CNN model was the output layer. It is also known as dense layer and has five neurons that categorize five distinct arrhythmia’s [17,18, 17,18].
Similarly, four distinct forms of arrhythmia are categorized utilizing the 1D CNN architecture. During the pre-processing phase, the ECG rhythm is additionally de-noised, and the resulting signal is then fed into the CNN model. The softmax layer, which provides four distinct outputs, is the last layer of the model. Convo2D with 32 filters and a 3x3kernel size is the first layer of the 2D CNN model, followed by 64 filters with the same kernel size. In the last layer, the matrix was converted into probability using Softmax activation. [19,20, 19,20].
Background
Worldwide, cardiovascular diseases (CVDs) are the leading cause of death. Due to the rise in global mortality rates, bio pathological signal processing and evaluation are increasingly utilized in ambulatory settings for medical applications. For various cardiovascular diseases, the processing of pathological electrocardiogram (ECG) signals for arrhythmia detection has been intensively studied for decades. Aside from these studies, due to the non-stationary nature of ECG signals, efficient cardiovascular diagnosis remains a challenge. Classical signal processing techniques are widely used to analyze ECG signals, but due to their limitations, they are insufficient to achieve greater precision.
Motivation
Deep convolutional neural networks (DCNN) for image analysis operations namely image classification, object detection, and image segmentation have gained popularity recently. The development of DCNN has given rise to new research directions due to the integration of low/mid/high-level features and classifiers in an end-to-end multilayer model, facilitated by the diverse network structures, depth, and width [21]. The number of stacked layers can simultaneously enrich the feature "levels" [22]. Conventional ECG recognition systems often depend on highly trained medical professionals and involve a complex feature extraction process, resulting in increased computational time for arrhythmia classification. The motivation for developing the POA-F3DCNN model is the inconsistent accuracy and efficiency of existing models for arrhythmia classification, particularly when applied to larger databases. This variability reduces their reliability in clinical or practical settings.
Limitation and contribution of work
The disadvantages of the existing and hybrid approaches include increasing cost, duration,and a severe lack of high-quality data, which may be considered negligible in some feasible instances because the precise classification of heart signals and precise diagnosis of arrhythmia require a significant amount of data to perform with.
To overcome this drawback, this paper offers a combination of DNNs consisting of the development and combining of fuzzy neural networks and 3D-CNNs, followed by the simultaneous training of the integrated framework. The innovative features emphasize the implementation of the ensemble technique that integrates the advantages of both models and produces a robust result. In this article, the model is applied to classify five various classes of arrhythmias from the MIT-BIT database and all 13 groups from the UCI arrhythmia database. The POA is proposed to minimize the detection error rate and complexity time by optimizing the parameters of the 3D-CNN and selecting parameters for the membership function. When compared to recent works, the proposed method has shown better heart signal detection and classification outcomes. The key objectives of the research work are as follows.
The proposed work comprises a systematic method for arrhythmia analysis from the ECG signals DWT is used to eliminate baseline wander and high-frequency noise from the input Waveform To choose the features essential for achieving a precise classification, the NCA-based feature selection approach is used To propose a novel hybrid POA-F3DCNN method for different Arrhythmia classifications The proposed POA can be utilized to select the optimal parameters for unknown FLSs and tune the hyper-parameters of 3D-CNN To obtain lower computational complexity with less error rate than the previous models used to classify arrhythmia types
Structure of the paper
The subsequent sections of the paper are as follows: We explore the relevant background research for this study in Section 1.1, Motivation in Section 1.2, and Contributions in Section 1.3. Section 2 provides the Related works. Section 3 provides insights into the proposed approach. We explain the implementation of our proposed model, the outcomes, and the analysis of our techniques. Section 4 provides Results and Discussions. Section 5 Receiver Operating Characteristics and Fuzzy Neural Networks. Section 6 is a Comparative discussion. Section 7 concludes this research and discusses potential future exploration.
Related works
The purpose of the literature review is to identify the most current techniques utilized in ECG data processing for arrhythmia classification. Numerous studies have been conducted in this area that has been explained in detail.
Li et al. [23] introduced a 1D-TCNFN for detecting 17 categories of arrhythmia in electrocardiograms (ECGs). Using a long-term waveform segment, the approach may identify irregular ECG signals. The created 1D-TCNFN combines convolution layers with a neuro-fuzzy network and extracts attributes automatically from raw data, but also minimizes the set of factors that would otherwise be excessive due to the use of fully connected layers. For increased detection accuracy, the Taguchi method was used to optimize the network architecture of the suggested 1D-TCNFN. The performance of the suggested 1D-TCNFN is superior to various state-of-art deep learning networks, yielding the accuracy and F1 score of 93.95% and 94.30% respectively. An attention mechanism can be introduced further to improve the overall model detection performance for difficult-to-identify ECG signals.
Madan et al. [24] explored a hybrid DL-based method for automating detection and categorization. For classification of arrhythmias, a robust approach has been introduced where 2D scalogram images of ECG signals are trained over the CNN-LSTM model. They transformed all ECG data into image using CWT and then used LSTM to classify arrhythmias.The obtained results show that the suggested approach provides 98.7%, 99%, 99% accuracy for cardiac Arrhythmias (ARR), Congestive Heart Failure (CHF), and Normal Sinus Rhythm (NSR), respectively. The average sensitivity of the suggested model for all three arrhythmias are 98.33% and a specificity value is 98.35%. Further the suggested method can be applied over some live ECG signals and Bi-LSTM can be applied instead of LSTM.
Ullah et al. [25] developed a method that successfully classifies the ECG beats even in the presence of a noisy environment. Initially, the Wavelet method was used to improve the quality of the original ECG signal by removing noise from ECG data. Then, 1D-CNN was created with a couple of convolutional layers, dual down-sampling layers, and a fully connected layer. The identical 1D data was converted into 2D imagery to increase the classification accuracy of the model. The 2D CNN system was built using a fully connected layer, three down sampling levels, three 2D-convolutional layers, and input/output layers. Further, an integrated system to classify arrhythmia ECG signals, which will monitor and scan the patient’s ECG signals, which will monitor and scan the patient’s ECG via the internal camera of the robot and will predict and diagnose the arrhythmia ECG signal to advise the medical expert, can be designed.
Sharma et al. [26] developed different variants for ECG signal classification approaches that accurately categorize ECG data into four primary abnormal classes: normal, Ventricular arrhythmia, Tachycardia, Premature heartbeat, and Brady-arrhythmia class. Initial implementation of DWT for de-noising ECG data was followed by classification using the first variant, DWT+FFBPNN. A second variant, DWT+CS+ FFBPNN, was generated by combining the CSO of the retrieved attributes of the signals with FFBPNN and DWT. The classification analysis based on a variant with optimized feature vector using cuckoo search algorithm & SVM-FFBPNN determines heart rate with an accuracy of 98.319%. The improved performance of the novel combination of classifiers resulted in overall classification accuracy of 98.53% with precision & recall of 98.24% and 95.68% respectively.Further, the suggested work can be extended to involve more arrhythmia classes to offer a comprehensive arrhythmia classification approach using ECG signals.
Yang et al. [27] reported an ECG classification approach that detects, identifies, and classifies ECG efficiently and precisely. After the ECG was pre-processed, the image features were retrieved, and then the fuzzy set was used to decrease the ECG features of the images that were extracted. Then, residual learning was utilized to refine the CNN and a random parameter initialization approach was used to assure the network was simple to train and had rapid convergence in order to produce improved classification results. The simulation results show that the suggested multi-lead filtering algorithm reduces the loss of useful information while eliminating noise; at the same time, the convolutional neural network can effectively and accurately classify ECG images; and the introduction of residual network can improve the classification effect. Through simulation, it is illustrated that the reduction of features by fuzzy sets can improve the performance of ECG image classification.
Ontiveros et al. [28] presented two hybridization options for general type-2 FLS and the SVM for the categorization of ECG data. Adopting type-2 fuzzy logic in combination with SVM allows for the handling of uncertainty in real-world environments characterized by dynamic changes and many sources of uncertainty. Using benchmark databases, two techniques for universal hybrid type-2 fuzzy classifiers were developed. The first technique includes adding fuzzy rules to the SVM to enhance data separability. The second approach uses type-2 fuzzy classifier Sugeno coefficients as SVM optimum hyperplane membership. The advantage of the SVM of being robust and avoiding the problem of overfitting help this approach to be better than the orginal GT2 classifier and the increase of the dimensionality of the data helps this approach to overcome the SVM method. In addition, the hybrid SVM GT2 approach obtains better results with more percentage of training data (k=5 and k=10).
Lee et al. [29] presented an approach that combines LTP with a hybrid neural FLS and SOM. Utilizing three feature extraction approaches based on an LTP as a 1D-LGP and LNDP, they derived a multi-dimensional histogram feature. The SOM was then used to an FLS in order to increase classification performance and decrease classification time. Experimental results show the performances of the suggested method using 1DLGP + NF with 196 (14 by 14) feature dimensions as robust performance at 87% (sensitivity), 73.8% (positive predictivity), 1.1% (false positive rate), and 98.84% (accuracy). This study has a significant impact on heartbeat recognition methods, which are crucial functions in healthcare and medicine systems.
Muthuvel et al. [30] developed an optimum neuro-fuzzy classifier for determining whether an ECG signal is regular or irregular. The presented model involves feature extraction and classification using a neuro-fuzzy classifier. The heartbeat signals were first obtained via the physio-automated bank’s bank machine. Then, three kinds of characteristics were retrieved from each signal: Trispectrum-based characteristics, wavelet-based characteristics, Haar, and Morphological-based characteristics. After extracting the features, the best neuro-fuzzy classifier determined whether the heartbeat signals were regular or irregular. To train the neuro-fuzzy classifier, the ABC method was merged with the GA. The experimental results indicate that the suggested classification framework obtains an accuracy of 93%. Here, the suggested approach achieves more than 9% accuracy compared to the existing approaches. This is because of hybrid neuro-fuzzy classifier. This neuro-fuzzy classifier, eliminating limitation present in the individual classifier and utilize only the advantages of the classifier.
Proposed methodology
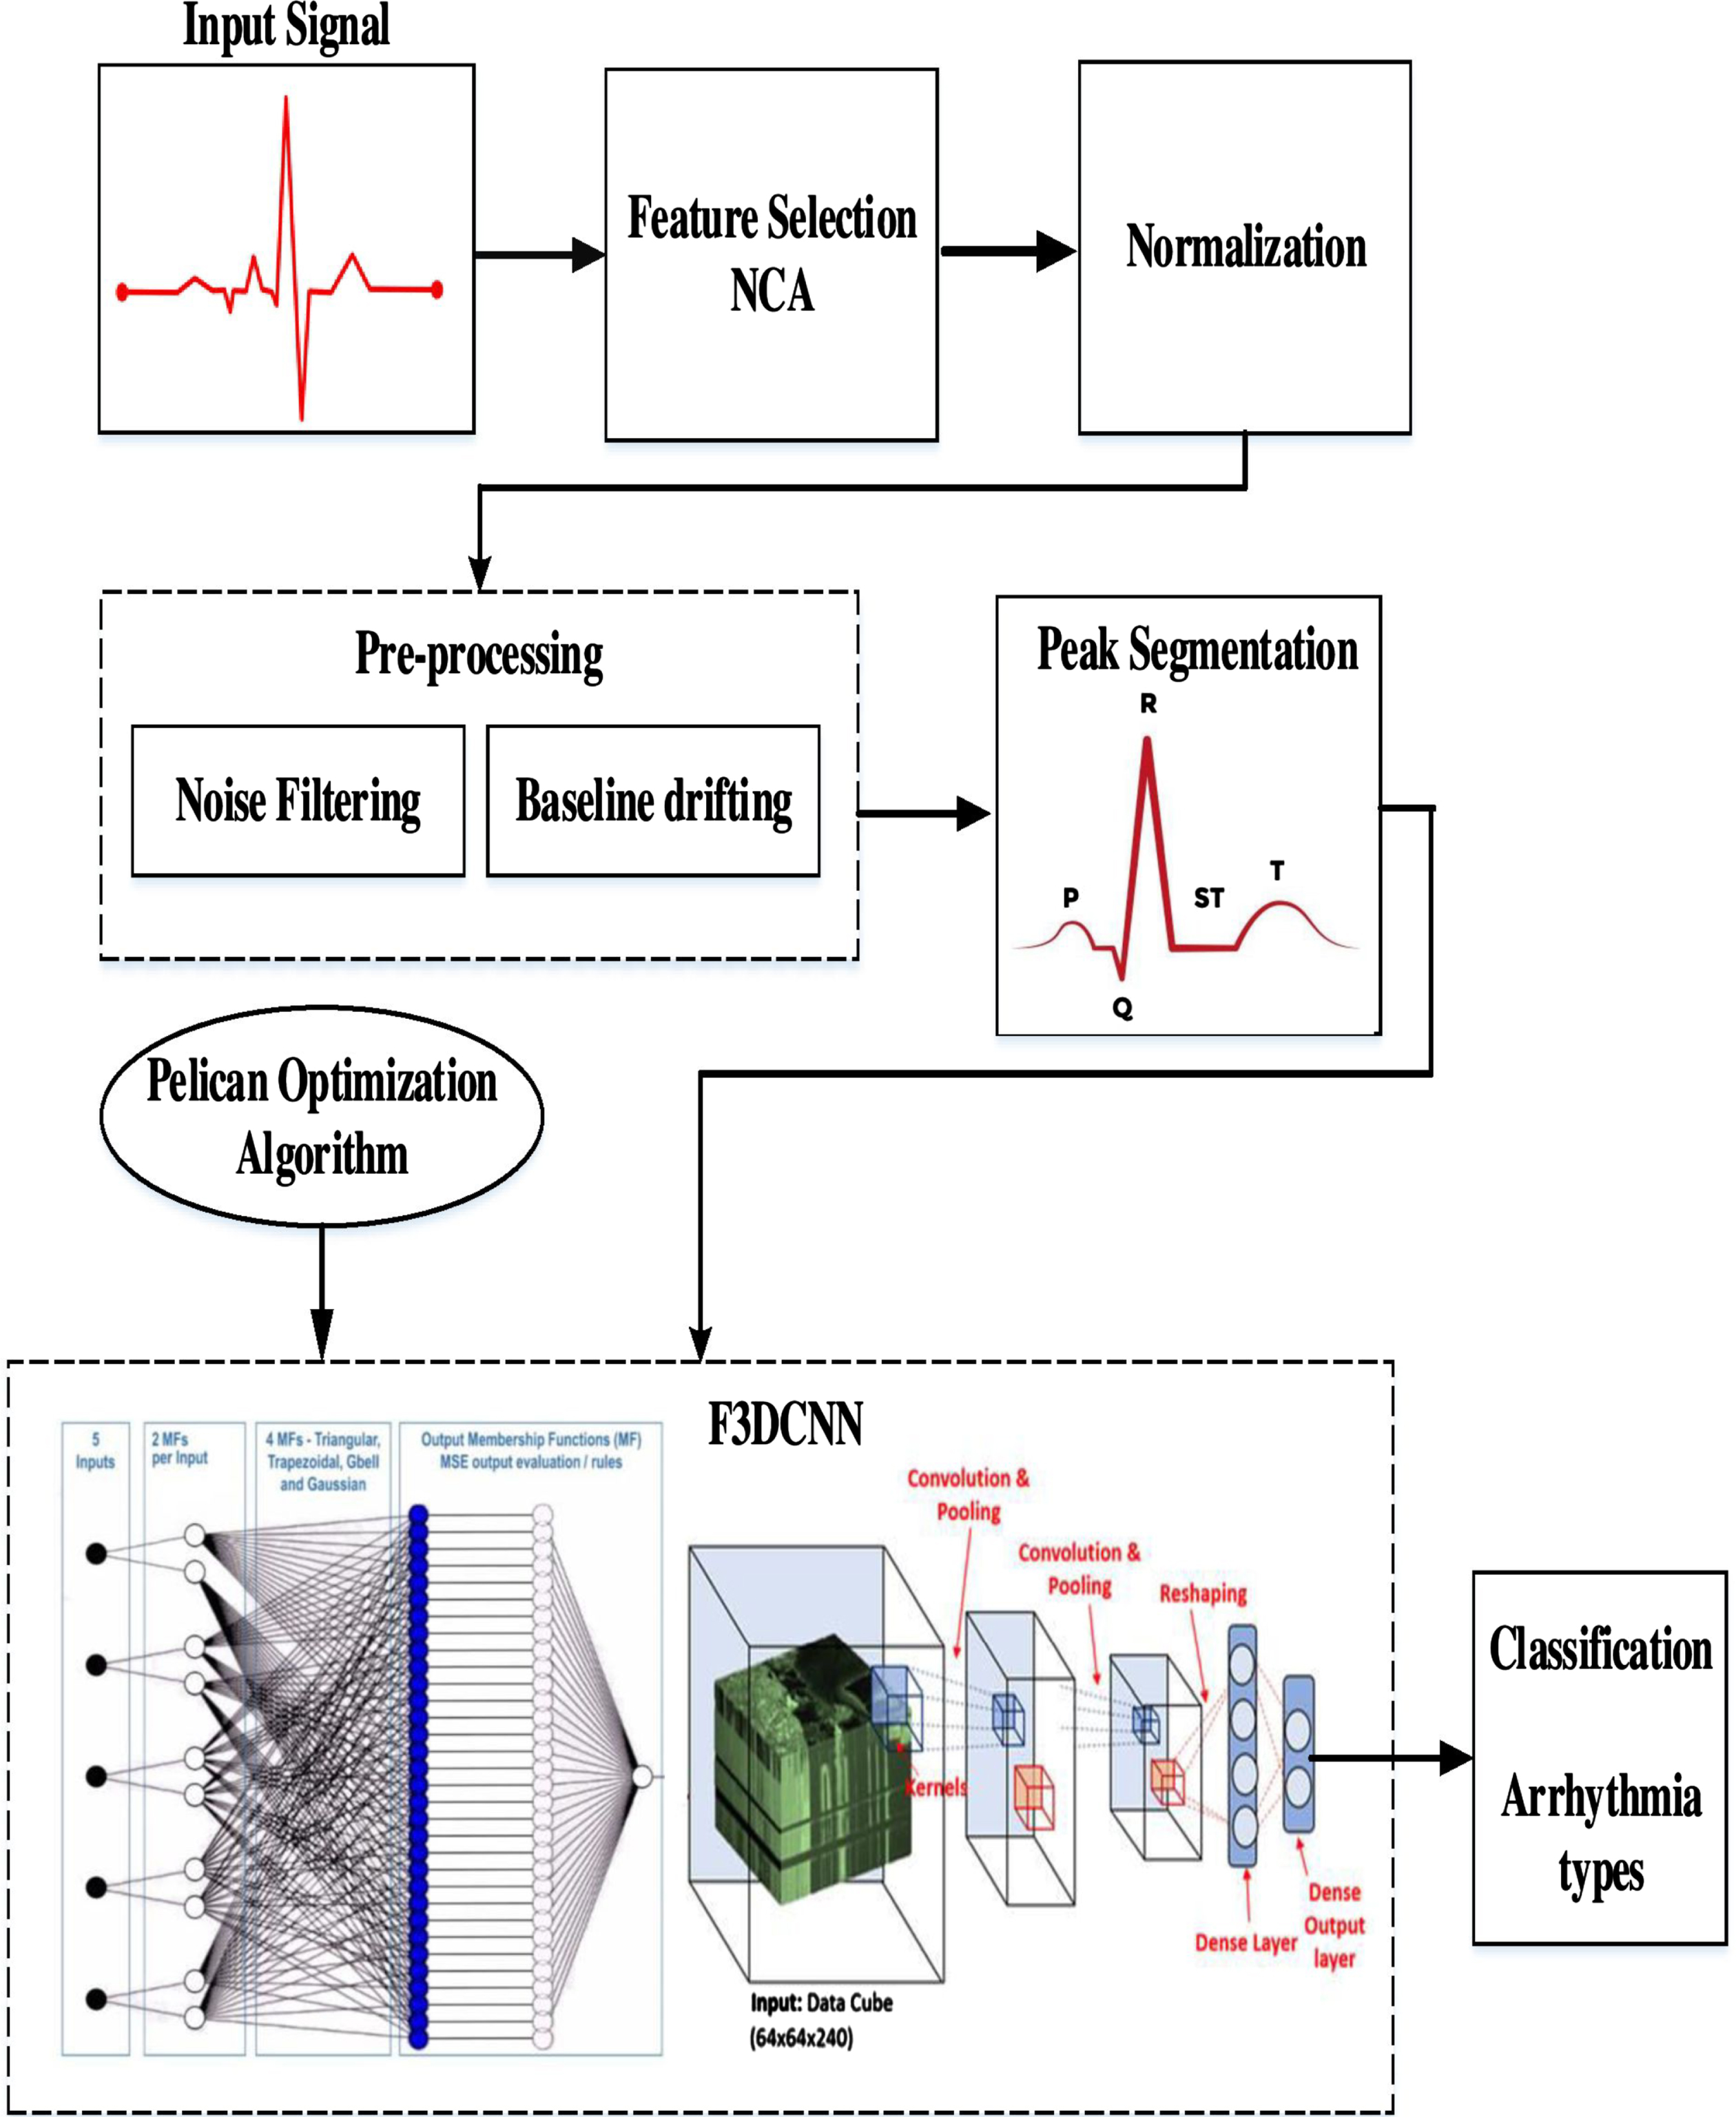
Figure 1 depicts the systematic setup of a DL system for the ECG-based arrhythmia classification. This critical examination consists of seven basic phases.
Initially, the ECG-based arrhythmia dataset (from MIT-BIH Arrhythmia Database and UCI-arrhythmia) is given as input. In step 2, the dataset is cleaned to remove any missing values and unusual occurrences. NCA-based [31] supervised FS approach is performed in step 3 to isolate high discriminant features to enhance the performance of classification. In the next step 4, the selected relevant features are normalized and preprocessed using DWT. Step 5 involves segmenting the preprocessed data and giving it as input to the Optimized Fuzzy based 3D-CNN classifier with a tenfold classification evaluation test. The statistical interpretation-based evaluation of the DL- algorithm has been done in step 6. The outcome of the proposed DL- algorithm is obtained in step 7.
Arrhythmia classification system.
The initial ECG database is obtained from the MIT-BIH arrhythmia database. The recording is processed at a rate of 360 samples per second per channel with a range of 10mv resolution.
The second database was collected from the Heart Disease Data repository at UCI (University of California-Irvine). Thirteen parameters, including AGE, SEX, RESTECG, OLDPEAK, CP, CA, THAL, TRESTBPS, EXANG, SLOPE, CHOL, FBS and THALACH are used to obtain this dataset.
Architectural details of 3D-CNN
The conventional 3D-CNN was utilized in the proposed methodology. The 3D-CNN framework consists of two convolutional, two max-pooling, and two fully connected layers. To mitigate the risk of overfitting throughout the training process, a compact architecture was utilized. The input of the first convolution layer was convolved with two kernels of size 3x3x16 (3x3 in spatial dimension and 16 in spectral dimension) and the second convolution layer was convolved with four kernels of size 3x3x16. The activation function used for the convolution output was Rectified Linear Input (RELU). The output of each convolutional layer underwent a 2x2x2 max-pooling operation. Following the initial max pooling operation, the dropout probability was 0.25. Subsequently, after the first fully-connected layer, it increased to 0.5. A dropout mechanism was employed during training to mitigate overfitting. The initial layer of the fully connected layer consists of 16 nodes. The output of the second fully-connected layer, consisting of two nodes, is subsequently inputted into a softmax layer [32].
Class balancing
There were 16 groups in the UCI dataset. The first group, called “class 01" was for regular heartbeats, and group 14 from “class 02" to “class 15" were for various kinds of irregular heartbeats. Also, the final group was called “class 16" and was composed of unclassified beats. There were 245 people in the regular group and 207 people in the abnormal group. About 0.33 % of these attributes had incorrect values. Here, utilized the average value for the same class of misvalued attributes in the related features. Also, some attributes in some categories did not have a clear value. In such circumstances, the misvalued characteristics were substituted with the average of all estimated average –values of those features.
Feature Selection
We use the NCA algorithm to identify the most pertinent features through feature selection and to conduct an efficient classification.The weights of each feature are computed using NCA. Then, the generated features are categorized by decreasing value, and the training phase calculates the most valuable indices. The calculated indices are saved for use in the phase of testing. The indices calculated during the feature selection phase of training are used to evaluate this model. NCA (Neighbourhood Component Analysis) was employed to select the most informative characteristics.
Generally, minimizing the number of features reduces the training time required to construct a classifier model and minimizes its complexity. FS is the process of choosing the most significant features before passing them to a classifier to generate an optimum result. As a consequence, the characteristics that are neither important nor relevant will be deleted or removed from the list.
Here, the discriminative attributes are selected from the space of input features employing a supervised learning approach termed NCA. They rank features using regularisation to develop feature weights for minimizing the average leave-one-out (LOO) classification loss on labelled training data.
The set of the training sample is represented as S ={ (a1, b1) , . . . (a n , b n ) , . . . (a N , b N ) },where the d-dimensional feature vector as an, appropriate class label as b n ∈{ 1, 2, . . . C }, the set of classes as C and the set of training samples as N. The objective of selecting attributes is for developing a weighting vector w which selects features by maximizing the classification of closest neighbours. It is expressed as:
where kernel function is and input parameter α. It impacts which points are chosen as reference points. The likelihood of accurately classifying value x i is:
NCFS (ɛ, η, α, γ, S)∥ɛ : small positive constantη : regularization parameterα : kernelwidthγ : initial step lengthS : traingset initialize: t = 0, ɛ(0) = - ∞ , w(0) = (1, 1, . . .1) Iterate: for i = 1 to N //Execution of step 5 Compute: p
ij
and p
i
with W(t) using Eq . (4) & (5) for i = 1 to d //Execution only step 7
t=t+1 w(t) = w(t-1) + γΔ ɛ(t) = φ (w(t-1)) if ɛ(t) > ɛ(t-1)) thenγ = 1.01γ else γ = 0.4γ Untill |ɛ(t) - ɛ(t-1)| < δ w = w(t) return w
Following the feature selection of relevant data, the ECG signals are normalised using the normalised bound to values between 0 and 1. Normalized bound adjusted the lower limit (lb) and upper limit (ub) of a signal’s amplitude to the required range without affecting the signal’s pattern or form. In the pre-processing phase of this research, the lower limit (0) and higher limit (1) were used to obtain the data. Following is the mathematical function of normalization with a normalised bound:
t mid is the mid point of input signal
Feature selection is commonly used to diminish the dimensionality of data by choosing a subset of features from high-dimensional feature sets. This process is typically performed before preprocessing. Feature selection involves eliminating irrelevant features from a dataset in order to enhance the performance of a given task. Feature selection is valuable for reducing data dimensionality, enhancing classifier performance, and improving predictive accuracy. Including irrelevant features can introduce noise and obscure relevant features, making feature selection even more important. Reducing the dimensionality of the data leads to improved computational efficiency. The primary objective of feature selection is to choose a subset of features that minimises computational costs and eliminates irrelevant features that could negatively impact model performance.
To effectively categorize the normalized signals, the ECG data must be de-noised owing to the existence of high-frequency and baseline wander disturbances. These disturbances are very dominant and may modify the ECG’s characteristics, leading to an inaccurate diagnosis of arrhythmia. Numerous approaches, including discrete wavelet transform (DWT), moving average filtering, least-mean-square filtering, low-pass filtering, and so on, can be employed to eliminate high-frequency disturbances. DWT is used for feature extraction and feature reduction to enhance arrhythmia classification. In the latest studies, non-stationary ECG signals are de-noised using DWT. A distinguishing aspect of wavelet transformation is that it allows high-resolution signal processing while examining the local features. The ECG signal is decomposed by DWT into approximated signals. Its main goal is to analyze high-resolution data from various frequency bands. In the procedure, HPF and LPF are used. The continuous wavelet transform (CWT), generally known as DWT, is shown below:
The concept of DWT depends on two premises: a = 2-sl and b = 2-s
Where Shifts are described by ’l’ and scale is denoted by
By applying LPF and HPF to a given signal, DWT decomposes the signal. The mathematical explanation of signal decomposition expressed as,
Input:S→ECG signal N→Level db4 → Wavelet family Output: coefficients→ (c, l) ofECGsignals Calculate the size of the input signal S
z
=size(S) // indicates the size of the input For each m in S
z
Indicate low-pass and high-pass filters c=LPF(S,2,N,db4) // indicates a low pass filter l=HPF(S,2,N,db4) // indicates a high pass filter End for Return: Coefficients (c,l) of ECG signals (S)
The technique described above divided the number of instances into distinct frequency bands. It is generated by filtering the time domain signal using HPF and LPF in sequence. Finally, an ECG noise coefficient has been established. In addition, a high-pass Butterworth filter with an order of 3 and a cut-off frequency of 1 Hz is employed to reduce the residual baseline drifting of the ECG signal. Figure 4c and 4d shows the results of the pre-processing phase.
Normalization is the process for storing non-redundant and consistent data. Reduce data redundancy and inconsistency. Normalisation is used in conjunction with the Preprocessing algorithm to enhance the image quality, thereby providing a solid foundation for the feature extraction.
To obtain fixed-length feature vectors from pre-processed ECG data, heartbeat segmentation requires two additional procedures. To retrieve a complete pulse from an ECG signal, it is necessary to first define an entire heartbeat and then segment it. Typically, a heartbeat consists of P-wave, QRS complex, and T-wave. HRV analysis of the ECG data requires the identification of the QRS complex employing the complex wave of the peak detection method. In the QRS complex, the R wave has the greatest or lowest value in the QRS wave detection technique. The normal rhythm of the ECG signal is noted to have P-wave, QRS-complex, and T-wave patterns at regular time intervals. In the irregular instance, however, the ECG signal displays arrhythmia wave patterns and fluctuations in heart rate. Figure 4(e) shows the segmented heartbeat signal.
Feature extraction and classification
The hybrid intelligence system comprises a three-dimensional neural network (3D-CNN) and a fuzzy interface system for various forms of arrhythmia. The newly optimized Fuzzy Logic System and 3D-CNN architecture combine the characteristics of FNN and 3D-CNN. It combines fuzzy-based categorization with the fuzzy layer. This approach combines the benefits of network designs with fuzzy logic. There are four sorts of layers in the proposed architecture: i) convolutional layer, ii) pooling layer, iii) fuzzy layer, and iv) fuzzy classifier.
To identify the ECG signal, features are derived based on peak detection. Extracted characteristics include PRV, PTT, root mean square, standard deviation and mean.
PTT - Time for the arterial pulse pressure wave to travel from the aortic valve to the periphery.Eqn (14) is used to compute.
Where elastic modulus as E, vessel wall thickness as h, the inner radius of the vessel as r, blood density as ρ
PRV –The medium amplitude point is the fiducial point for PRV in PPG for each pulse in PPG for each pulse ηMi*
Where, RMSSD Root mean square of successive NN intervals.
It is common to record the ECG using standard measurements for the electrical signal’s amplitude and periodicity after extracting the ECG patterns. On an ECG, the amplitude, or voltage, is shown in the vertical direction and is represented in millivolts (mV).
Here, 3D CNN structures are used to learn ECG characteristics based on temporal, spectral and spatial aspects. The proposed network is composed of convolutional and max-pooling layers with a 3×3×3 kernel size. Every input sample consists of a 30-frame ECG cube sequence. First, all ECG cubes are set in the 3D convolutional layer in order to understand the spectral and spatial features of the 3D kernels. Each 3D convolutional operation in this instance comprises two sequential layers. The model trains the power spectral distributions in the spatial domain using the 2D convolutional layer, and then the 1D convolutional layer is used to train from the spectral domain. Following all convolutional layers and max-pooling layers, a reshape layer converts each frame’s output into a 1D vector with a length of 1728 (3×3×3×64). The ECG features from 0 ms to 1000 ms are represented by 20 vectors that this structure ultimately generates. The Fuzzy Neural Network (FNN) structure is then utilized to learn the temporal properties of the ECG after learning the information from the spectral and spatial domains. Following the convolutional layers, 3 × 3 × 3 pixel strides and max-pooling layers with a3 × 3 × 3 pooling window are used. The 16-neuron fully connected layer obtains the pooled output of the sixth convolutional layer. The following formula is used to compute the 3D convolution process mathematically
A FLS facilitates the translation of inputs to outputs using established fuzzy rules. The knowledge support contains if-then rules that signify the connection between the fuzzy groups of input and output. The inference system is improved by a series of operations including
Generating fuzzy rules. Fuzzify input values according to the degree membership. Combining fuzzy input with fuzzy rules to increase the strength of rule. Finally, the output is defuzzified to provide output as a crisp value.
Membership function
Membership Function(MF) transforms the input data into a value of membership (or membership degree) between 0 and 1. The triangle membership approach is chosen to transform input data into fuzzy values. The analysis of membership values is based on the following premise, which is depicted below.
The development of fuzzy rules is a crucial task that helps to map the input to its corresponding output. If A1, A2,..., AN are the characteristics and C1 are C2 are the class labels, then linguistic values such as high, medium, and low may be used to formulate a fuzzy rule. The variables N and M represent the number of features and groups, respectively.
Therefore the fuzzy rule can be expressed as
If A1 is higher and A2 is lower and A3 is medium then the group is C2. If A1 is higher and A2 is medium and A3 is lower then the group is C2. If A1 is lower and A2 is medium and A3 is medium then the group is C1.
A dropout regularisation with a dropout ratio of 0.25 was applied to the output of the maximum pooling layer in the proposed research, and a probability of 0.50 was applied to the fuzzy layer.The proposed model has an excessive number of trainable parameters and will take more time to train because of the 3D convolution. As a result, since manually experimenting with different values takes time, it is necessary to use nature-inspired algorithms for the optimisation of hyper-parameters in order to quickly reach their global value. Our POA-based optimization method is effective and yields a limited set of values for testing with the proposed model.
F3DCNN-POA model
This section proposes an optimum model between a hybrid fuzzy logic system and a 3-dimensional convolutional Neural Network (F3DCNN) with the POA approach. POA is used to choose the optimal parameters for the various membership functions of the developed fuzzy model.
Inspiration and hunting behavior of the pelican
Pelicans use their lengthy beaks and large neck pouches to catch and swallow prey. They enjoy social interaction and dwell in large groups of several hundred pelicans [30]. Pelicans weigh between 2.75 and 15 kilogrammes, have a height between 1.06 and 1.83 meters, and have a wing span between 0.5 and 3 metres. Pelican food is comprised of fish and, less frequently, turtles, frogs and crabs; if it is really hungry, it will also consume shellfish. Pelicans often hunt in groups. After recognizing the location of their prey, pelicans dive from a height of 10 to 20 metres to capture it. There are additional species that hunt at lower elevations. The birds stretch their wings over the water to lure fish into shallower water, making trap easier. Pelicans lift their heads forward before eating a fish to remove excess water from their beaks.
The sophisticated behaviour and technique used by pelicans during hunting have enabled them to become excellent hunters. The framework of the system POA was mostly inspired by the modelling of the aforesaid approach.
Mathematical modelling of POA
POA is a nature inspiration-based algorithm that includes pelicans as population members. Every population member represents a possible solution. Every member of the population suggests values for the optimal problem variables based on their location within the search area. Initial population members are generated in random based on the problem’s bottom and upper bounds by Equation (21).
Every row of this matrix offers the proposed solution, and each column contains problematic factors.
Every individual of the suggested POA population is a pelican, that is a member solution to the specific issue. Consequently, the fitness function of the given issue may be assessed in view of each prospective solution. In Equation (23), the goal function vector is used to determine its values.
To update candidate solutions, the proposed algorithm replicates the behaviour and tactics of pelicans while attacking and capturing prey. This approach for hunting is replicated in two phases:
Exploration phase - Approaching a target Exploitation phase - Winging on the water surface
Initially, the pelicans detect the position of their target and then travel in that direction. The monitoring of the search area and exploration capabilities of the proposed algorithm in finding various portions of the search area is made possible by modelling this pelican’s approach. Significance in POA is the random generation of the prey’s position inside the search area. This enhances the exploratory capability of POA in the precise area for problem-solving space. In Equation (24), the pelican’s approach to its target is represented mathematically.
The proposed algorithm allows a new pelican position if the fitness function is increased. Effective updating prevents the algorithm from reaching suboptimal areas. Using Equation (25), this procedure is modelled as:
Secondly, Pelicans spread their wings on the water’s surface to drive the fish upward, then trap it in their neck bag. This method increases the number of fish captured by pelicans in the region under attack. Modelling this pelican behaviour allows the proposed algorithm to converge on better hunting locations. This procedure enhances the local search capability and exploitation capacity of POA. Mathematically, the programme must investigate the points around the pelican site in order to converge on a superior option. This pelican hunting behaviour is mathematically represented in Equation (26)
Here,
At this point, effective updating are employed to reject or accept the new pelican location, as represented in Equation (27).
The objective function for precision will assess the FLS-POA model with each parameter settings. Using the new population status and the values of the fitness function, the best candidate solution based on the first and second phases are updated. For determining the optimum parameters, the POA based on Equations (24)-(27) is repeated until the whole execution has been completed. The final crisp value of the FLS model’s output is computed by merging the matching outputs of M rules. This accurate output value will represent the final expected value.
Training the F3DCNN model using POA
This section explains the best strategy based on the fuzzy logic system and POA (FLS-PSO). Each of the aforementioned factors may be regarded a population member. Each member will hold the location and velocity of their movement within the search space. The POA will terminate once the member’s location is optimum or if the required number of loops is reached. FLS-POA is used for predicting.
In this work, the FLS is constructed using Gaussian functions. It can be observed that the parameters i j, and k describe the Gaussian membership function. Each member’s initial position in the group was established at the moment of group formation. Each particle’s location will be constrained by the search space
The training will conclude after the highest number of iterations has been obtained and the optimization procedure has been completed. The optimal location of the swarm is obtained by minimizing the detection error rate and complexity time. The completed model is then tested using validation data sets to check its correctness before being used to prediction.
All experiments were conducted using Matlab on a personal computer with an Intel(R) Core i5-7500 processor (3.30 GHz) and 32 GB of RAM. The proposed approach was evaluated on each data class from the MIT-BIH and UCI arrhythmia datasets throughout implementation. The experiment employs a ten-cross-validation approach.
Dataset description
MIT-BIH arrhythmia dataset-D1
This article uses the MIT-BIH Arrhythmia dataset [36]. The collection includes 30-minute ECG recordings from 48 people, 25 women and 22 men. Two of the 22 recordings are from the same male individual. Every record consists of two lead signals: the top signal is a modified limb lead II (MLII) recorded by resting a lead on the chest, and the bottom signal is often a modified lead V1, sometimes a modified lead V2 or V5, and occasionally a modified lead V4. Upper signal MLII accommodates QRS patterns, and the dataset is classified into five arrhythmia classes. Premature ventricular contraction, Right bundle branch block beat, Atrial premature beat, Left bundle branch block beat and Normal are shown visually in Fig. 2. The annotations PVC, APB, RBBB, LBBB and NSR represent the classes. For MIT-BIH Arrhythmia Dataset”?D1, 44194 samples are used for training and for 3218 samples are used for testing. Details on the distribution of subclasses are presented in Table 1.
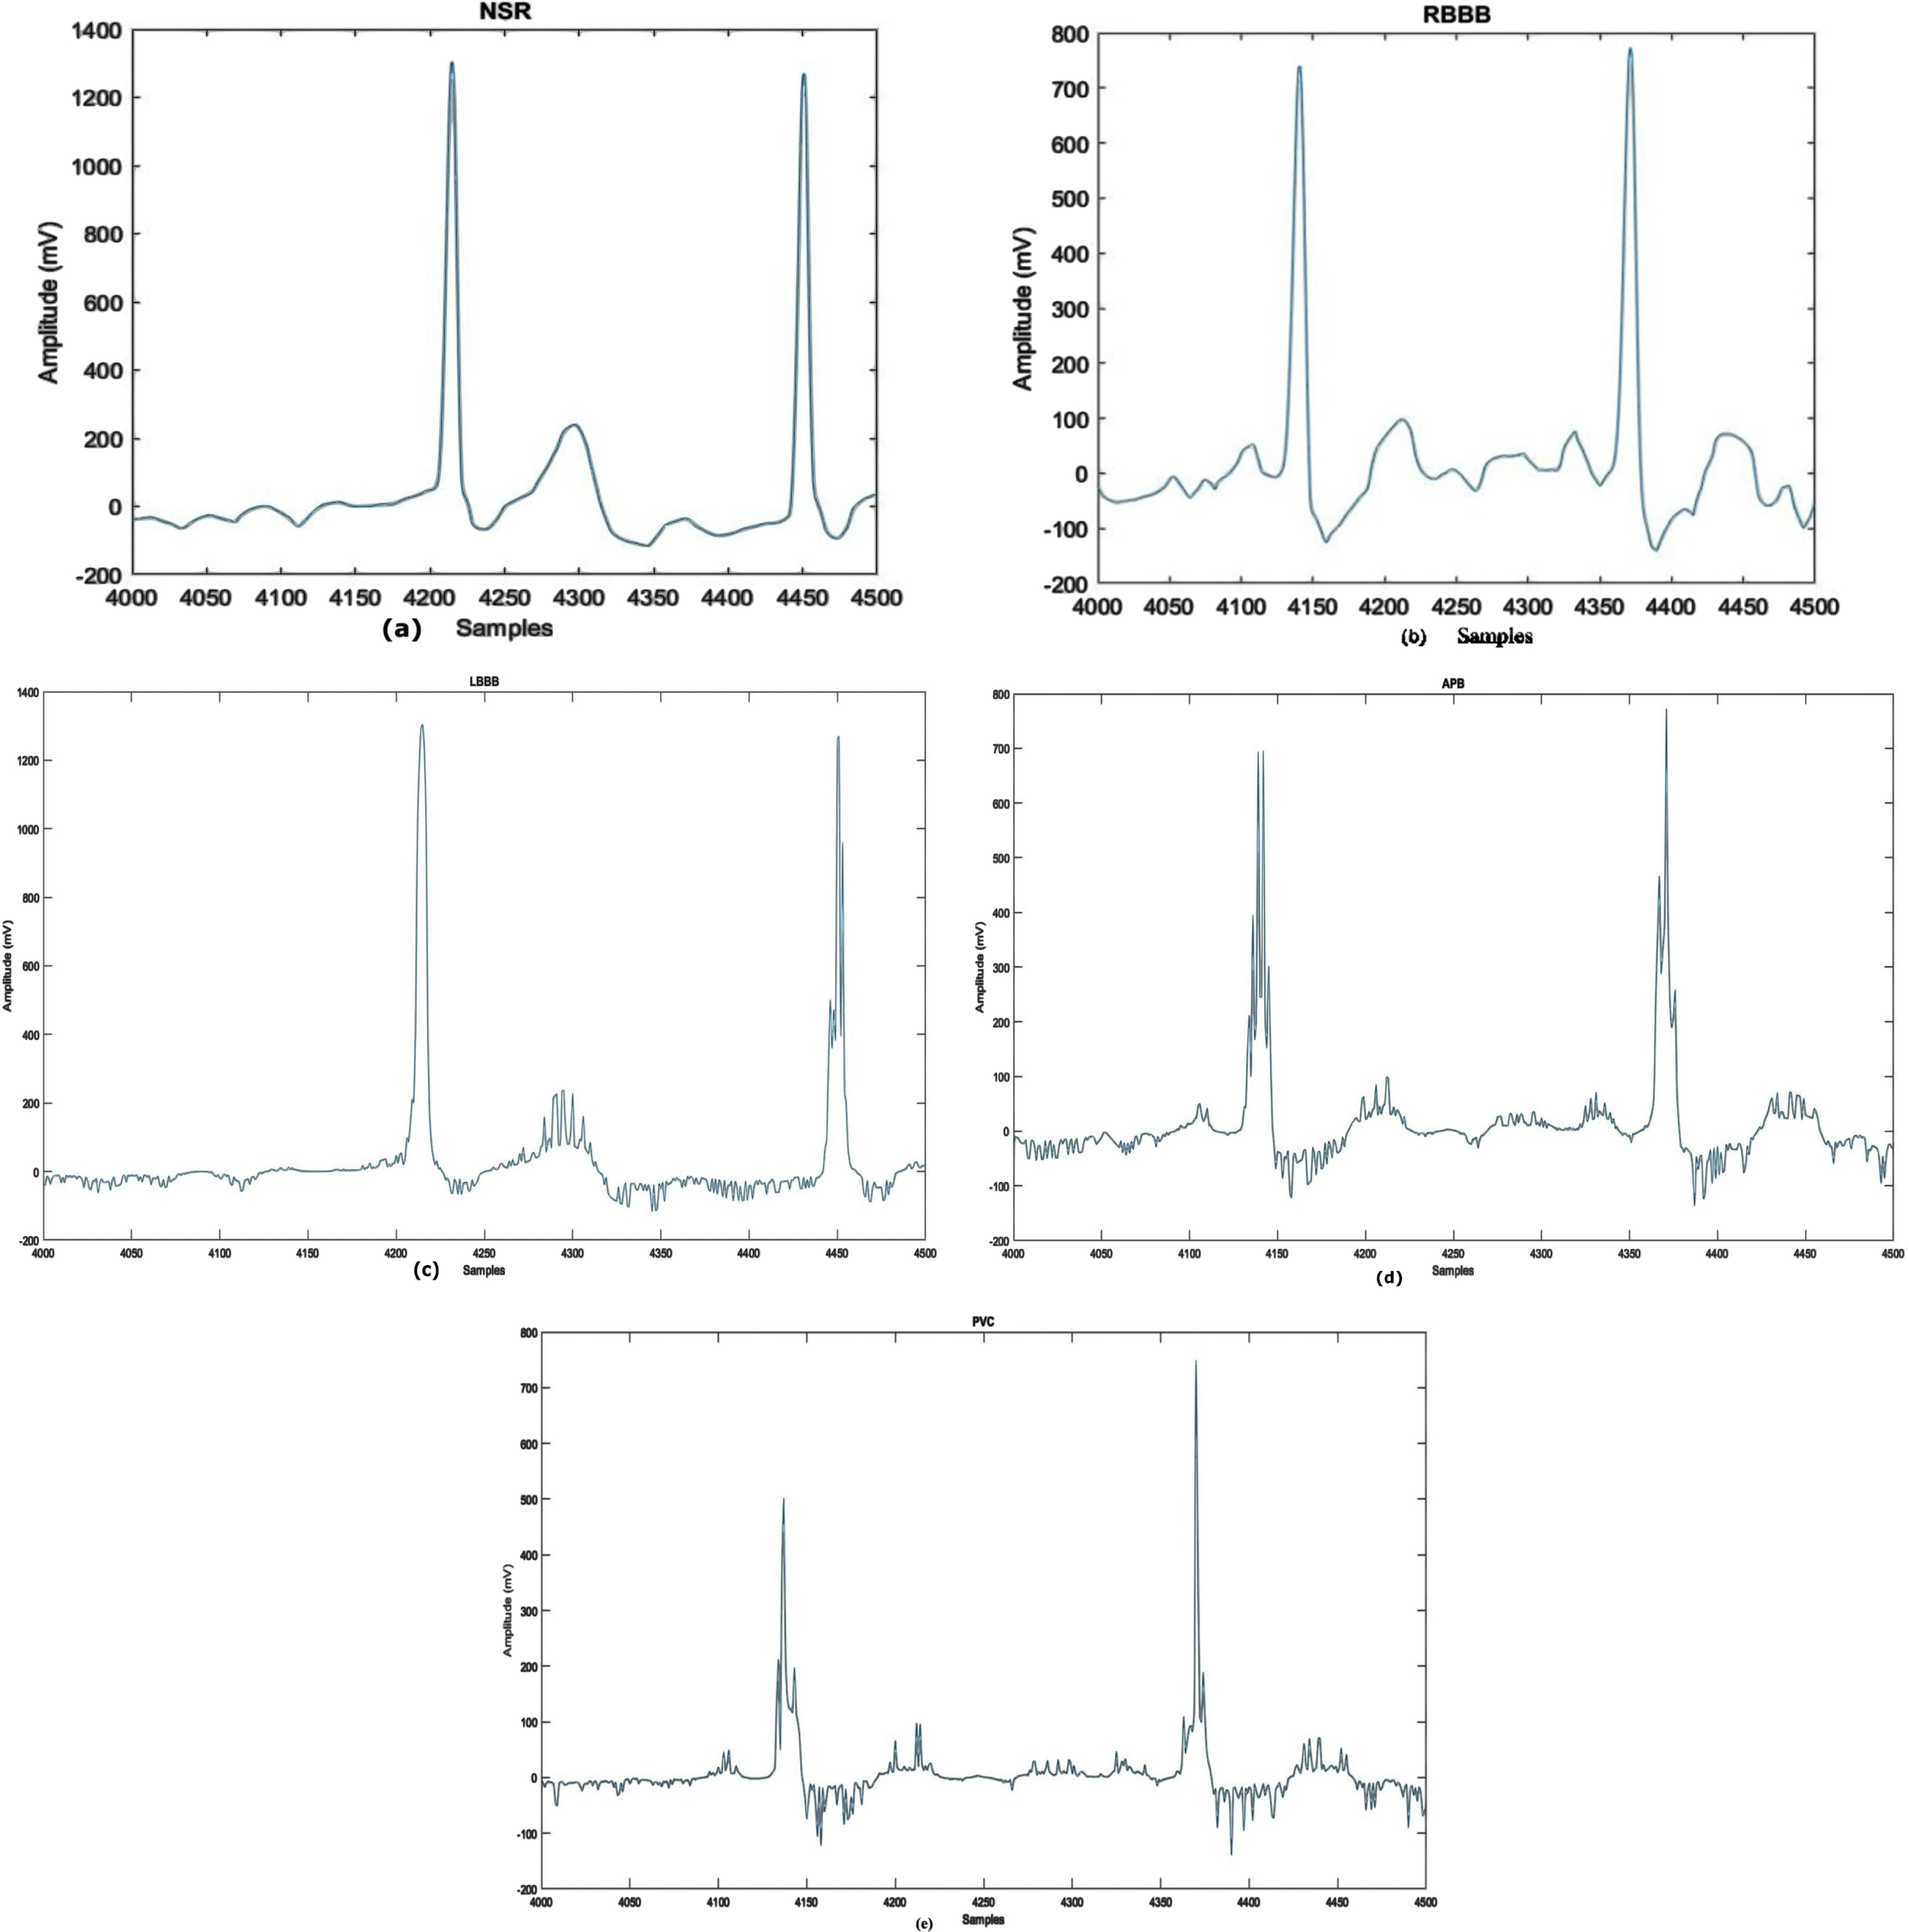
Waveforms of Arrhythmia Types: a) NSR b) RBBB c) LBBB d) APB e) PVC.
Categories of arrhythmia evaluated in the research and its data distribution
The UCI Machine-learning arrhythmia dataset [38] comprises 452 samples representing 13 heart signals. In this dataset, ’occurrences’ refers to individual patient records. 203 cases include male patients, while 249 involve females. A single instance accumulates 279 attributes, including RR interval, PR interval, age, sex, heart rate etc., with the final feature being signal class. Table 2 shows subclass distribution. Sample arrhythmia types are seen in Fig. 3.
The ecg signal example from the uci arrhythmia database
The ecg signal example from the uci arrhythmia database
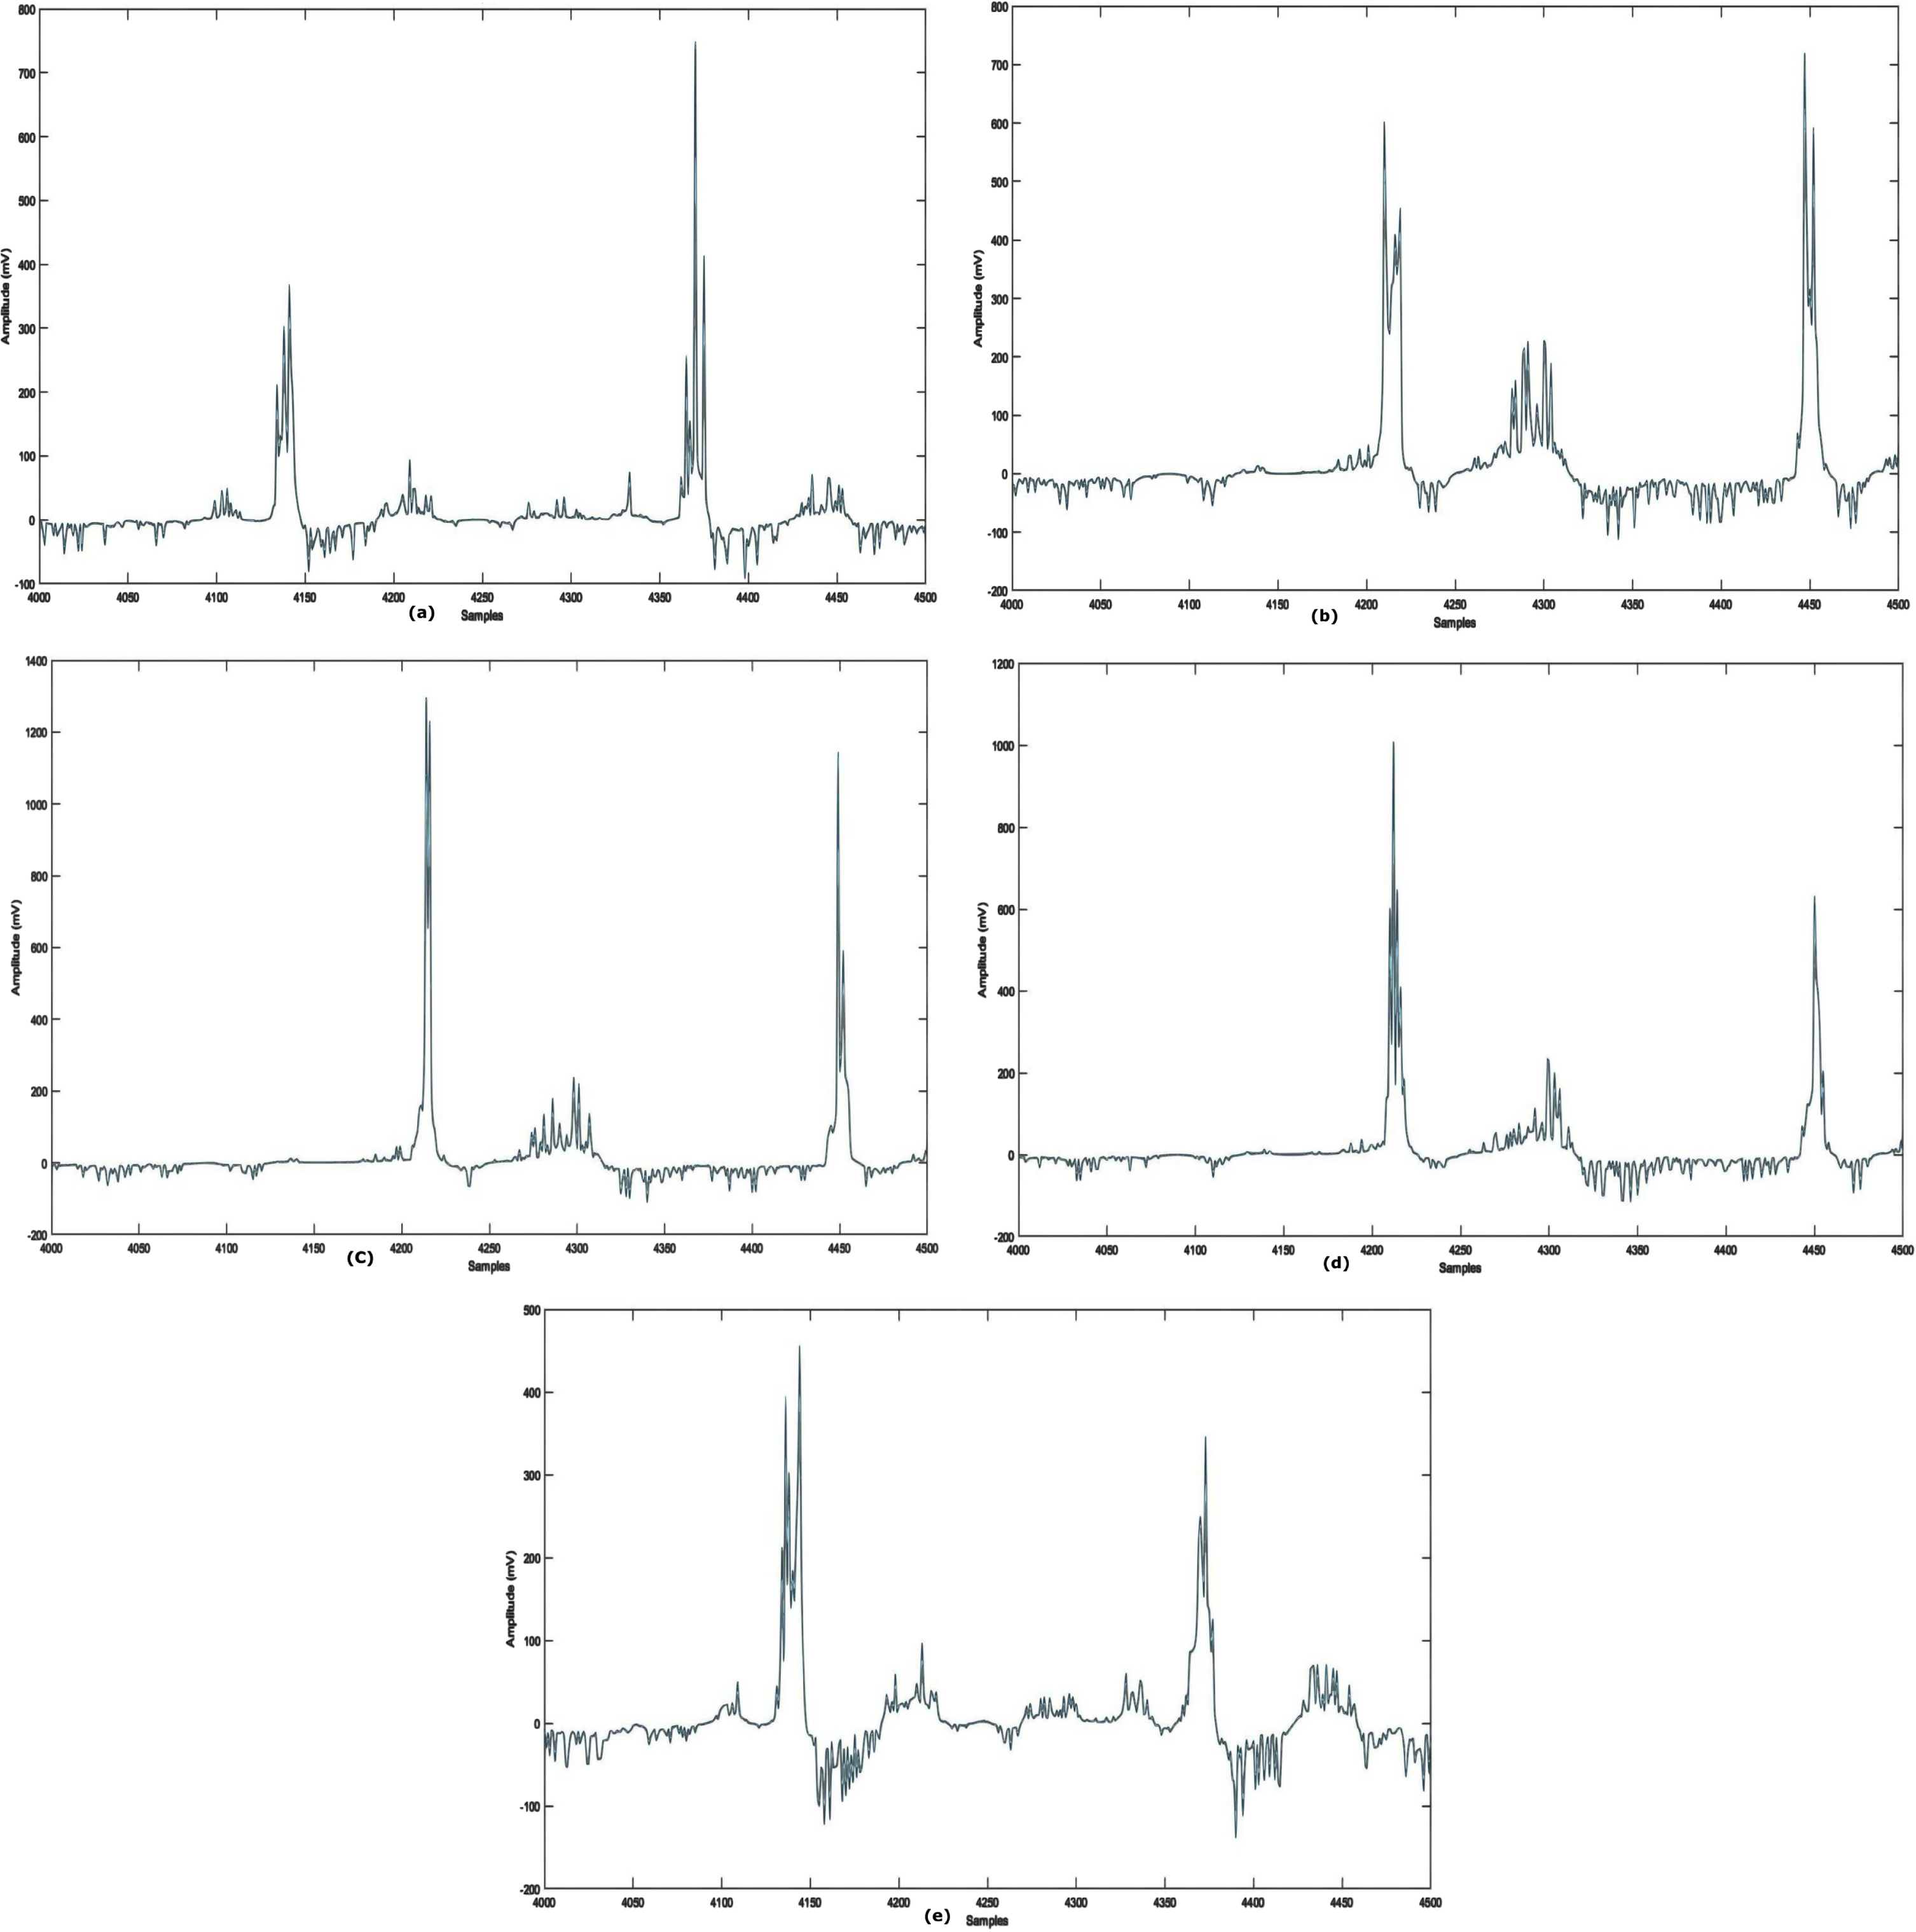
Waveforms of Arrhythmia Types: (a) N (b) R (c) L (d) AM(e) IC.
The proposed fuzzy-based model consists of two phases: training (the training data are split into five sections for cross-validation) and testing. The training phase comprised 75% ECG signals, whereas the testing phase contains 25% ECG signals. Small batch stochastic POA is used to improve the 3D-CNN during model training. There are 101 training steps, 16 batches, an initial learning rate of 0.001 and a learning rate attenuation factor of 0.1 for every 3000 iterations. 0.9 was the exponentially weighted average.
Performance measure
The performance of the novel model is assessed using various measures, including recall, accuracy (ACC), precision (PRE), and F1-Score. ACC is measured by dividing accurately categorized ECG beat pictures by total test images. In the case of imbalanced labeled testing and training sets, accuracy-based ML and DL performance evaluations are unsatisfactory. Evaluations contain more performance metrics. REC measures predicted an actual positive rate, whereas SPE measures predicted a true negative rate. PRE is the ratio of accurately classified actual positives. F1-Score is calculated by averaging harmonic means of PRE and REC. The calculation for these performance measures is as follows:
FPs are based on the set of test cases for different classes but are improperly assigned to the real class, whereas FNs relate to the set of test cases for the actual class but are incorrectly allotted to other classes. TPs reflect the number of accurately recognized test samples, whereas TNs represent the number of appropriately predicted test samples.
In the dataset, the normalized signals are collected with EMG, power-frequency, and other interferences known as noise. For the exact diagnosis of abnormal heart signals, such interferences can be removed from the data. The ECG rhythms were de-noised using DWT-based de-noising before the sample was fed to the model. The de-noising filter decreases the QRS complex’s signal distortion.
Figure 4(a-e) displays the example of the input signals before and after the reduction of noises.
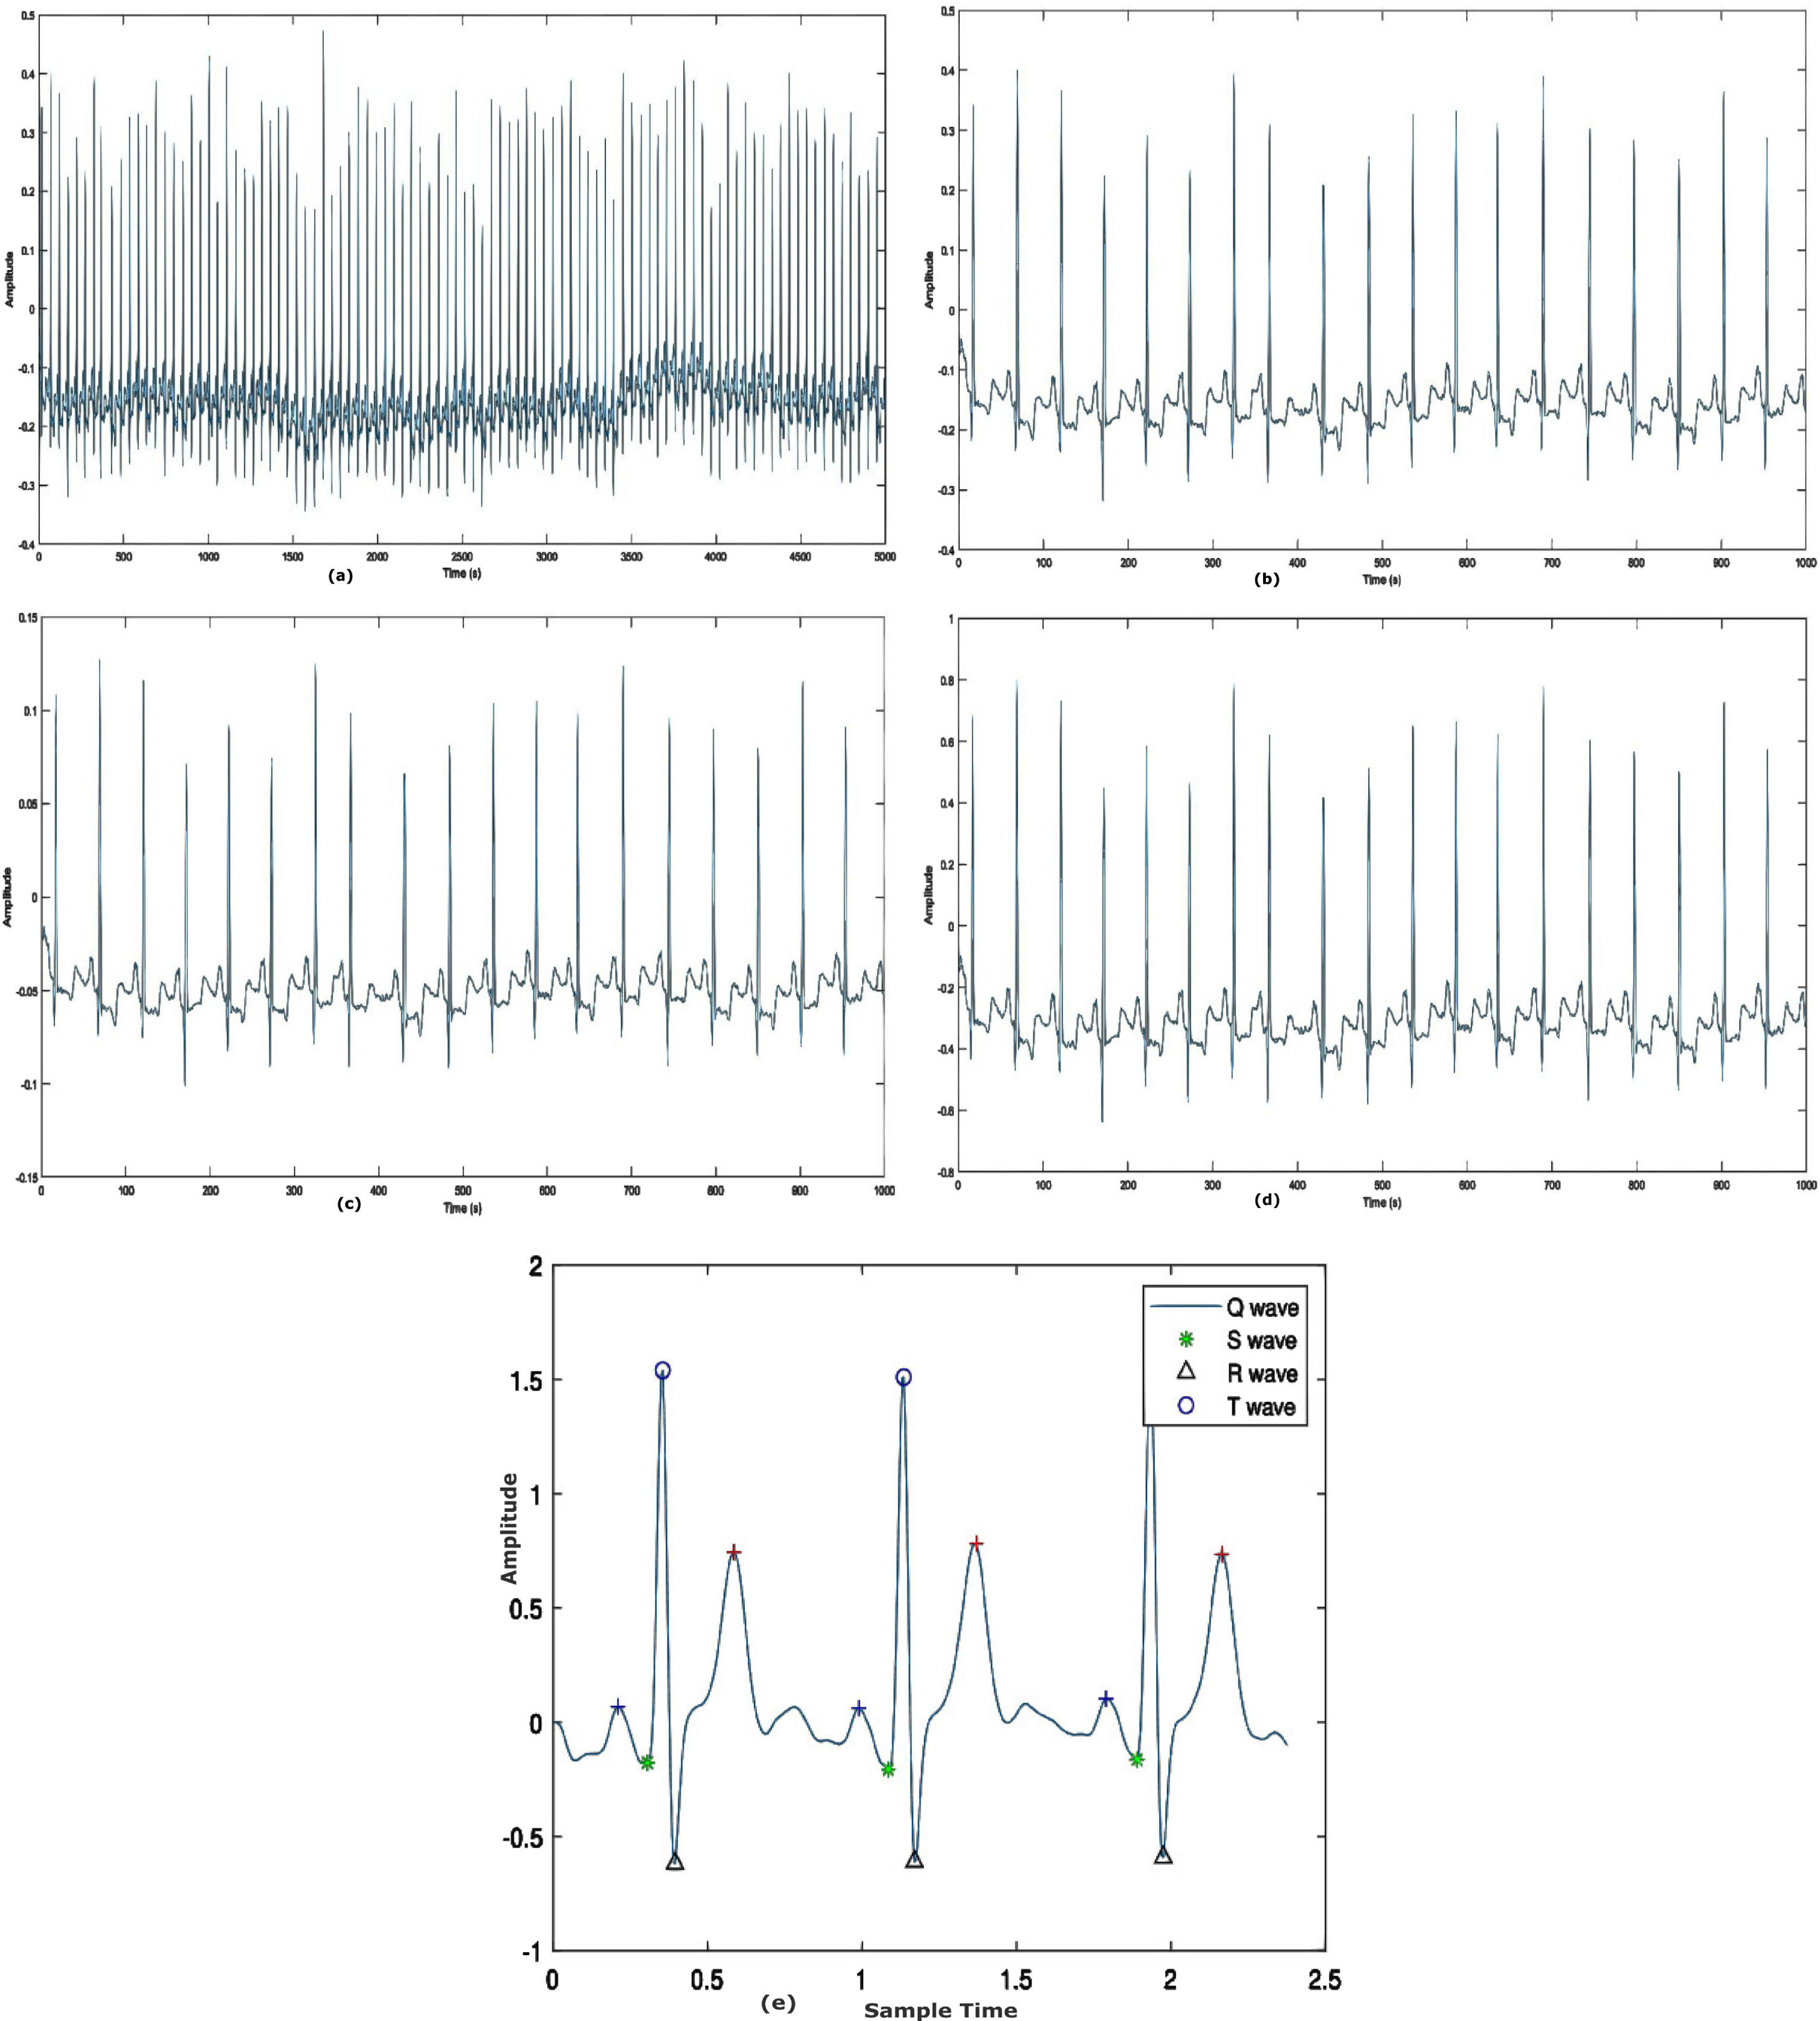
Results of pre-processing stage a) raw ECG record b) Normalized signal c) Signal filtering d) Baseline wander correction e) Segmented heart beat.
The developed model’s performance is illustrated in detail using a confusion matrix for five classes. It indicates the number of true positives (TPs), true negatives (TNs), false positives (FPs), false negatives (FNs), and as well as the size of the test sample. After calculating the confusion matrix, the five evaluative metrics listed above are generated. The diagonal elements reflect classes that have been successfully categorized, whereas anything off-diagonal denotes classes that have been incorrectly classified. The outcome is seen in Figs. 5 and 6. The confusion matrix for the categorization of five classes is shown in Fig. 5, whereas Fig. 6 depicts the confusion matrix for the classification of thirteen classes. Figures 5 and 6 show the model’s accuracy in predicting five and thirteen ECG arrhythmia types.
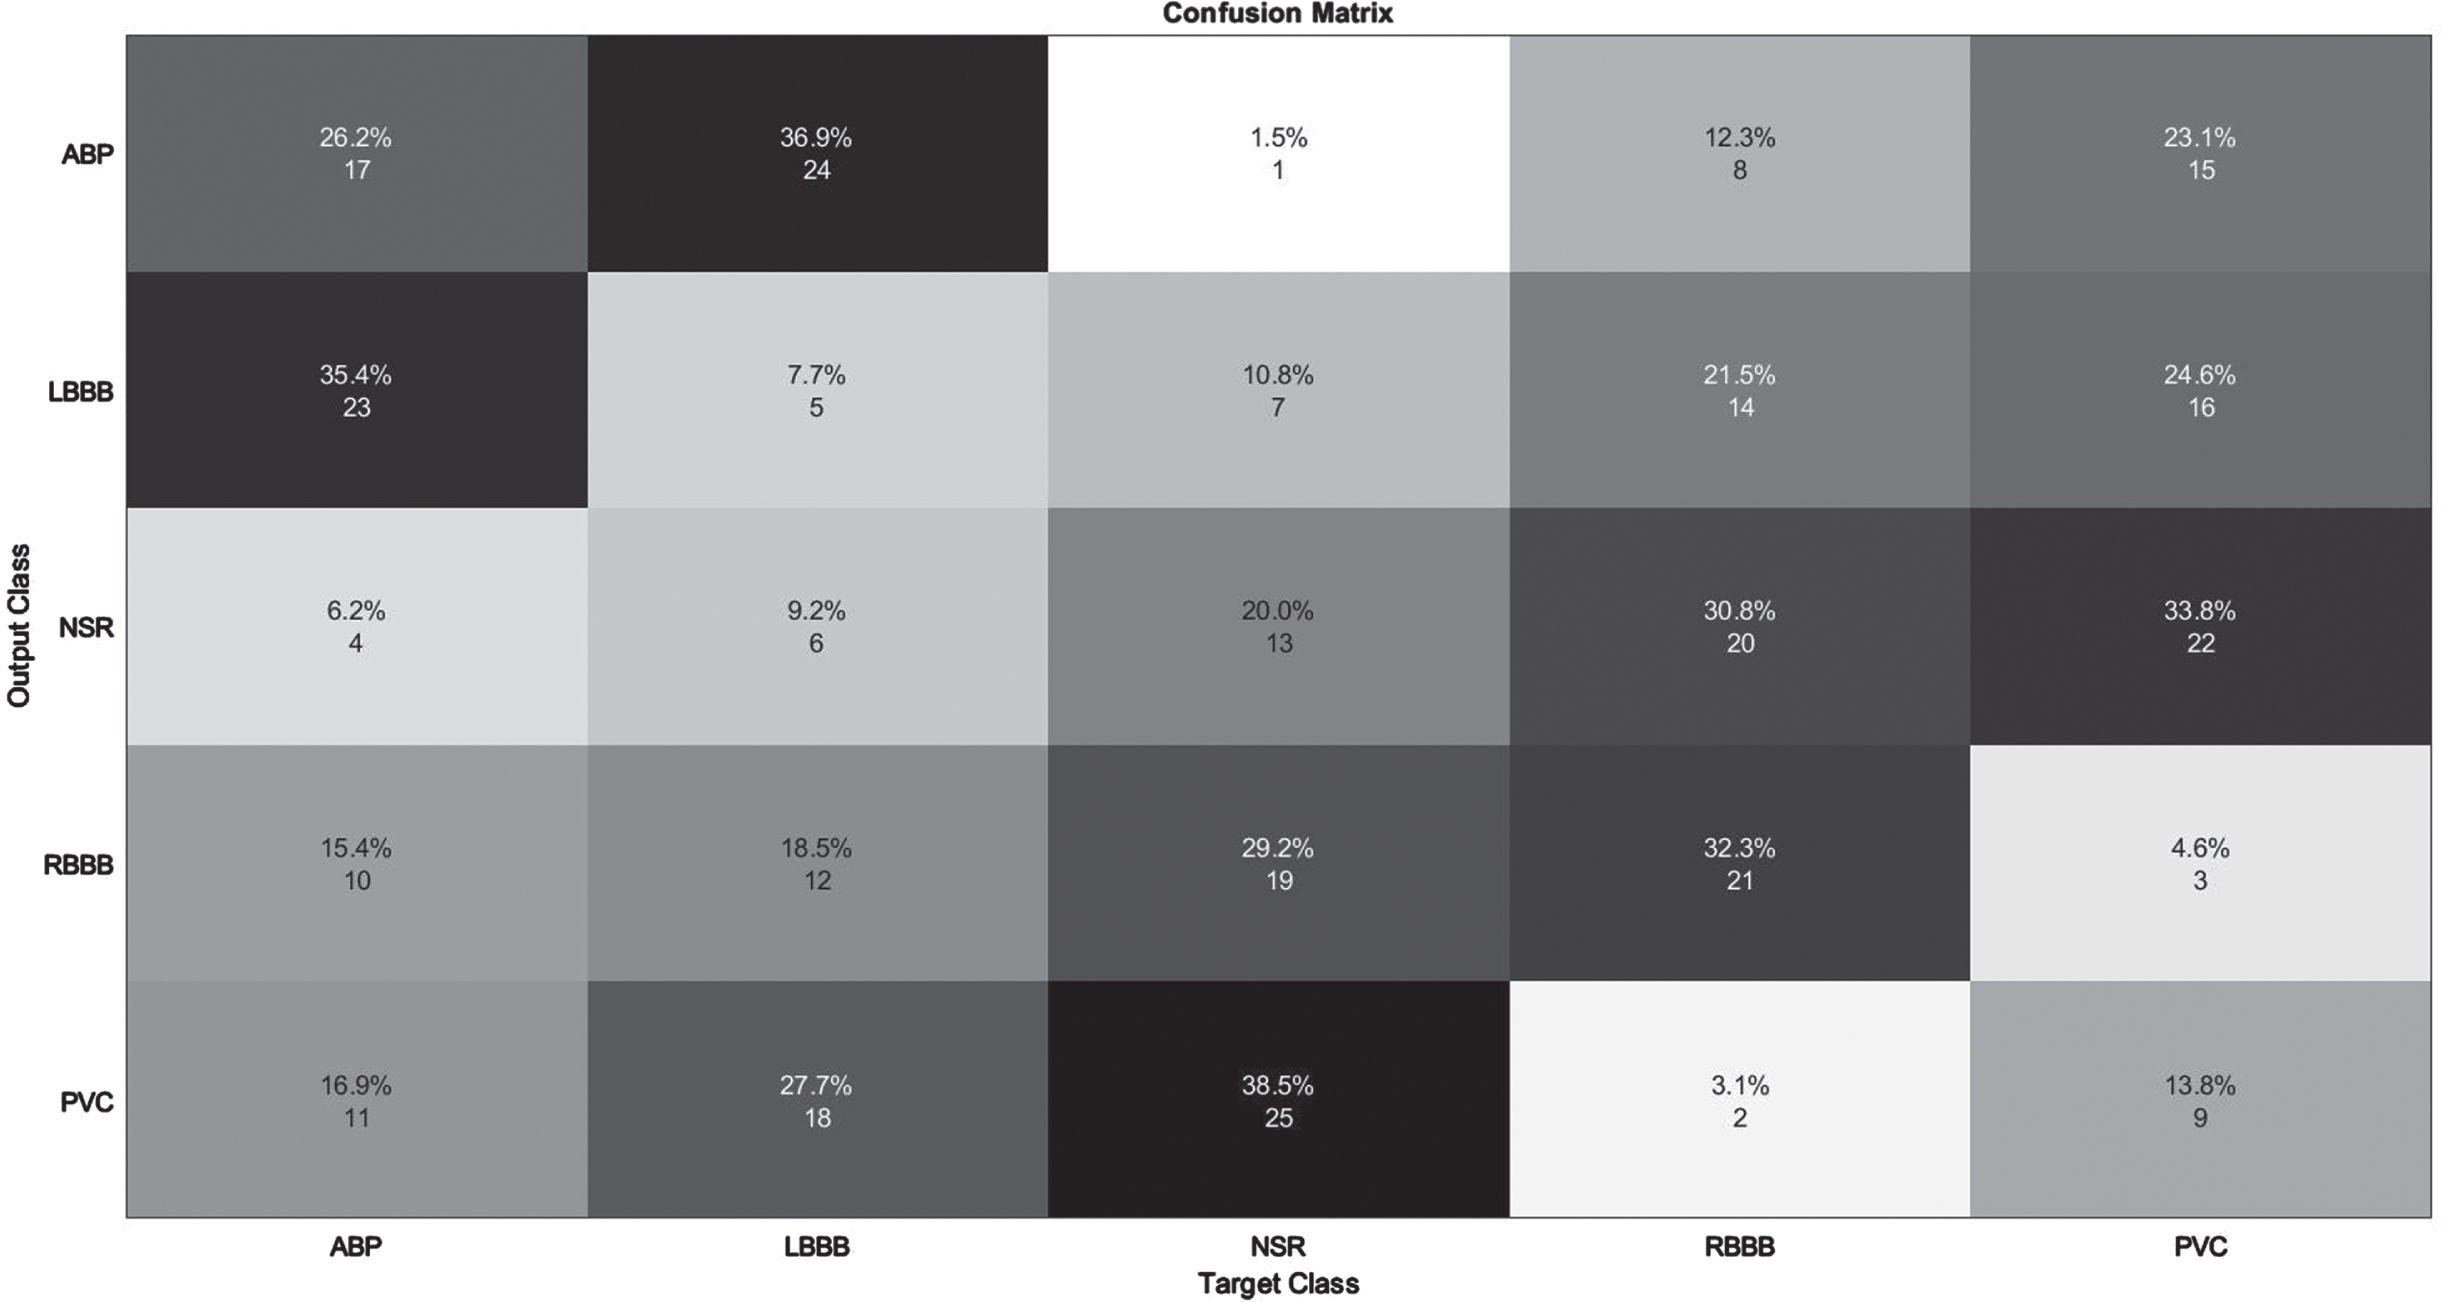
Illustration of confusion Matrix on MIT-BIH Arrhythmia database.
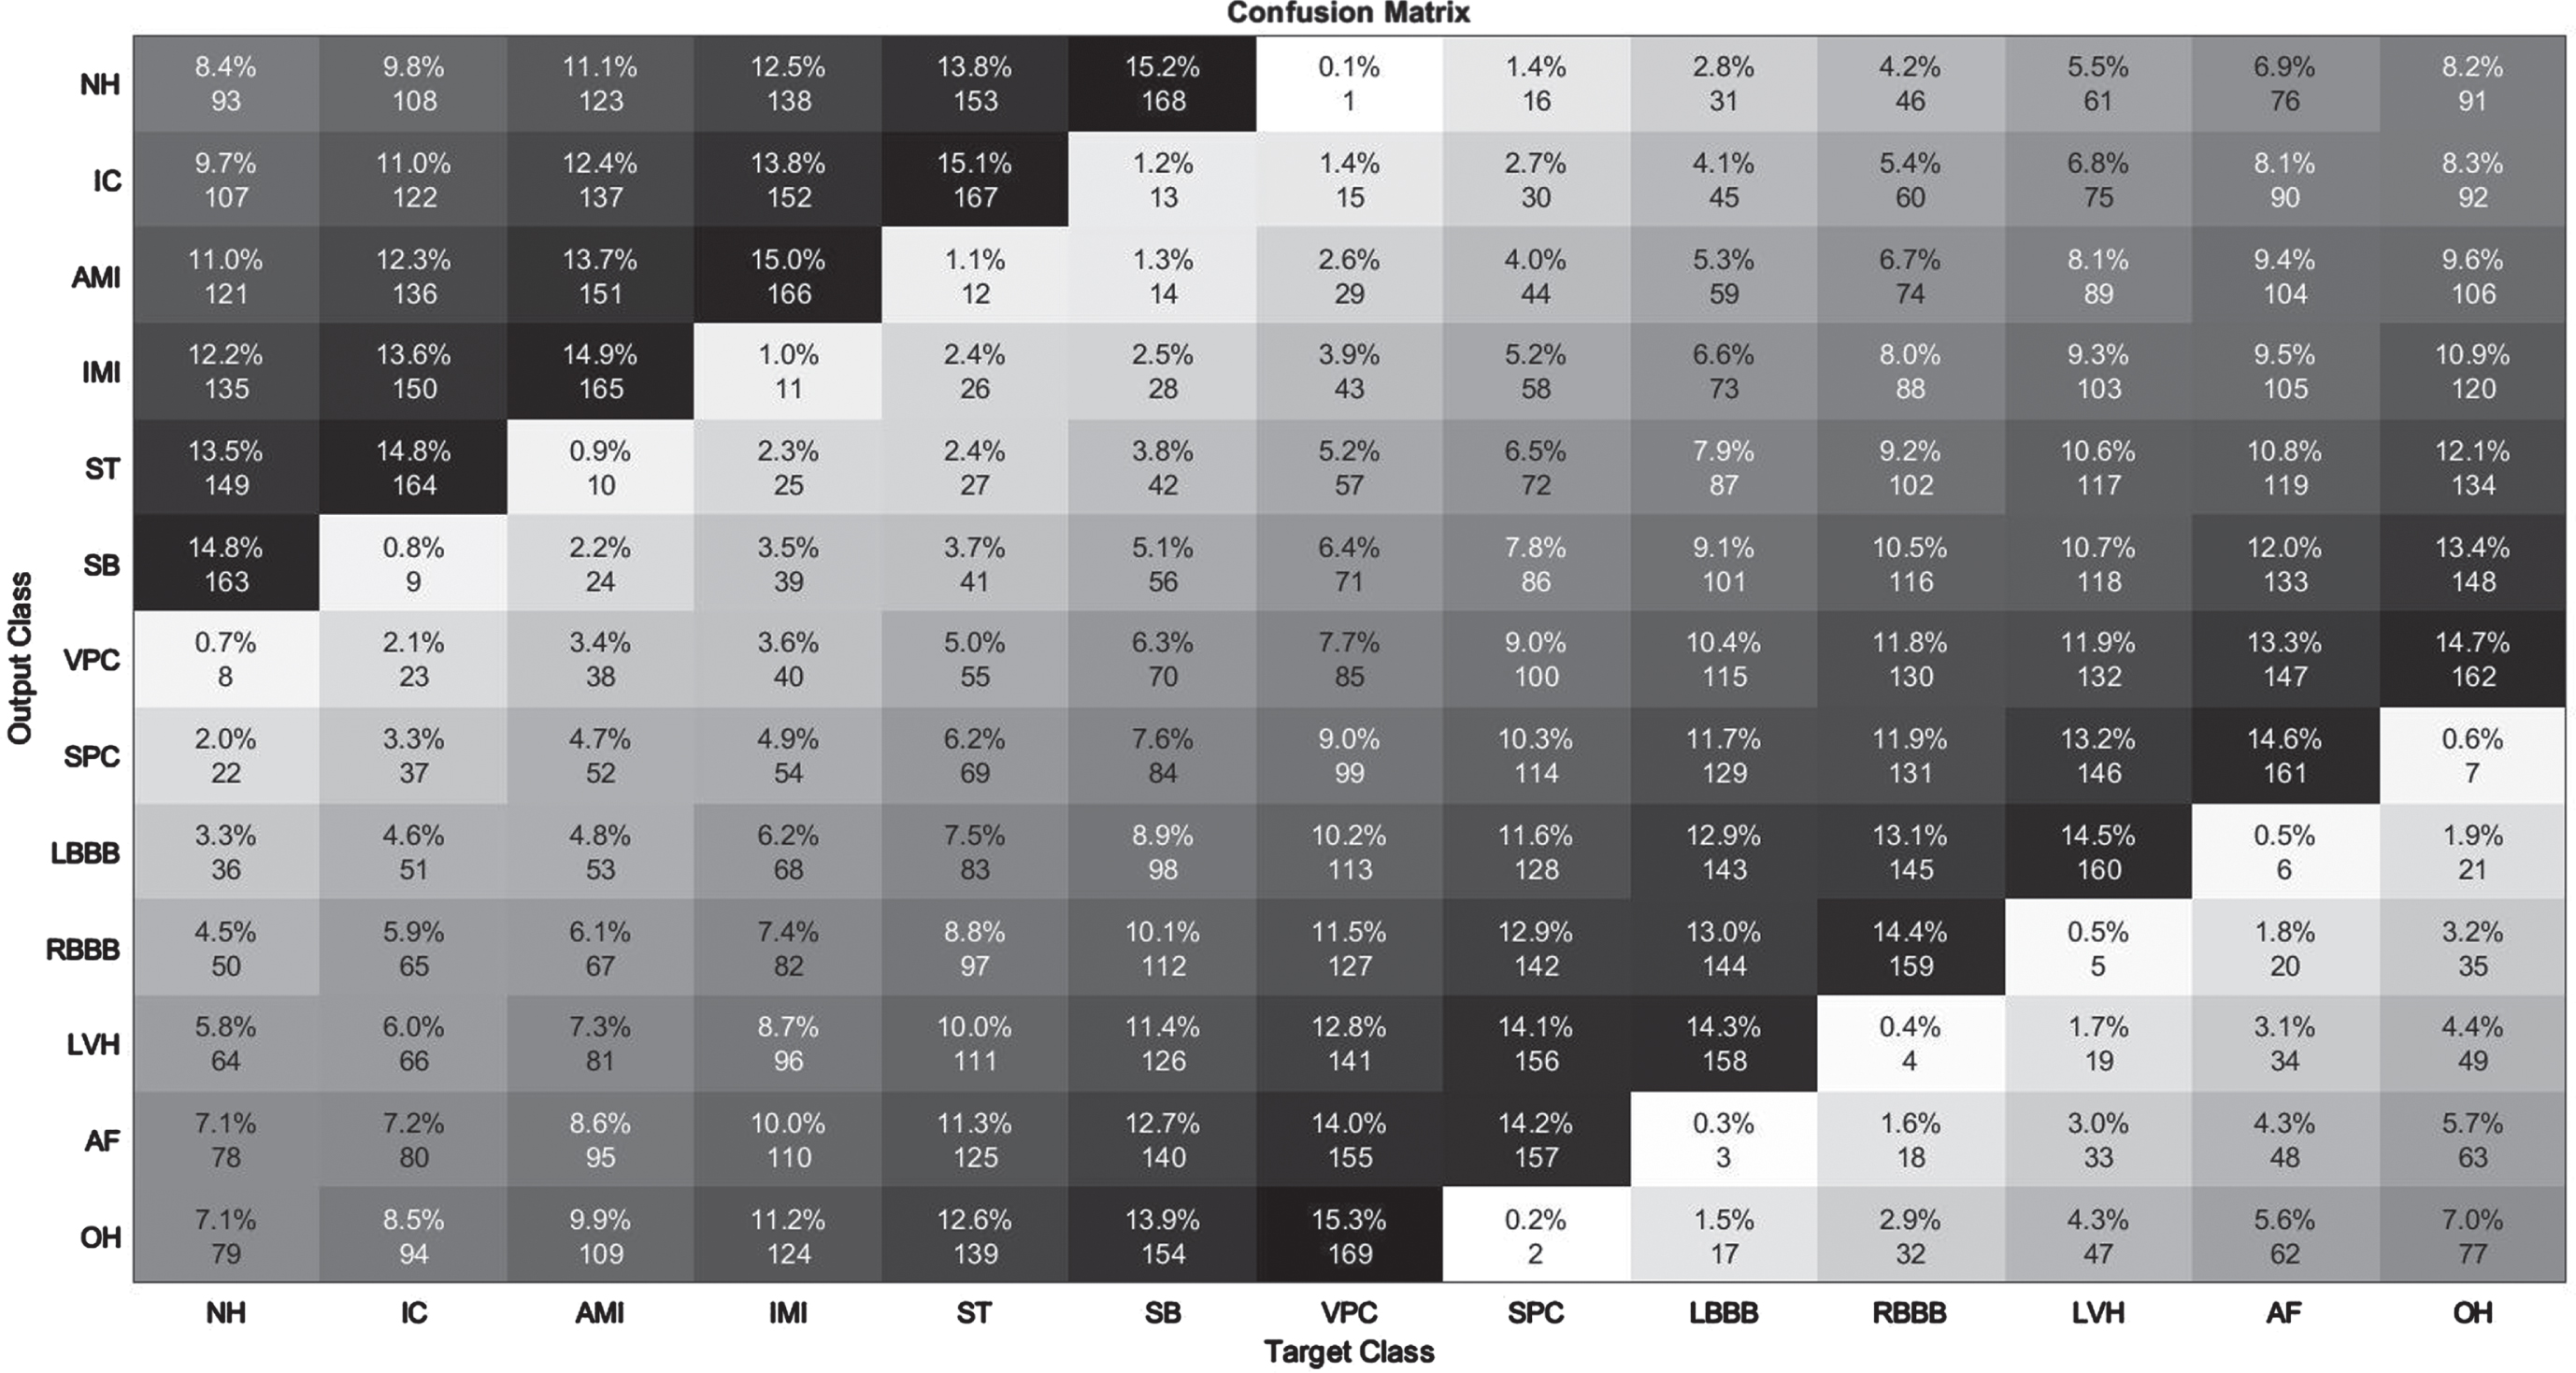
Illustration of confusion Matrix on UCI Arrhythmia Database.
The detection of APB class data had the lowest performance, as seen in Table 3. Obviously, the results of other groups in terms of detection are really impressive. All assessment criteria are tested for average values of 98% and above. Figure 5 depicts the confusion matrix derived from the 99979 test data for the purpose of enhancing comprehension of the test results. On 15,004 test data elements from the MIT-BIH Arrhythmia Database, the improved F3DCNN had an average accuracy of 98.96%. The proposed network misclassified 1.75 % of APB data as NSR. Similarly, 1% of NSR signals were classified as APB, resulting in the lowest recognition performance of the two groups. Similar to an NSR pulse, an APB is often an earlier atrium rhythm that is relayed to the atrioventricular node and subsequently the ventricle. The QRS wave, a distinctive surface ECG waveform, displays electrical activity in the ventricles. It is therefore not odd that NSR and APB have identical QRS forms and might be confused with one another. In contrary to the equal intervals of time between NSR pulses, the shorter time delay between the APB and the preceding beat is a unique feature. Another key attribute is the occurrence of various degrees of intraventricular conduction block in some but not all APBs dependent on the electrical refractoriness of the ventricular conducting tissues, which would be influenced in portion by the closeness of the APB to the prior rhythm.
The detection of Supraventricular Premature Contraction class data had the lowest performance, as seen in Table 4. Clearly, the performance of other groups in terms of recognition is quite impressive. For each assessment criterion, values averaging 98.5% or above are measured. Figure 6 displays the confusion matrix derived from 452 test data in order to enhance understanding of the experimental outcomes. The improved F3DCNN achieved an average accuracy of 99.4% on 452 test elements from the UCI Arrhythmia Database. This approach can accurately categorize ECG arrhythmia regardless of the type of ECG signal. This demonstrates the consistency and efficacy of the proposed model.
Initially, the presented method was evaluated against the MIT-BIH Arrhythmia Database. Table 3 shows the achievement of the resultant measures. This model obtains an average F1 score of 98.48%, specificity of 98.45%, recall of 98.35%, the precision of 98.52%, and classification accuracy of 98.96%, as observed. This approach has an estimated total detection error rate of 1.03 %. The poor average recall is related to the limited availability of samples against certain classes. This impacted the network’s recognition of patterns and the significance of features.
Evaluation of performance Metrics on MIT-BIH Arrhythmia Databse
Likewise, Table 4 shows that the novel approach obtains an average F1 score of 99.28%, specificity of 99.24%, Recall of 99.31%, 99.38% of precision and classification accuracy of 99.4%. The developed model’s estimated total detection error rate is 0.6%.
Evaluation of Performance Metrics on UCI Arrhythmia Databse
The ROC curve depicts the tradeoff between sensitivity (FPR) and specificity (FNR). On the depiction of the ROC curve, the x-axis ranges from 0 to 1 (0-100%) and the y-axis ranges from 0 to 1 (0-100%) for the proportion of FP (1-specificity) and FN, respectively. An optimal ROC curve would have a point at the top left (0,1), indicating that the test is superior at identifying cases from non-cases when 100% sensitivity and 100% specificity are provided. The AU-ROC Curve is the calculation of the space between the ROC and the axes (AUC). It can take any value between 0 and 1 as both x- and y-axes have values between 0 and 1”?the higher the AUC, the better the test’s performance. AUC is a suitable statistic for evaluating algorithm performance since it does not depend on the prediction criteria that are specified. To clarify the training outcome, the average of five training ACC values was computed from tenfold cross-validation. Figures 7 and 8 illustrate the ROC for two database systems.
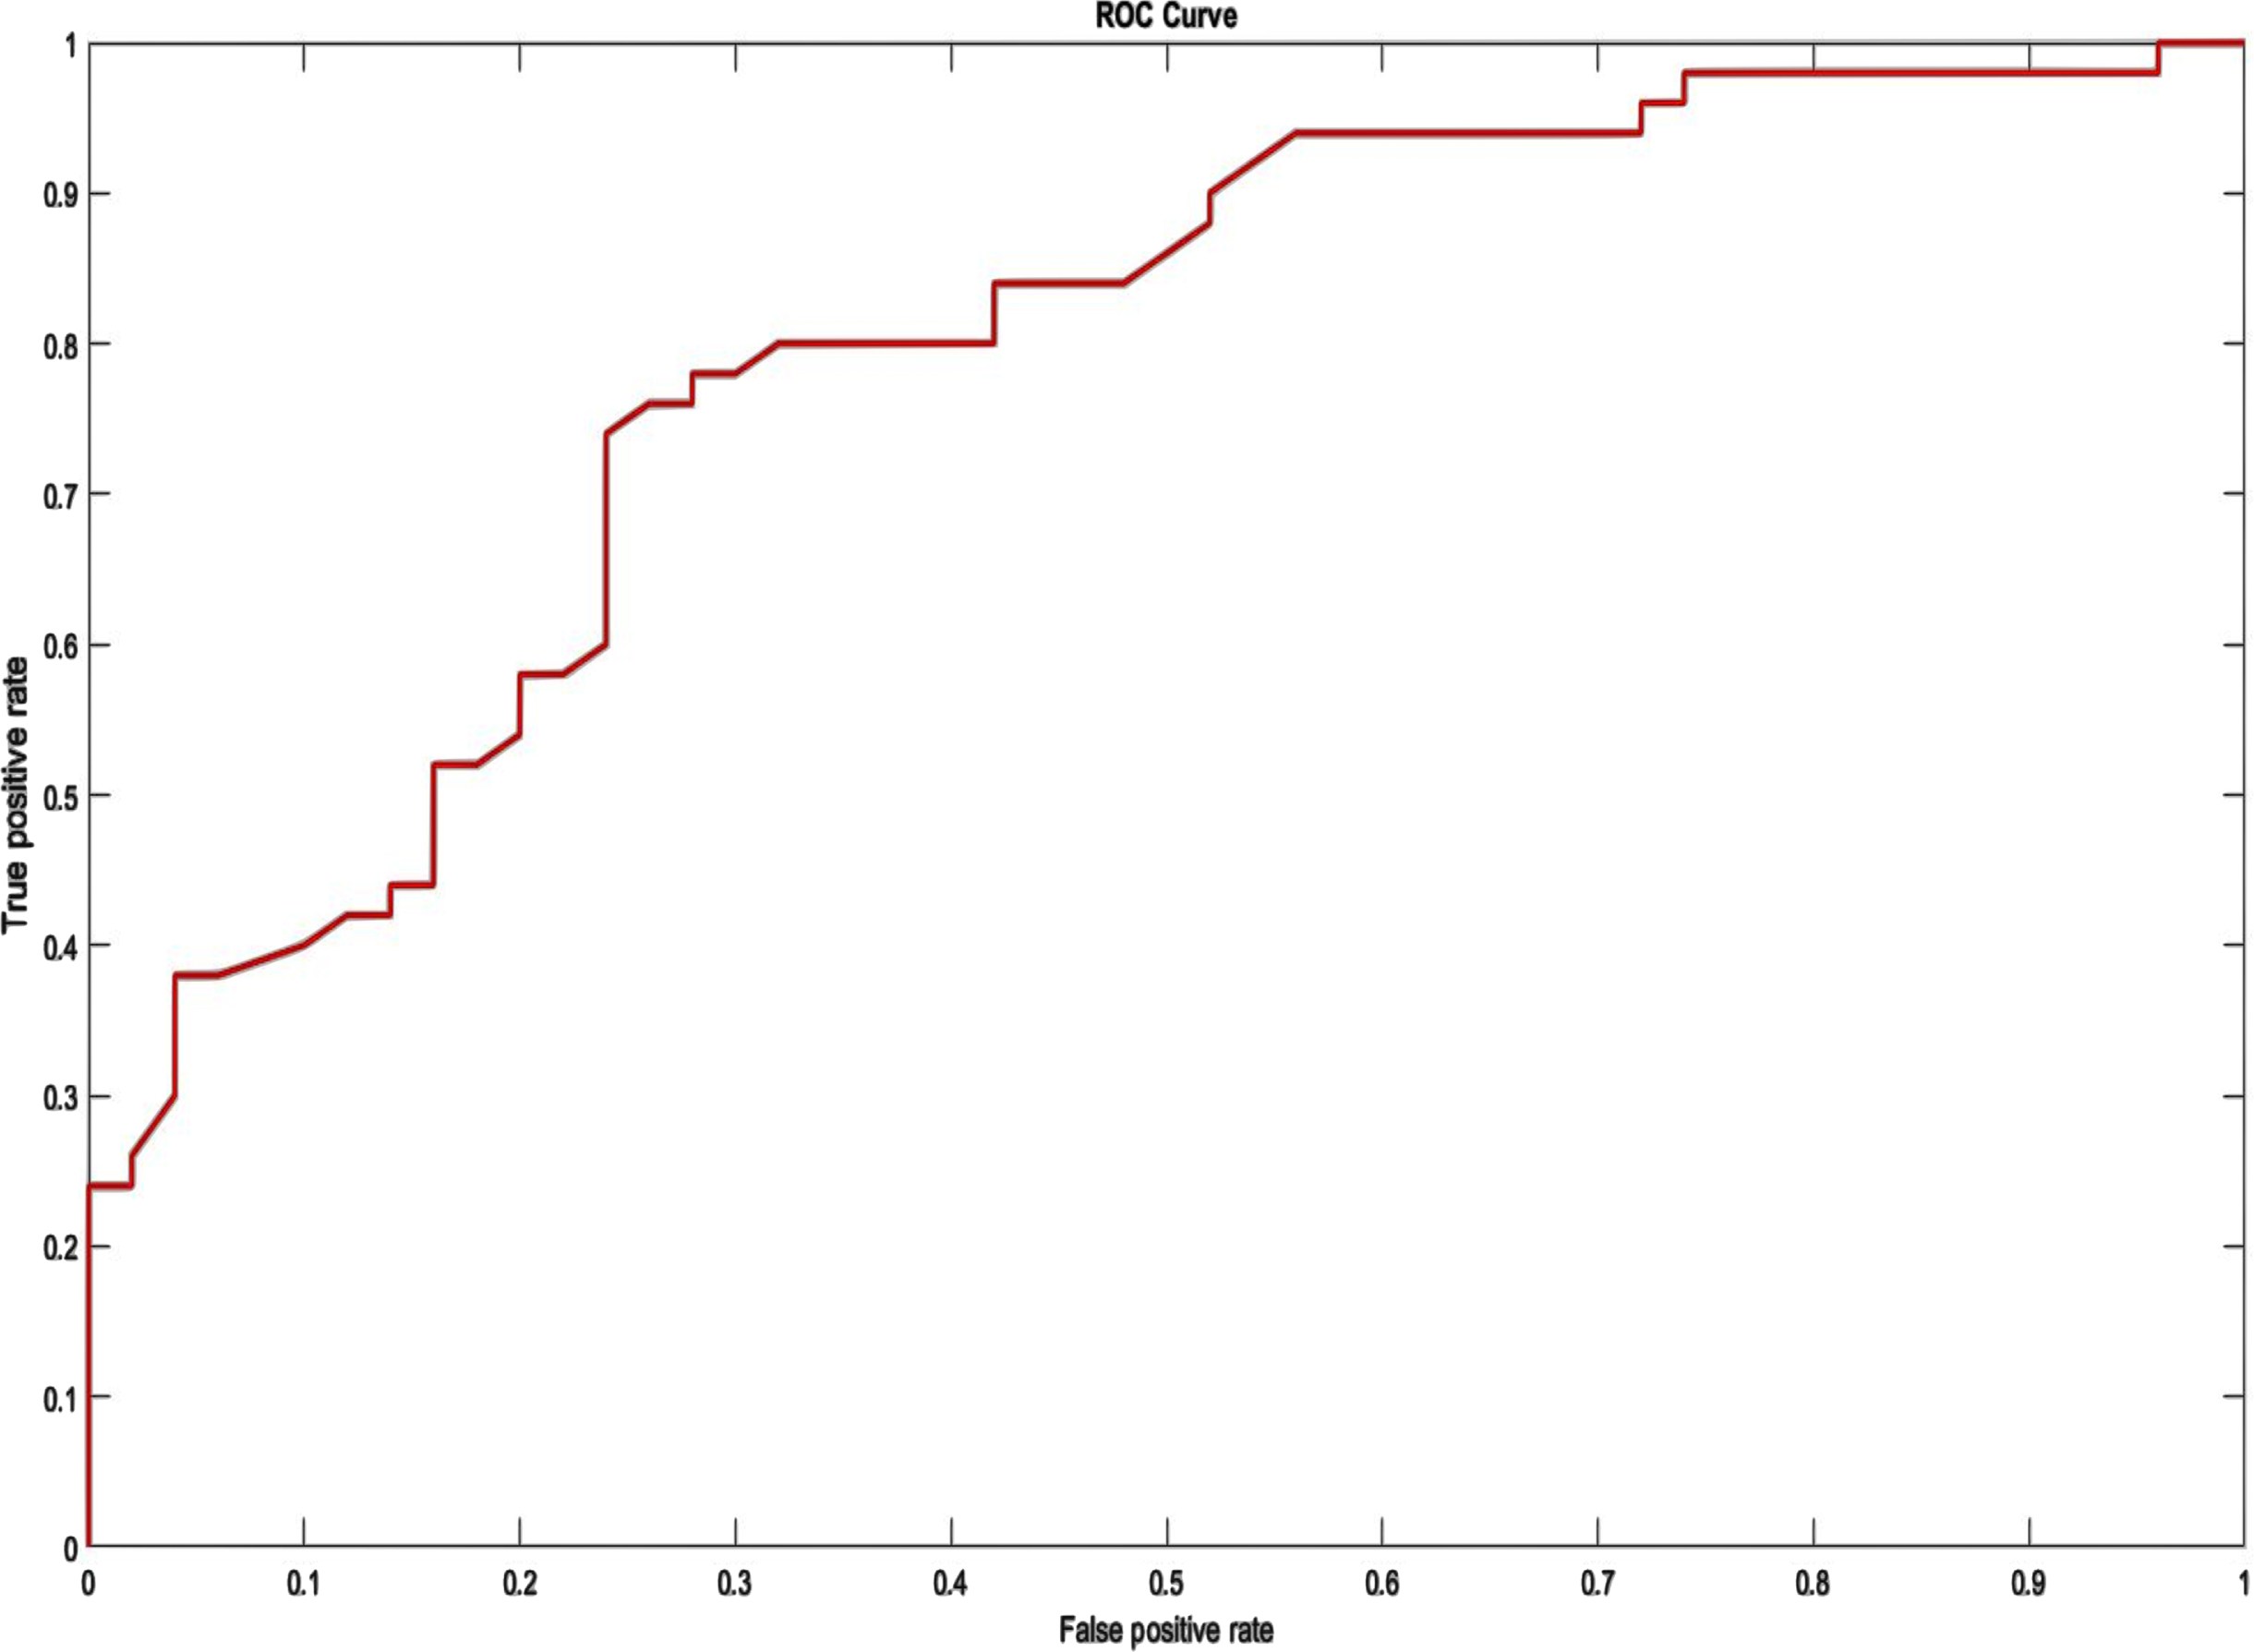
ROC on MIT-BIH Arrhythmia Database.
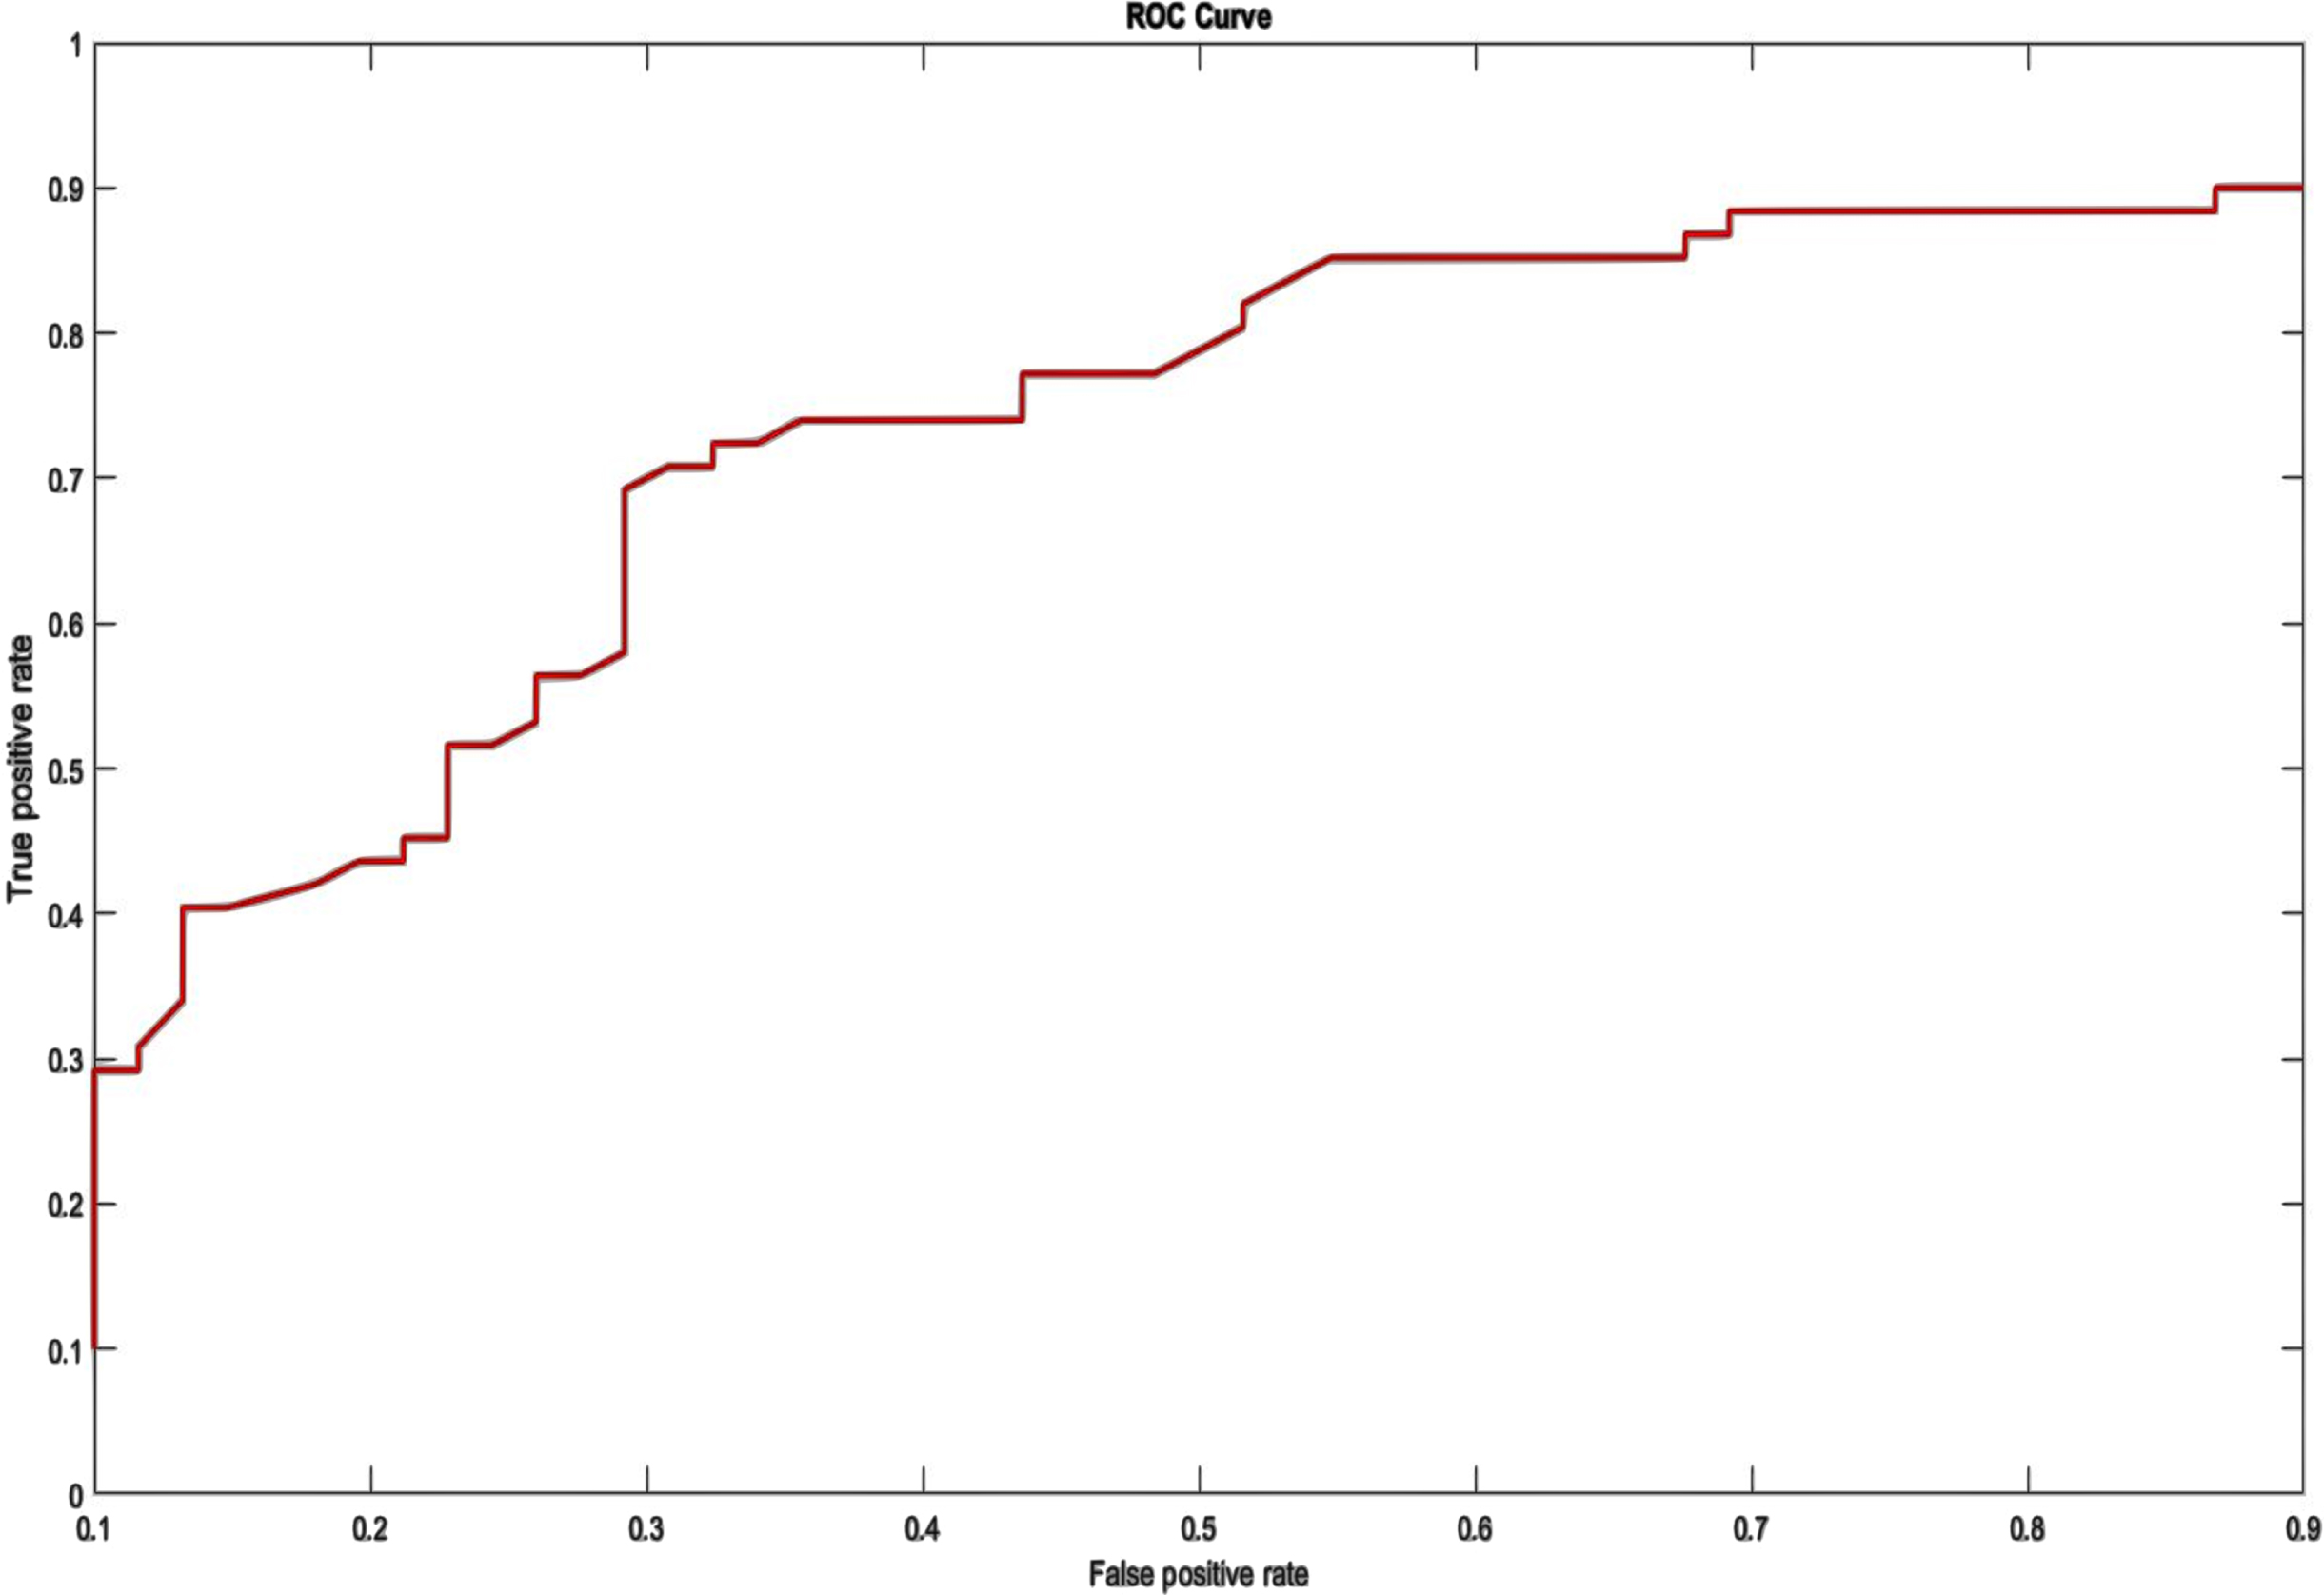
ROC on UCI Arrhythmia Dataset.
Figure 9 displays the outcomes of the improved model. It shows the test accuracy and loss value of the implemented model. As the number of iteration steps rises, the accuracy curve converges toward 1 and the loss curve converges toward 0. Throughout convergence, the two curves retain a condition of relative stability. The improved classification framework obtains an excellent average test accuracy of 98.96% and an average loss value of 1.04.
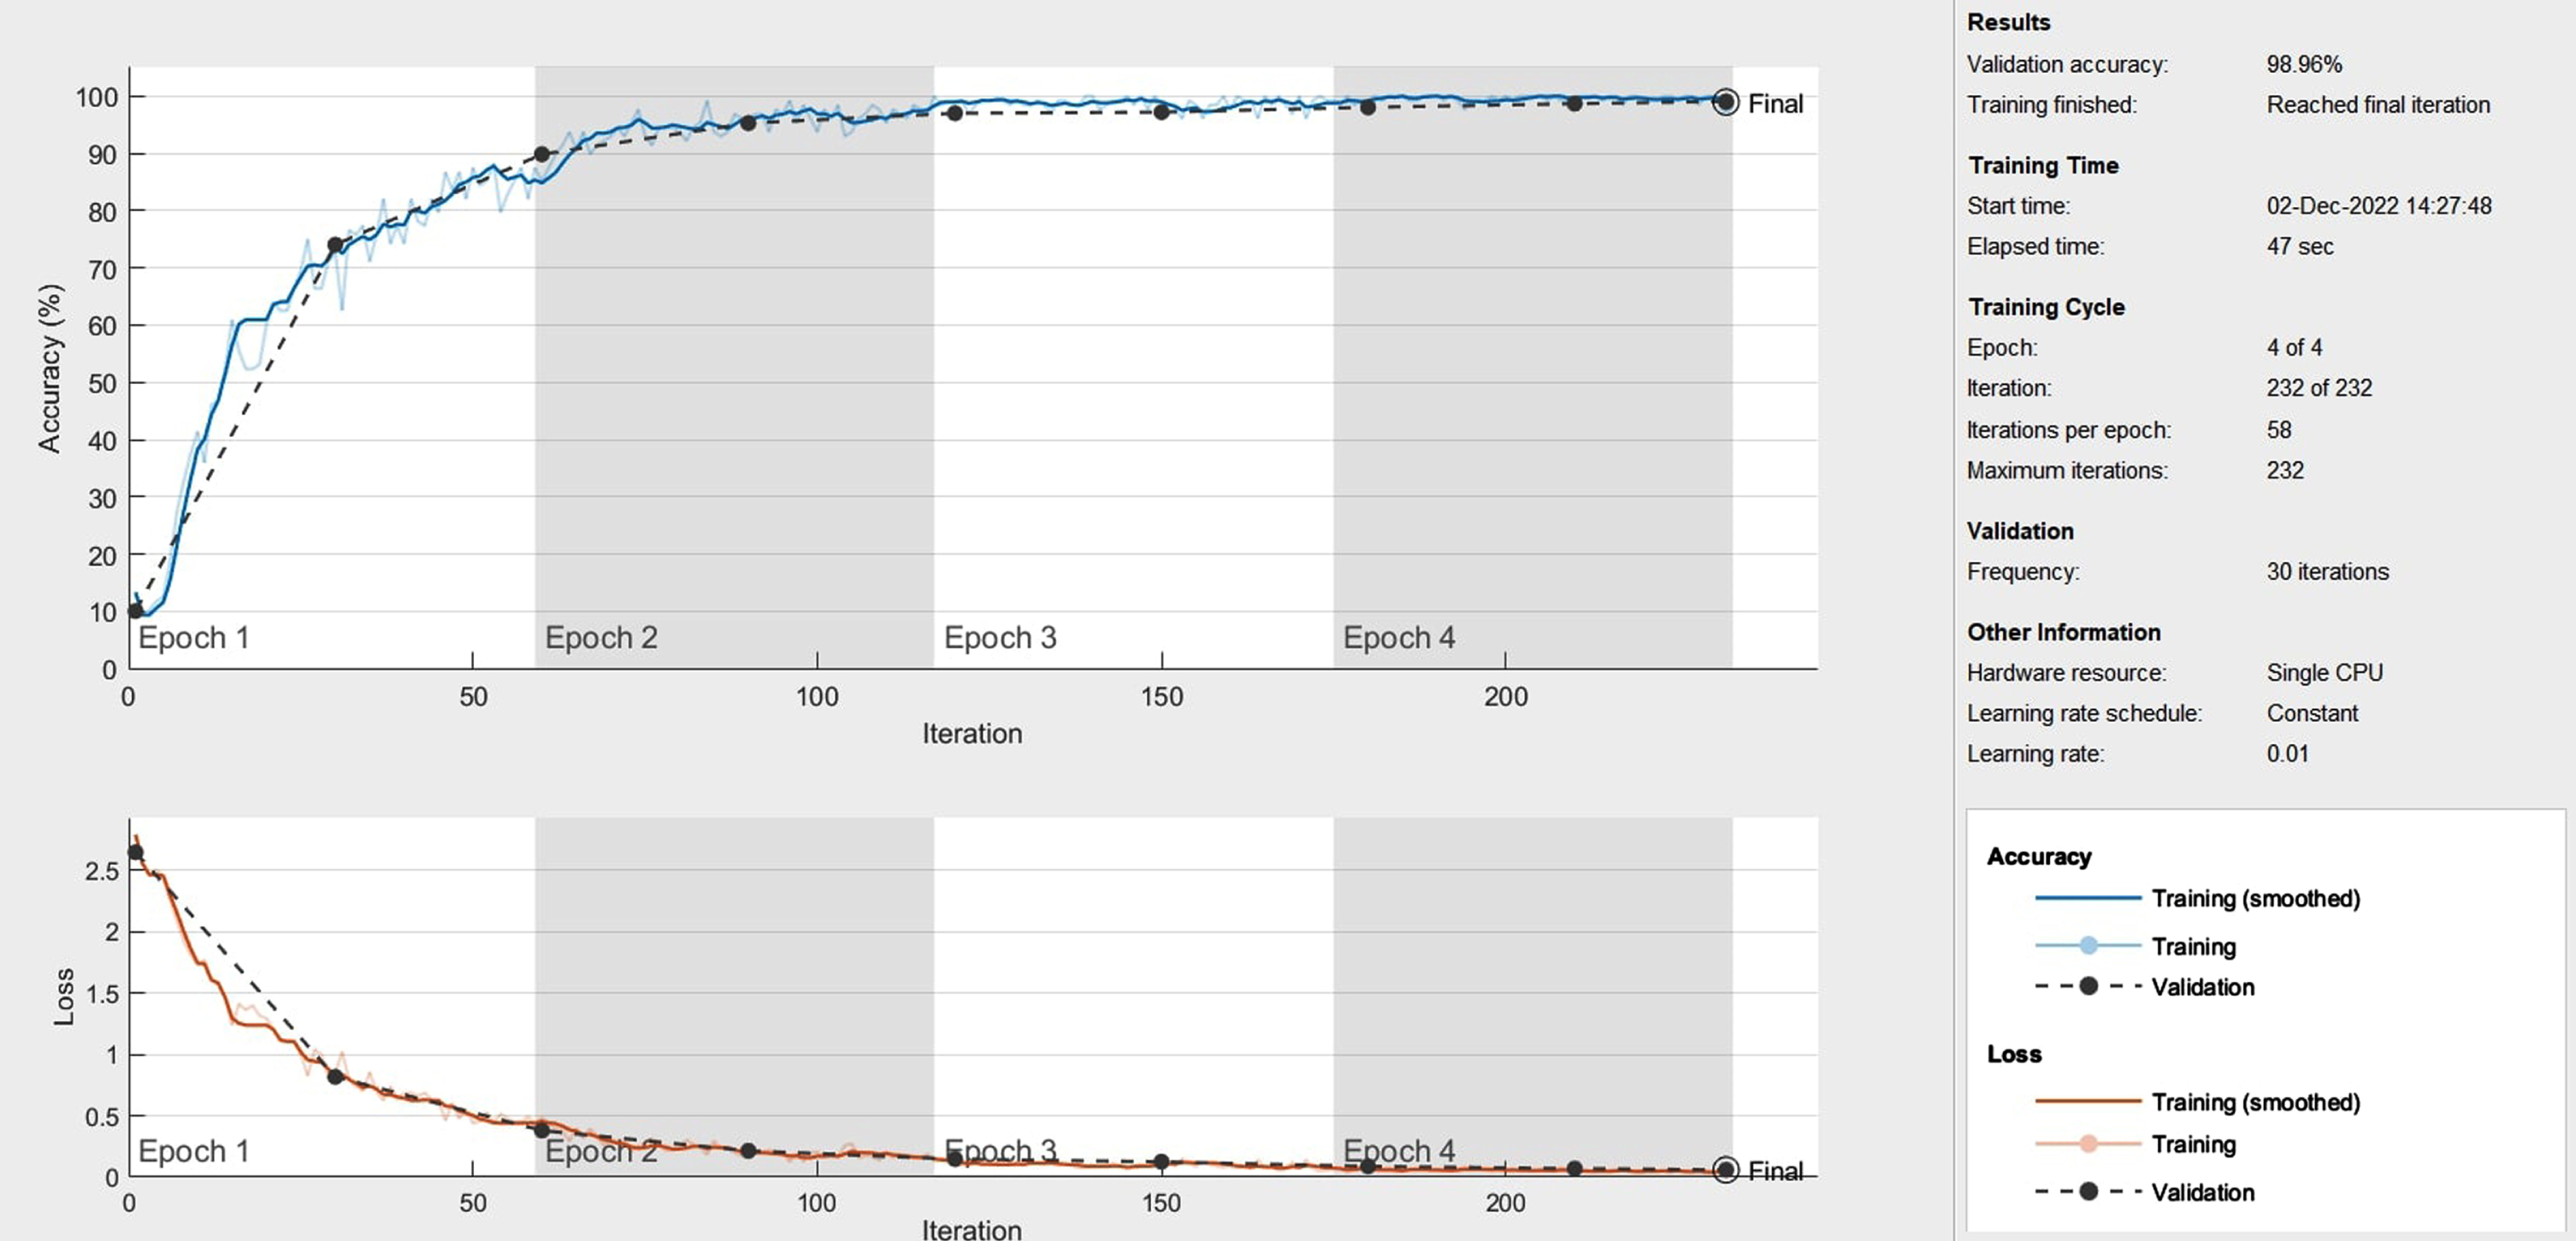
The test accuracy and loss value curve for the proposed method.
The weights and biases of the FNN may be trained to better represent the connection to be modeled if there are experienced input/output data from the relationship to be modeled. The experiment’s results indicate that the Neuro-Fuzzy classification algorithm may significantly advance the traditional classification schemes that are applicable to ECG signal characterization. This FIS has Mamdani-type features, centroid defuzzification, four inputs, one output, and three triangular functions. Figure 10 depicts the neuro-fuzzy classifier’s training procedure.
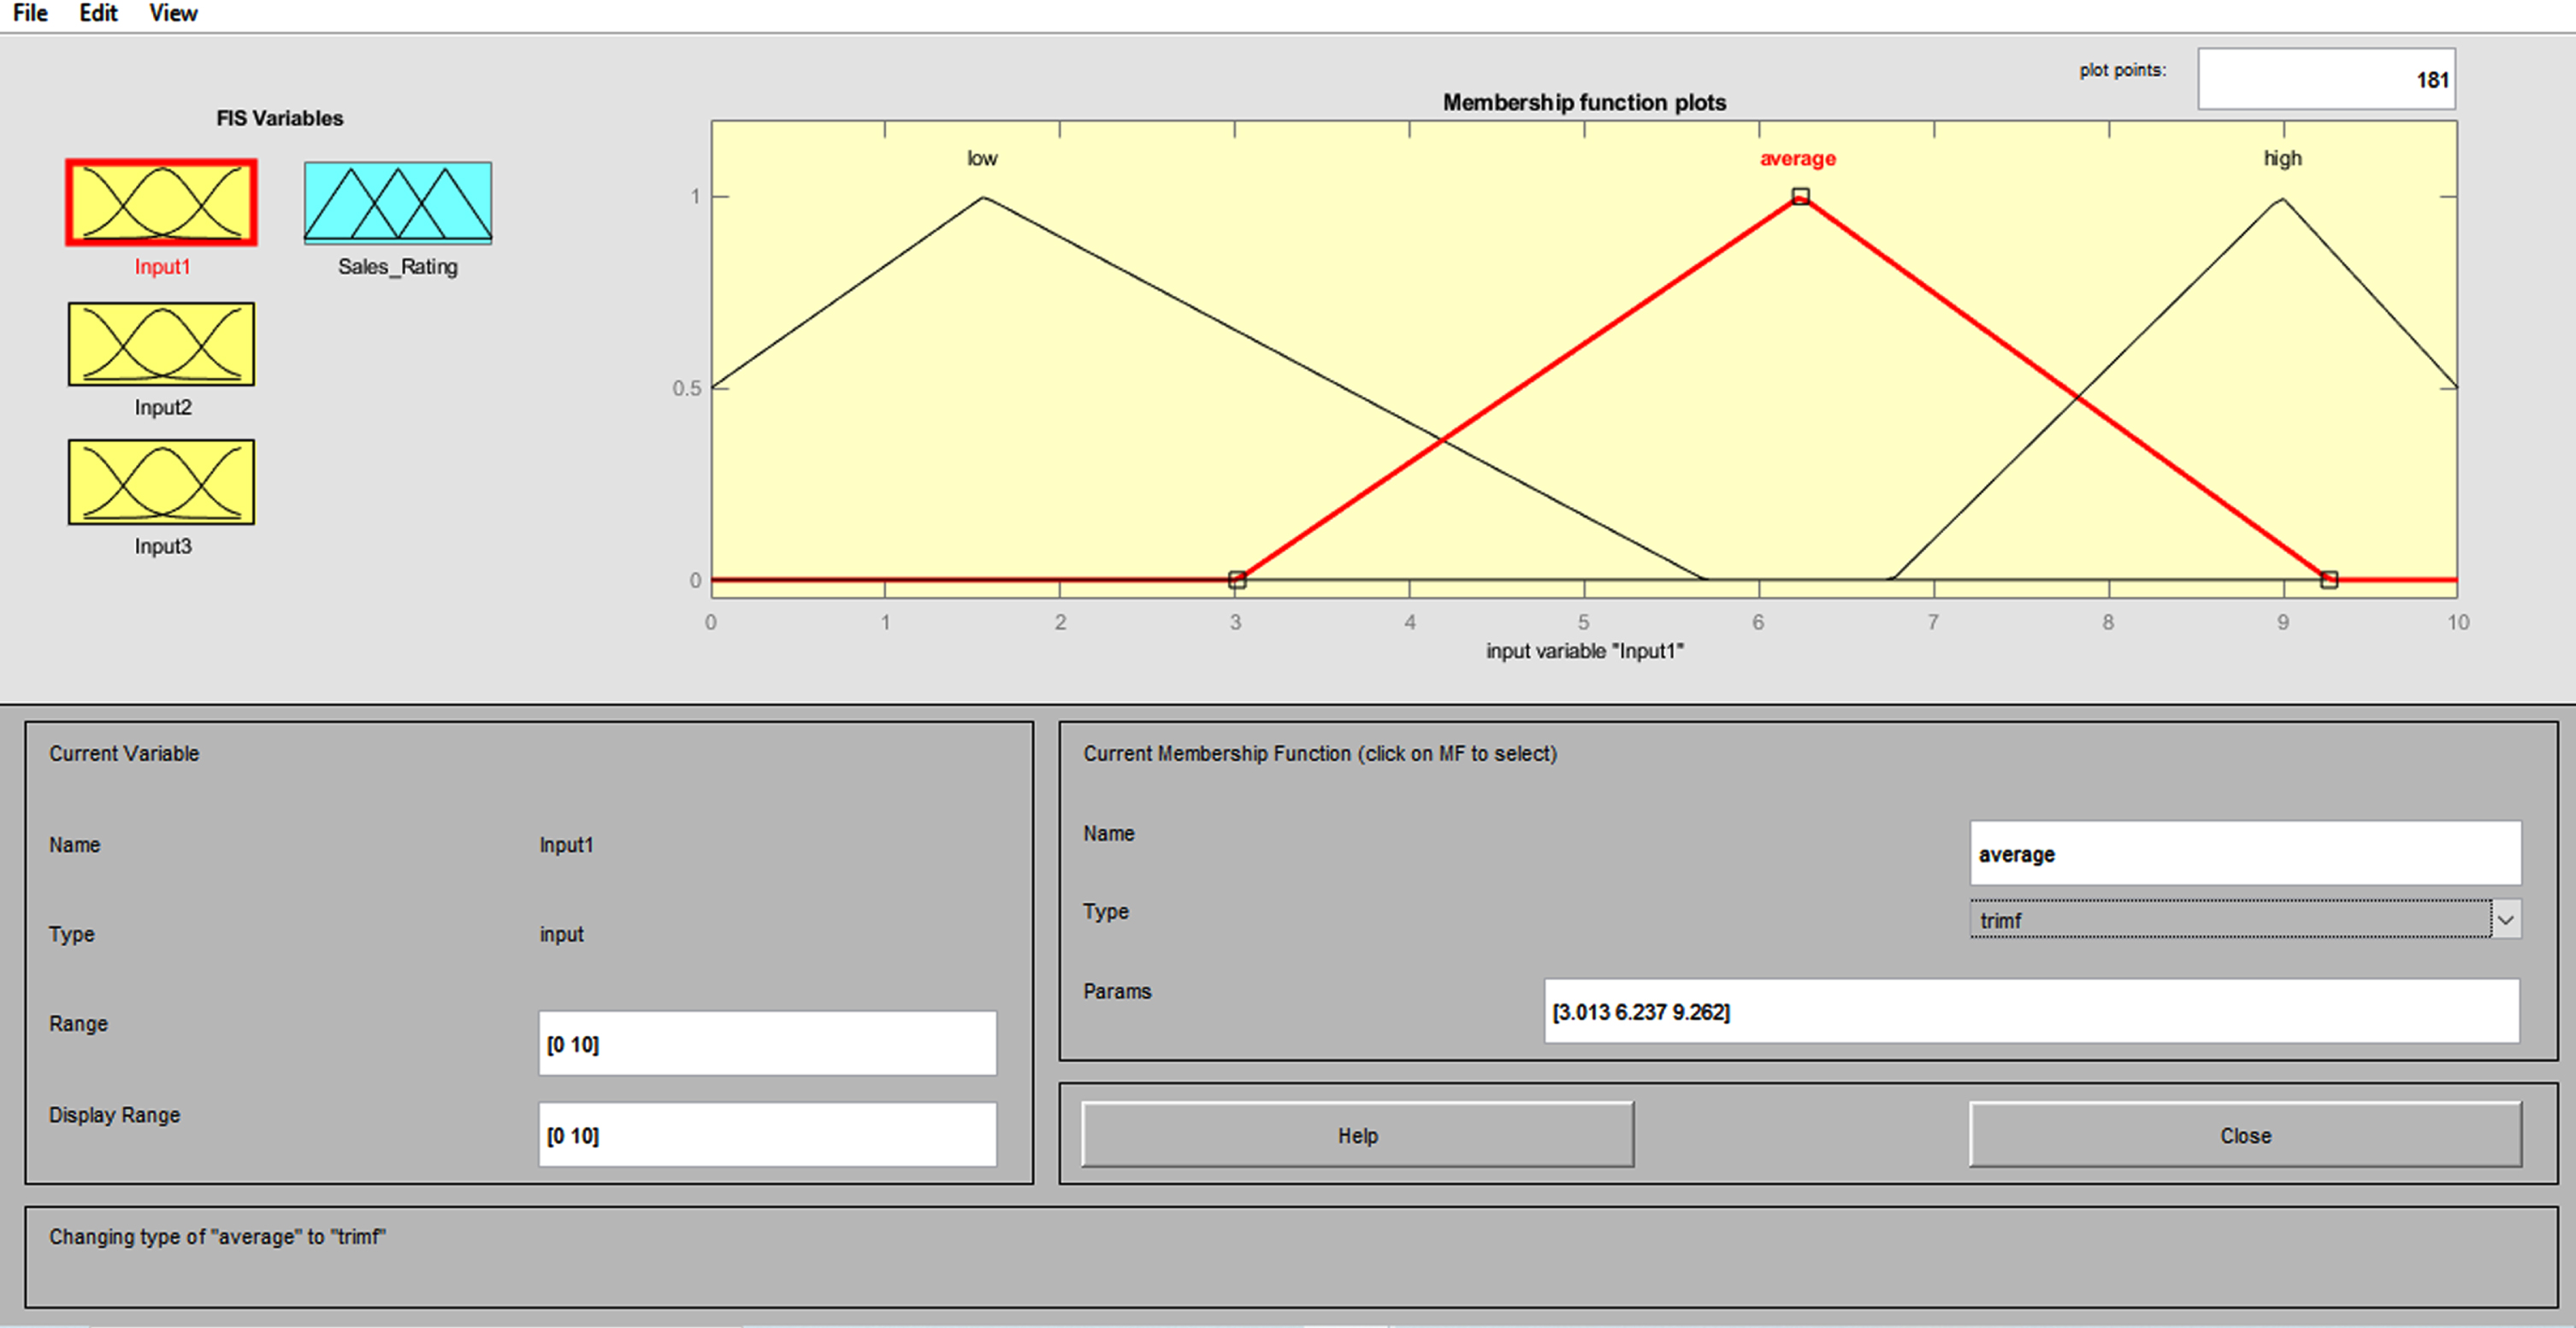
Membership function for the fuzzy logic system.
When compared to other existing approaches, it can be shown that 3D-CNN-based fuzzy systems with triangle membership functions produced higher classification results. Figure 11 shows the rule base table for Fuzzy logic system.
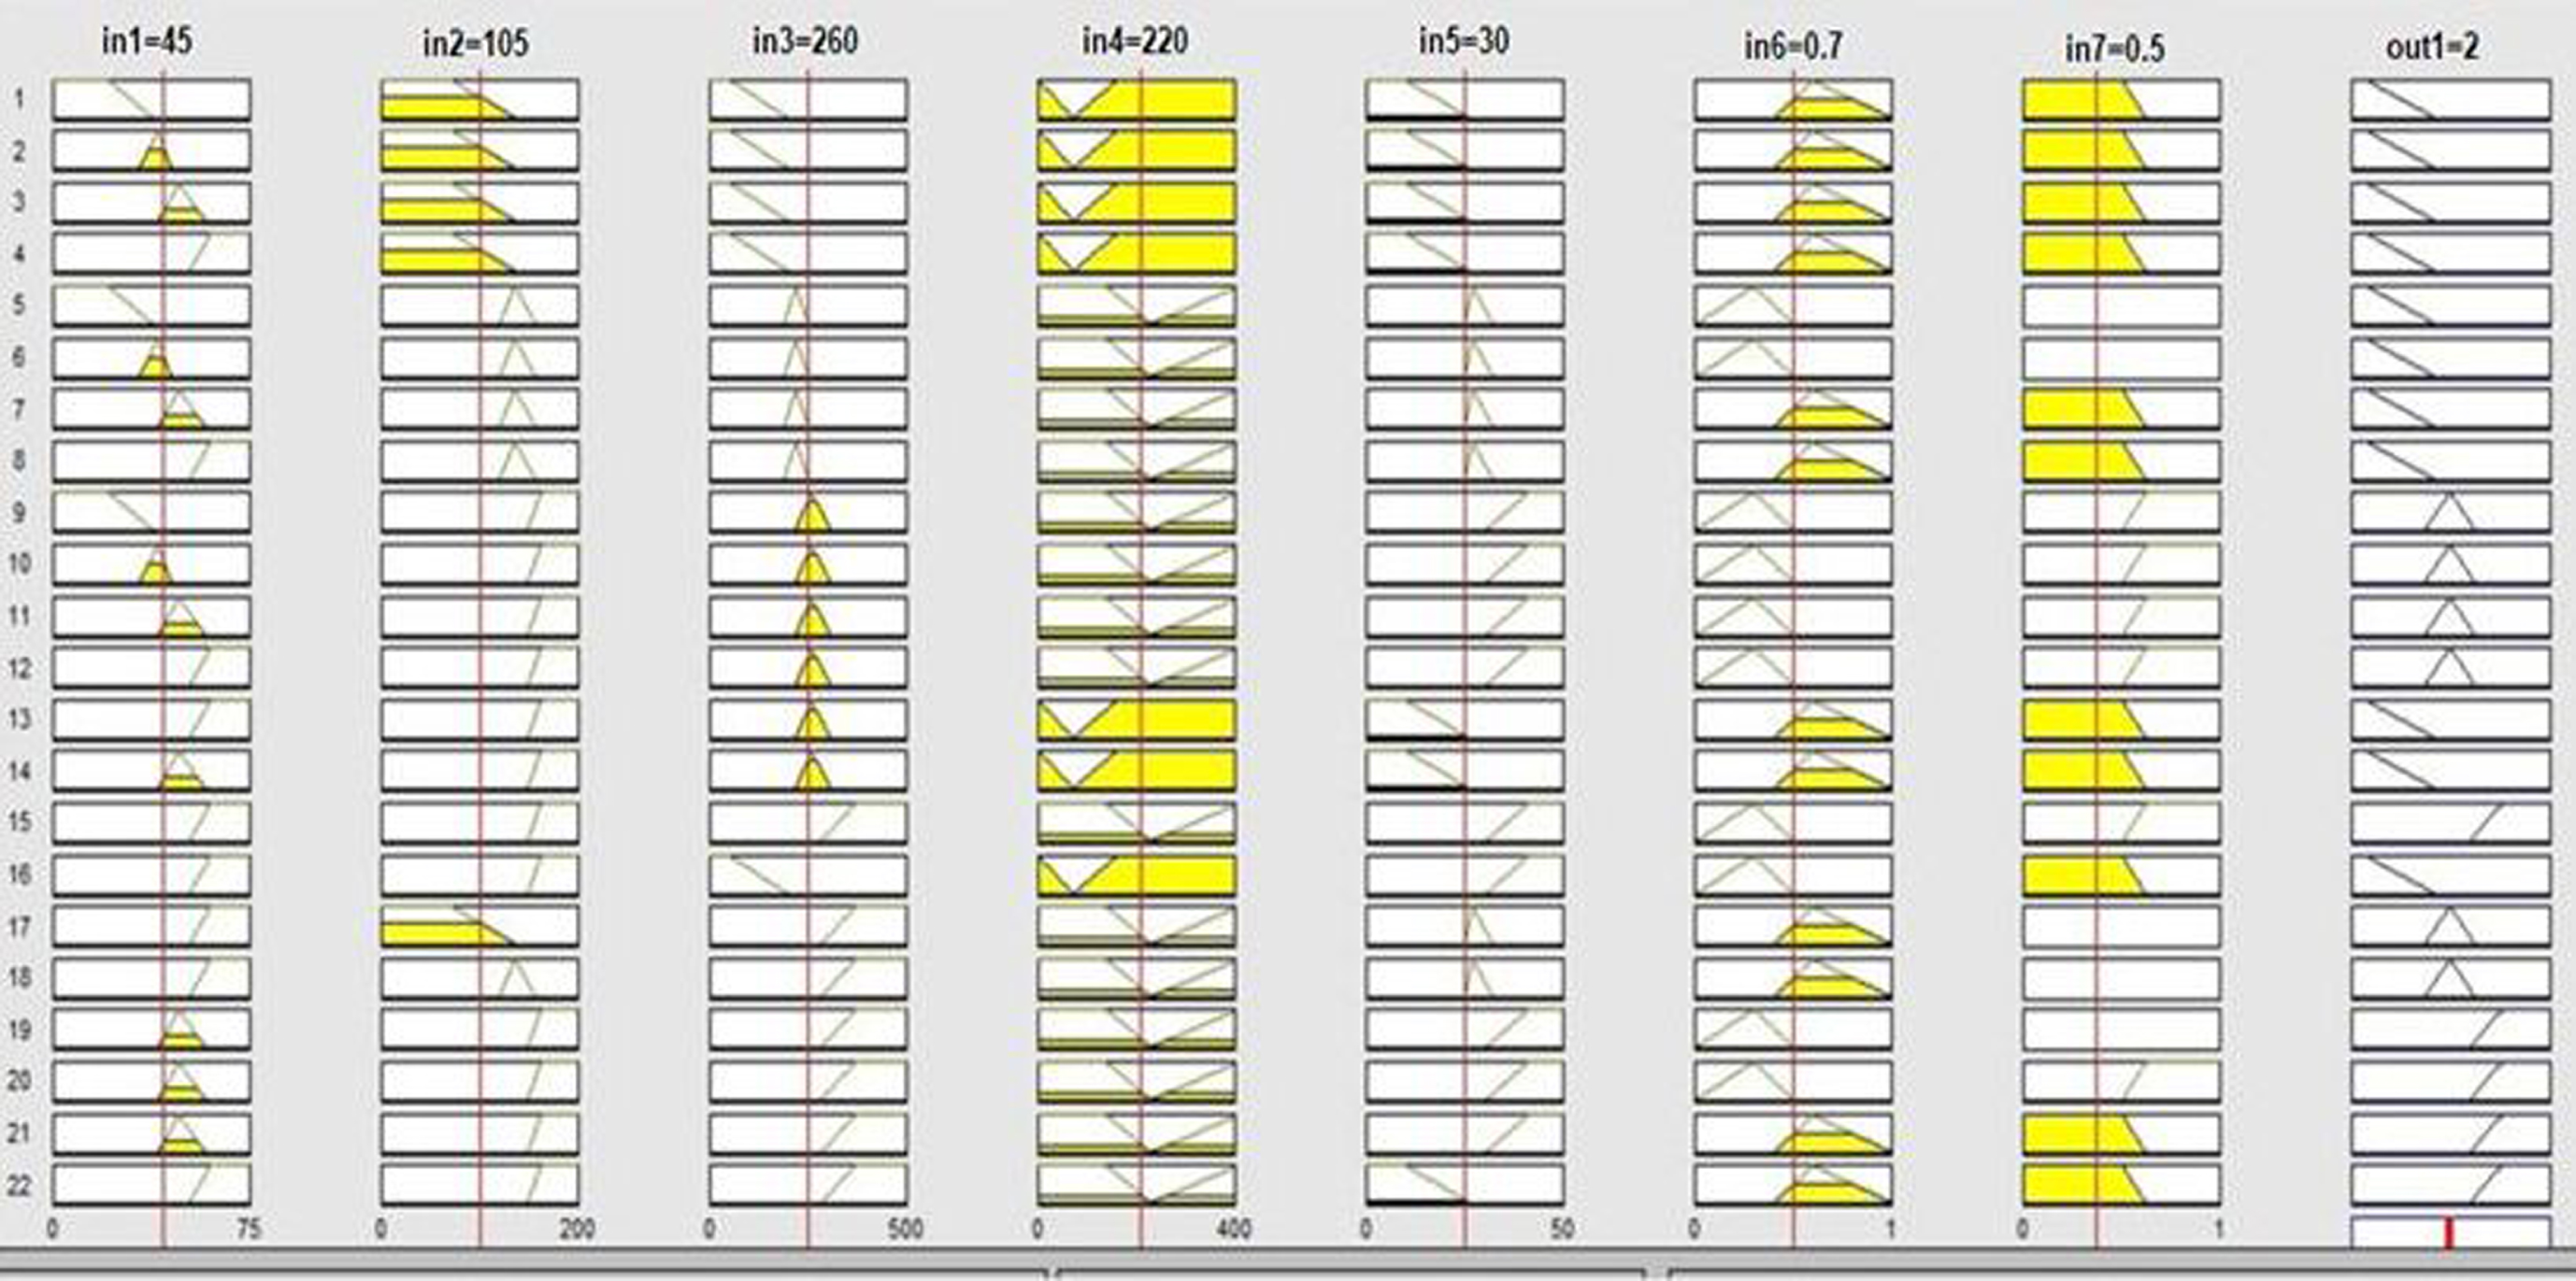
Fuzzy Rule base table.
As per [37], by configuring the a i , b i and θ i parameters, distinct points on the ECG signal like the P, Q, R, S, and T utilized can be configured. θ i determines where these points are located, and a i and b i determine the ECG wave’s amplitude and width.These parameters should be set properly to produce a desirable ECG Signal.
Table 5 presents the comparison of the techniques, with the best result being recorded for 80% of the training period. The accuracy of the proposed POA-F3DCNN is 98.96%, which is 5.77%, 6.7%, 6.69% and 6.62% better than the existing methods, such as BaROA-DCNN, CNN+LSTM, GA-BPNN, and DCNN respectively in MIT-BIH Arrhythmia dataset. From Table 6, the accuracy of the proposed POA-F3DCNN is 99.4%, which is 0.35% and 1.92% better than the existing methods, CNN+LSTM and XGBoost+SMOTENN respectively in the UCI arrhythmia database.
Comparative Discussion for MIT-BIH Arrhythmia Dataset
Comparative Discussion for MIT-BIH Arrhythmia Dataset
Comparative Discussion for UCI Arrhythmia Dataset
Table 7 compares the computational complexity of the proposed and recent approaches, comprising CNN+LSTM, DCNN, GA-BPNN, and BaROA-DCNN, with the Proposed POA-F3DCNN methodology having the lowest computation time of 5.13 seconds.
Computational Complexity
Our proposed method demonstrated superior classification performance compared to existing methods (BaRoA-DCNN, CNN-LSTM, GA-BPNN, DCNN) that operate on Patient independent data. Moreover, even without expert intervention, the model’s performance remains comparable to that of many other systems that utilise patient-specific data. The proposed POA-F3DCNN method addresses limitations by utilising raw ECG waveforms as input, which are aligned to obtain improved representations for classification. The BaRoA-DCNN method has a computational complexity of 6.12 seconds, while the CNN with LSTM method has a computational complexity of 7.25 seconds. The GA with BPNN method has a computational complexity of 8 seconds, and the DCNN method has a computational complexity of 9.02 seconds. The proposed POA-F3DCNN reduces computational complexity compared to the studies mentioned in Table 7.
The precise analysis of heartbeats by ECG is crucial for treating cardiovascular disorders since they provide a severe threat to human life. The disadvantages of the existing and hybrid approaches(BaRoA-DCNN, CNN-LSTM, GA-BPNN, DCNN) include increasing cost, duration, and a severe lack of high-quality data, which may be found to be negligible in some feasible instances as the accurate classification of heart signals and precise diagnosis of arrhythmia require a significant amount of data to perform. To overcome the above-said drawback, this paper offers a combination of DNNs consisting of the development and combining of fuzzy neural networks and 3D-CNNs, followed by the simultaneous training of the integrated framework. The innovative features emphasize the implementation of the ensemble technique that integrates the advantages of both models and produces a robust result. In this research paper, the Proposed framework is employed to classify five various classes of arrhythmias from the MIT-BIT database and all 13 groups from the UCI arrhythmia database. Pelican Optimization Algorithm (POA) is used to minimize the detection error rate and complexity time by optimizing the parameters of the 3D-CNN and selecting parameters for the membership function. We used five distinct types (NSR, LBBB, RBBB, APB, and PVC) of ECG data in the MIT-BIH arrhythmia database and 13 different types (AF, LV, R, L, S, V, SB, ST, IM, AM, IC, NH, Q) from UCI Arrhythmia database. Experiments are conducted using the proposed approach using MATLAB, and its results are evaluated to that of modern techniques, such as BaROA-DCNN, CNN+LSTM, GA-BPNN, and DCNN. The proposed framework gives an average accuracy of 98.6%, 98.52% precision, 98.45% of specificity, 98.48% F1-score, 98.35% of Recall and error rate detection is 1.032 in MIT-BIH arrhythmia dataset. For the UCI Arrhythmia dataset, the proposed method gives an average of 99.4% accuracy, 99.38% precision, 99.24% of specificity, 99.28% F1-score, 99.31% of Recall and the error rate detection is 0.6. When compared to recent works, the proposed method has shown better heart signal detection and classification outcomes. The classification results indicate that one-against-one method is best suited for classification on the ECG dataset taken from UCI repository. The comparison of the chosen assessment measures revealed that the recommended strategy outperformed more recent alternatives in terms of performance. Future research will attempt to integrate the deep model with other deep learning techniques in an aim to improve the classification accuracy of arrhythmia heart rhythm.
Declarations
Conflict of interest
All authors declare that they have no conflict of interest.
Funding
The authors declare that no funding, grants, or other support were received.