
Abstract
Objectives
The automated classification of electrocardiogram (ECG) scatter plots has significant clinical value for the rapid diagnosis of cardiac arrhythmias. However, existing methods based on convolutional neural networks (CNNs) are constrained by their local receptive fields, which limit their ability to effectively capture the non-local contextual relationships and global features essential for classification. This study aims to design and validate a novel deep learning model to overcome these limitations by effectively learning long-range dependencies and key discriminative regions within ECG scatter plots, thereby improving the accuracy of arrhythmia classification.
Methods
This study proposes a vision transformer (ViT) network based on Token Selection. The method first segments the ECG scatter plot into a sequence of patches and utilizes the self-attention mechanism of the Transformer encoder to model global contextual information. The core innovation is the introduction of a Token Selection module deep within the network, which dynamically filters the most discriminative patches (Tokens) to be used for final classification. This enables the model to focus on critical regions decisive for diagnosis while reducing interference from redundant information.
Results
The proposed model was validated on real ECG scatter plot datasets. Experimental results demonstrate that the method achieves superior classification accuracy, outperforming traditional CNN-based models.
Conclusion
This study establishes a vision transformer model with token selection, providing an effective and precise solution for the automated classification of ECG scatter plots. By overcoming the limitations of conventional CNN methods, this model demonstrates exceptional capability in capturing both global and key local features, thus offering a novel approach for the advancement of automated arrhythmia diagnosis technology.
Introduction
In recent years, cardiovascular diseases (CVDs) have become one of the most significant threats to human health. 1 The electrocardiogram (ECG), owing to its non-invasive nature and portability, is widely used for the diagnosis of cardiac diseases. 2 With the advancement of electrocardiographic technology, the utilization of electrocardiogram scatter plots has gradually gained momentum. Most dynamic electrocardiography (DCG) analyzers now include automated scatter plot analysis software that primarily assesses changes in RR intervals. This differs significantly from the conventional template analysis software in terms of operational perspective, particularly in diagnosing arrhythmias and analyzing heart rate variability (HRV). ECG scatter plots enable rapid identification of abnormal conditions such as premature ventricular contraction (PVC), supraventricular premature contraction (SVPC), atrial fibrillation (AF), atrial fibrillation with premature ventricular contraction, and atrial flutter (AFL). They hold considerable clinical utility in diagnosing arrhythmias and warrant clinical dissemination. Esperer reported that utilization of two-dimensional Lorenz plots generated from 24-h holter recordings has shown potential in improving the accuracy of detecting and distinguishing major tachyarrhythmias. This method, particularly beneficial in cases involving supraventricular tachyarrhythmias, offered a promising approach to enhancing the precision of arrhythmia identification and differentiation. 3 Borracci conducted a study in which they found that Modified Poincaré plots, also known as Lorenz scatter plots, with smoothed lines connecting successive points, could effectively classify various types of arrhythmias based on short RR interval sequence variability. The research revealed that distinct emergent patterns could be visually identified, offering the potential for automatic classification systems to differentiate between different arrhythmias. This work introduces an alternative approach for interpreting time-delay plots derived from short-term EKG signal recordings. 4 Ultimately, the Lorenz scatter plot presents a valuable tool in aiding clinicians in the diagnosis of arrhythmias and could potentially be integrated into automatic classification systems for enhanced diagnostic accuracy.
Currently, the discrimination of ECG scatter plots largely relies on the manual observation of cardiologists. Given the diverse array of cardiovascular diseases and the multifaceted characteristics of ECG scatter plots, fast and accurate image recognition requires a certain level of expertise and clinical experience from the clinician. Furthermore, the diagnostic process is inherently subjective, influenced by clinician interpretation and cognition, and long hours of heavy workload can lead to physician fatigue, increasing the likelihood of misdiagnosis and missed. Consequently, automated identification of cardiac arrhythmias has emerged as a research hotspot. This approach serves to assist physicians in diagnosis and enhance overall workflow efficiency. 5
Traditional automatic electrocardiogram identification primarily relies on machine learning (ML). Li et al. introduced a novel approach wherein wavelet packet entropy (WPE) was manually extracted as features from the ECG signals, followed by input into a random forest (RF) model for electrocardiogram recognition and classification 6 . Asl et al. and Elhaj et al. utilized linear and nonlinear methods to extract features from heart rate variability (HRV), and subsequently employed a support vector machine (SVM) in combination with a one-versus-many strategy for HRV signal classification, achieving favorable classification results.7,8 Traditional machine learning depends on manually extracting features from electrocardiograms or ECG signals, a process that is complex, time-consuming, and challenging to ensure accuracy. With the continuous development of deep learning (DL), an increasing number of studies are inclined towards using DL to automatically extract features from electrocardiograms, enabling automatic detection and identification of one or multiple potential heart diseases. Deep learning is particularly sensitive to local details and can automatically extract rich image features. Several typical algorithms have been employed in research, including stacked autoencoders (SAE), deep belief networks (DBN), convolutional neural networks (CNN), and recurrent neural networks (RNN). A review of existing studies applying deep learning to ECG diagnosis reveals that these methods have achieved high accuracy in ECG signals classification. 9 Ullah and Huang transformed ECG time series signals into two-dimensional (2-D) spectrograms using the Fourier transform (FT) and utilized two-dimensional convolutional neural network(2-D CNN) model to identify arrhythmias.10,11 This approach successfully accomplished multi-label classification tasks including normal beat, premature ventricular contraction beat (PVC), paced beat (PAB), right bundle branch block beat (RBB), left bundle branch block beat (LBB), and atrial premature contraction beat (APC), achieving an average classification accuracy of 99.11%. Researchers12,13 employed convolutional neural network (CNN) and bidirectional Long Short-Term Memory(LSTM) to capture contextual relevance of ECG features for automatic arrhythmia classification. Reference 14 utilized CNN for classifying arrhythmia data and achieved different classification outcomes by configuring different convolutional layers. Donida Labati et al. and Acharya et al. utilized a deep convolutional neural network to extract important features from one or multiple leads and compared ECG feature templates using a simple and fast distance function, resulting in higher accuracy.15,16 However, neural networks like CNN suffer from limited receptive fields of the convolutional kernels, lack a holistic understanding of image information, and may extract many irrelevant redundant features, making it difficult to capture long-distance dependencies and impacting the performance of multi-label classification.
To this end, researches 17 have applied the structure of vision transformer (ViT), based on the mechanism of attention, to medical imaging tasks, assisting convolutional neural network (CNN) in extracting image features. The Transformer 18 can simultaneously capture all information within the entire image, and the attention mechanism's architecture aids the model in focusing on meaningful regions. A transformer-based deep learning neural network, electrocardiogram detection transformer (ECG DETR), has been proposed, which performs arrhythmia detection on continuous single-lead electrocardiogram segments, significantly enhancing classification performance. 19 Literature 20 connects features extracted by a Transformer model from RR intervals with attention modules for final electrocardiogram classification. Experimental results demonstrate that the proposed model achieves higher accuracy on the original dataset. Jamil 21 utilizes ViT to identify phonocardiogram (PCG) signals for rapid and accurate diagnosis of valve heart disease (VHD) at its early stages. The achieved results exhibit an accuracy rate of up to 99.9%, surpassing the current state-of-the-art VHD classification models. Natarajan et al. 22 introduce a waveform Transformer that projects electrocardiogram segments through a multi-layer perceptron into one-dimensional vectors, which are then combined with positional embeddings as inputs to the Transformer encoder for final electrocardiogram classification. Experimental results demonstrate that this model exhibits excellent performance in classification tasks. From the aforementioned studies, it can be concluded that Vision Transformer has achieved promising results in electrocardiogram classification, and has improved recognition accuracy compared to deep learning (DL) models such as CNN and LSTM. Literature 18 points out that when Transformer models are input into higher layers of the encoder, single-layer attention weights may not necessarily represent the importance of the original input tokens. In cases where original images, such as scatter plots of electrocardiograms, contain large amounts of blank or irrelevant areas, the recognizability of high-level tokens obtained after multiple layers of computation may be insufficient. Therefore, this study proposes an improved ViT network (TSViT) for ECG scatter plots classification. To further extract discriminative features, a local token selection module is introduced before the final Transformer input. This module merges the attention weights from earlier layers and selects tokens representing discriminative regions as inputs for the final layer while disregarding redundant information. Subsequently, the classification vector is concatenated with the selected tokens to retain global information, and the classifier outputs the results. The network architecture model of TSViT is illustrated in Figure 1. On the left side of Figure 1 is the overall framework of the network. The image to be classified is segmented into multiple patches, which are input into a linear mapping layer along with positional encodings before being fed into the Transformer encoder. To enhance the network's ability to recognize local discriminative features in electrocardiogram scatter plots, the penultimate layer of the Transformer encoder in ViT is modified into a token selection module. This module selects tokens with discriminative characteristics to remove interference from redundant information. The right-hand side of Figure 1 depicts the internal structure of the Transformer.

The TSViT network architecture.
Methods
Dataset
The experimental dataset comprised 9000 scatter plots of electrocardiogram, collected from patients with arrhythmia and sinus rhythm (SR) who underwent twelve-lead dynamic electrocardiogram examinations in the Department of Electrocardiographic Diagnosis, the Second Affiliated Hospital of Anhui Medical University, from December 2022 to March 2024. The dataset included five types of arrhythmias: ventricular premature beats, supraventricular premature beats, atrial fibrillation, atrial fibrillation with ventricular premature beats, and atrial flutter. The diagnoses were established based on the gold standard provided by expert clinicians and other diagnostic machines in the hospital, and the dataset were manually annotated. Prior to the experiments, the dataset underwent preprocessing, where all input images were resized to 224*224 pixels. To prevent overfitting during training, data augmentation techniques were applied to the training set, including horizontal flipping, perspective transformation, shearing, rotation, translation, scaling, and brightness adjustment.
Experimental setup
The experiment was conducted using Python 3.8 with the PyTorch framework version 1.7.1. The experimental environment consisted of an Intel(R) Core(TM) i9-7900X processor and an NVIDIA RTX 3090 GPU.
The batch size was set to 64, the initial learning rate was set to 0.001, and the Adam optimizer was selected as the optimizer. 23 The loss function used was the cross-entropy loss function.
The original dataset comprised a total of 9000 ECG scatter plot images, with each type having 1200 images in the training set, 150 images in the test set, and 150 images in the validation set.
The feasibility of the method is determined using the following four performance metrics: true positive (TP), true negative (TN), false positive (FP), and false negative (FN). TP represents the number of abnormal traces correctly identified, TN represents the number of normal traces correctly identified, FP represents the number of normal traces incorrectly identified as abnormal, and FN represents the number of abnormal traces incorrectly identified as normal. These metrics are summarized into the following evaluation indicators:
Precision (P) = TP / (TP + FP): Precision measures the proportion of correctly identified abnormal behaviors among all identified abnormal behaviors. It is used to assess the accuracy of abnormal behavior identification.
Recall (R) = TP / (TP + FN): Recall measures the proportion of correctly identified abnormal behaviors among all actual abnormal behaviors. It evaluates the algorithm's ability to identify abnormal behaviors.
The formula for calculating the

The
The Transformer is a deep learning (DL) network equipped with an attention mechanism, comprising mainly encoder and decoder components. The encoder is responsible for encoding various word vectors, while the decoder generates predicted translation results. In the context of image classification, the vision transformer (ViT) shares a similar network structure to the Transformer, featuring an encoder. However, the ViT, which is used for image classification, has a similar network structure to the Transformer, and the main structure has an encoder, with the difference that ViT outputs predictions from the encoder outputs directly into a multilayer perceptron, which completes the classification task and no longer needs a decoder. The ViT network architecture primarily consists of an encoder, self-attention mechanisms, multi-head attention, and multi-layer perceptrons (MLP). In clinical practice, Lorenz plots of the ECG include two types: the RR interval scatter plot and the RR interval difference Lorenz plot. 24 Both types of plots are two-dimensional graphs derived from iterative calculations, and they reflect dynamic changes in cardiac rhythms. The formation of these images is influenced by the so-called attractors, which are divided into two types: homeostatic and non-homeostatic attractors. Homeostatic attractors refer to a cardiac rhythm that is always consistent in its origin and usually manifests itself as a sinus rhythm. Non-stationary attractors, on the other hand, appear when the heart's rhythm changes from one state to another, and they have different morphologies and characteristics, with ventricular rhythms being the common type. By looking at the graphical features of the Lorenz diagram, doctors can categorize arrhythmias. For example, sinus rhythm shows a specific distribution pattern in the graph, while atrial fibrillation shows a fan-shaped distribution. Supraventricular premature beats usually show a three-cluster distribution on the graph, premature ventricular contraction show a four-cluster distribution, and parallel rhythms show inverted Y distribution on the graph.
This paper focuses on the analysis of scatter plots of electrocardiograms, specifically Lorenz-RR scatter plots. 25 The principle of plotting is that the first RR interval is the horizontal coordinate and the second RR interval is the coordinate. The Lorenz plot is constructed by plotting the scatter over a period of time to show the characteristic information of the ECG signal, the principle is shown in Figure 2.

Principle diagram of ECG Lorenz plot.
In these scatter plots, the “B-line” refers to the line closest to the x-axis, formed by points preceding each premature beat and their preceding sinus RR intervals. The B-line can also represent the edge of the graph, adjacent to the x-axis. Diagnostic criteria for ECG scatter plots5,26 include: premature ventricular contraction, characterized by primarily quadriphasic distribution with some biphasic or triphasic patterns, and a B-line slope approaching zero; supraventricular premature beat, mostly displaying triphasic distribution with some quadriphasic patterns, and a B-line slope ranging from 0.132 to 0.506; atrial fibrillation (AF), indicated by a fan-shaped scatter plot with a base slope >0.11; atrial fibrillation with premature ventricular beat, featuring a fan-shaped scatter plot with a linear component parallel to the x-axis; atrial flutter, observed as an orderly grid-like distribution of scatter points. 27 Figure 3 (Source from 28 ) illustrates the shapes of six types of ECG scatter plots, with Plot A representing a sinus rhythm (SR) scatter plot.
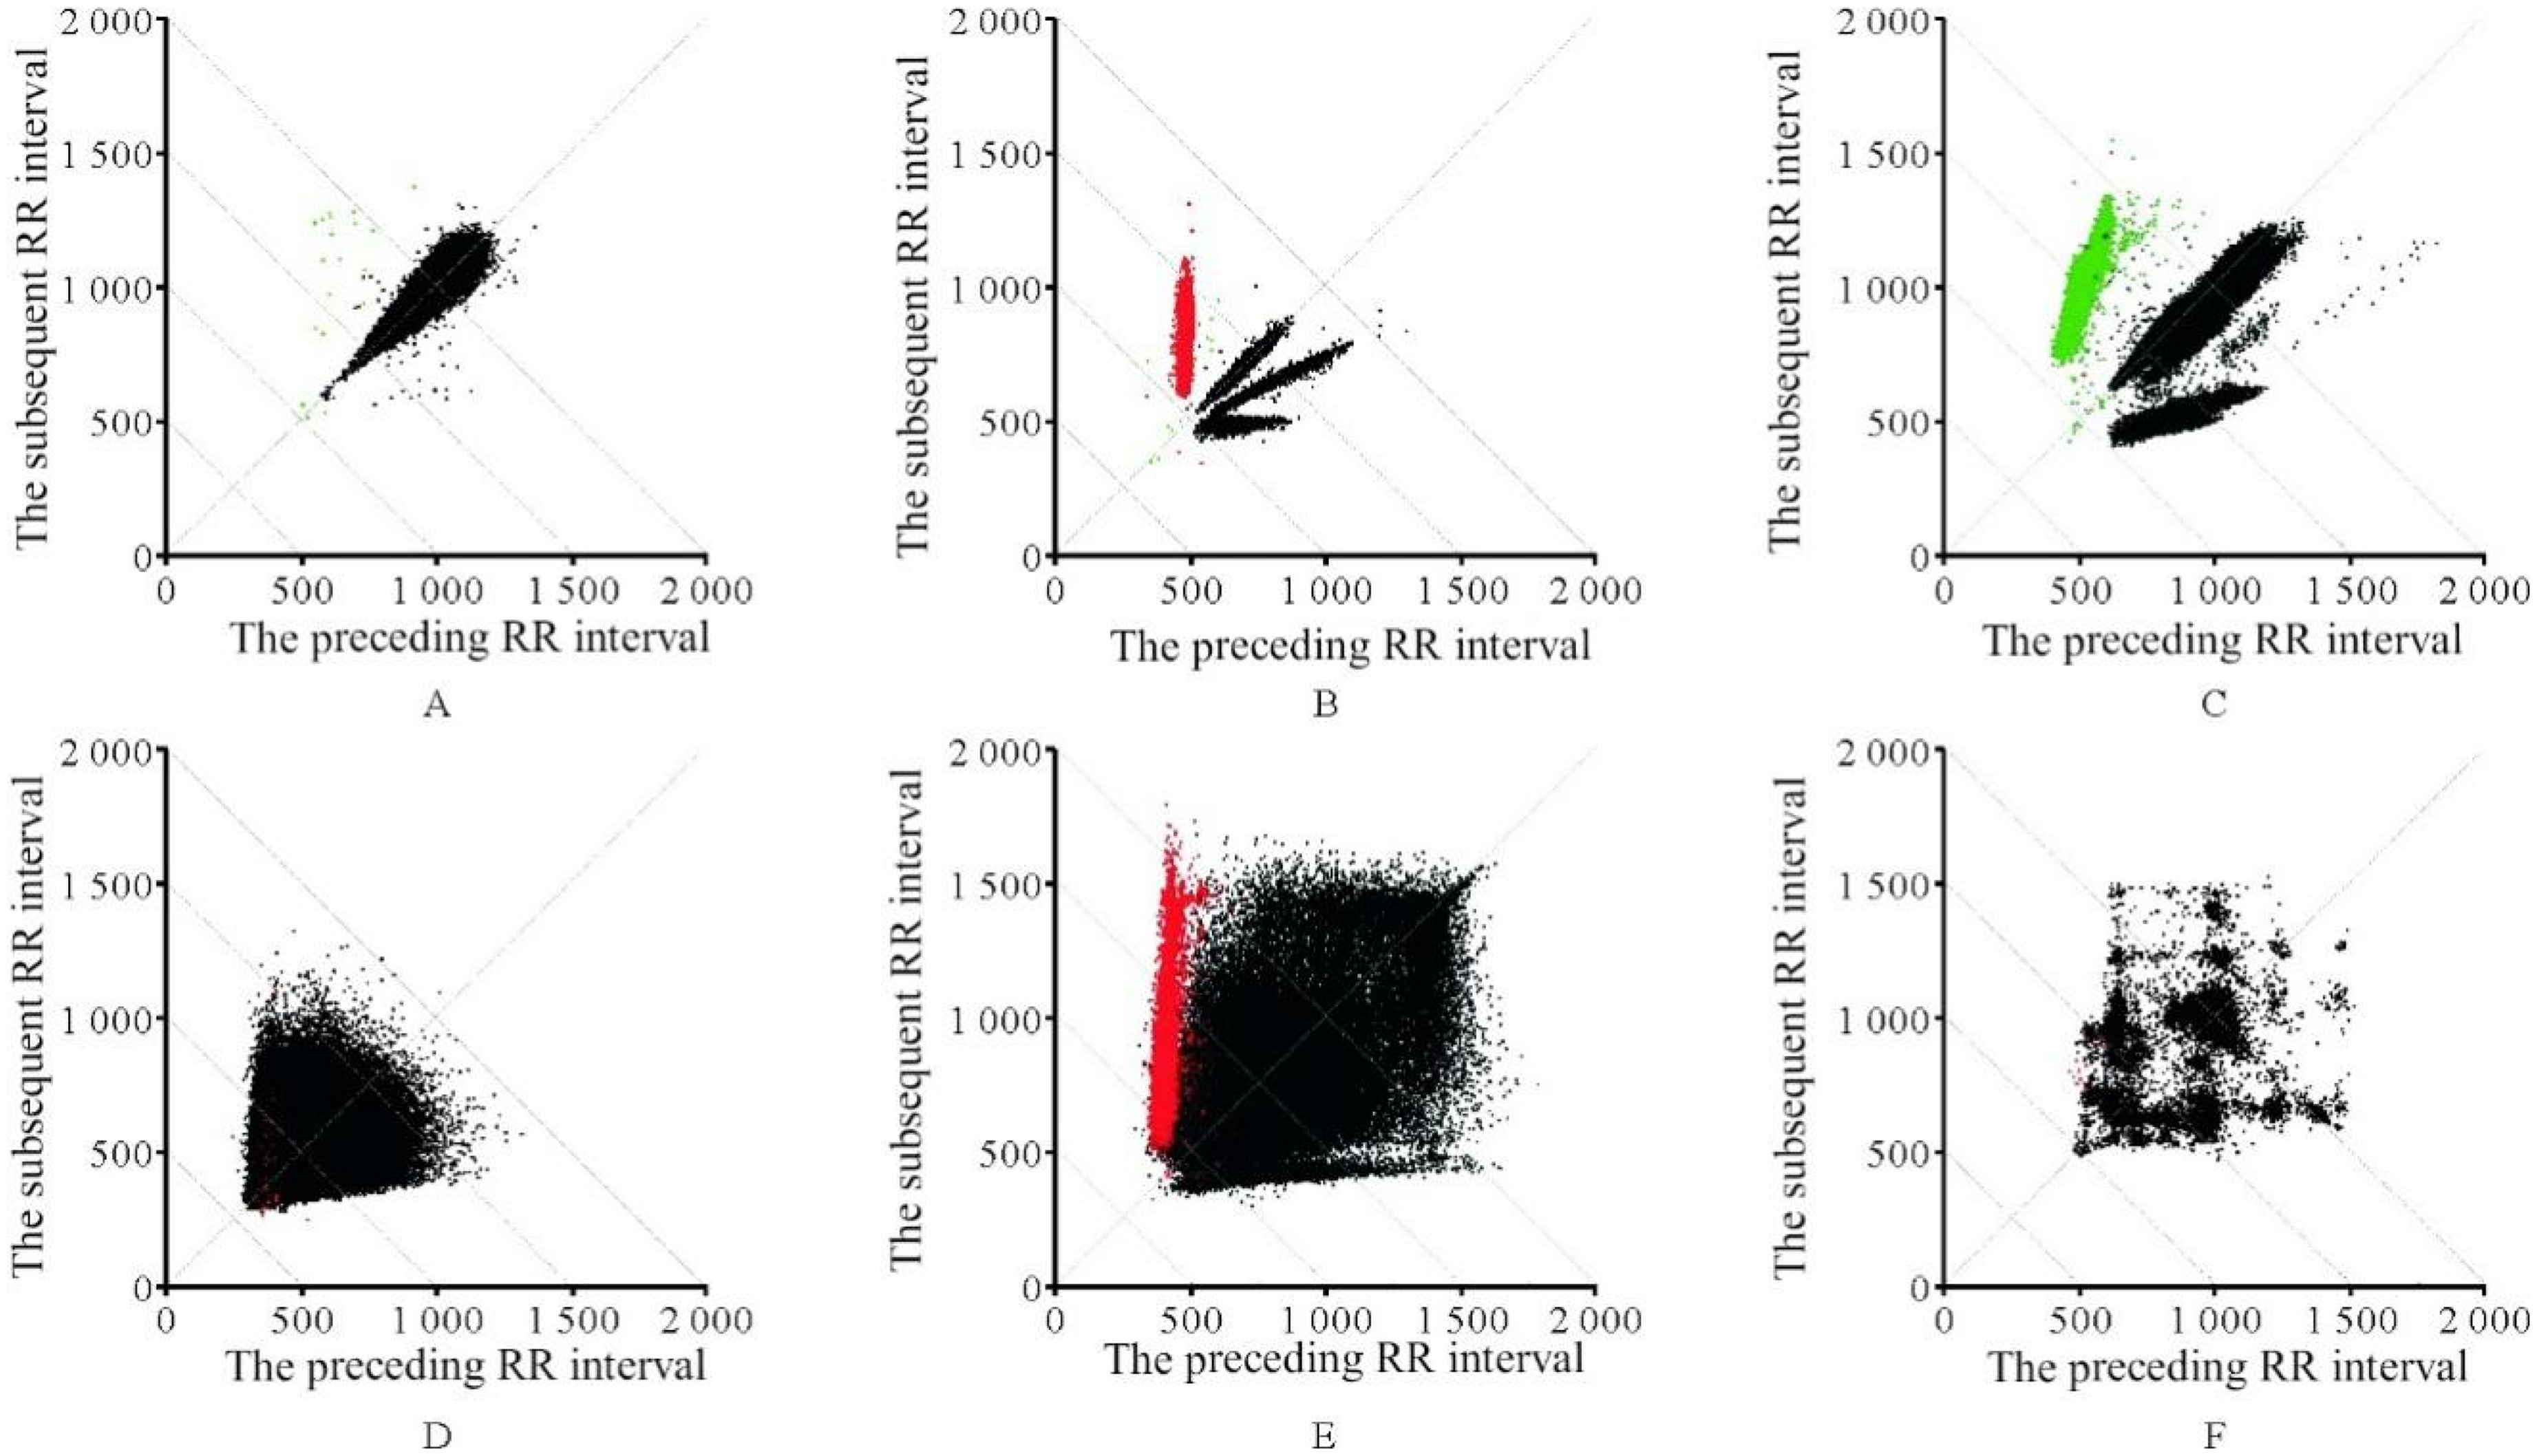
ECG scatter plot categories. A: normal sinus rhythm; B: ventricular premature beats; C: supraventricular premature beats; D: atrial fibrillation(AF); E: atrial fibrillation with ventricular premature beats; F: atrial flutter.
Data processing pipeline
Encoder
Since the encoder of the transformer requires one-dimensional vectors as input, preprocessing of the input image is necessary to embed it. This involves segmenting the image into patches, which are then composed into vectors for input into the network. Specifically, given an input image
Incorporating positional information into the Transformer model is essential. To capture positional variables, positional encoding

Multi-head attention (MSA)
MSA is the core module in the encoder, derived from self-attention. A self-attention head learns attention weights by computing the dot product of queries (Q), keys (K), and values (V). In the self-attention layer, the input is first subject to three independent linear transformations to obtain query matrix (Q), key matrix, and value matrix. The calculation formula is as follows:

In the formula,

In the formula,


Self-attention computation process.
In the formula,
Multi-layer perceptron (MLP)
The MLP consists of two fully connected layers and employs Gaussian error linear units (GELU) as the activation function. The structure of the MLP is as follows:

In the equation,
Both MSA and MLP employ skip connections and are preceded by layer normalization (LN). Therefore, the main process in the Transformer encoder can be summarized as follows:


In the equation,
Token selection module
Typically, Lorenz-RR scatter plot images contain numerous irrelevant regions, 29 and focusing on discriminative local areas can significantly enhance classification effectiveness. Therefore, a token selection module is integrated into the conventional ViT architecture to capture locally important information, thereby strengthening the network's classification capability.
As the final output includes an abundance of global information, the Token Selection Module operates before the input to the encoder's penultimate layer. It selects tokens containing more discriminative features as input, while disregarding tokens containing redundant information.
The hidden features output from the (L-1)th layer are denoted as

The

Grid optimization
To accelerate the convergence speed of the proposed network and prevent overfitting, this experiment incorporates the dropout optimization method proposed in literature 31 into the fully connected layers. This optimization method involves dropping connections of some nodes in the hidden layers to prevent the reliance on specific combinations of features, thus enabling the model to learn more general patterns. The Adam optimizer is chosen for its simplicity, computational efficiency, and the interpretability of its hyperparameters. 23
Results
Ablation study
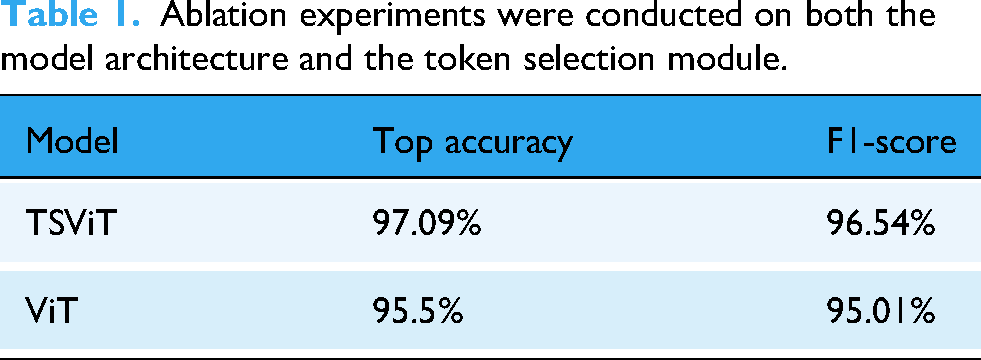
In order to analyze the impact of Vision Transformer, and the token selection module on the model, ablation experiments were conducted. The experimental results are presented in Table 1. As the results indicate, the proposed network with the ViT + Token Selection module achieved higher classification results than the baseline ViT, improving the accuracy by 1.5%.
Ablation experiments were conducted on both the model architecture and the token selection module.
In order to further improve the model accuracy, experiments were conducted on the batch size used during training. 32 The batch size refers to the number of samples selected for a single training iteration, where the model optimizes parameters through backpropagation for each batch. The influence of different batch sizes on model classification accuracy was demonstrated by training the model with batch sizes of 1, 4, 16, and 32, respectively. According to the experimental results (Figure 5), using smaller batch sizes can increase the number of parameter optimization iterations during model training. This allows the model to achieve higher accuracy on small-scale datasets. Although this approach may increase training time, more frequent parameter updates enable the model to better adapt to the dataset's features, thereby enhancing its performance. Therefore, when dealing with small-scale datasets and aiming for higher accuracy, selecting smaller batch sizes for training the TSViT model can be considered.

Comparative experiments between different batches.
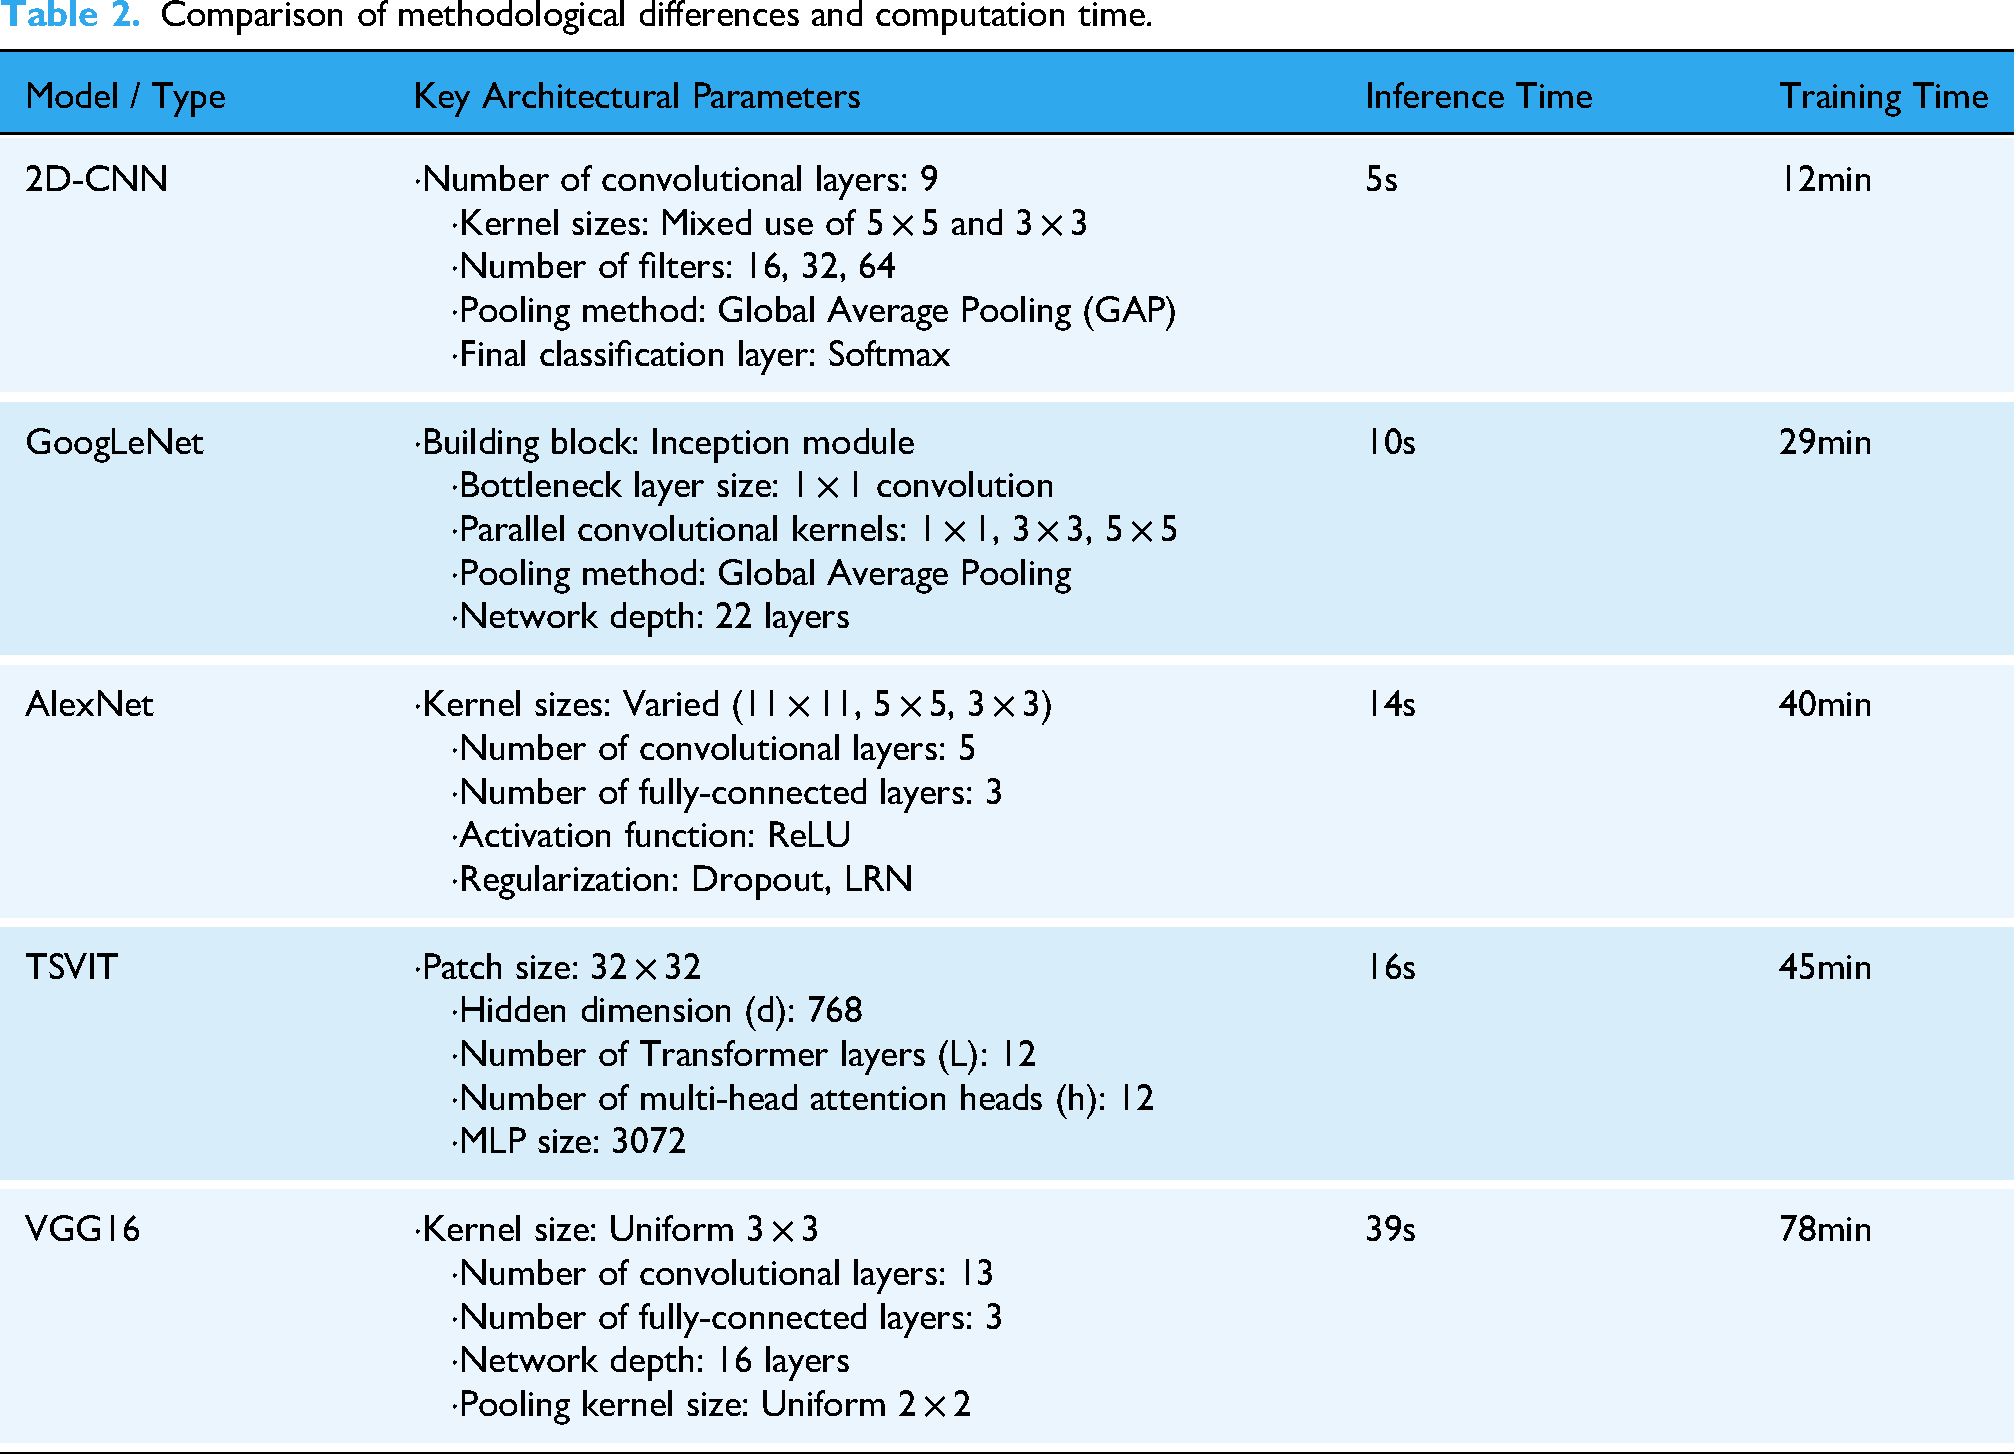
In addition to validating the impact of the Token Selection module, we conducted comparative experiments against three established recognition networks: VGG16, 33 GoogleNet, 34 and AlexNet. 35 To investigate the direct influence of model architecture on computational efficiency, we focused on comparing the core parameters and the time performance of each architecture for both inference and training tasks, as detailed in Table 2. The analysis of the data reveals that a model's architectural design is the decisive factor in its time efficiency. For instance, models like 2D-CNN and GoogLeNet achieve high computational speeds due to their relatively simple designs, featuring stacked convolutional layers and global average pooling. In contrast, our proposed TSVIT method is a highly complex model designed to capture global information through its unique architectural parameters, including patch size, multiple stacked Transformer layers, and the multi-head self-attention mechanism. This architectural complexity is directly reflected in a higher computational cost, resulting in longer times for inference and training. Nevertheless, we contend that this increased time investment is a necessary trade-off for achieving superior performance. As subsequent experimental results will demonstrate, it is precisely these architectural features that endow our model with its exceptional feature learning capabilities, allowing it to attain the highest performance on the critical metric of classification accuracy.
Comparison of methodological differences and computation time.
In order to provide a comprehensive reflection and evaluation of the performance of the proposed network, confusion matrices were used to illustrate the actual recognition performance of the four networks for each type of scatter plot. The results are shown in Figure 6, where 1, 2, 3, 4, 5, and 6 represent premature ventricular beats, supraventricular premature beats, atrial fibrillation, atrial fibrillation with ventricular premature beats, atrial flutter, and normal sinus rhythm (NSR) respectively. From Figure 6, it can be observed that all networks exhibit a higher rate of misclassification for scatter plot types 3 and 4. This is attributed to the similarity in morphology between atrial fibrillation (AF) and atrial fibrillation with ventricular premature beats. Overall, the TSViT model demonstrates good recognition capabilities for all six types of ECG scatter plots, with the majority of scatter plot categories being correctly identified.

Confusion matrix results for different models. (a) TSViT; (b) VGG16; (c) AlexNet; (d) GoogleNet.
The precision, recall, and F1-score of each network were calculated using the confusion matrix as evaluation metrics to assess the recognition performance of the networks.
Table 3 presents the evaluation results for different models. It can be observed that the ECG scatter plot abnormal identification based on the TSViT model shows improvements in precision, recall, and F1-score compared to the VGG16, AlexNet, and GoogleNet models. Specifically, the precision increased by 9.57%, 16.39%, and 4.41% respectively, the recall increased by 8.34%, 15.73%, and 3.6% respectively, and the F1-score increased by 8.95%, 16.06%, and 4% respectively. Therefore, the proposed TSViT model further enhances the accuracy of ECG scatter plot recognition. Figures 7 and 8 show the original and marked images of the ECG scatter plot, respectively.
Comparative Experiments

Original images.

Marked images.
Evaluation results of different models.

To gain a deeper understanding of the performance advantages of the proposed network over other recognition networks, the receiver operating characteristic (ROC) curve was employed to visualize their performance. The comparative method was a 2D-CNN-based approach for ECG scatter plot recognition, as proposed in the literature. The results are shown in Figure 9, which presents the ROC curves and their corresponding area under the curve (AUC) values for each network across the different classes.

ROC curves and AUC values of the proposed method compared with state-of-the-art methods.
The ROC curve is plotted with the false positive rate (FPR) on the x-axis and the true positive rate (TPR) on the y-axis, allowing for a rapid assessment of a classifier's performance on ECG scatter plots at various thresholds. The closer the curve is to the top-left corner, the lower the misclassification rate and the higher the sensitivity. The AUC, representing the area under the ROC curve, is a metric used to measure the model's generalization ability and reflects the overall classification capability. A higher AUC value indicates better classification performance.
By analyzing both the ROC curves and the AUC values, it can be concluded that TSVIT demonstrates a superior performance in identifying abnormalities in ECG scatter plots compared to the existing method, exhibiting better robustness and generalization capabilities.
Conclusion
Building upon the success of vision transformer (ViT) in image classification tasks, the TSViT approach is proposed for abnormal classification of electrocardiogram (ECG) scatter plots. Considering that ECG scatter plot images often contain significant blank and irrelevant areas, a token selection module is introduced before the final layer of the transformer encoder to select discriminative tokens as input, thereby obtaining the output used for classification. Experimental results demonstrate that the TSViT model achieves superior performance on real ECG scatter plot datasets. In the future, research will focus on exploring lightweight vision transformer models for more precise ECG scatter plots classification, as well as developing applications based on relevant algorithms to facilitate their integration into clinical practice more effectively.
Footnotes
Ethics statement
This study was approved by the Ethics Committee of The Second Affiliated Hospital of Anhui Medical University (Approval No. SL-YX2024-081), and written informed consent was obtained from all participants prior to the initiation of the study.
CRediT authorship contribution statement
WYT: Conceptualization, Methodology, Software, Writing – original draft, Writing – review & editing. XXY: Resources, Writing – original draft. GXY: Methodology, Writing – original draft. CQ: Investigation, Writing – original draft. YCY: Investigation, Writing – original draft. HF: Conceptualization, Software, Investigation, Validation, Writing – original draft, Writing – review & editing. CJ: Funding acquisition, Supervision, Validation, Writing – original draft, Writing – review & editing.
Funding
The author(s) declare that financial support was received for the research, authorship, and/or publication of this article. This research was supported by the Key Scientific Research Projects of Universities in Anhui Province(2023AH053177), Key Social Research Projects of Universities in Anhui Province(2023AH050722).
the Key Scientific Research Projects of Universities in Anhui Province, Key Social Research Projects of Universities in Anhui Province, (grant number 2023AH053177, 2023AH050722).
Declaration of conflicting interests
The authors declared no potential conflicts of interest with respect to the research, authorship, and/or publication of this article.