
Abstract
Background:
Astrocyte reactivity is an early event along the Alzheimer’s disease (AD) continuum. Plasma glial fibrillary acidic protein (GFAP), posited to reflect astrocyte reactivity, is elevated across the AD continuum from preclinical to dementia stages. Monoamine oxidase-B (MAO-B) is also elevated in reactive astrocytes observed using 18F-SMBT-1 PET in AD.
Objective:
The objective of this study was to evaluate the association between the abovementioned astrocyte reactivity biomarkers.
Methods:
Plasma GFAP and Aβ were measured using the Simoa® platform in participants who underwent brain 18F-SMBT-1 and Aβ–PET imaging, comprising 54 healthy control (13 Aβ–PET+ and 41 Aβ–PET–), 11 mild cognitively impaired (3 Aβ–PET+ and 8 Aβ–PET–) and 6 probable AD (5 Aβ–PET+ and 1 Aβ–PET–) individuals. Linear regressions were used to assess associations of interest.
Results:
Plasma GFAP was associated with 18F-SMBT-1 signal in brain regions prone to early Aβ deposition in AD, such as the supramarginal gyrus (SG), posterior cingulate (PC), lateral temporal (LT) and lateral occipital cortex (LO). After adjusting for age, sex, APOE ɛ4 genotype, and soluble Aβ (plasma Aβ42/40 ratio), plasma GFAP was associated with 18F-SMBT-1 signal in the SG, PC, LT, LO, and superior parietal cortex (SP). On adjusting for age, sex, APOE ɛ4 genotype and insoluble Aβ (Aβ–PET), plasma GFAP was associated with 18F-SMBT-1 signal in the SG.
Conclusion:
There is an association between plasma GFAP and regional 18F-SMBT-1 PET, and this association appears to be dependent on brain Aβ load.
Keywords
INTRODUCTION
The current core biomarkers for Alzheimer’s disease (AD) include abnormal brain amyloid-β (Aβ) and tau accumulation assessed via positron emission tomography (PET), and abnormal cerebrospinal fluid (CSF) Aβ42/Aβ40 ratio and phosphorylated-tau181 (p-tau181) levels assessed via immunoassays. However, due to the costs, limitations with widespread availability, and relative invasiveness associated with these core biomarkers, research has focused on the development of high accuracy surrogate blood-based biomarkers such as plasma Aβ42/Aβ40 ratio [1, 2], plasma phosphorylated tau isoforms (p-tau181, p-tau231, p-tau217) [3–5], as well as plasma glial fibrillary acidic protein (GFAP) [6–8].
GFAP, an astrocyte cytoskeletal protein, is upregulated in reactive astrocytes [9]. Reactive astrocytes surround Aβ plaques, and GFAP upregulation in brain tissue is associated with Aβ plaque density [10–12]. It has been suggested that reactive astrocytes release GFAP into blood via astrocyte end-feet encompassing brain capillaries [13]. Indeed, plasma GFAP levels are elevated in individuals with high Aβ in the brain (Aβ+) compared to those with low Aβ in the brain (Aβ–) [6, 15]; and have demonstrated high accuracy in differentiating Aβ+ from Aβ–participants, as assessed by PET, along the AD continuum [12]. Furthermore, plasma GFAP has a higher accuracy than CSF GFAP in distinguishing Aβ+ from Aβ–participants [8] and can predict progression from the mild cognitive impaired stage (MCI; prodromal AD) to AD [15].
In addition to expressing high levels of GFAP, reactive astrocytes overexpress the enzyme monoamine oxidase B (MAO-B), and therefore MAO-B has been used as a brain imaging marker for reactive astrocytes [16, 17]. Evidence of astrocyte reactivity using MAO-B tracers such as 11C-L-deprenyl-D2 (11C-DED) has been reported in prodromal AD [16, 17]. Recently, a novel 18F MAO-B PET tracer, (S)-(2-methylpyrid-5-yl)-6-[(3-18F-fluoro-2-hydroxy)propoxy] quinoline (18F-SMBT-1) with reversible binding kinetics [18, 19] demonstrated higher binding in the brain of Aβ+ AD compared with Aβ–healthy controls (HC) [20]. Further, significantly higher 18F-SMBT-1 binding has been observed in Aβ+ HC compared with Aβ–HC in several brain regions associated with early Aβ accumulation, including superior parietal, lateral occipital, posterior cingulate, supramarginal gyrus, and lateral temporal cortex [20–22], suggesting that astrocyte reactivity assessed using 18F-SMBT-1 PET is associated with early Aβ accumulation from the preclinical stage of AD.
While both plasma GFAP and 18F-SMBT-1 PET are potential astrocyte markers, previous studies have not yet investigated whether an association exists between the two astrocyte markers. Further, since activation of astrocytes has been reported to be in response to soluble Aβ and insoluble Aβ [23–26], whether soluble or insoluble Aβ influences this association is also of interest. Additionally, the comparison of the association of both astrocyte markers with cognitive performance is of interest. To address this gap in the literature, the current study investigated whether plasma GFAP and 18F-SMBT-1 PET are associated, accounting for soluble Aβ (plasma Aβ1 - 42/Aβ1 - 40 ratio) and/or aggregated Aβ (Aβ PET). While different astrocyte markers may reflect different astrocyte states, we hypothesize that plasma GFAP will be associated with 18F-SMBT-1 PET and this association is Aβ dependent. Furthermore, given that plasma GFAP is associated with cognitive performance [6, 27], and a preliminary study found an association between 18F-SMBT-1 PET and cognitive performance [20], we also hypothesize that both astrocyte markers, plasma GFAP and 18F-SMBT-1 PET, will be inversely associated with cognitive performance, comparatively.
METHODS
Participants
Non-smoking participants in the current study were selected from the Australian Imaging, Biomarker & Lifestyle Flagship Study of Ageing (AIBL) cohort. Participant exclusion criteria are described in detail elsewhere [28, 29]. Briefly, exclusion criteria comprised history of non-AD dementia, schizophrenia, bipolar disorder, significant current (but not past) depression, Parkinson’s disease, cancer (other than basal cell skin carcinoma) within the last two years, symptomatic stroke, uncontrolled diabetes, or current regular alcohol use exceeding two standard drinks per day for women or four per day for men. Participants were classified as either HC, individuals with AD based on the NINCDS-ADRDA criteria [30], or MCI based on Winblad et al. and Petersen et al. criteria, representing a high-risk state for the development of AD [31, 32]. For the current study, plasma GFAP levels were measured in 71 participants from a subset of 78 AIBL participants that underwent Aβ PET and 18F-SMBT-1 PET, based on plasma sample availability for the corresponding SMBT-1 timepoint. Out of these 71 participants, 59 participants underwent 18F-SMBT-1 imaging within 12 months of blood collection, while 12 participants had 18F-SMBT-1 imaging over 12 months from blood collection (Supplementary Table 1).
This study was approved by the ethics committees of St. Vincent’s Health and Austin Health in Melbourne, Australia and Hollywood Private Hospital, Australia and Edith Cowan University in Perth, Australia and Macquarie University in Sydney, Australia. All participants provided written informed consent before participation.
Neuropsychological tests
Participants underwent a comprehensive battery of neuropsychological tests. However, for this study, the primary measure used to examine cognitive performance was the Mini-Mental State Examination (MMSE; scores range from 0 to 30, indicating severe impairment to no impairment) [33] and the Clinical Dementia Rating scale (CDR; scores range from 0 to 3, indicating no impairment to severe impairment) [34].
Measurement of plasma GFAP, Aβ1 - 40, and Aβ1 - 42
EDTA plasma samples were fractionated from overnight fasted blood. Plasma samples were stored at –80°C prior to thawing for measurement of GFAP, Aβ1 - 40, and Aβ1 - 42 concentrations using the single-molecule array (Simoa®) platform using the Neurology 4-Plex E kit (QTX-103670, Quanterix, Billerica, MA) wherein calibrators were run in duplicates and samples were run in singlicates. Quality control (QC) was achieved by assessing the levels of the positive controls included in the Simoa kits. The analytical lowest limit of quantification was 11.6 pg/ml for GFAP, 1.51 pg/ml for Aβ1 - 42 and 4.08 pg/ml for Aβ1 - 40. The average % CV of the two quality controls were 1.68% and 1.46% for GFAP, 1.28% and 1.06% for Aβ1 - 42 and 0.2% and 2.19% for Aβ1 - 40, respectively.
Determination of Apolipoprotein E (APOE) ɛ4 carrier status
The APOE ɛ4 genotype is a known genetic risk factor for AD. The APOE genotype was determined from purified genomic DNA extracted from 0.5 ml whole blood. Each sample was genotyped for the presence of the three APOE variants (ɛ2, ɛ3, and ɛ4) based on TaqMan SNP genotyping assays for rs7412 (C 904973) and rs429358 (C 3084793) as per the manufacturer’s instructions (AB Applied Biosystems by Life Technologies, Scoresby, VIC, Australia). Five percent of the samples were genotyped in duplicate and 100% inter- and intra-assay concordance was observed.
PET imaging
PET studies were conducted at the Department of Molecular Imaging & Therapy, Austin Health in Melbourne, Australia. All participants underwent Aβ PET imaging with either 18F-Flutemetamol (FLUTE, n = 3), 18F-Florbetapir (FBP, n = 2), or 18F-NAV4694 (NAV, n = 66) to determine neocortical Aβ load. NAV and FBP were synthesized in-house, as previously reported [35–37]. FLUTE was manufactured by Cyclotek Pty Ltd (http://www.cyclotek.com). The NAV and FBP PET scan acquisition consisted of 20 min (4×5 min) dynamic scans acquired at 50 min after an intravenous bolus injection of 185 MBq (±10%) of NAV or FBP. Similarly, the participants who received FLUTE also underwent a 20 min (4×5 min) PET acquisition starting at 90 min after injection of 185 MBq (±10%) of FLUTE. All Aβ imaging results were expressed in Centiloids (CL) [35, 39]. Aβ PET scans were spatially normalized and surface projected using CapAIBL [39]. The standard CL method was applied to determine Aβ burden [38]. A CL value >20 was selected to determine a high Aβ (Aβ+) scan [40, 41].
18F-SMBT-1 was synthesized in-house in the Department of Molecular Imaging & Therapy, Austin Health, as previously described [19]. 18F-SMBT-1 yielded a greater than 95% radiochemical purity after high performance liquid chromatography purification, with an average decay-corrected radiochemical yield of 40% and a molar activity at the end of 18F-SMBT-1 synthesis >400 GBq/μmol. 18F-SMBT-1 PET studies were acquired as a 20-min emission scan (4×5 min frames) starting 60 min after an intravenous bolus injection of 185 (±10%) MBq of 18F-SMBT-1. 18F-SMBT-1 PET images were also spatially normalized and surface projected using CapAIBL [42, 43], and regional standard uptake values (SUV) at 60–80 min post injection were normalized using the subcortical white matter (WM) as reference region to generate cortical and subcortical semiquantitative SUV ratios (SUVR). We selected five regions of interest (ROI): supramarginal gyrus, the posterior cingulate, the lateral temporal, the lateral occipital and the superior parietal that were significant in our previous report [20].
No correction for partial volume effects was applied to the PET data.
Statistical analyses
ROI and vertex-wise linear regression analyses were carried out using plasma GFAP levels as the dependent variable and 18F-SMBT-1 SUVR, Aβ PET CL, plasma Aβ1 - 42/Aβ1 - 40 ratio, age, and sex as the independent variables to understand the association between plasma GFAP and 18F-SMBT-1 signal after adjusting for confounding variables in all participants (N = 71). Similar analyses were carried out in participant subsets that: underwent 18F-SMBT-1 imaging within 12 months of blood collection (N = 59), were within the AD continuum (HC Aβ+, MCI Aβ+, AD Aβ+; N = 21) or that comprised cognitively impaired participants (N = 17). Linear regression analyses were also carried out using Aβ PET CL as the dependent variable and plasma GFAP, 18F-SMBT-1 SUVR, plasma Aβ1 - 42/Aβ1 - 40 ratio, age, and sex as the independent variables to understand the association between plasma GFAP and Aβ PET CL after adjusting for confounding variables. Years of education was not included in the above statistical models, because this information was not available for all study participants. Associations for MMSE with age and Aβ PET CL adjusted plasma GFAP and 18F-SMBT-1 SUVR were carried out using Spearman’s correlation (ρ). Shapiro-Wilk tests were used to check normal distributions of model residuals. All analyses were carried out using IBM® SPSS® (v27). p < 0.05 was considered significant.
RESULTS
Table 1 shows participant characteristics including age, sex, and APOE ɛ4 carrier status, MMSE scores, brain Aβ PET load and plasma levels of GFAP and Aβ1 - 42/Aβ1 - 40 ratio. This study included 54 HC (13 Aβ+ and 41 Aβ–), 11 MCI (3 Aβ+ and 8 Aβ–), and 6 probable AD (5 Aβ+ and 1 Aβ–) participants.
Participant characteristics
Sex, age, Apolipoprotein E (APOE) ɛ4 allele status, Mini-Mental State Examination (MMSE) scores, plasma glial fibrillary acidic protein (GFAP) levels, plasma Aβ1 - 42/Aβ1 - 40 ratios, brain Aβ PET and brain monoamine oxidase B expression assessed using SMBT-1 PET in the supramarginal gyrus (SG), posterior cingulate (PC), lateral temporal (LT), lateral occipital (LO), and superior parietal (SP) are presented in participants stratified by clinical status and Aβ PET–/+ status. HC, healthy control; MCI, mild cognitively impaired; AD, Alzheimer’s disease; PET, positron emission tomography, 18F-SMBT-1, (S)-(2-methylpyrid-5-yl)-6-[(3-18F-fluoro-2-hydroxy)propoxy]quinoline; SUVR, standardized uptake value ratio. Plasma GFAP levels and SMBT-1 PET SG, PC, LT, LO, and SP SUVRs were higher in Aβ+ participants (n = 21) compared with Aβ–participants (n = 50) after adjusting for age and sex (p≤0.01). Out of these 71 participants, 59 participants underwent 18F-SMBT-1 imaging within 12 months of blood collection, while 12 participants had 18F-SMBT-1 imaging over 12 months from blood collection (Supplementary Table 1).
Plasma GFAP was significantly associated with 18F-SMBT-1 PET signal in four of the five brain regions examined, including the supramarginal gyrus (Standardized beta; β= 0.361, p = 0.002), posterior cingulate (β= 0.308, p = 0.009), lateral temporal (β= 0.299, p = 0.011), and lateral occipital (β= 0.313, p = 0.008) regions before adjusting for any covariates (Table 2). After adjusting for age, sex, APOE ɛ4 carrier status, and soluble Aβ, plasma GFAP was significantly associated with 18F-SMBT-1 PET signal in all regions: supramarginal gyrus (β= 0.323, p = 0.002), posterior cingulate (β= 0.262, p = 0.011), lateral temporal (β= 0.238, p = 0.019), lateral occipital (β= 0.282, p = 0.010), and superior parietal (β= 0.229, p = 0.024) regions. However, after adjusting for age, sex, APOE ɛ4 carrier status, and insoluble Aβ, plasma GFAP was significantly associated with 18F-SMBT-1 PET signal only in the supramarginal gyrus (β= 0.215, p = 0.038), with a trend towards significance observed in the posterior cingulate (β= 0.190, p = 0.052) and lateral temporal (β= 0.174, p = 0.068) regions (Table 2). On adjusting for soluble Aβ, insoluble Aβ, age, sex, and APOE ɛ4 carrier status, plasma GFAP was significantly associated with 18F-SMBT-1 PET signal in the supramarginal gyrus (β= 0.226, p = 0.027), posterior cingulate (β= 0.198, p = 0.041), and lateral temporal (β= 0.187, p = 0.048), with a trend towards significance observed in the superior parietal (β= 0.175, p = 0.065) region (Fig. 1, Table 2). Similar observations from analyses in participants that underwent 18F-SMBT-1 imaging within 12 months of blood collection (N = 59) are presented in Supplementary Table 2.
Association of plasma GFAP with 18F-SMBT-1 PET
Linear regressions were used to perform analyses in all study participants (N = 71). Age, sex, APOE ɛ4 carrier status, soluble Aβ (plasma Aβ1 - 42/Aβ1 - 40 ratio), and insoluble Aβ (Aβ PET) were also added to the model as covariates. Natural log plasma GFAP values were used in the model to satisfy Shapiro-Wilk test of normality of the model residuals. ‘β’ represents the standardized coefficients and ‘p’ represents significance, with p < 0.05 considered significant (in bold). GFAP, glial fibrillary acidic protein; PET, positron emission tomography; 18F-SMBT-1, (S)-(2-methylpyrid-5-yl)-6-[(3-18F-fluoro-2-hydroxy)propoxy] quinoline.
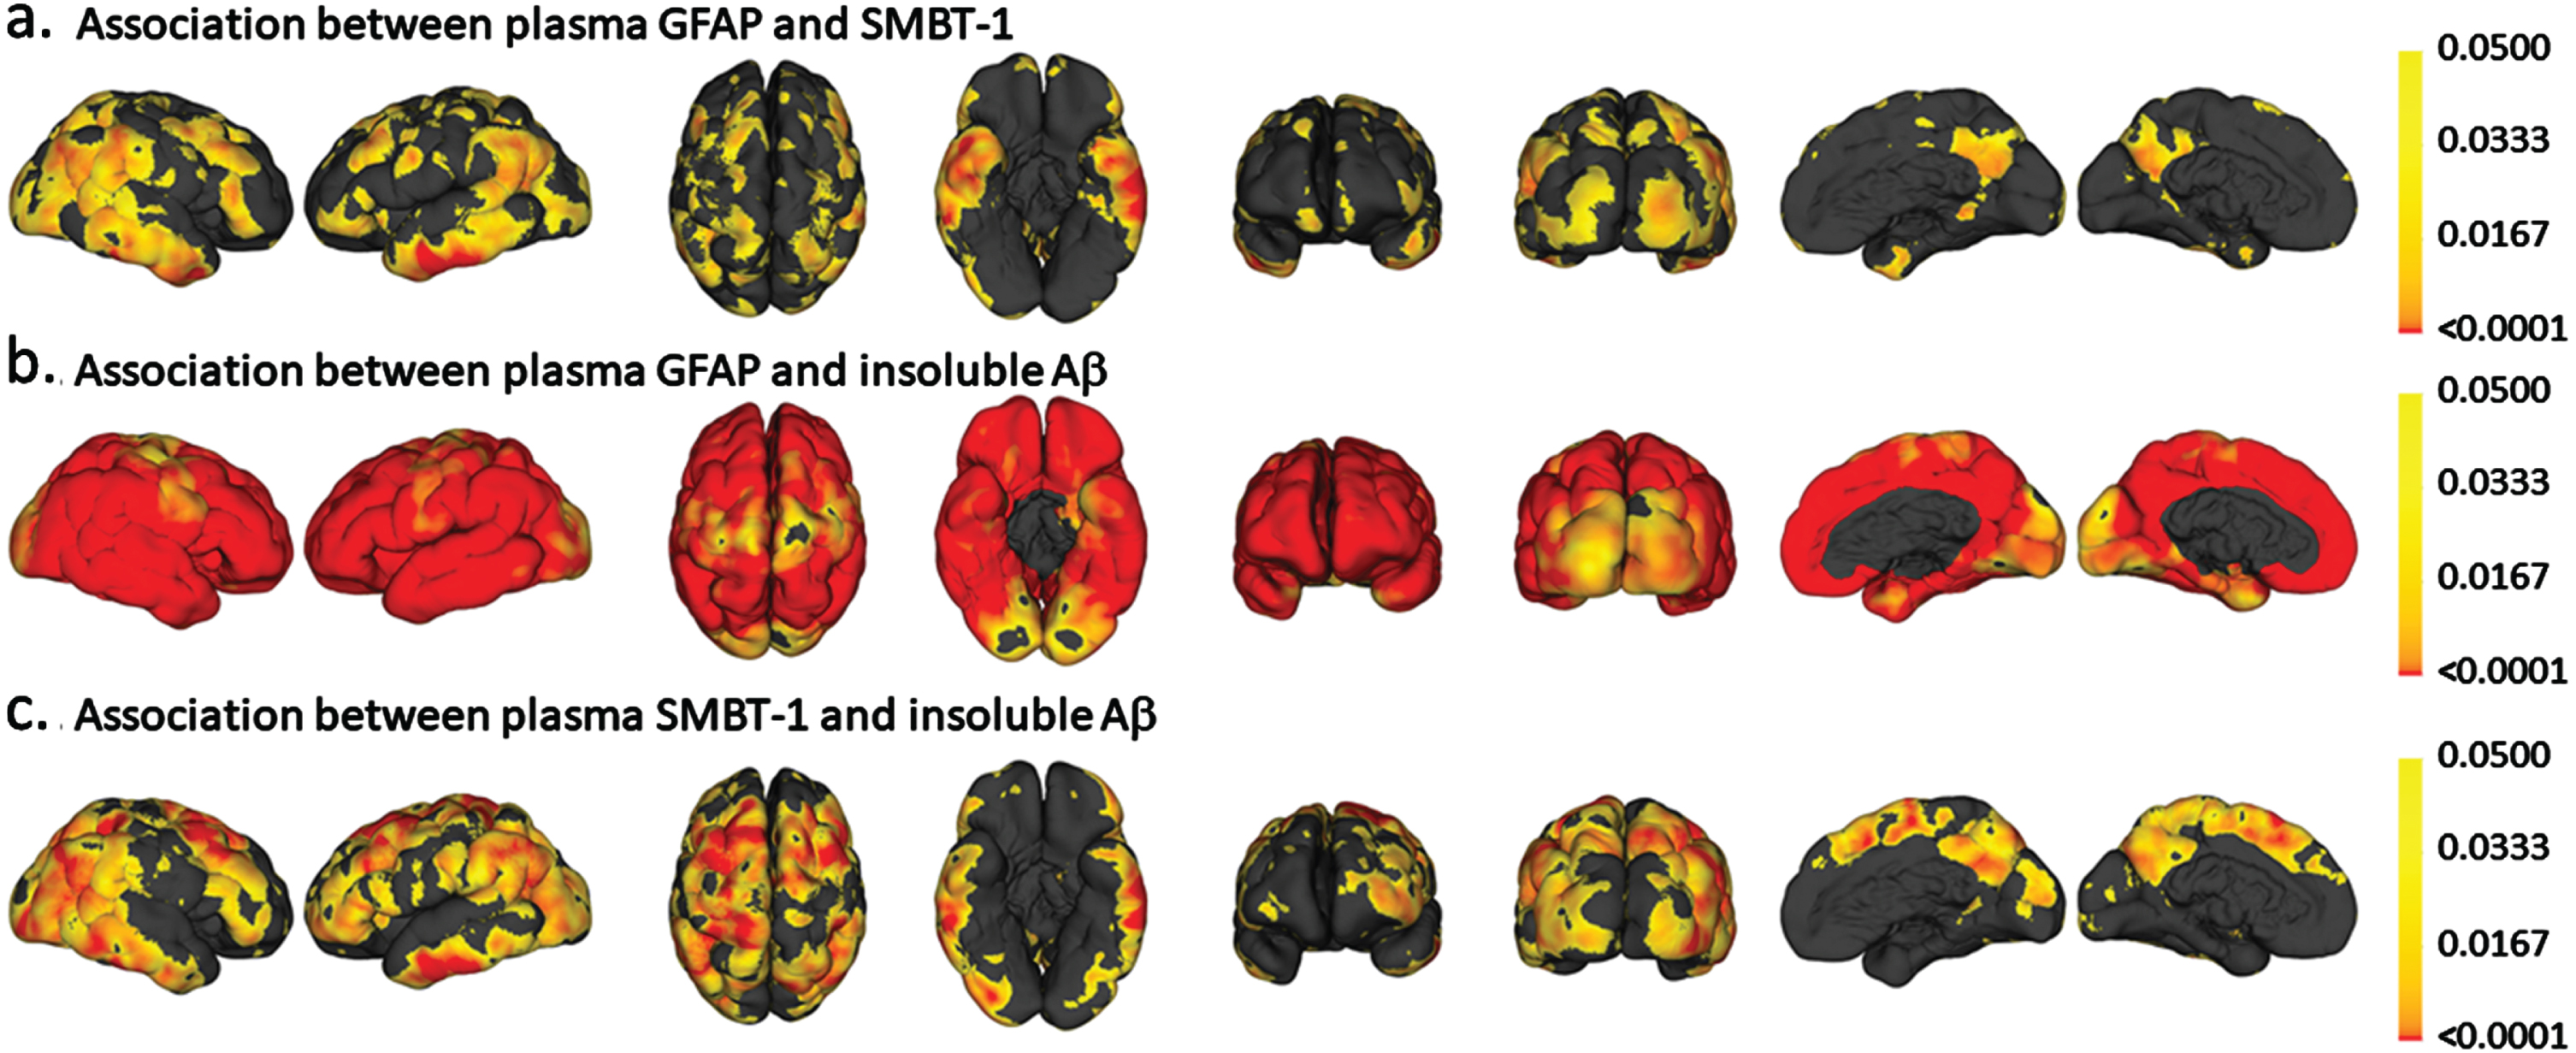
Vertex-wise analyses for the association between (a.) plasma GFAP and 18F-SMBT-1 PET SUVR, (b.) plasma GFAP and insoluble Aβ (Aβ PET) and (c.) 18F-SMBT-1 PET SUVR and insoluble Aβ (Aβ PET). The color scale represents p values.
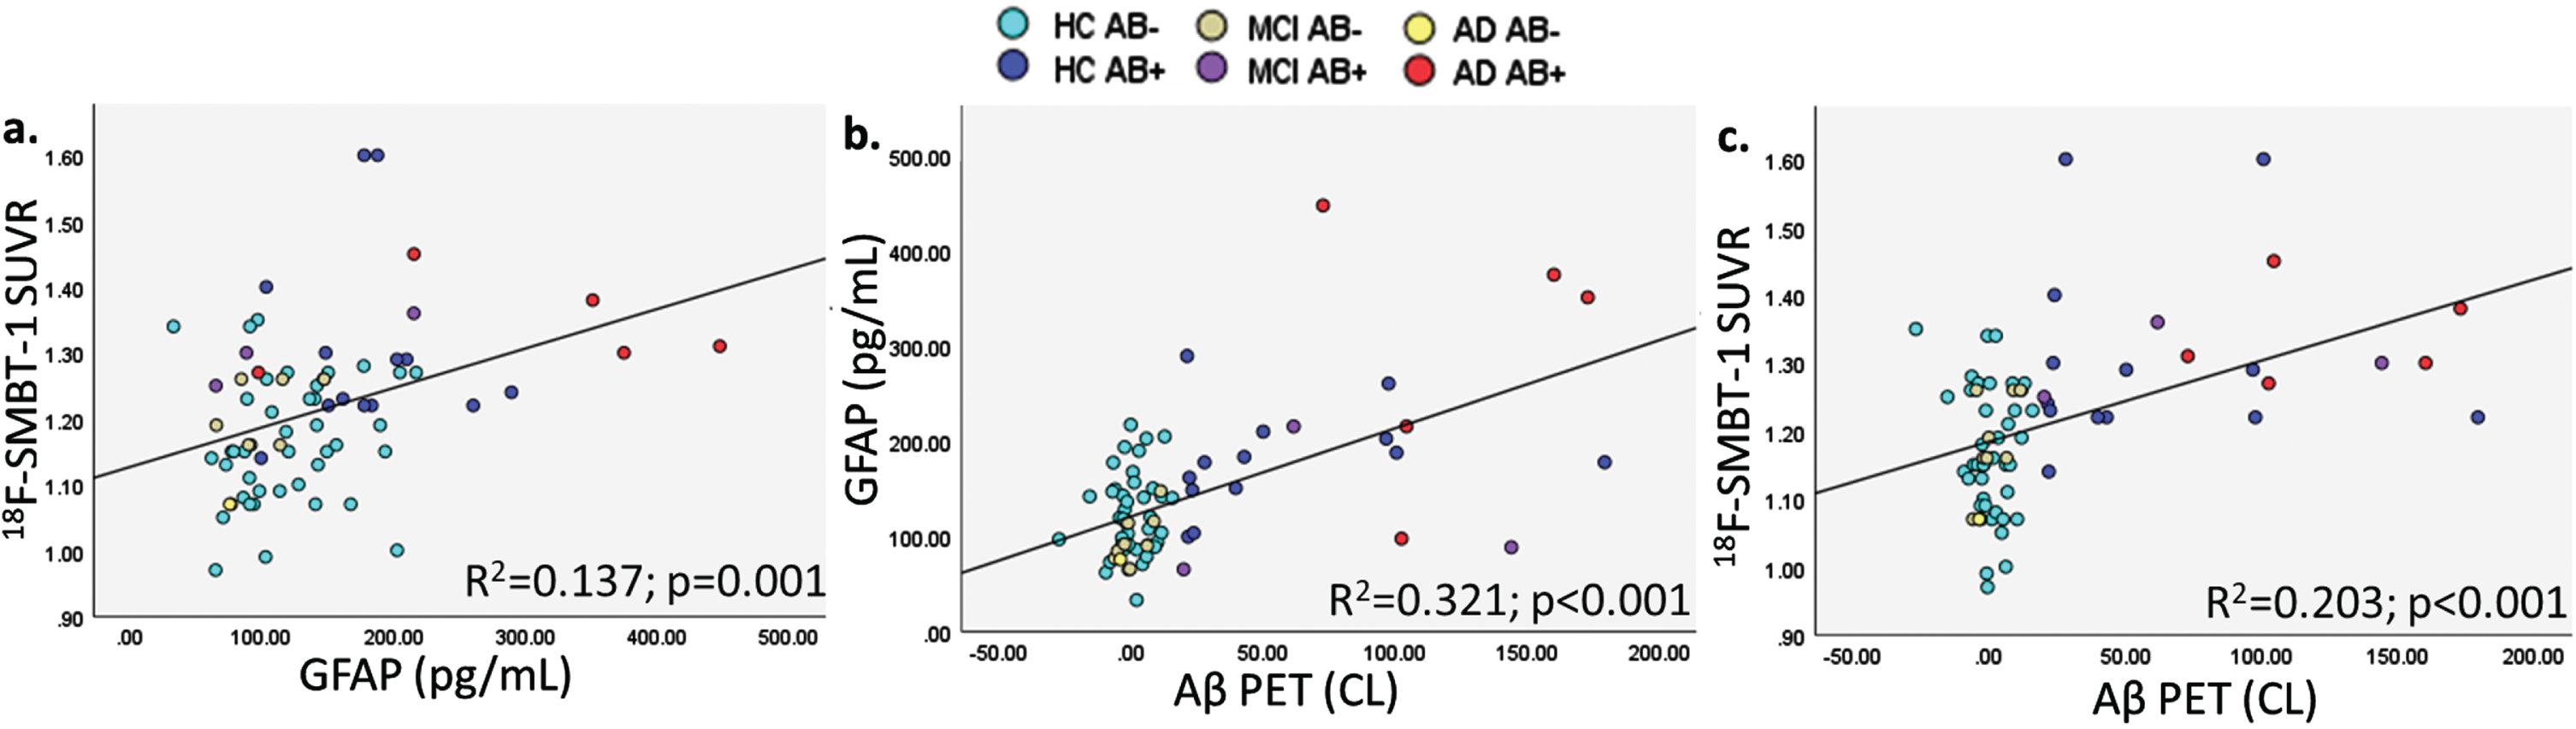
Graphical representation of correlations between (a.) plasma GFAP and 18F-SMBT-1 PET SUVR, (b.) Aβ PET and plasma GFAP, and (c.) Aβ PET and 18F-SMBT-1 PET SUVR.
No significant association was observed between plasma GFAP and SMBT-1 PET in participants within the AD continuum (N = 21, Supplementary Table 3A). In cognitively impaired participants (N = 17), a significant (or trend towards significant) association was found (Supplementary Table 3B). When limiting the analysis to the healthy control group, no significant association was observed between plasma GFAP and 18F-SMBT-1 PET before and after adjusting for soluble Aβ, insoluble Aβ, age, sex, and APOE ɛ4 carrier status.
Further, as expected, insoluble Aβ PET was significantly associated with plasma GFAP, soluble Aβ and 18F-SMBT-1 PET signal, after adjusting for confounding variables (Table 3 and Supplementary Table 4).
Association between insoluble Aβ (measured via PET) with plasma GFAP
Linear regressions were used to perform the analyses in study participants (N = 62) after removing outliers and utilizing natural log plasma GFAP values in the model to satisfy Shapiro-Wilk test of normality of model residuals. 18F-SMBT-1 PET signal, soluble Aβ (plasma Aβ1 - 42/Aβ1 - 40), age, sex and APOE ɛ4 carrier status were added to the model as covariates. Participants with standardized model residuals larger than an absolute value of±2 were considered as outliers. Removal of these outliers enabled normal distribution of model residuals. ‘β’ represents the standardized coefficients and ‘p’ represents significance, with p < 0.05 considered significant (in bold). GFAP, glial fibrillary acidic protein; PET, positron emission tomography; 18F-SMBT-1, (S)-(2-methylpyrid-5-yl)-6-[(3-18F-fluoro-2-hydroxy)propoxy] quinoline.
Additionally, age and Aβ PET CL adjusted plasma GFAP (ρ= –0.301, p = 0.011), and regional 18F-SMBT-1 SUVR (SG: ρ= –0.284, p = 0.017; PC: ρ= –0.301, p = 0.011; LT: ρ= –0.299, p = 0.011; LO: ρ= –0.293, p = 0.013; and SP: ρ= –0.274, p = 0.021) were inversely associated with MMSE.
DISCUSSION
We showed that plasma GFAP was associated with 18F-SMBT-1 PET retention in brain regions that have early Aβ accumulation in the disease trajectory [21], and this relationship appeared to be dependent on levels of insoluble Aβ measured by PET. In line with this observation, significant differences have been reported in both plasma GFAP [7, 14] and 18F-SMBT-1 regional binding [20] between Aβ–and Aβ+ participants. 18F-SMBT-1 regional binding is significantly higher in the parietal, temporooccipital, gyrus angularis, posterior cingulate, and supramarginal gyrus regions in AD, and the same regions in addition to orbitofrontal and lateral temporal, also have significantly higher 18F-SMBT-1 binding in HC Aβ+ when compared to HC Aβ–. Further, in line with previous studies [6–8, 14], our observations corroborate significant associations between insoluble Aβ, plasma GFAP, and 18F-SMBT-1 PET. We also showed that cognitive performance inversely associated with both plasma GFAP and 18F-SMBT-1 SUVR, independent of age and insoluble Aβ, with similar strength (ρ= –0.301 to –0.274).
It has been postulated that the early activation of astrocytes is in response to soluble Aβ oligomers [25, 26] or aggregated Aβ [23, 24]. We found no correlation between 18F-SMBT-1 and plasma levels of soluble Aβ (data not shown); however, this could be attributed to the utilization of plasma monomeric Aβ levels in the current study rather than Aβ oligomer levels. In contrast to the increase in Aβ oligomer levels in plasma of AD patients [44, 45], monomeric Aβ levels decrease in blood plasma [1, 47]. Further, while plasma Aβ likely reflects the soluble biochemical pool of Aβ oligomers in the brain [48], less than 50% of plasma Aβ is derived from Aβ in the brain [49], and this might explain the lack of association with 18F-SMBT-1. In addition, while MAO-B is overexpressed in GFAP+ astrocytes, especially those surrounding the insoluble Aβ deposits in plaques and cerebral vasculature, not all GFAP+ astrocytes overexpress MAO-B. GFAP expressing astrocytes that overexpress MAO-B around insoluble Aβ plaques are only a fraction of all GFAP expressing astrocytes, and that might contribute to the observed correlations between plasma GFAP and both insoluble Aβ (p < 0.001, adjusting for age, sex, and APOE ɛ4 status) and soluble Aβ (p < 0.05, adjusting for age, sex, and APOE ɛ4 status), while 18F-SMBT-1, assessing MAO-B, was only significantly associated with insoluble Aβ (p < 0.005, adjusting for age, sex, and APOE ɛ4 status) but not with soluble Aβ (p > 0.05, adjusting for age, sex, and APOE ɛ4 status).
18F-SMBT-1 is a selective MAO-B tracer with low non-specific binding [19]. In line with the observations in the current study, MAO-B overexpression in reactive astrocytes is significantly associated with GFAP immunoreactivity in AD brain tissue [50, 51]. MAO-B is also upregulated in reactive astrocytes in epilepsy, Parkinson’s disease (PD), amyotrophic lateral sclerosis (ALS), and progressive supranuclear palsy (PSP) brain tissue [52–55]. While studies on circulating GFAP levels in other neurological disorders are limited, the current literature indicates significantly higher blood GFAP in epilepsy and PD, but not in ALS and PSP, compared to healthy controls [56–59]. Further, studies report significantly higher GFAP in AD (Aβ+) compared with frontotemporal dementia, dementia with Lewy bodies and healthy controls, and Oeckl and colleagues have suggested that a different type of astrocyte reactivity may be occurring in AD compared to other neurodegenerative diseases [60, 61]. Further studies are required to investigate this aspect in more detail. Whether increased 18F-SMBT-1 PET signal, reflecting overexpression of MAO-B in reactive astrocytes, can distinguish or be affected by these differences, warrants further investigation.
While MAO-B is mainly overexpressed in the outer membrane of mitochondria in reactive astrocytes [55], it is also expressed in serotoninergic neurons [62, 63]. Therefore, it could be posited that the low to moderate strength associations observed between plasma GFAP and 18F-SMBT-1 PET signal (β with age, sex, and APOE ɛ4 status adjusted: 0.23 –0.33) could be partly attributed to cell selectivity. Alternative sensitive and specific neuroimaging and biofluid targets for detecting astrocyte reactivity, particularly those that are also able to distinguish between protective and toxic astrocytic states will aid in understanding the underlying pathophysiology and may provide important information for clinical trials. Additionally, evidence of overexpressed MAO-B as assessed by PET reflecting reactive astrocytes has been reported in asymptomatic autosomal dominant AD and in prodromal sporadic AD, however a lower PET signal has been reported reaching the dementia phenotype [17, 64]. Additionally, MAO-B PET signal has also been reported to be significantly higher at 6 months than at 8–15 months or 18–24 months in APPswe mice [65]. In contrast, plasma GFAP has been observed to increase along the AD continuum [12, 13]. Together, these observations suggest that the low to moderate strength associations observed between plasma GFAP and 18F-SMBT-1 PET signal within the current study could also be attributed to the study participant status within the AD continuum.
This study has limitations. The modest sample size of the study might preclude a better evaluation of plasma GFAP relationship with 18F-SMBT-1 PET across the AD continuum (HC Aβ+, MCI Aβ+, and AD Aβ+). Analyses within the subset of participants in the AD continuum within the current study had no significant association between plasma GFAP and SMBT-1 PET (Supplementary Table 3A), but within the cognitively impaired individual subset (MCI and AD participants), a significant or trend towards significant association was found between plasma GFAP and SMBT-1 PET (Supplementary Table 3B), which could be attributed to the latter subset comprising both Aβ+ and Aβ–individuals. This suggests that the association between plasma GFAP and SMBT-1 is dependent on brain Aβ load or Aβ status. However, the small sample size being a limitation of the study is acknowledged and further confirmatory studies are required. In addition, the assessments were cross-sectional in nature, and it will be necessary to compare and contrast these findings with longitudinal trajectories to determine changes over time and/or disease progression. Further, fifty-nine participants of the 71 participants in this study, underwent 18F-SMBT-1 imaging within 12 months of blood collection, while 12 participants had 18F-SMBT-1 imaging over 12 months from blood collection (analyses for this subset has been provided in Supplementary Tables 2 and 4). Further, participants from the study cohort were volunteers and not randomly selected from the community, and due to the strict inclusion/exclusion criteria the results may not be applicable to the general population. Additionally, this study did not include other neurodegenerative conditions, although it is acknowledged that neuroinflammation is not disease-specific and astrocyte activity markers are associated with various conditions including traumatic brain injury, major depressive disorder, and several neurodegenerative diseases [66–70]. Further studies also need to investigate whether there is an association between CSF GFAP and 18F-SMBT-1 PET, and if it is also dependent on Aβ load. Unlike plasma GFAP, CSF GFAP is not elevated in cognitively unimpaired Aβ+ individuals when compared to cognitively unimpaired Aβ–individuals [13]. Such investigations will also tell us whether 18F-SMBT-1 is more specific to AD, given that MAO-B is overexpressed in GFAP+ astrocytes surrounding the insoluble Aβ plaques.
To conclude, an association between the astrocyte markers, plasma GFAP and regional 18F-SMBT-1 PET, was observed. However, this relationship appears to be dependent on brain Aβ load. Follow-up studies assessing how this relationship evolves over time are ongoing.
FUNDING
Financial support was received from the Cooperative Research Centre (CRC) for Mental Health, an Australian Government Initiative. Pfizer International has provided financial support to assist with analysis of blood samples and to further the AIBL research program. The Lions Alzheimer’s Foundation and Lions Club International provided donations that allowed the purchase of the Simoa-HD-X instrument used in this study. PC is funded by Macquarie University and RNM is jointly funded by Macquarie University and Edith Cowan University.
CONFLICT OF INTEREST
SRS has received grant support from the National Health and Medical Research Council, Alzheimer’s Association (USA) Research Grant, Alzheimer’s Drug Discovery Foundation and the BrightFocus Foundation and honorarium for lectures from the Mature Adults Learning Association Inc. SCB is a current employee and minor stockholder of Eli Lilly and Company. KT and RNM are Directors of SMarT Minds Western Australia. CCR has received research grants from NHMRC, Enigma Australia, Biogen, Eisai and Abbvie. He is on the scientific advisory board for Cerveau Technologies and consulted for Prothena, Eisai, Roche and Biogen Australia. VLV has received research grants from NHMRC (GNT2001320), the Aging Mind Foundation (DAF2255207) and NIH 2P01AG025204-16) and is and has been a consultant or paid speaker at sponsored conference sessions for Eli Lilly, Life Molecular Imaging, ACE Barcelona, and IXICO. Colin L. Masters and Ralph N. Martins are Editorial Board Members of this journal but were not involved in the peer-review process nor had access to any information regarding its peer-review. The other authors did not report any conflict of interest.
DATA AVAILABILITY
The data supporting the findings of this study are available on request. The data are not publicly available due to privacy and ethical restrictions.
Footnotes
ACKNOWLEDGMENTS
We thank all the participants and their families who took part in this study as well as the clinicians who referred participants. The AIBL study (![]() ) is a collaboration between CSIRO, Edith Cowan University (ECU), National Ageing Research Institute (NARI), The Florey Institute of Neuroscience and Mental Health (FINMH) and Austin Health. The study also received support from Hollywood Private Hospital, Sir Charles Gairdner Hospital, CSIRO, the Science and Industry Endowment Fund, and the Australian Alzheimer’s Research Foundation. The authors acknowledge the financial support of the Cooperative Research Centre (CRC) for Mental Health, an Australian Government Initiative. Pfizer International has provided financial support to assist with analysis of blood samples and to further the AIBL research program. We are grateful to the Lions Alzheimer’s Foundation and Lions Club International for their generous donations that allowed the purchase of the Simoa-HD-X instrument used in this study.
) is a collaboration between CSIRO, Edith Cowan University (ECU), National Ageing Research Institute (NARI), The Florey Institute of Neuroscience and Mental Health (FINMH) and Austin Health. The study also received support from Hollywood Private Hospital, Sir Charles Gairdner Hospital, CSIRO, the Science and Industry Endowment Fund, and the Australian Alzheimer’s Research Foundation. The authors acknowledge the financial support of the Cooperative Research Centre (CRC) for Mental Health, an Australian Government Initiative. Pfizer International has provided financial support to assist with analysis of blood samples and to further the AIBL research program. We are grateful to the Lions Alzheimer’s Foundation and Lions Club International for their generous donations that allowed the purchase of the Simoa-HD-X instrument used in this study.