
Abstract
Background:
The differential diagnosis of frontotemporal dementia (FTD) is still a challenging task due to its symptomatic overlap with other neurological diseases and the lack of biofluid-based biomarkers.
Objective:
To investigate the diagnostic potential of a combination of novel biomarkers in cerebrospinal fluid (CSF) and blood.
Methods:
We included 135 patients from the Center for Memory Disturbances, University of Perugia, with the diagnoses FTD (n = 37), mild cognitive impairment due to Alzheimer’s disease (MCI-AD, n = 47), Lewy body dementia (PDD/DLB, n = 22), and cognitively unimpaired patients as controls (OND, n = 29). Biomarker levels of neuronal pentraxin-2 (NPTX2), neuronal pentraxin receptor, neurofilament light (NfL) and glial fibrillary acidic protein (GFAP) were measured in CSF, as well as NfL and GFAP in serum. We assessed biomarker differences by analysis of covariance and generalized linear models (GLM). We performed receiver operating characteristics analyses and Spearman correlation to determine biomarker associations.
Results:
CSF NPTX2 and serum GFAP levels varied most between diagnostic groups. The combination of CSF NPTX2, serum NfL and serum GFAP differentiated FTD from the other groups with good accuracy (FTD versus MCI-AD: area under the curve (AUC) [95% CI] = 0.89 [0.81–0.96]; FTD versus PDD/DLB: AUC = 0.82 [0.71–0.93]; FTD versus OND: AUC = 0.80 [0.70–0.91]). CSF NPTX2 and serum GFAP correlated positively only in PDD/DLB (ρ= 0.56, p < 0.05). NPTX2 and serum NfL did not correlate in any of the diagnostic groups. Serum GFAP and serum NfL correlated positively in all groups (ρ= 0.47–0.74, p < 0.05).
Conclusion:
We show the combined potential of CSF NPTX2, serum NfL, and serum GFAP to differentiate FTD from other neurodegenerative disorders.
Keywords
INTRODUCTION
Frontotemporal dementia (FTD) describes a heterogeneous group of diseases with involvement of the frontal and temporal lobes of the brain, leading to dysfunction in executive functioning, behavior, and language [1–3]. It is the second most common form of early-onset dementia and presents a steadily progressive disease course [1, 4–6]. Due to its clinical and pathological heterogeneity and symptomatic overlap with other neurodegenerative diseases, such as Alzheimer’s disease (AD), and other non-neurodegenerative psychiatric disorders, the differential diagnosis of FTD remains challenging [2, 7–9]. To date, no FTD-specific diagnostic tests or disease-modifying treatments are available and misdiagnosis often leads to an unsuitable care approach or wrong medication that can worsen the symptoms [10].
Hence, the need for an accurate way to diagnose FTD in an early stage is high, which could be achieved by the implementation of novel biofluid biomarkers, reflecting the underlying pathological changes in FTD. Cerebrospinal fluid (CSF) biomarkers are already implemented to support the diagnosis of AD [11, 12], and there has been great progress concerning their measurement in blood [13]. At present, the classical AD CSF biomarkers, namely amyloid-β 1–42 (Aβ42), tau phosphorylated at threonine 181 (p-tau), total tau (t-tau), and related ratios, are being used to exclude AD as a differential diagnosis of FTD [14]. Due to the heterogeneity of the underlying FTD pathologies, a panel of several biomarkers for different pathologies might be advantageous for the differentiation of FTD from other neurological diseases. Multiple proteomics studies identified potential FTD-specific biomarker candidates [15, 16], of which some have been further studied in CSF and blood [17–19]. Some of the promising biomarker candidates identified for FTD are neurofilament light (NfL) [20, 21], glial fibrillary acidic protein (GFAP) [16, 21], and neuronal pentraxins [22].
NfL has been largely investigated as a biomarker for axonal damage in several neurodegenerative and inflammatory diseases. In FTD patients it has been shown to be increased in CSF and serum, compared to cognitively healthy controls [23–26], and in CSF, compared to AD patients [24, 27]. In previous studies, NfL showed good discriminatory power, in CSF and serum, for the differentiation of FTD from controls (area under the curve (AUC) up to 0.88) [25, 28]. Blood NfL has already been implemented in the novel guidelines for differentiating FTD from non-degenerative primary psychiatric disorders [9, 25]. The highly brain-specific protein GFAP has been studied as a potential marker for astrocytic activation and gliosis, upon which its production is being upregulated [29, 30]. Already at early stages of FTD, apoptosis and dystrophy of astrocytes have been found in the brain [31] and high levels of GFAP have been detected in CSF and blood [32, 33]. Serum GFAP showed high discriminative power for the differentiation of FTD from AD and dementias with Lewy bodies, as well as for the differentiation of AD from controls [33]. A new group of potential biomarkers for neurodegenerative diseases are neuronal pentraxins [34–36]. Neuronal pentraxins have been found to be involved in synapse formation and plasticity [37, 38], and have been proposed to have a protective function against neurodegeneration [34, 40]. Several proteomics studies have identified neuronal pentraxins to be deregulated in the CSF of patients with neurodegenerative diseases [22, 42]. In FTD, neuronal pentraxin-2 (NPTX2) and neuronal pentraxin receptor (NPTXR) have been found to be decreased in symptomatic genetic mutation carriers compared to non-carriers and pre-symptomatic carriers [43, 44]. NPTX2 previously showed moderate discriminatory power for the differentiation of AD from controls [45]. However, a combination of these markers for the differential diagnosis of FTD has not yet been explored.
In the present study, we aimed to investigate the potential role of NfL, GFAP, NPTX2, and NPTXR in CSF and/or serum, as biomarkers for the differentiation of FTD from other dementias. We compared biomarker levels across the diagnostic groups and tested which biomarkers could best differentiate FTD from controls, patients with mild cognitive impairment due to AD and patients with Lewy body dementias.
MATERIALS AND METHODS
Study population
We retrospectively included 37 patients with FTD, 47 patients with AD at the pre-dementia stage, namely patients with mild cognitive impairment due to AD (MCI-AD), 22 patients with Parkinson’s disease dementia (PDD), or dementia with Lewy bodies (DLB) that visited the Center for Memory Disturbances, University of Perugia, between 2007 and 2018, with available CSF samples collected during the diagnostic work-up. The FTD group was composed of different FTD variants: behavioral variant (n = 19), language variant (n = 7), semantic variant (n = 5), progressive nonfluent aphasia (n = 4), and FTD with motor neuron disease (n = 2). Due to their biological similarities in alpha-synuclein aggregation and deposition in Lewy bodies, and the differentiation of PDD and DLB only based on the 1-year rule between onset of symptoms [46], PDD and DLB were analyzed in a joined group as Lewy body dementias (PDD/DLB). All selected subjects underwent a thorough standardized work-up, including medical history, physical and neurological examination. A comprehensive neuropsychological assessment with screening tests, i.e., Mini Mental State Examination (MMSE) [47], further tests for each cognitive domain, and the Clinical Dementia Rating Scale (CDR) was carried out [48]. A CDR score of 0.5 were chosen as inclusion criterion for MCI-AD, while a CDR of 1 was chosen for PDD, DLB, and FTD. Structural brain imaging by either brain magnetic resonance imaging or computed tomographic imaging were performed to exclude other causes of cognitive impairment. Final diagnoses were based on internationally established criteria [12, 49–52]. As controls we included 29 cognitively unimpaired patients that were referred to the Section of Neurology, University of Perugia for other minor neurological diseases. Individuals were categorized as other neurological disease (OND) when no cognitive impairment could be determined (diagnoses: n = 24 subjective cognitive decline, n = 2 psychiatric disorder, n = 1 peripheral polyneuropathy, n = 1 epilepsy, n = 1 transient global amnesia), and AD CSF biomarker levels were in the normal range (considering values deviating within 10% of the cut-off value used). Conversely, the diagnosis of AD was made in the presence of both pathological CSF levels of Aβ42 (or Aβ42/Aβ40 ratios) and p-tau. For subjects with a suspected diagnosis of FTD, FDG-PET was performed to support the final diagnosis and discriminate subjects with FTD from those with FTD-mimics. The study was approved by the local medical ethical committee and each subject provided written informed consent to use medical data and biomaterials for scientific research.
CSF and serum sample preparation
Sample collection was performed according to international guidelines [53]. Lumbar puncture was performed between 8 am and 10 am, after an overnight fasting period. CSF (∼12 mL) was collected into sterile polypropylene tubes (Sarstedt® tubes, reference: 62.610.210), aliquots of 0.5 mL were prepared and stored at –80°C upon further analyses in polypropylene tubes (Sarstedt® tubes, code: 72.730.007), avoiding freeze-thaw cycles. Blood contaminated samples (>50 platelets per microliter) were excluded from following analyses. Whole blood was drawn by peripheral venipuncture into clot activator tubes and gently mixed to prevent gradient effects. Samples were left at room temperature for 30 min to allow blood clotting, and subsequently centrifuged for 10 min at 2000× g, at room temperature. Serum was divided into aliquots (0.5 mL) in polypropylene tubes (Sarstedt® tubes, code: 72.730.007) and stored at –80°C upon further analysis.
Biomarker analyses
Biomarker measurements in CSF and serum were performed as described below. The operating staff was blinded to clinical diagnoses.
AD CSF biomarkers
AD CSF biomarkers were evaluated at the time of lumbar puncture for each subject included in the study to assess/exclude the presence of AD. For CSF samples collected before 2016, INNOTEST manual enzyme-linked immunosorbent assays (ELISAs) (Fujirebio Europe, Gent, Belgium) were used to determine CSF levels of Aβ42, p-tau, and t-tau. Between 2016 and 2018, Aβ40 and Aβ42 levels were measured by using the EUROIMMUN ELISA kit (EUROIMMUN AG, Lübeck, Germany). For the CSF samples collected since 2018, the assays were performed using Lumipulse G600-II (Lumipulse) β-Amyloid 1–40, Lumipulse β-Amyloid 1–42, Lumipulse Total Tau, and Lumipulse p-Tau 181 assays (Fujirebio Europe, Gent, Belgium). Different production lot numbers were used to generate data from both EUROIMMUN and INNOTEST manual ELISAs and for all Lumipulse assays. Standard quality controls and internal quality controls were assayed in each run. The amyloid/tau/(neurodegeneration) (A/T/(N)) profile was defined for each patient [12]. A/T/(N)-related biomarkers’ values were classified as pathological (+) or not pathological (–) by using different cut-off values depending on the date of measurement, the assay used for the analysis and on internal reference cohorts (Supplementary Table 1).
ELISA NPTX2
CSF NPTX2 concentrations were measured using a newly developed ELISA from ADx Neurosciences (ADx Neurosciences NV, Belgium) that was validated according to international consensus criteria [54] at the Neurochemistry Laboratory of the Amsterdam University Medical Center in the Netherlands (validation results are reported in the Supplementary Material). In short, 96-well plates were pre-coated with capture antibody (mAb33F9) and incubated with 75μL of biotinylated detection antibody (mAb22H10bio) and 25μL of calibrator or undiluted sample for three hours at room temperature. Five washing steps were followed by a 30-min incubation with 100μL of 50 ng/mL streptavidin-horseradish peroxidase complex (SV-poly-PO). After a next wash, 100μL of 3,3′,5,5′-Tetramethylbenzidine substrate were added and incubated for 30 min at room temperature. Subsequently, 100μL of 1 M H2SO4 were added to stop the colorimetric reaction and the absorbance was read with a multi-detection microplate reader (Synergy™ HT, Bio-Tek®, USA) at a reference wavelength of 450–630 nm. A five-parameter logistic (5PL) curve model was fit to the measured calibrator absorbances and used as a calibration curve to determine sample concentrations. The assay had a lower limit of quantification of 15.2 pg/mL. The mean percent coefficient of variation (CV%) of duplicate sample concentrations was 3.6% (range: 0.0% –17.8%), and the inter-assay CV% of three independent CSF quality controls (QCs) measured over four plates were: QC low = 6.9%, QC medium = 4.6%, QC high = 7.8%.
ELISA NPTXR
NPTXR was measured in CSF with a commercially available ELISA kit from RayBiotech (RayBio® Human NPTXR ELSIA Kit; RayBiotech, USA), which was validated at the Neurochemistry Laboratory of the Amsterdam University Medical Center for the use in CSF (validation results are reported in the Supplementary Material). The mean CV% of duplicate sample concentrations was 2.4% (range: 0.0% –12.4%), and the inter-assay CV% of three independent CSF QCs measured over four plates were: QC low = 10.9%, QC medium = 3.1%, QC high = 5.5%.
ELISA NfL
NfL was measured in CSF with a commercially available ELISA kit from Uman Diagnostics (NF-light® ELISA CE; Uman Diagnostics, Sweden). The mean CV% of duplicate sample concentrations was 1.4% (range: 0.0% –21.3%), and the inter-assay CV% of two independent CSF QCs measured over four plates were: QC low = 3.8%, QC high = 2.5%.
Simoa NfL and GFAP
NfL in serum, and GFAP in CSF and serum were measured with commercially available Simoa kits from Quanterix (SimoaTM NF-light® Kit and SimoaTM GFAP Discovery Kit; Quanterix, USA) on the SimoaTM HD-1 Analyzer (Quanterix, USA). All biomarker measurements were performed according to the manufacturer’s instructions and samples were measured in duplicate.
The mean CV% of duplicate sample concentrations was 2.8% (range: 0.0% –15.0%), and the inter-assay CV% of three independent serum QCs measured over two plates were: QC low = 3.5%, QC medium = 3.1%, QC high = 5.7% for serum NfL. For GFAP in CSF the mean CV% of duplicate sample concentrations was 2.6% (range: 0.0% –10.8%), and the inter-assay CV% of three independent CSF QCs measured over two plates were: QC low = 19.9%, QC medium = 6.4%, QC high = 8.7%, while for GFAP in serum the mean CV% of duplicate sample concentrations was 2.4% (range: 0.0% –14.1%), and the inter-assay CV% of three independent serum QCs measured over two plates were: QC low = 8.9%, QC medium = 9.6%, QC high = 7.9%.
Statistical analyses
All statistical analyses were performed using R Studio version 4.0 [55]. We tested the distribution of each biomarker for normality by using the Shapiro-Wilks test (pastecs R package [56]). Upon a non-normal distribution of values, either log-transformation or square-root transformation was performed, depending on the degree of skewness. For demographics, Pearson’s χ2-test was performed to compare categorical variables and univariate analyses of variance (ANOVA) were performed to test for differences of continuous variables across diagnostic groups. Prevalences of pathological values of classical AD CSF biomarkers in diagnostic groups were compared by means of Fisher’s Exact test for count data. The comparisons of biomarker levels between the diagnostic groups were evaluated with one-way analysis of covariance (ANCOVA, car R package [57]), adjusted for the effect of age and sex, with subsequent Tukey’s post-hoc test for pairwise comparisons (multcomp R package [58]). Associations of study biomarkers with MMSE, age, sex, and in-between study biomarkers were analyzed using Spearman’s rank-order correlation and p-values were adjusted for multiple comparisons by Bonferroni correction. To select the most promising combination of biomarkers, with the highest potential to differentiate FTD from one of the other diagnostic groups at a time, generalized linear models were applied. In these models, diagnosis (FTD versus OND, FTD versus MCI-AD, or FTD versus PDD/DLB) was used as the outcome variable. We took a step-wise approach, starting by analyzing the basic model with age and sex as predictors for the comparison of FTD versus the other diagnostic groups. Based on the ANCOVA results, the most significant study biomarkers for FTD were subsequently added to the basic model to form a combined biomarker model. Finally, receiver operating characteristics (ROC) curves were constructed (pROC R package [59]), again containing the respective diagnosis as outcome and age, sex, and respective biomarkers as predictors. The best predicting model was selected based on having the highest AUC value. All statistical tests were two-tailed, and the significance level was set to α= 0.05. All p-values are listed after adjustment for multiple testing.
RESULTS
Demographics
Cohort characteristics and study biomarker concentrations of the different diagnostic groups are shown in Table 1. No differences in age and years of education were observed across the diagnostic groups. Sex distribution varied significantly between MCI-AD and PDD/DLB, with more male patients in the PDD/DLB group. All dementia diagnostic groups had lower MMSE scores compared to OND, with PDD/DLB patients having the lowest scores (median (interquartile range (IQR)) MMSE OND 28 (27–29); FTD 26 (24–27); MCI-AD: 22 (20–26); PDD/DLB: 20 (16–21). According to neuropsychological testing, all AD patients were in a pre-dementia stage and clinically affected by mild cognitive impairment. As expected, A/T/(N) profiles significantly differed across groups. The prevalence of amyloidosis (A+), tauopathy (T+), neurodegeneration (N+), and amyloidosis with concomitant tauopathy (A+/T+) in each diagnostic category are summarized in Supplementary Figure 3. Almost all A/T/(N) positive subjects and A/T/(N) negative subjects were found in MCI-AD and OND, respectively, with discordant profiles being referred to biomarker values within 10% of the cut-off values.
Demographics, clinical characteristics, and study biomarker concentrations of the total cohort and stratified for diagnosis
Data is represented as n (%) for categorical variables, as mean±SD for normally distributed continuous variables, and as median (IQR) for non-normally distributed continuous variables. aOND: n = 28; FTD: n = 37; MCI-AD: n = 47; PDD/DLB: n = 22; bOND: n = 29; FTD: n = 35; MCI-AD: n = 47; PDD/DLB: n = 22;; If not stated differently, the full cohort was used. 1p < 0.05 or lower versus OND; 2p < 0.05 or lower versus FTD; 3p < 0.05 or lower versus MCI-AD. OND, Other neurological diseases; FTD, Frontotemporal dementia; MCI-AD, Mild cognitive impairment due to Alzheimer’s disease; PDD/DLB, Lewy body dementias, MMSE, Mini mental state examination; CSF, Cerebrospinal fluid; NPTX2, Neuronal pentraxin-2; NPTXR, Neuronal pentraxin receptor; NfL, Neurofilament light; GFAP, Glial fibrillary acidic protein; A+, Amyloidosis; T+, Tauopathy; N+, Neurodegeneration.
Correlations of study biomarkers with age and sex
No biomarker was associated with sex. NfL and GFAP showed a minor correlation with age in the whole cohort in both CSF and serum (ρ= 0.30–0.40, p < 0.01). While this correlation was significant for NfL in CSF and serum only in the OND (both: ρ= 0.54, p < 0.01) and PDD/DLB (CSF: ρ= 0.64, p < 0.01; serum: ρ= 0.54, p < 0.05) groups, for CSF GFAP it was only significant in the MCI-AD group (ρ= 0.46, p < 0.01), and for serum GFAP only in the OND group (ρ= 0.53, p < 0.01).
Biomarker candidates show differential expression across diagnostic groups
Protein concentrations of the novel biomarker candidates are summarized in Table 1 and visualized in Fig. 1. Levels of NPTX2 (Fig. 1A) were significantly lower in all diagnostic groups compared to OND (versus PDD/DLB: p < 0.001; versus FTD, MCI-AD: all p < 0.01), and significantly lower in PDD/DLB compared to FTD and MCI-AD (p < 0.05). NPTXR concentrations in CSF (Fig. 1B) were significantly lower in PDD/DLB than in OND (p < 0.001) and MCI-AD (p < 0.05). No significant difference in NPTXR levels could be detected between FTD and the other diagnostic groups, nor OND. NfL concentrations in CSF (Fig. 1C) and serum (Fig. 1D) were higher in MCI-AD (p < 0.05) and FTD (p < 0.001) compared to OND. CSF GFAP levels (Fig. 1E) were higher in MCI-AD compared to OND (p < 0.01), FTD (p < 0.01), and PDD/DLB (p < 0.05), while serum GFAP levels (Fig. 1F) were higher in MCI-AD compared to OND (p < 0.001), FTD (p < 0.001), and PDD/DLB (p < 0.01), and higher in FTD (p < 0.05), and PDD/DLB (p < 0.01) compared to in OND.
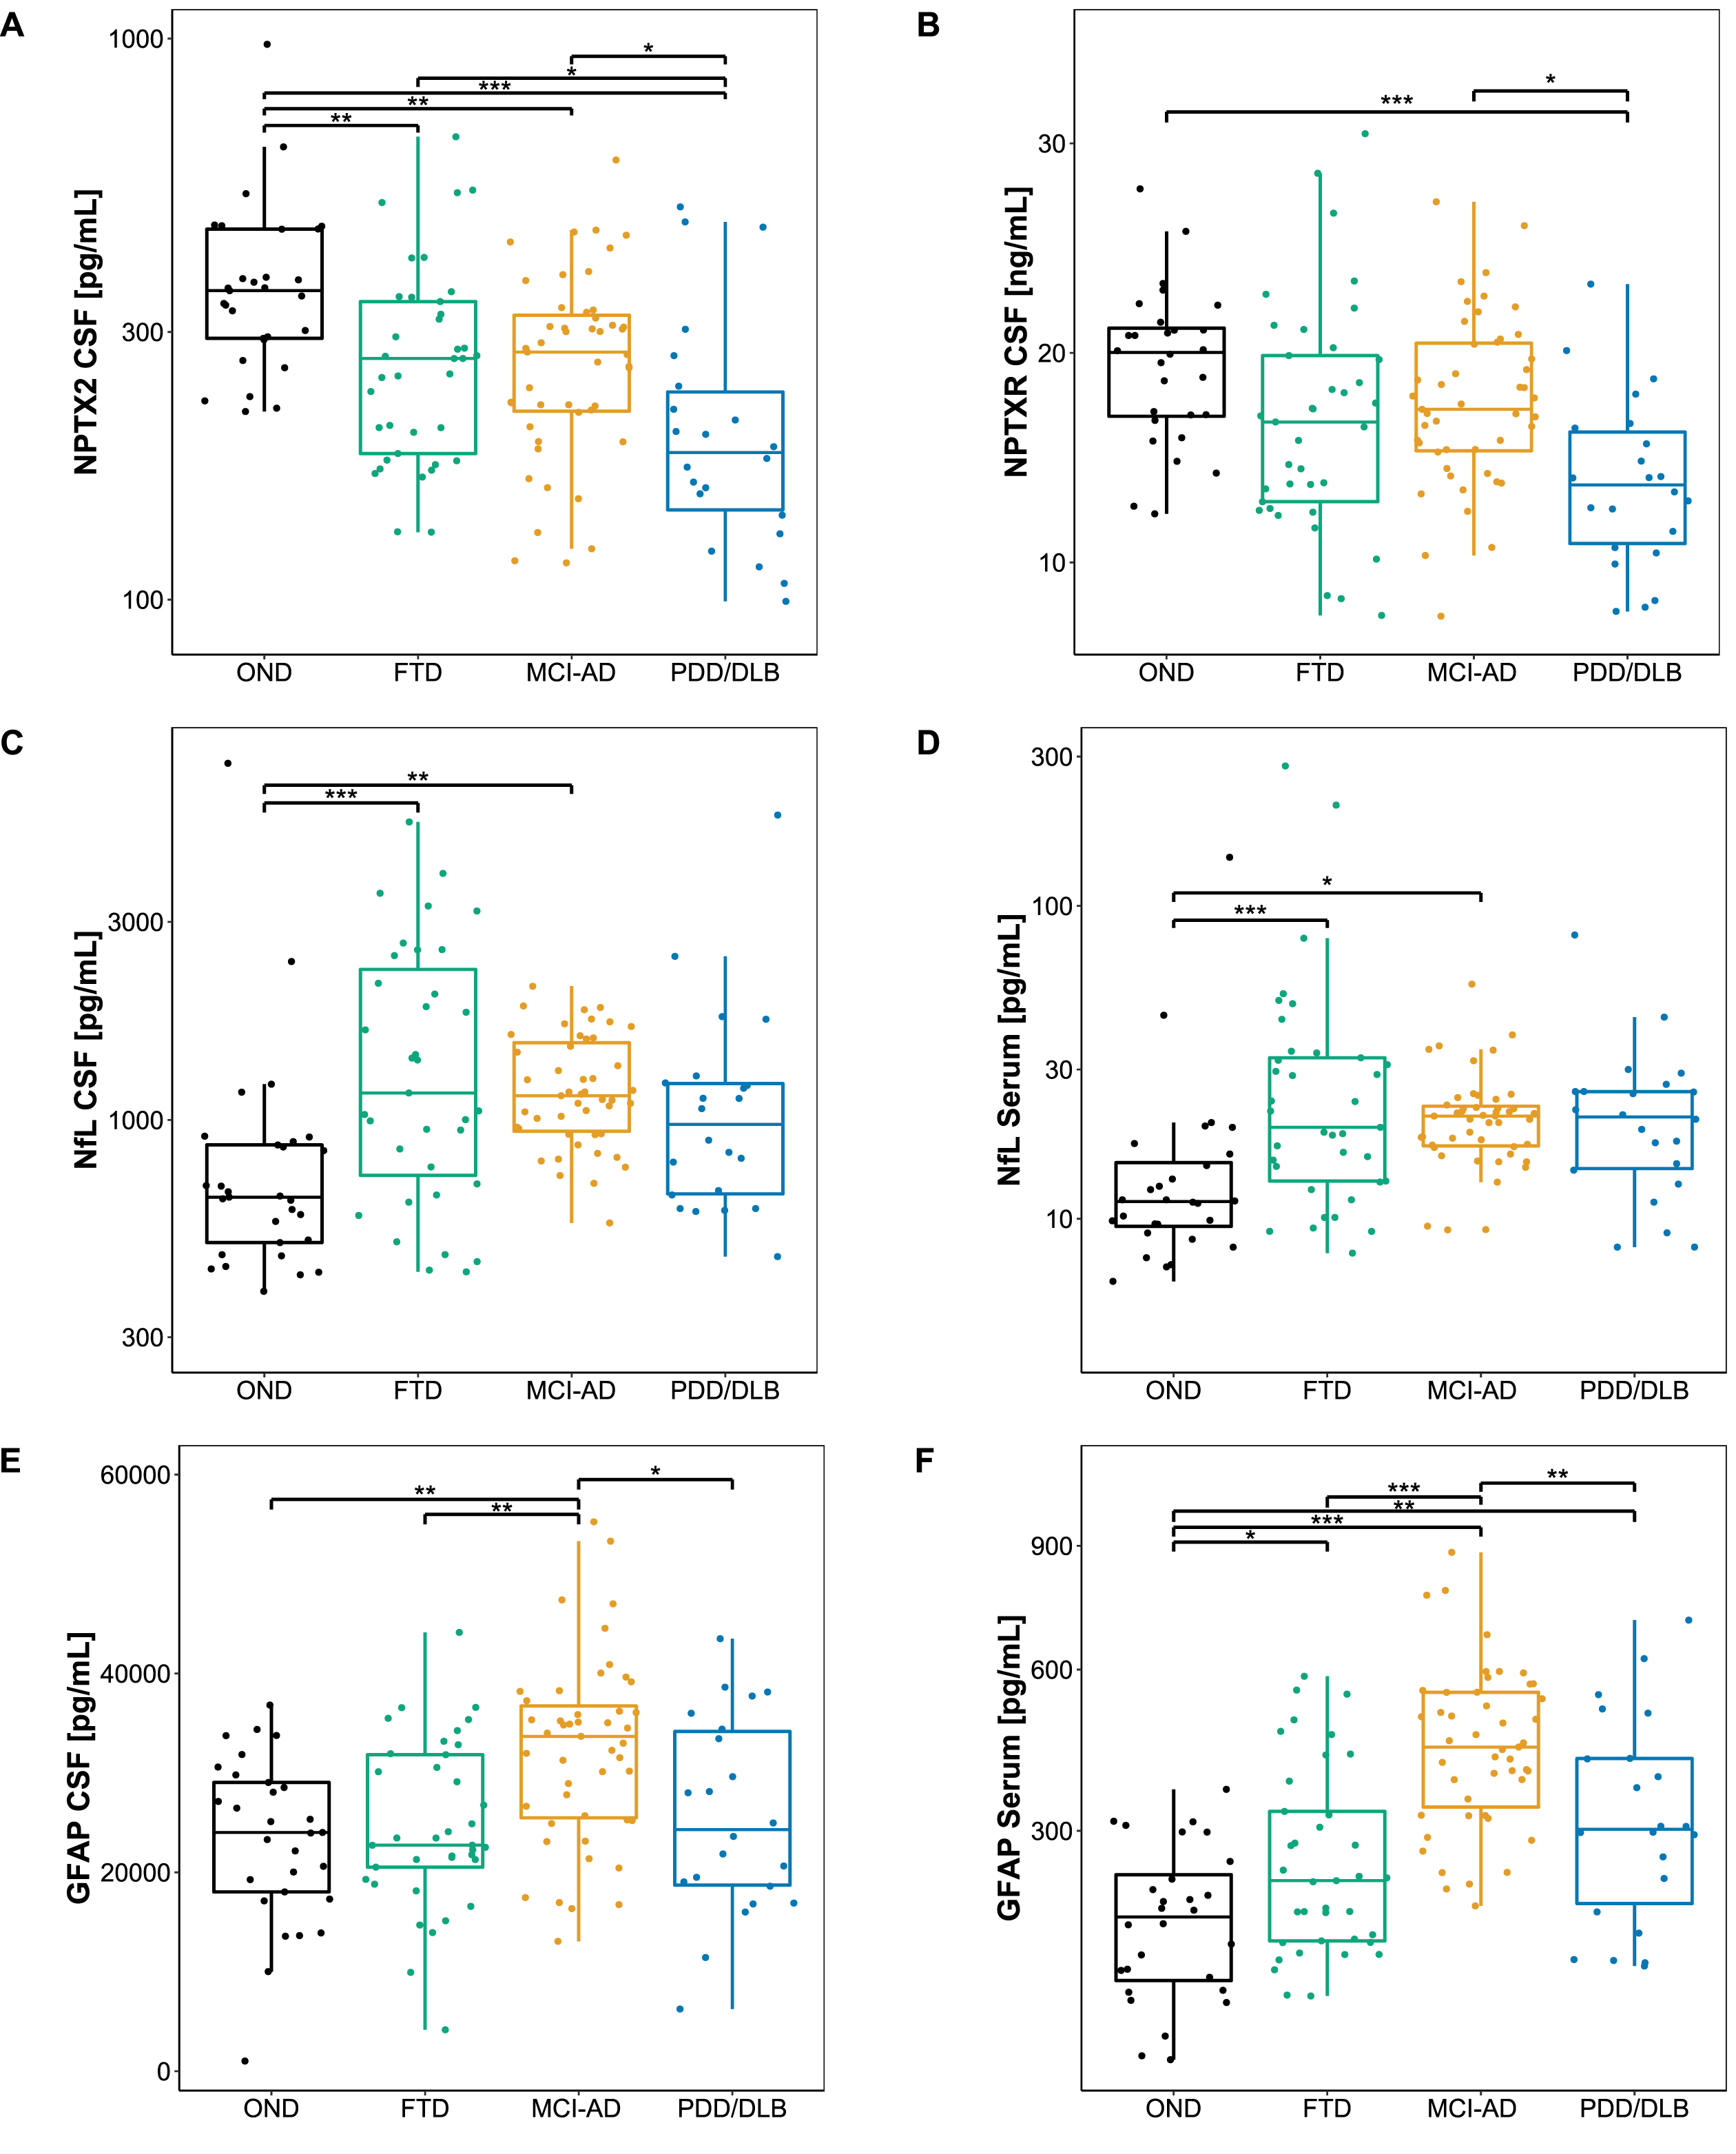
Biomarker levels across diagnostic groups. A-F) Boxplots showing the level of each candidate biomarker across different diagnostic groups. Lines through the boxes represent the median, and the upper and lower line represent the 25th and 75th percentile, respectively. NPTX2, NfL in serum, and NfL in CSF were log-transformed, and a square-root transformation was applied to GFAP in serum to achieve a normal distribution. Differences in biomarker levels were assessed with age and sex adjusted ANCOVA with Tukey’s post hoc test. *p < 0.05, **p < 0.01, ***p < 0.001. OND, Other neurological diseases; MCI-AD, Mild cognitive impairment due to Alzheimer’s disease; FTD, Frontotemporal dementia; PDD/DLB, Lewy body dementias; CSF, Cerebrospinal fluid; NPTX2, Neuronal pentraxin-2; NPTXR, Neuronal pentraxin receptor; NfL, Neurofilament light; GFAP, Glial fibrillary acidic protein.
Correlations of study biomarkers with MMSE scores
Correlations between study biomarker levels and MMSE scores are shown in Fig. 2. While the CSF NPTX2 and CSF NPTXR showed a positive correlation with MMSE scores (Fig. 2A: CSF NPTX2: ρ= 0.41, p < 0.001; Fig. 2B: CSF NPTXR: ρ= 0.33, p < 0.001), NfL and GFAP correlated negatively with MMSE scores in serum (Fig. 2D: NfL: ρ= –0.35, p < 0.001; Fig. 2F: GFAP: ρ= –0.49, p < 0.001). This correlation was less pronounced in CSF (Fig. 2C: NfL: ρ= –0.21, p = 0.018; Fig. 1E: GFAP: ρ= –0.19, p = 0.032).
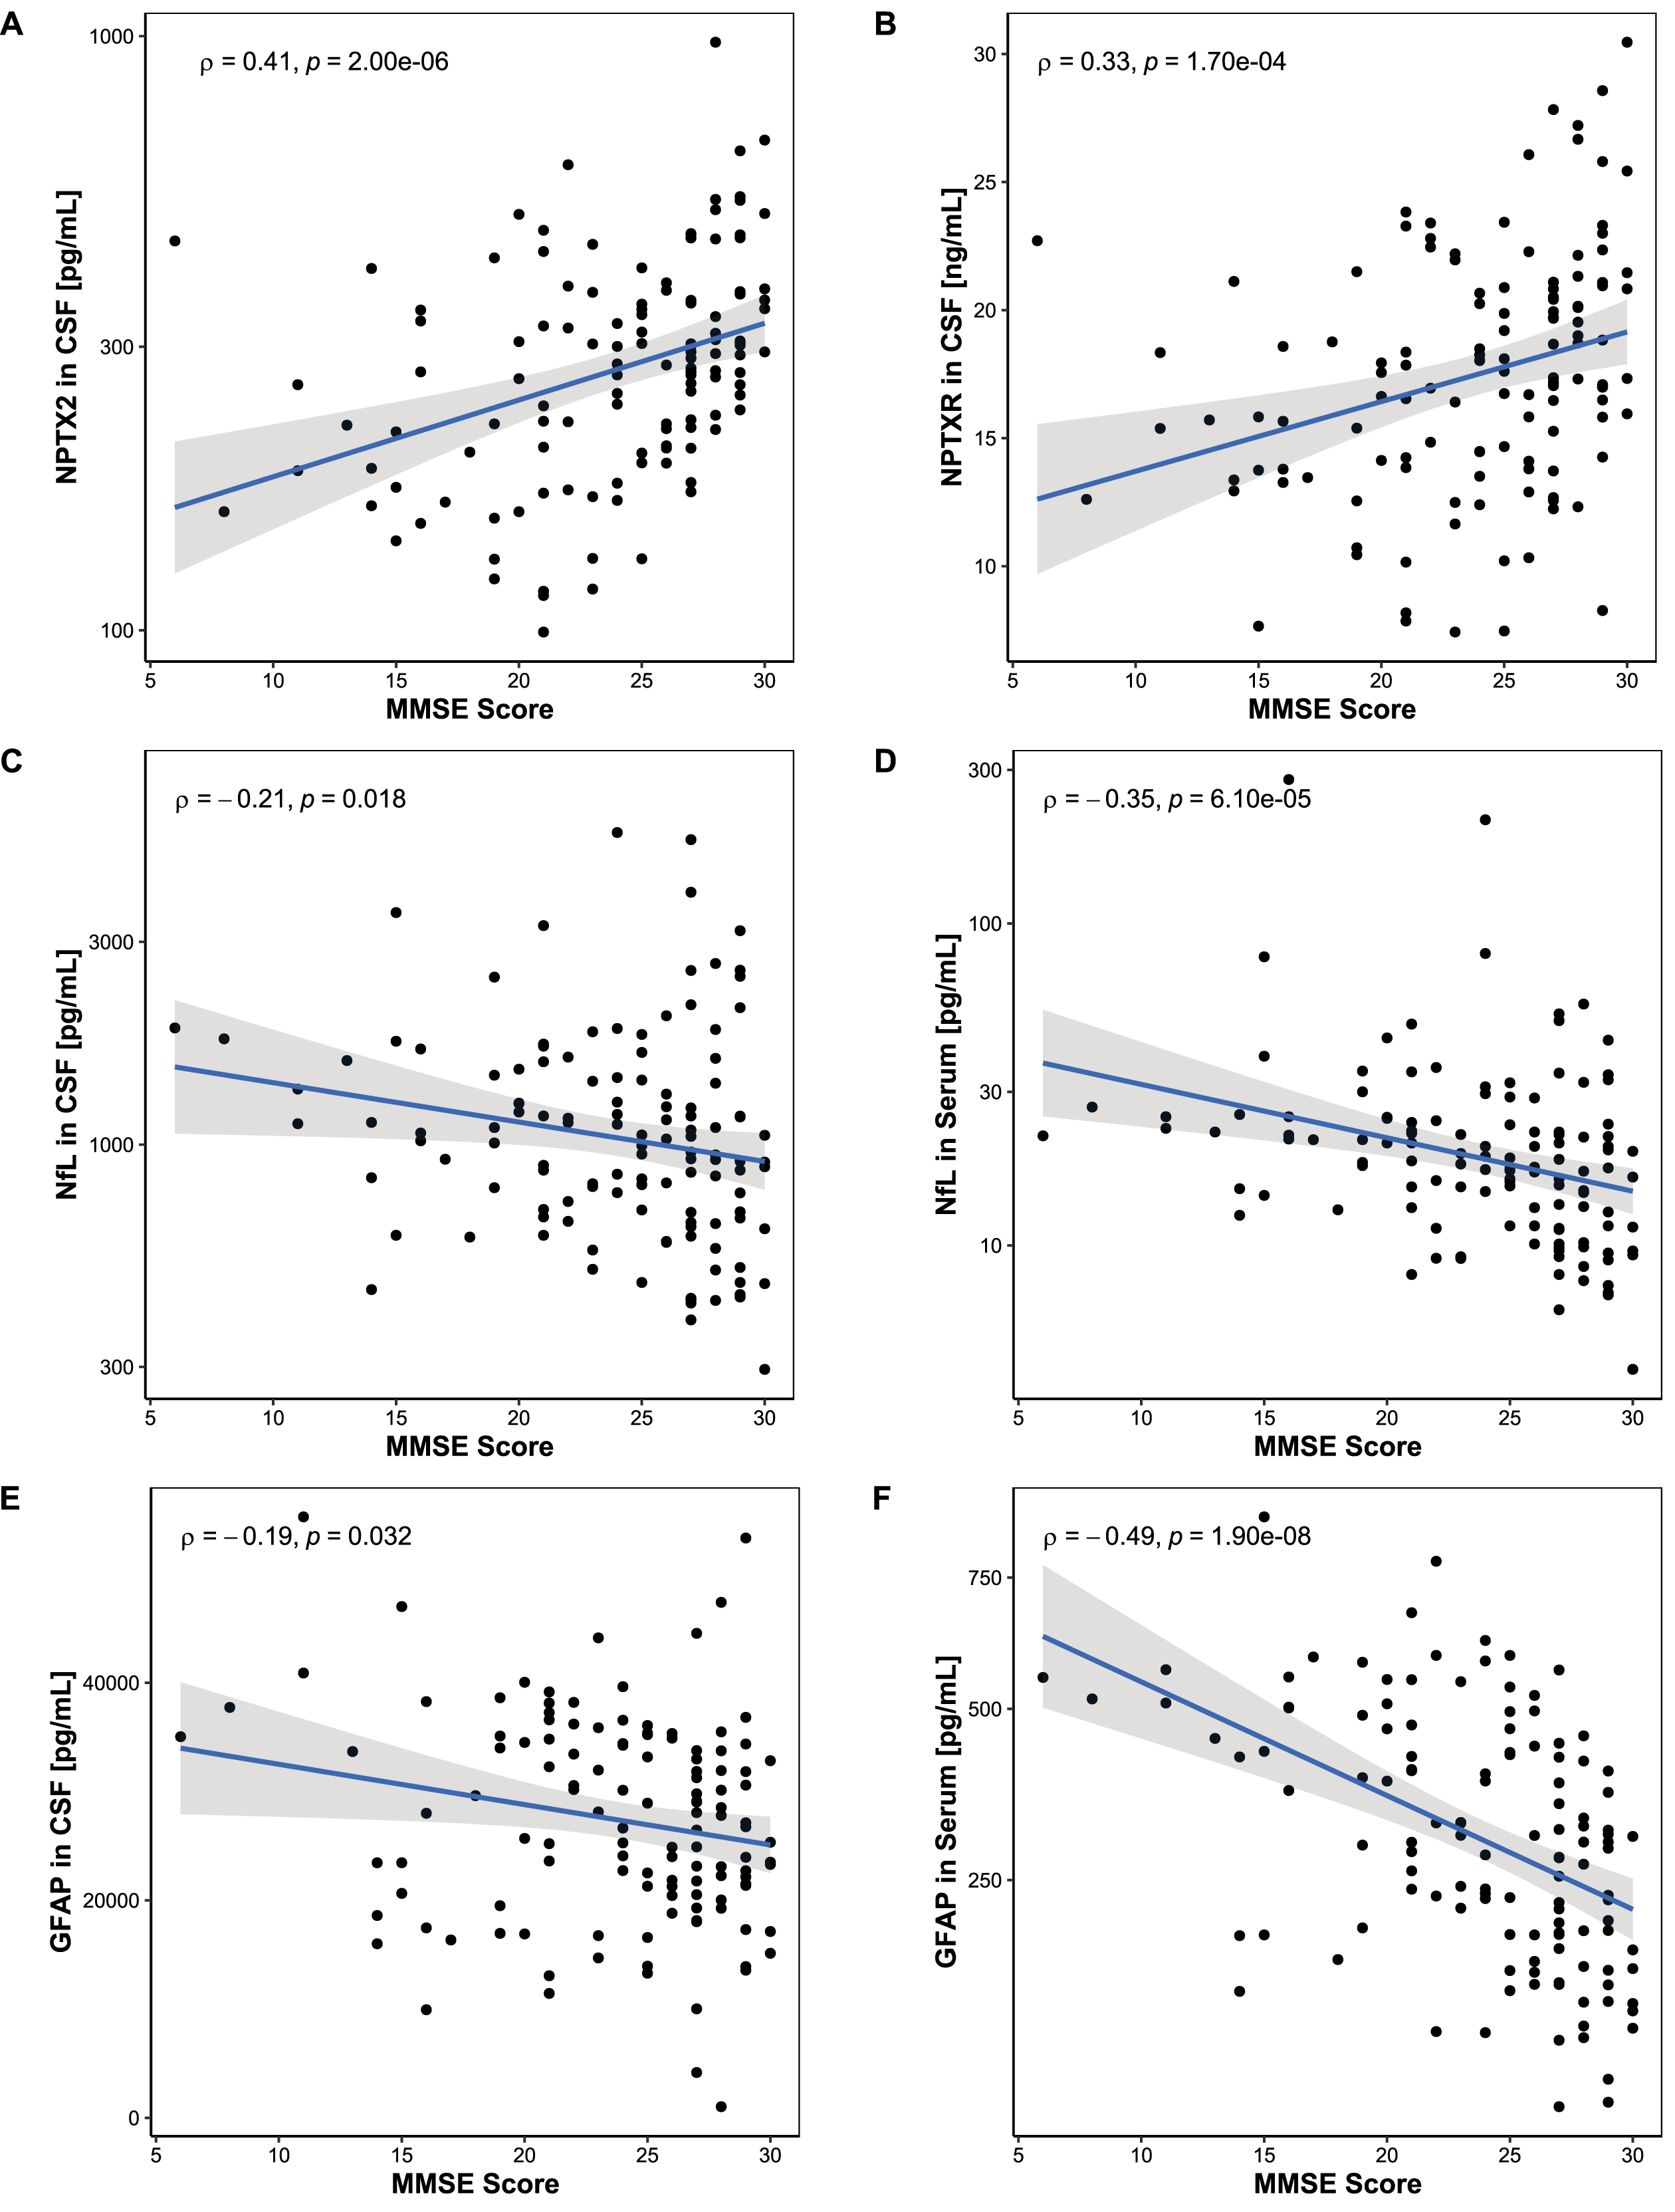
Association between MMSE score and biomarker levels. Associations between MMSE scores and biomarker levels were assessed using Spearman’s correlation. A, B) MMSE scores correlated positively with NPTX2 in CSF and NPTXR in CSF. C-F) MMSE scores correlated negatively with NfL and GFAP in serum but did not reach significance in CSF. Lines represent linear regression and grey areas represent 95% confidence intervals. MMSE, Mini-mental state examination; CSF, Cerebrospinal fluid; NPTX2, Neuronal pentraxin-2; NPTXR, Neuronal pentraxin receptor; NfL, Neurofilament light; GFAP, Glial fibrillary acidic protein.
Differential potential of combined biomarkers
Resulting from the ANCOVA, CSF NPTX2, serum NfL and serum GFAP were selected as the most promising biomarker candidates for the differentiation of FTD from OND and MCI-AD. The final model included age, sex, CSF NPTX2, serum NfL, and serum GFAP as predictors to differentiate FTD from the other diagnostic groups. NPTX2 was the only significant predictor for distinguishing FTD from OND (β= –1.79, SE = 0.91, p < 0.05), while serum NfL and serum GFAP were the significant predictors for distinguishing FTD from MCI-AD (serum NfL: β= 2.17, SE = 0.70, p < 0.01; serum GFAP: β= –0.53, SE = 0.12, p < 0.001). Since these two group comparisons are clinically the most relevant in our study, the combination of these three biomarkers was further investigated and ROC analyses were performed (Fig. 3 and Table 2). The combined biomarkers distinguished FTD from the other diagnostic groups with good performance (AUCs ∼ 0.80) and higher AUC than the biomarkers individually, or a basic model, including only age and sex as predictors.
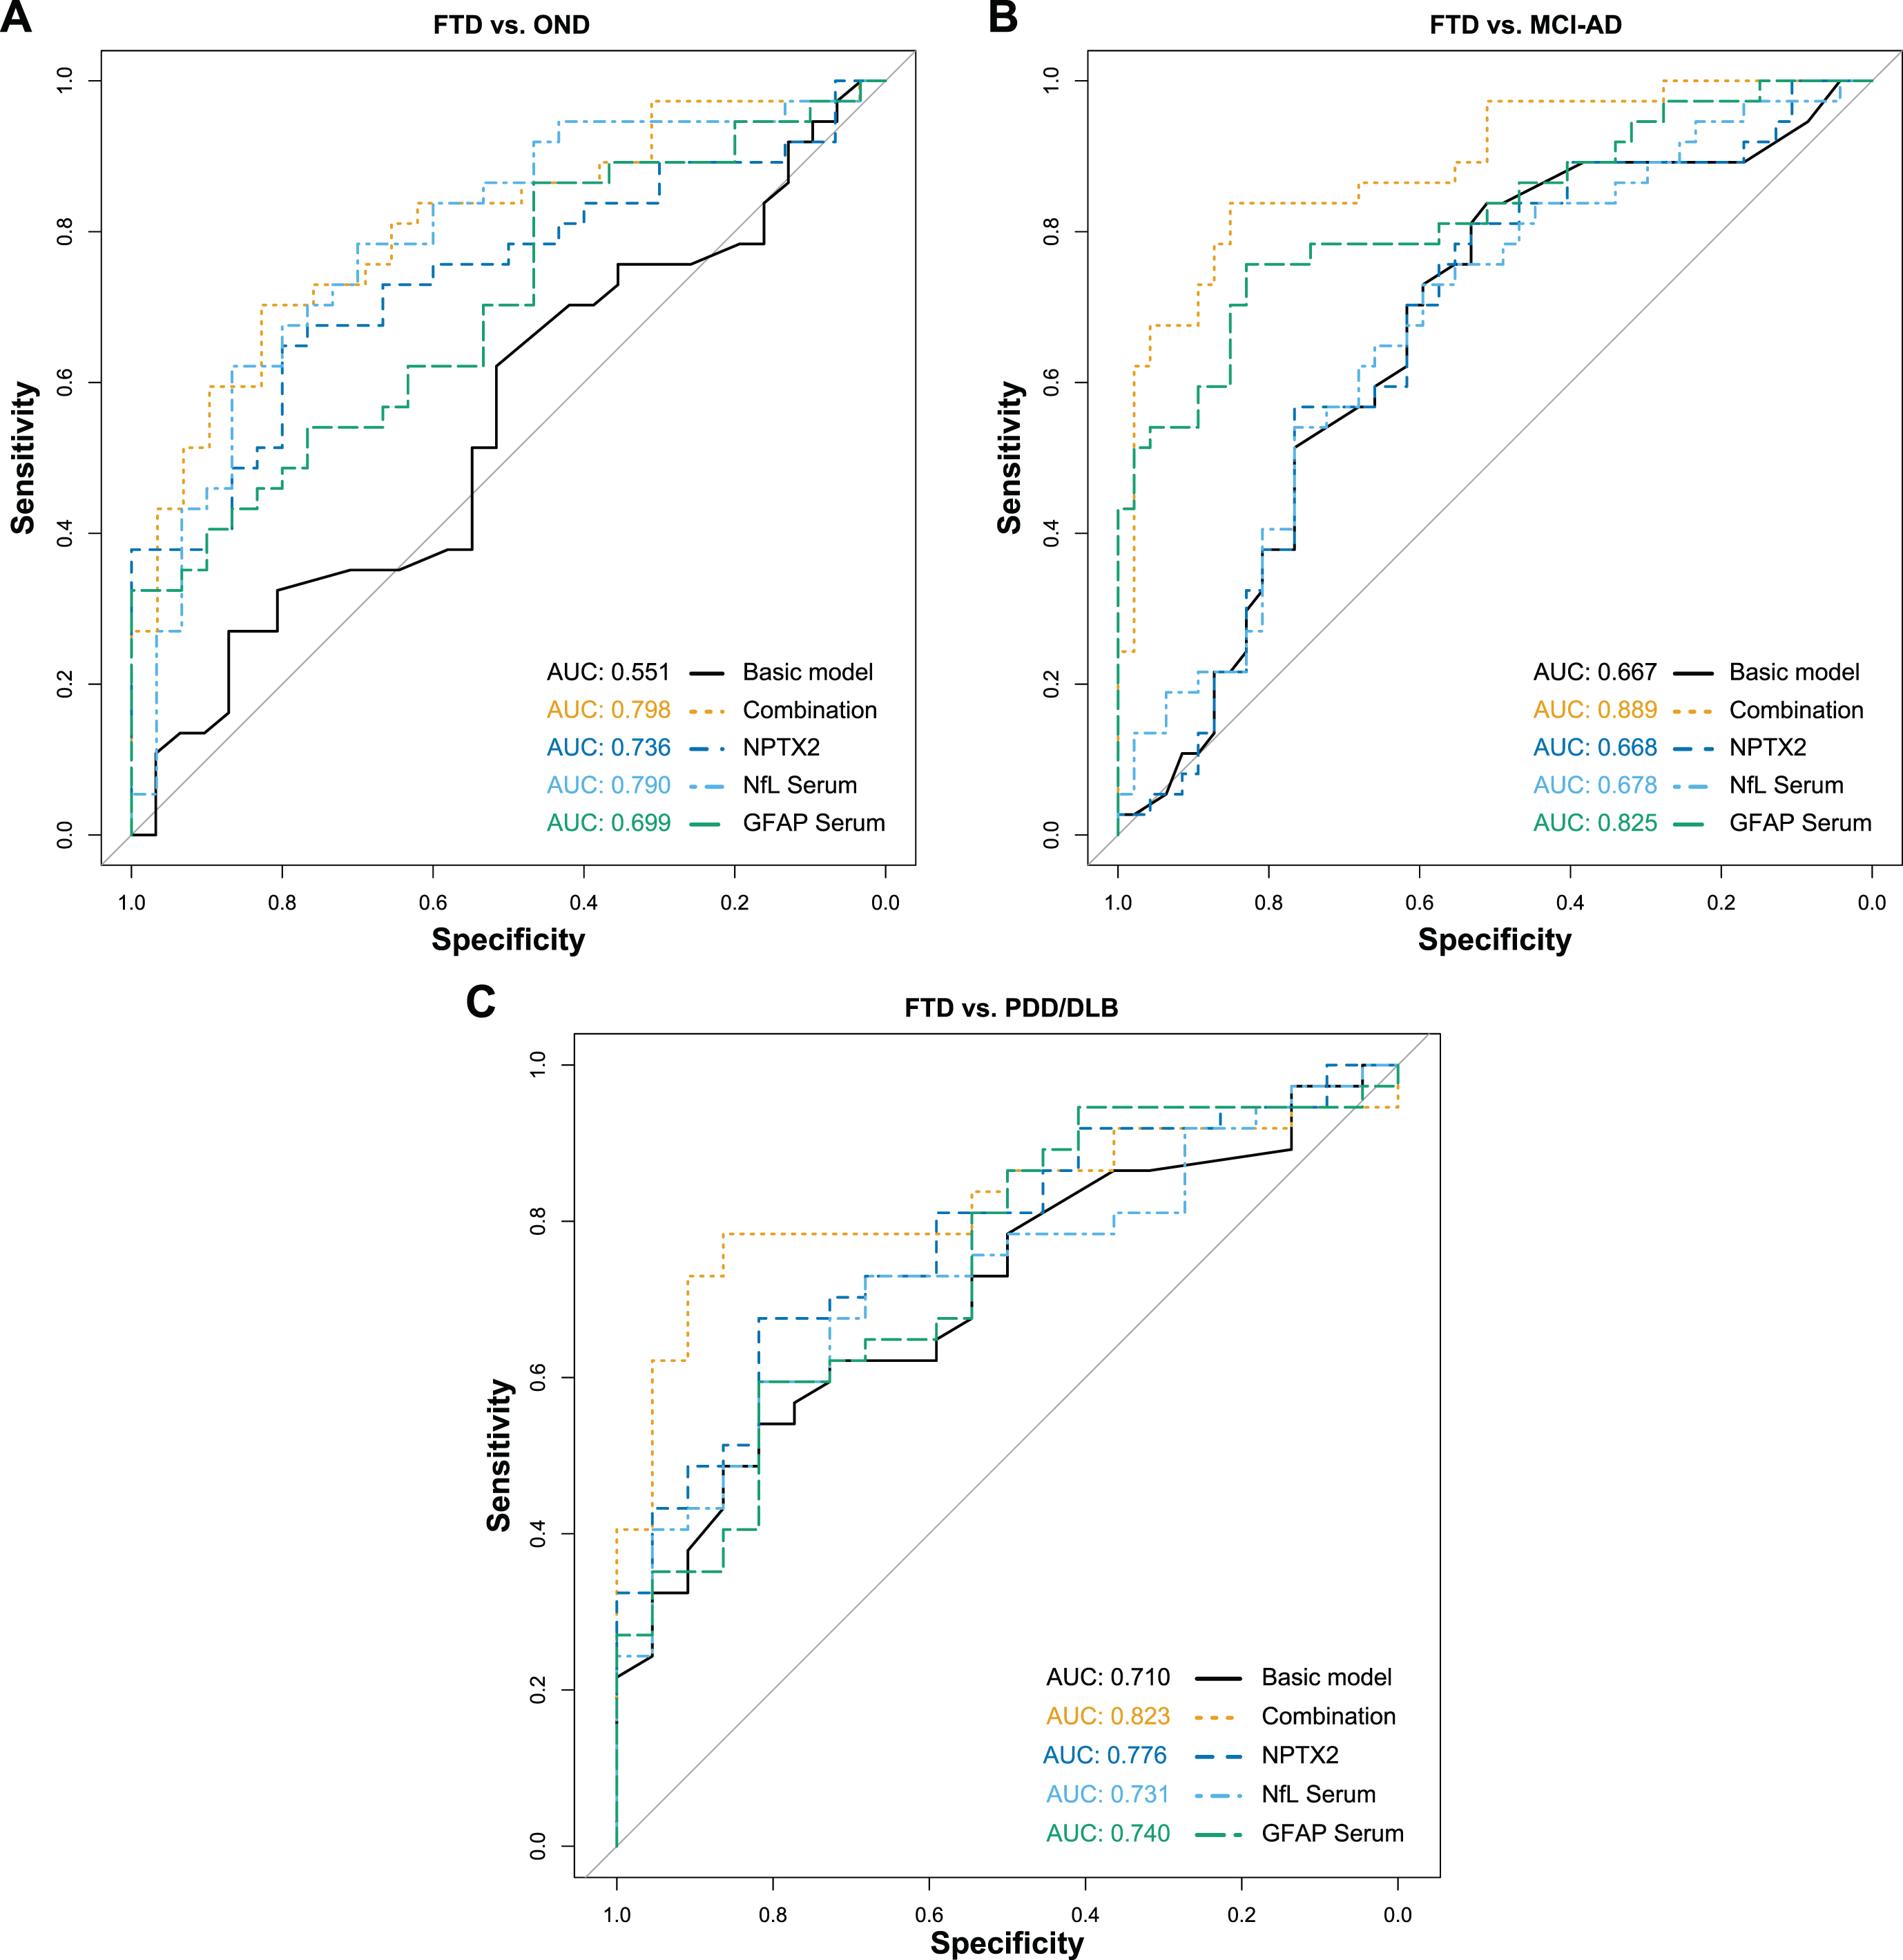
ROC analysis of combined biomarkers for FTD. Diagnostic performance of the combined biomarkers to differentiate FTD from the other diagnostic groups were assessed with ROC analyses and the corresponding AUC. The combination included CSF NPTX2, serum NfL and serum GFAP, while the basic model only included age and sex as predictor variables. A) FTD versus OND. B) FTD versus MCI-AD. C) FTD versus PDD/DLB. ROC, Receiver operating characteristics; AUC, Area under the curve; FTD, Frontotemporal dementia; OND, Other neurological diseases; MCI-AD, Mild cognitive impairment due to Alzheimer’s disease; PDD/DLB, Lewy body dementias; NPTX2, Neuronal pentraxin-2; NfL, Neurofilament light; GFAP, Glial fibrillary acidic protein.
ROC analysis of the combined biomarkers for the differentiation of FTD from other diagnostic groups
Table lists the accuracy parameters of the ROC analysis for combined biomarkers CSF NPTX2, serum NfL and serum GFAP, corrected for age and sex. OND, Other neurological diseases; MCI-AD, Mild cognitive impairment due to Alzheimer’s disease; FTD, Frontotemporal dementia; PDD/DLB, Lewy body dementias; ROC, Receiver operating characteristics; AUC, Area under the curve; CI, Confidence interval; CSF, Cerebrospinal fluid; NPTX2, Neuronal pentraxin-2; NfL, Neurofilament light; GFAP, Glial fibrillary acidic protein.
Correlations of combined biomarkers
To further analyze the associations of the combined biomarkers, Spearman’s rank correlations were calculated (Fig. 4). CSF NPTX2 and serum NfL showed a weak negative correlation in the whole cohort (ρ= –0.21, p < 0.05; Fig. 4A), but no significant correlations were seen in any of the groups separately (Fig. 4B). NPTX2 in CSF and GFAP in serum showed a weak negative correlation in the whole cohort (ρ= –0.20, p < 0.05; Fig. 4C). When stratified for diagnostic groups, a moderate positive correlation was observed in PDD/DLB (ρ= 0.56, p < 0.05), while no significant correlation was observed in OND (ρ= –0.10, p = 2.448), and a negative trend was observed in FTD (ρ= –0.40, p = 0.060) and MCI-AD (ρ= –0.31, p = 0.128) without reaching significance (Fig. 4D). NfL in serum and GFAP in serum correlated moderately in the whole cohort (ρ= 0.57, p < 0.001; Fig. 4E). In PDD/DLB a strong correlation was observed (ρ= 0.74, p < 0.001), while a moderate correlation was observed in OND (ρ= 0.60, p < 0.01) and MCI-AD (ρ= 0.58, p < 0.001), and a weak correlation was observed in FTD (ρ= 0.47, p < 0.05) (Fig. 4F).
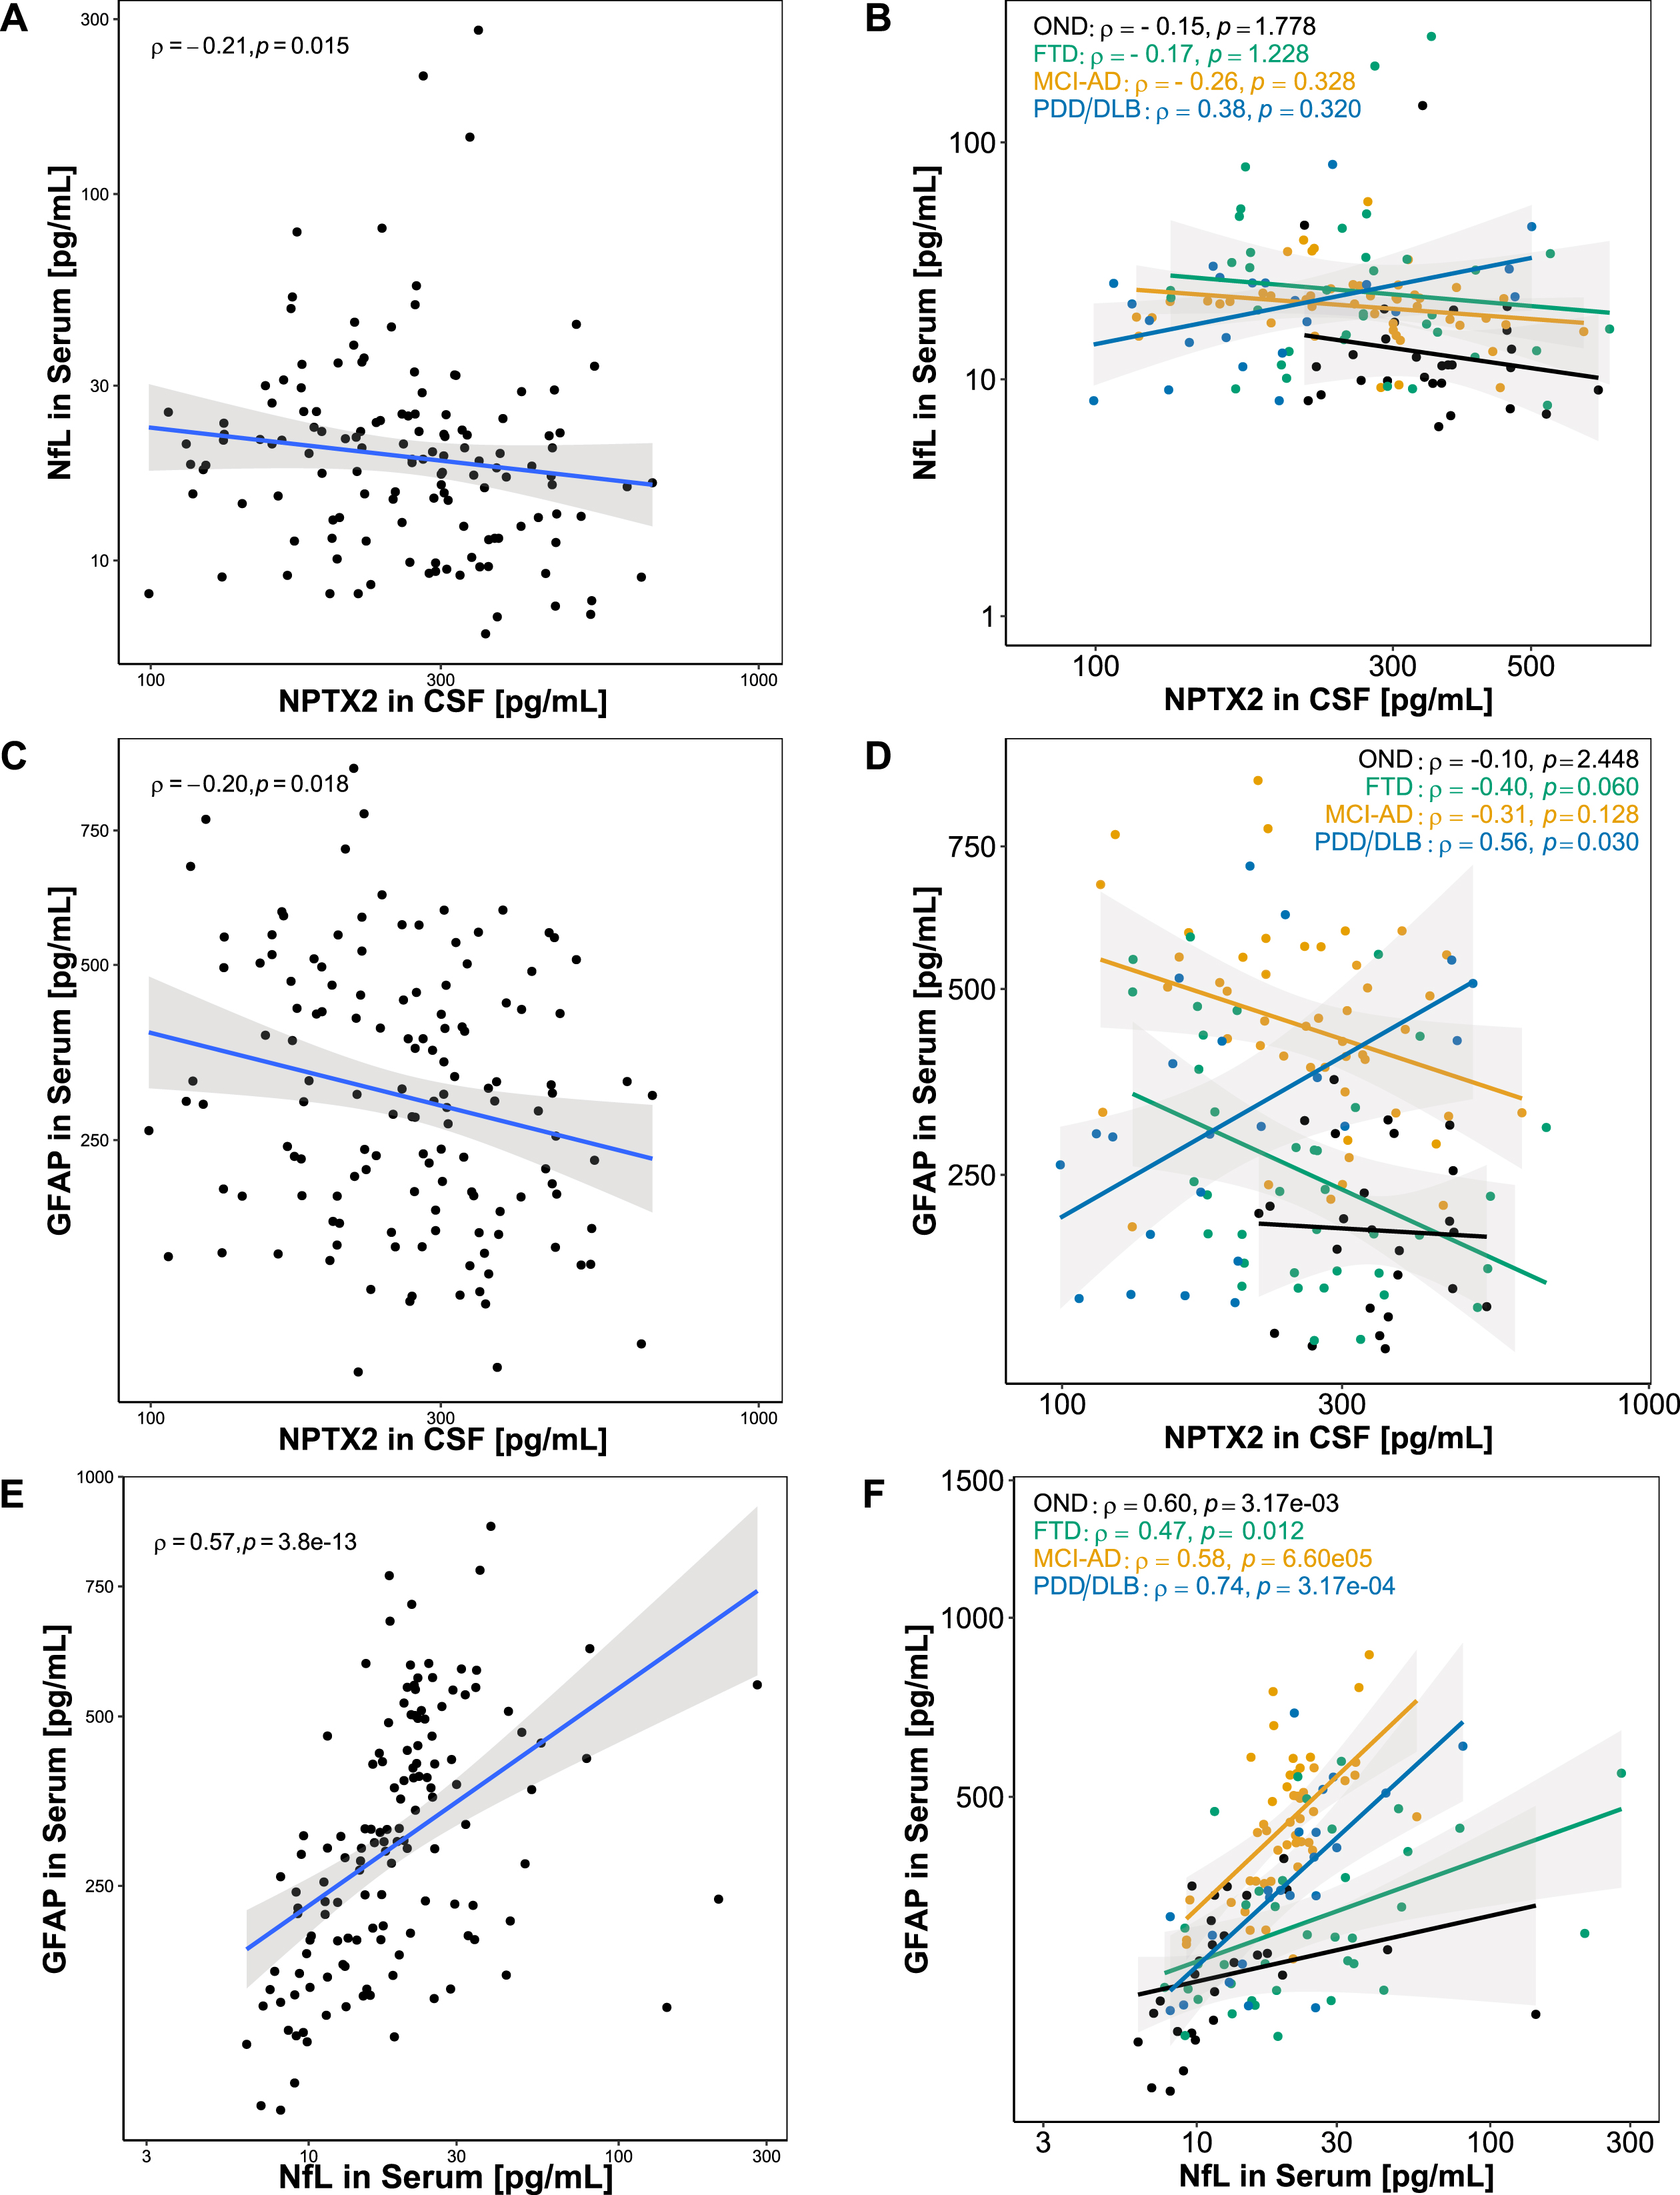
Association between combined biomarkers. Associations between the combined biomarkers were assessed using Spearman’s correlation. A) NfL in serum and NPTX2 in CSF showed a weak negative correlation in the whole cohort. B) When stratified for diagnoses, serum and CSF NfL did not correlate in any of the diagnostic groups. C) GFAP in serum and NPTX2 in CSF showed a weak negative correlation in the whole cohort. D) When stratified for diagnoses, GFAP in serum and NPTX2 in CSF correlated positively in PDD/DLB, while no significant correlation was found in OND, FTD, and MCI-AD. E) A significant positive correlation was found for serum GFAP and serum NfL. F) When stratified for diagnoses, a significant positive correlation was found for serum GFAP and serum NfL in OND, FTD, MCI-AD, PDD/DLB. Lines represent linear regression and grey areas represent 95% confidence intervals. CSF, Cerebrospinal fluid; GFAP, Glial fibrillary acidic protein; NPTX2, Neuronal pentraxin-2; NfL, Neurofilament light; OND, Other neurological diseases; FTD, Frontotemporal dementia, MCI-AD, Mild cognitive impairment due to Alzheimer’s disease; PDD/DLB, Lewy body dementias.
Correlations of serum and CSF biomarkers
CSF and serum NfL strongly correlated in the total study population (ρ= 0.77, p < 0.001) (Fig. 5A), while GFAP levels showed a moderate correlation between CSF and serum in the total group (ρ= 0.50, p < 0.001) (Fig. 5B). Correlations between CSF and serum NfL, stratified for diagnostic groups, were significant in all diagnostic groups (ρ= 0.66 –0.83, p < 0.001) (Fig. 5C). Serum and CSF GFAP correlated moderately in OND (ρ= 0.58, p < 0.01) and PDD/DLB (ρ= 0.57, p < 0.05), but not in FTD (not significant (n.s.)). In MCI-AD, a positive trend could be observed, without reaching significance (ρ= 0.30, p = 0.156) (Fig. 5D).
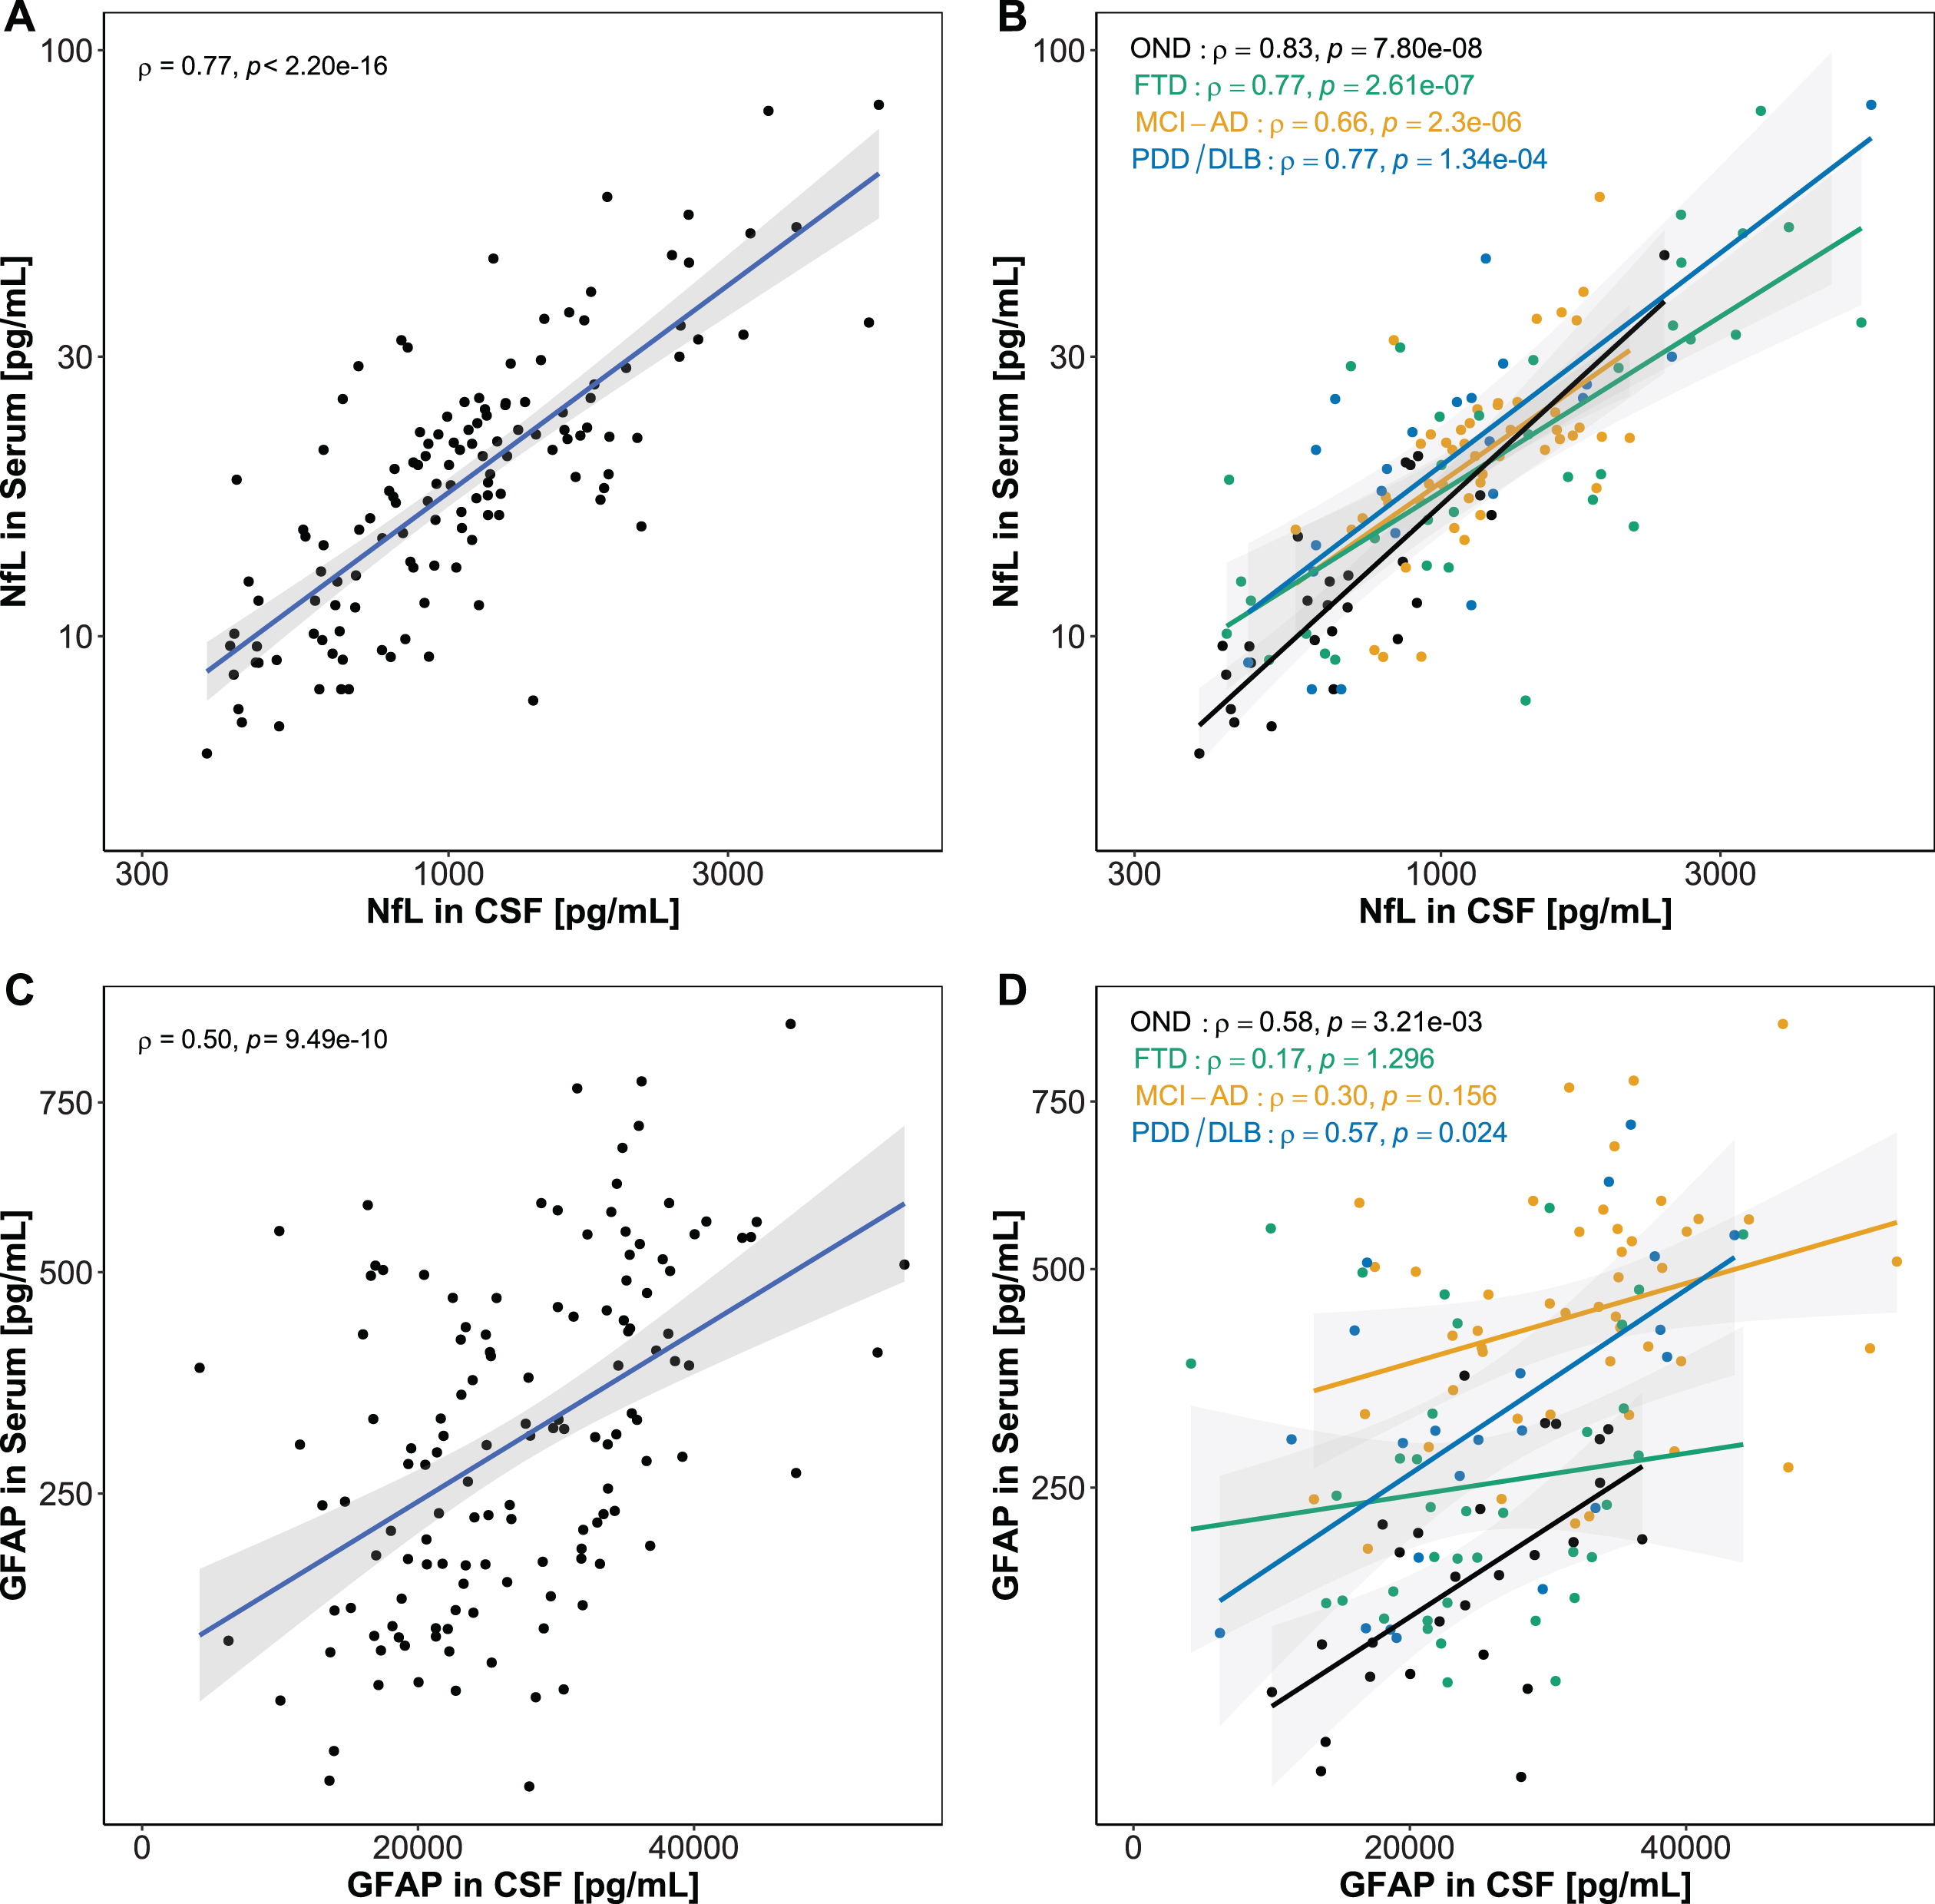
Association between CSF and serum biomarkers. Associations between CSF and serum biomarkers were assessed using Spearman’s correlation. A) A significant strong correlation was found for CSF and serum NfL. B) CSF and serum GFAP correlated moderately in the whole cohort. C) NfL in serum and CSF correlated in all diagnostic groups. D) GFAP in serum and CSF correlated in PDD/DLB, and showed a positive trend in OND and MCI-AD. No correlation was observed in FTD. Lines represent linear regression and grey areas represent 95% confidence intervals. CSF, Cerebrospinal fluid; NfL, Neurofilament light; GFAP, Glial fibrillary acidic protein; OND, Other neurological disease; FTD, Frontotemporal dementia; MCI-AD, Mild cognitive impairment due to Alzheimer’s disease; PDD/DLB, Lewy body dementias.
DISCUSSION
This exploratory study investigated whether NfL, GFAP, NPTX2, and NPTXR in CSF and/or serum could have an added value for the differential diagnosis of FTD in a cohort of 137 patients diagnosed with FTD, MCI-AD, PDD/DLB, and OND. We found altered protein levels of the studied biomarkers between the different dementia diagnostic groups. In FTD, we found lower levels of CSF NPTX2, and higher levels of serum and CSF NfL, compared to OND. Serum and CSF GFAP were lower in FTD than in MCI-AD, while only serum, but not CSF, GFAP levels were higher in FTD than in OND. We showed that a cross-matrix biomarker combination, consisting of CSF NPTX2, serum NfL, and serum GFAP, could distinguish FTD from other diagnostic groups with a maximum sensitivity of 84% (FTD versus MCI-AD), and a maximum specificity of 86% (FTD versus PDD/DLB). The combination of NPTX2 (representing synaptic plasticity [35]), NfL (marker for overall neurodegeneration [60, 61]), and GFAP (depicting astrogliosis [62]) reflects the complexity of pathological mechanisms involved in neurodegenerative disorders and FTD in particular [63–66] Interestingly, these combined biomarkers showed different correlations with each other, depending on the different diagnostic groups, possibly reflecting the different specific underlying mechanisms of each disease.
CSF levels of the neuronal pentraxins investigated in this study showed the highest concentrations in our control group, while in patients with neurodegenerative diseases both proteins showed decreased levels with the lowest levels in PDD/DLB. The decrease of neuronal pentraxins in the Lewy body dementias groups corroborates our previous findings [41] and could be due to the accumulation of these proteins in Lewy bodies, as it has been found for NPTX2 in Parkinson’s disease [67]. Also in cortical brain tissue, a similar trend for decreased NPTX2 levels in AD was observed [68]. Both NPTX2 and NPTXR correlated positively with MMSE scores, as has been previously shown by other groups [69, 70], indicating a possible association with cognitive decline. We and others recently showed that decreased NPTX2 levels in DLB correlate with α-synuclein, confirming the possible interaction of α-synuclein aggregates that disturb pre-synaptic functioning when NPTX2 levels are decreased [71, 72].
Increased levels of NfL in CSF and serum, indicating axonal loss, correlated with increased cognitive impairment, as has been shown previously [73, 74], with a stronger correlation in serum than in CSF.
For GFAP we observed more pronounced group differences in blood than in CSF, as has also been observed by other groups [33, 75]. In CSF we observed elevated GFAP levels in MCI-AD compared to FTD, PDD/DLB, and controls, while in serum, GFAP levels were elevated in MCI-AD, and lowest in OND compared to all other groups. The more pronounced group differences in blood could suggest an association of GFAP levels with amyloidosis [76–79]. Astrocytic end-feet are in close contact with the blood vessels in the central nervous system (CNS) [80]. These connections could possibly act as a direct route for GFAP release into the blood stream. We hypothesize that this leakage could differ across neurodegenerative diseases due to pathology related loss of blood vessel integrity. Furthermore, a breakdown of the blood brain barrier has been shown in neurodegenerative diseases [81, 82]. A dysfunction of the blood brain barrier that might differ between neurodegenerative diseases, could be another possible route for GFAP leakage into the blood stream. Similarly to NfL, higher levels of GFAP correlated with more severe cognitive impairment, with a stronger effect in serum than CSF. This observation strengthens the notion that serum NfL and GFAP can be used as accurate, but less invasive biomarkers than CSF NfL and GFAP [19].
The combined biomarkers allow for studying the interactions of the different pathologies reflected by NPTX2, NfL and GFAP across the different neurodegenerative disorders. CSF NPTX2 values showed a (n.s.) positive trend in the Lewy body dementias and a (n.s.) negative trend with serum NfL levels in OND, MCI-AD, and FTD. This is in line with previous findings in FTD mutation carriers for which a negative association between NPTX2 and NfL in CSF was also observed [43]. A medium to strong positive correlation between serum GFAP and serum NfL was observed in all diagnostic groups, and has been previously described in controls, FTD and AD [83, 84]. This correlation reflects the interaction of neurodegeneration and astrogliosis in the CNS: glial cells are activated in response to degeneration, but also infection or injury, exerting neuroprotective and neurotoxic effects to maintain homeostasis [85]. A chronic activation of these cells may directly lead to a deterioration of the underlying disease pathology by the accumulation of cytotoxic factors [29, 85]. Interestingly, CSF NPTX2 and serum GFAP showed a negative correlation trend in MCI-AD and FTD but showed a positive correlation in the PDD/DLB group. This difference might result from PDD and DLB being Lewy body diseases characterized by α-synuclein accumulations, as indicated above [71, 72], while AD and FTD are caused by the accumulation of different proteins leading to distinct pathological mechanisms. Astroglia are interacting with synapses and forming part of the synapse structure [86, 87], which could be an explanation for the positive association between serum GFAP and CSF NPTX2.
We observed strong correlations between CSF and serum levels for NfL, as it has been previously reported [31, 89]. For GFAP the correlation between CSF and serum levels was weaker, a finding that our group observed before (unpublished data) and could be explained by the more pronounced group differences in serum compared to CSF.
Three of the included FTD patients presented with co-occurring AD pathology (A+/T+), which is a frequent clinical FTD manifestation [90]. As has been shown by Toledo et al., FTD biomarker studies can be confounded by AD co-pathology [91]. However, these subjects did not show deviating study biomarker levels from the remaining FTD group, and upon exclusion of these subjects the main findings of our study were retained.
The combination of blood GFAP and NfL has already shown promising diagnostic potential for the differentiation of FTD, AD, and controls [92], and a combined 2-plex assay has been developed and brought to market by Quanterix (NEUROLOGY 2-PLEX B (Nf-L, GFAP*) Quanterix, USA). Due to the cross-matrix character of the biomarker combination presented in this study (serum and CSF), a clinical application of this combination would not be suitable. However, the development of a blood NPTX2 assay would enable the extension of the 2-plex assay to a 3-plex assay and could possibly improve the potential for differential dementia diagnosis, as suggested by our results.
Strengths
The main strengths of this study are that we explored multiple biomarkers within the same cohort of FTD patients and relevant differential diagnoses, partially in paired CSF and serum samples. All groups were clinically well-defined and well-validated assays were used to measure biomarker levels. We combined established and well-studied biomarkers, i.e., NfL and GFAP, as well as the rather novel synaptic marker NPTX2, which allowed us to study different processes involved in FTD pathology that could possibly be interesting also for the differentiation of FTD subtypes.
Limitations
This study faced some limitations. The small sizes of diagnostic groups included in this study lead to low statistical power. Furthermore, we included AD patients in the clinical stage of MCI rather than dementia that, however, converted into dementia in the following 12–18 months from LP. NPTXR in CSF was measured by ELISA from RayBiotech (RayBio® Human NPTXR ELISA Kit; RayBiotech, USA), which, albeit being used by other groups [93, 94], did not meet the optimal criteria for measurements in CSF when validated by our group. The granularity of NPTXR results might thus be suboptimal. Another limitation is that our proposed biomarker combination uses both CSF and serum, while a combination requiring only blood sampling would be preferred for practical reasons, but NPTX2 levels in serum were not available at the time of study. One study by Shao et al. (2020) suggests detection of NPTX2 in serum showing differential levels between vascular dementia patients and controls [95], however, the brain-specificity of NPTX2 in serum should be explored by correlating NPTX2 levels between serum and CSF. Rather than for diagnostic application, our panel is intended as a comprehensive insight in the behavior of these biomarkers across the spectrum of dementia.
Conclusion
We present a biomarker combination consisting of CSF NPTX2, serum NfL, and serum GFAP, that discriminated FTD from controls and other neurodegenerative diseases with good accuracy. The included proteins represent the complexity of processes involved in FTD pathology, including axonal damage, synaptic dysfunction and astrogliosis and suggests that a combined evaluation of these processes enables differential diagnosis of FTD. Further development of this biomarker combination, especially the development of the NPTX2 assay in blood, and replication are the next steps to assess the diagnostic potential of this biomarker combination.