
Abstract
Single cell transcriptomics has recently seen a surge in popularity, leading to the need for data analysis pipelines that are reproducible, modular, and interoperable across different systems and institutions.
To meet this demand, we introduce
We demonstrate the usefulness of
Introduction
The recent surge in single cell transcriptomics, particularly through single-cell RNAseq (scRNAseq), has led to the need for data analysis pipelines that are reproducible, modular, and able to interoperate across different systems and institutions.
The first step in scRNAseq data analysis consists in generating a count matrix from
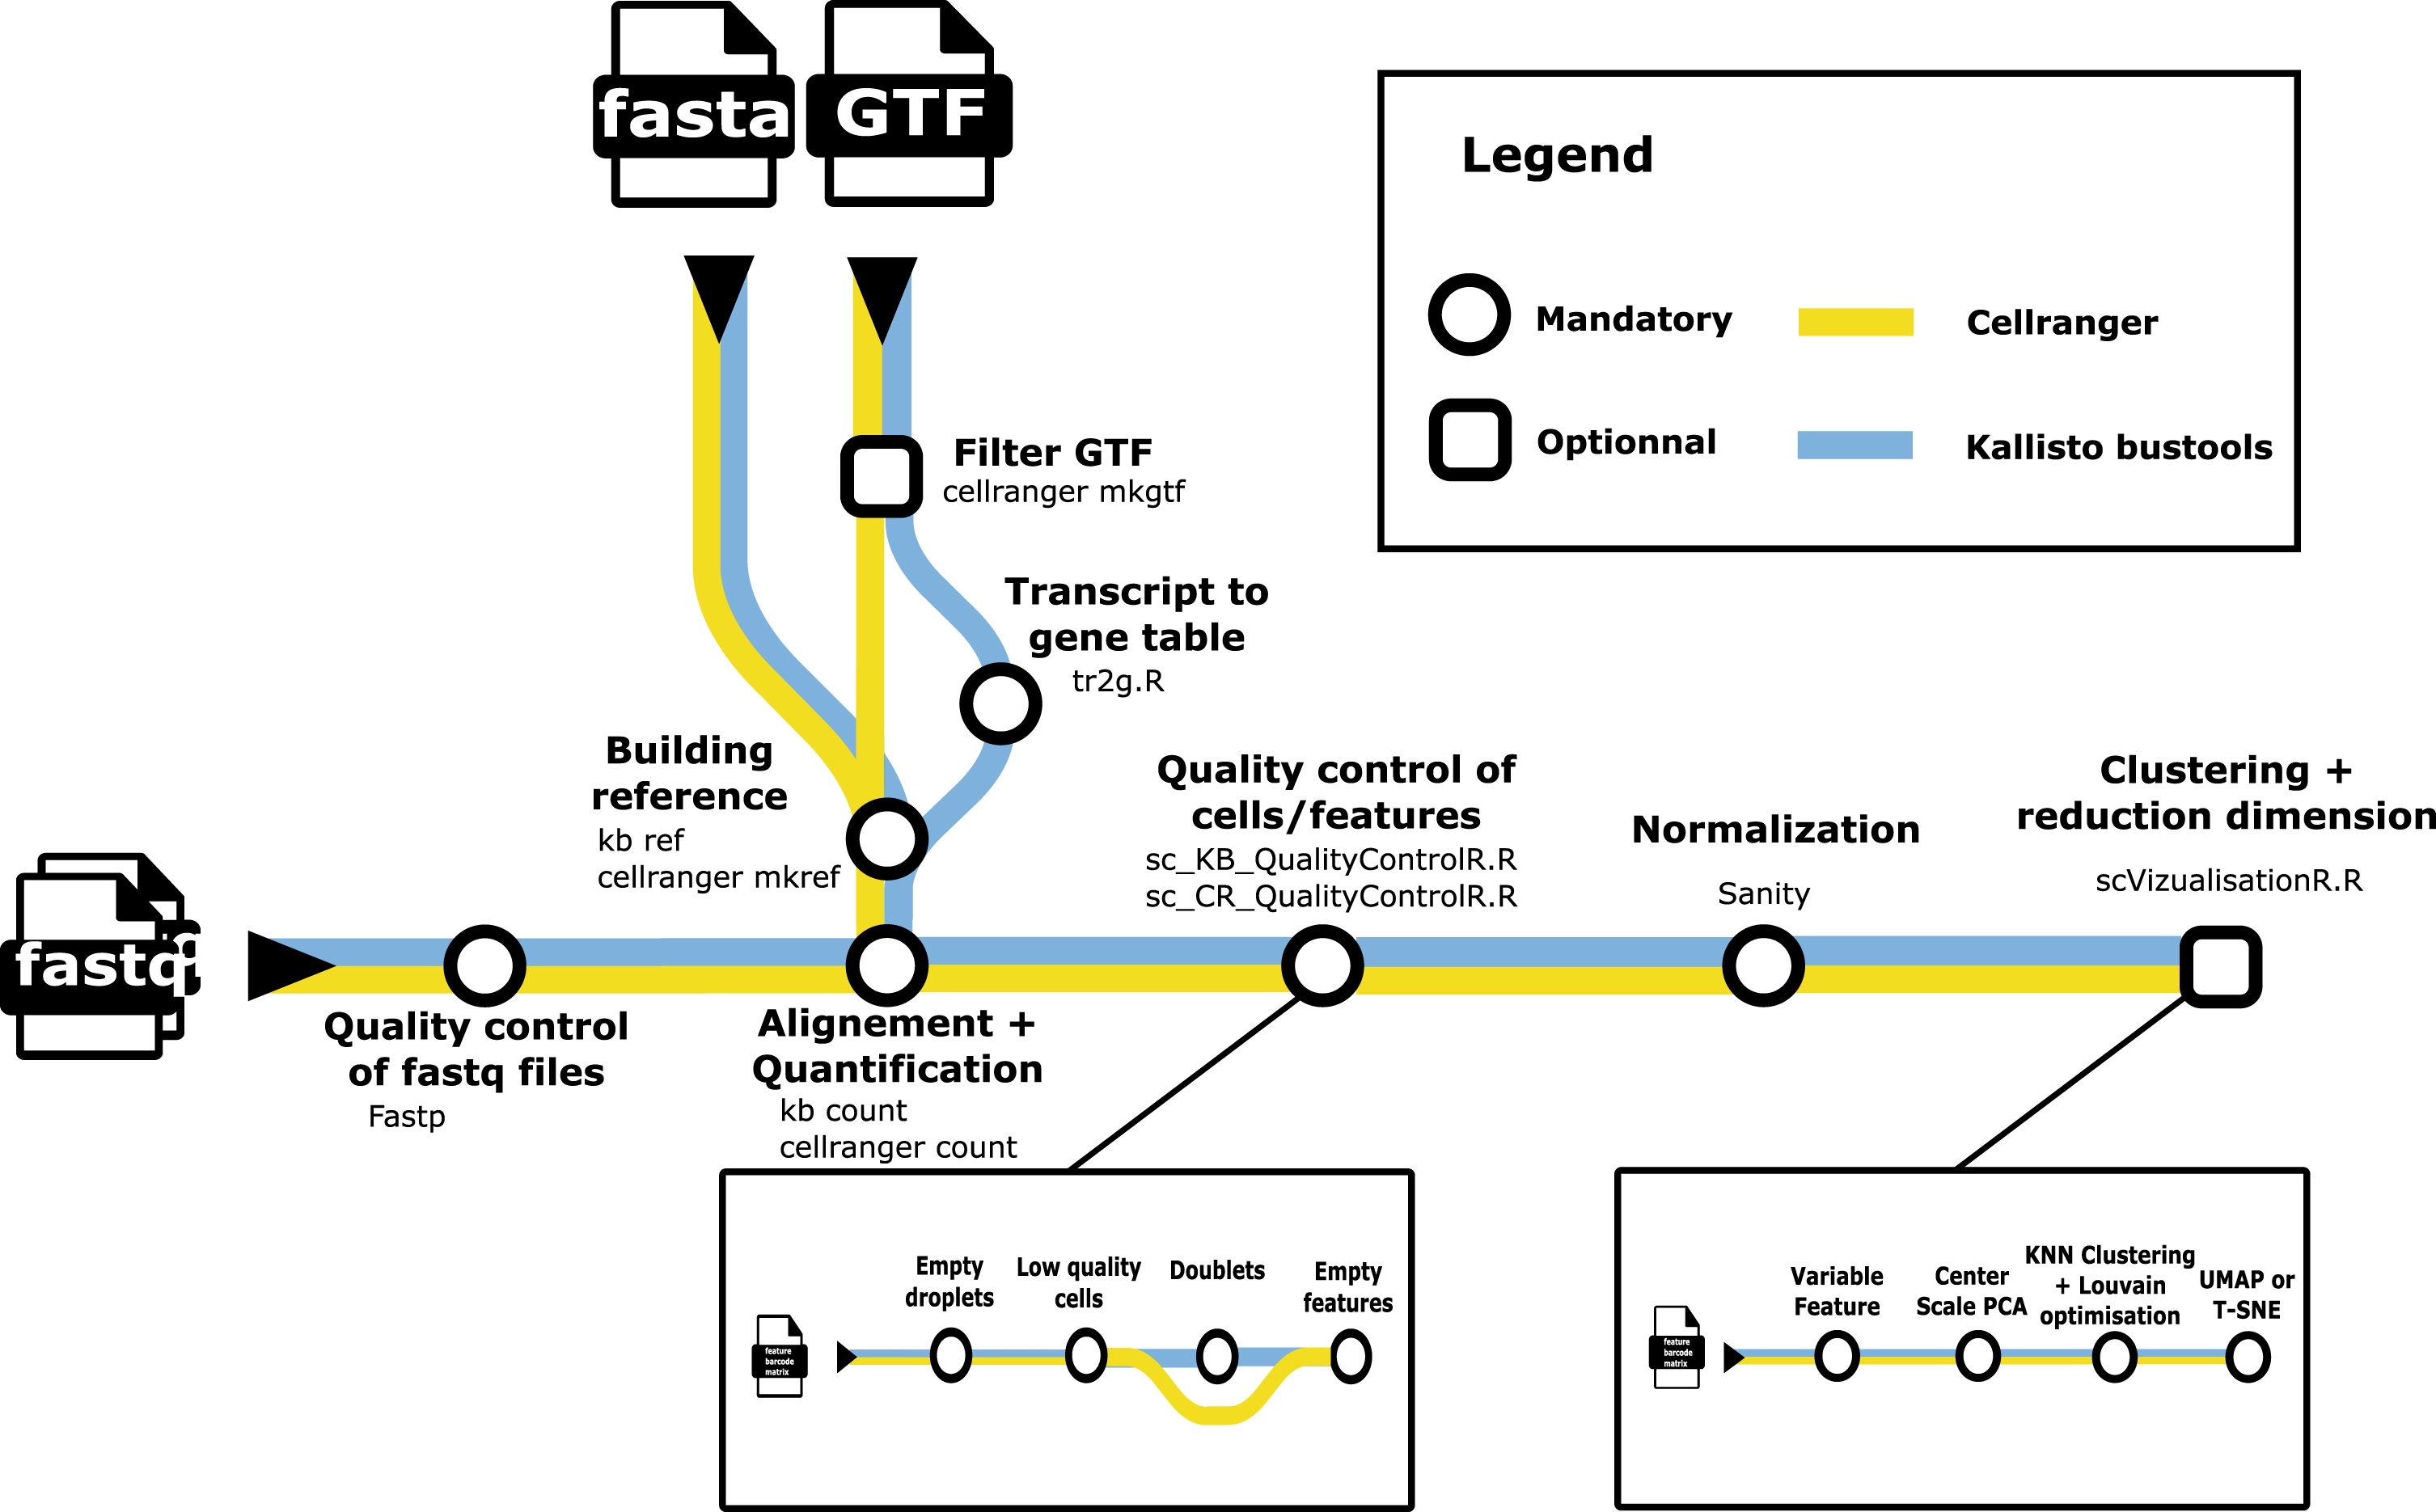
A metromap view of the
scRNAseq analysis packages such as Seurat [1] are designed to be user-friendly, but do not offer easy options for incorporating alternative low-level analysis steps. To address this challenge, we developed
Nexflow [2] is a bioinformatics workflow management tool that aims to improve reproducibility, modular architecture, and cross-environment compatibility in bioinformatics pipelines, through: Reproducibility: Nexflow allows users to easily and accurately reproduce their pipelines by providing a clear and traceable record of all the steps that were taken and the input and output data for each step. This helps to ensure that the results of a pipeline can be easily reproduced and validated by other researchers. Modular architecture: Nexflow has a modular architecture, which means that pipelines can be built by combining smaller, reusable components called “tasks". This allows users to easily reuse tasks in multiple pipelines and makes it easier to maintain and update pipelines over time. Cross-environment compatibility: Nexflow is designed to be compatible with a wide range of computing environments, including on-premises clusters, cloud environments, and desktop computers. This makes it easier for users to run pipelines in the environment that best suits their needs and enables them to easily scale their pipelines as their needs change.
We illustrate the benefit of using
Version annotation effect
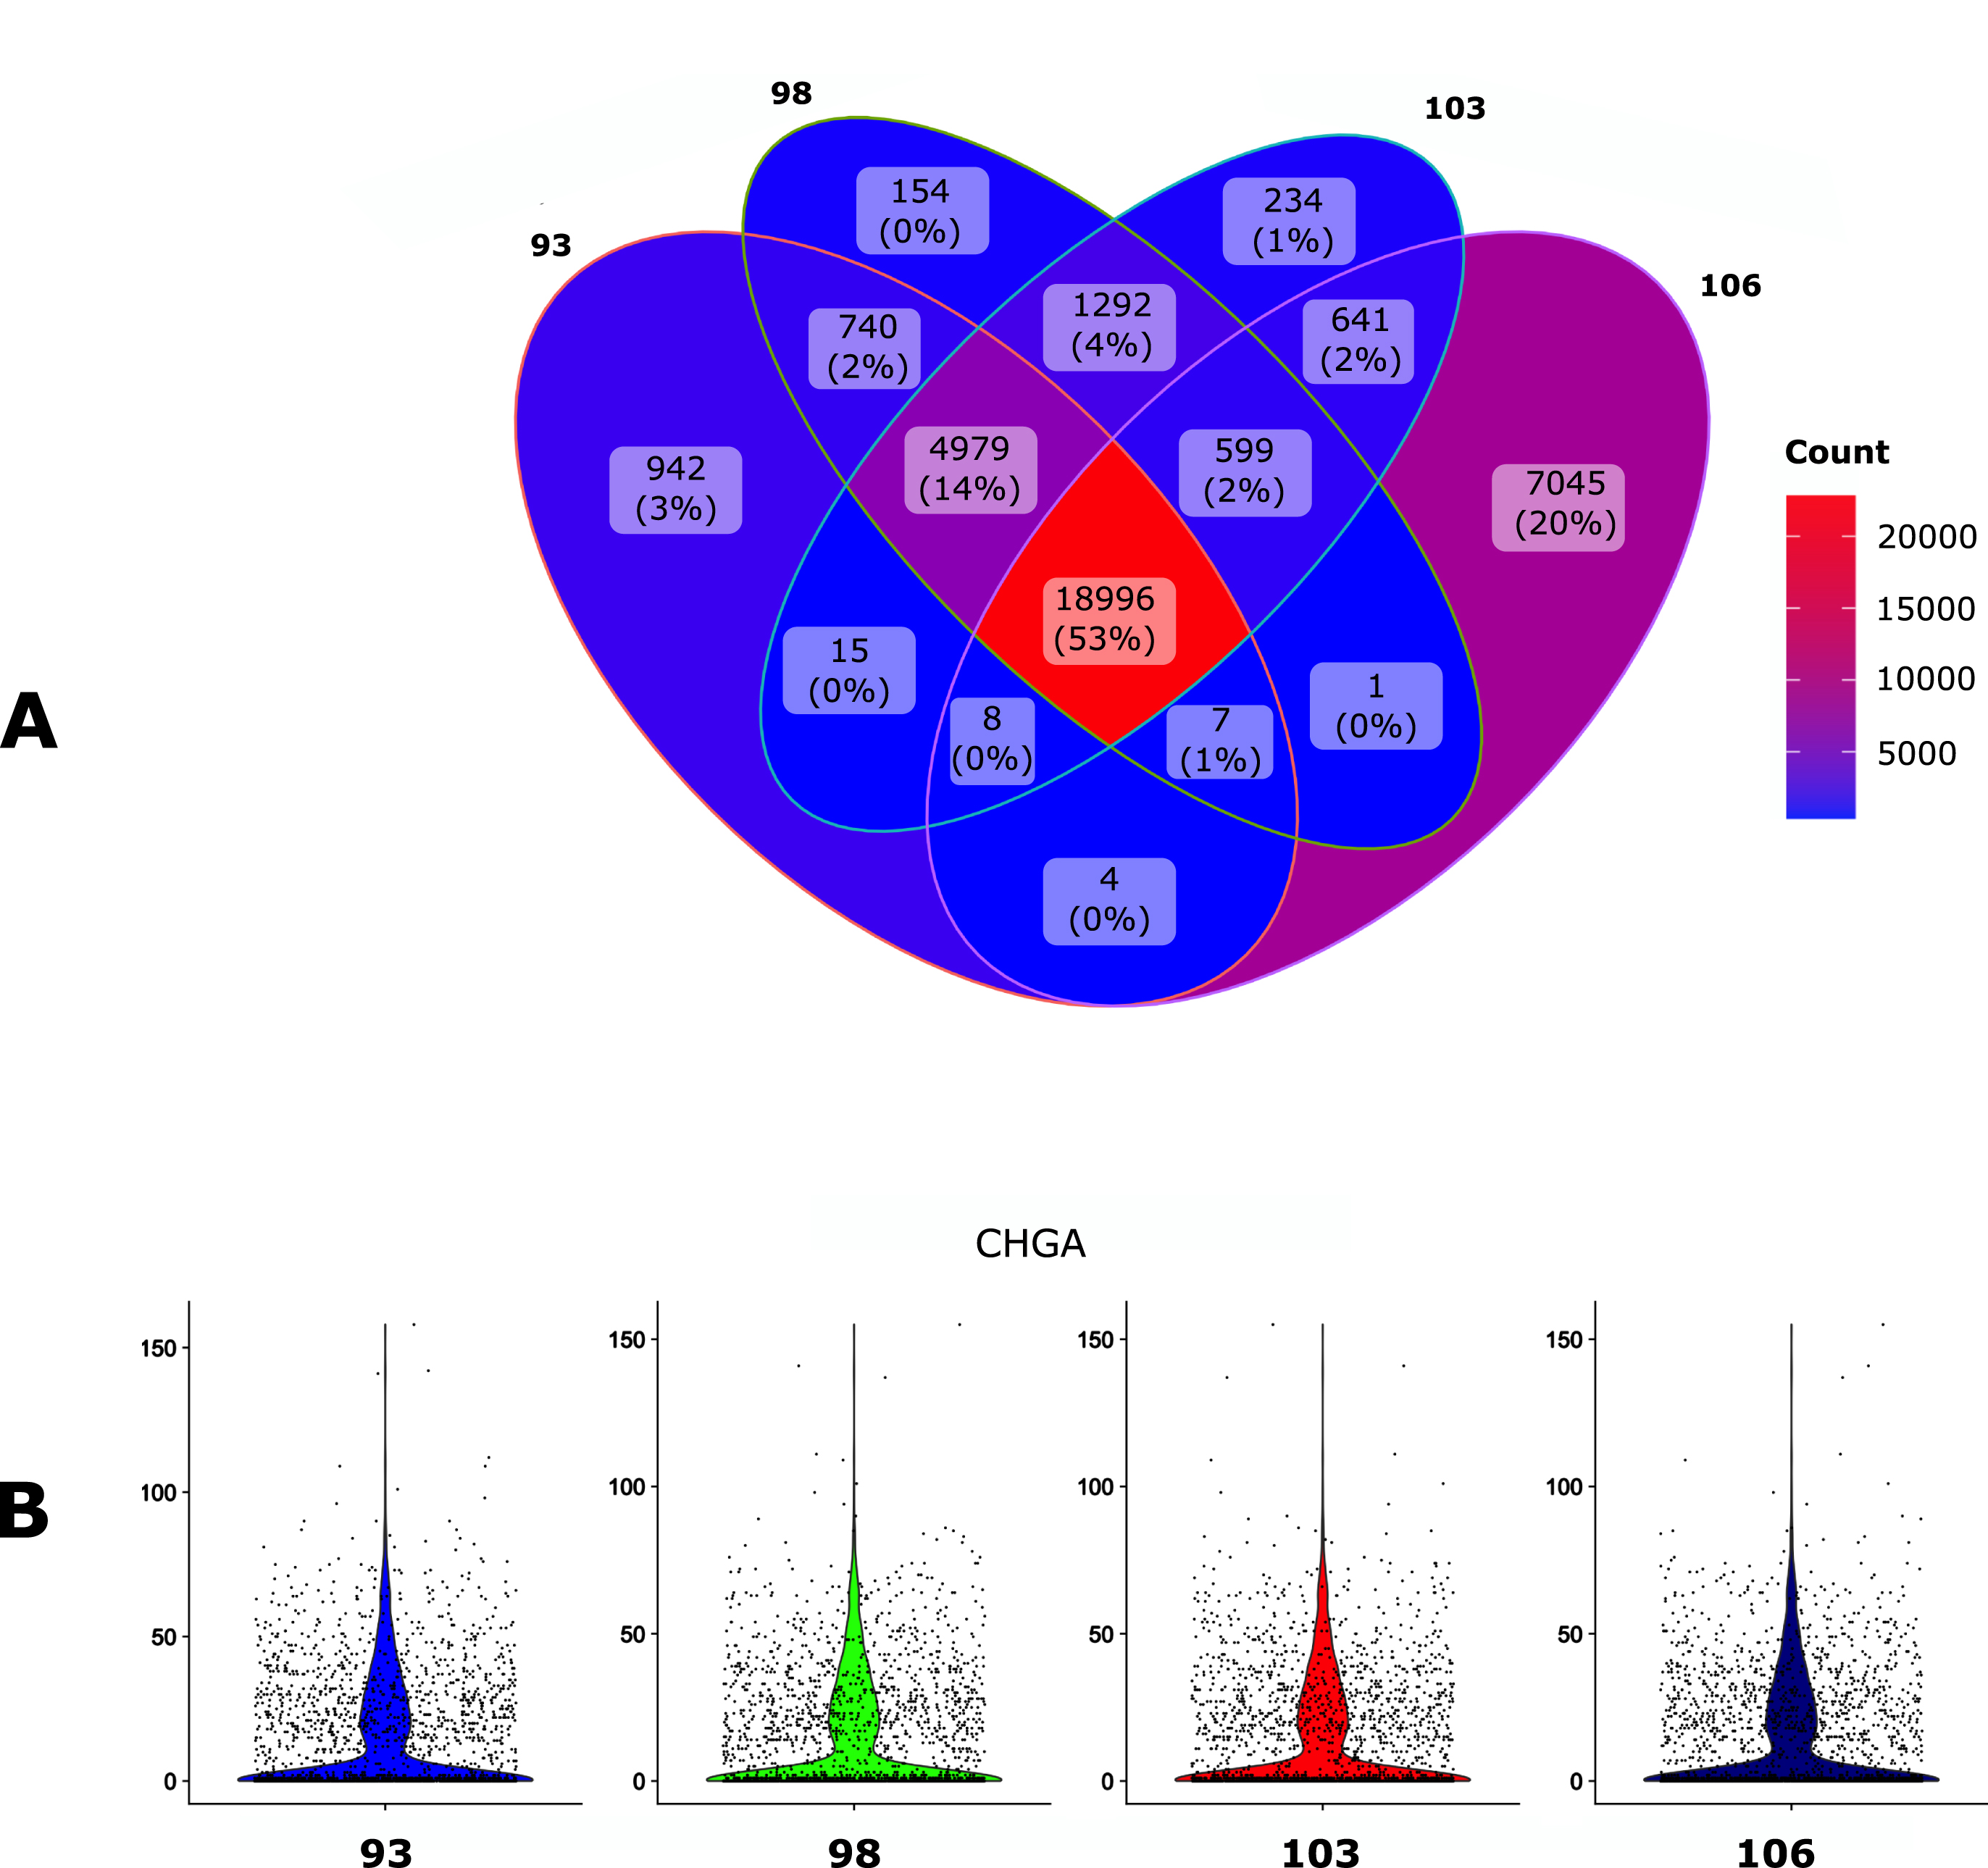
We first assessed the impact of the Ensembl version of the
Impact of the
The overall impact of the
We then assessed the impact of filtrating the

Impact of the
We then compared the impact of two popular alignment tools for single-cell RNA sequencing (Kallisto-bustools and Cellranger) using the 10x Genomics pre-built Cellranger reference packages version 2020-A for human. As seen in Fig. 4A, 81% of the genes were identified by both algorithms whereas Kallisto-bustools identified more genes than Cellranger.
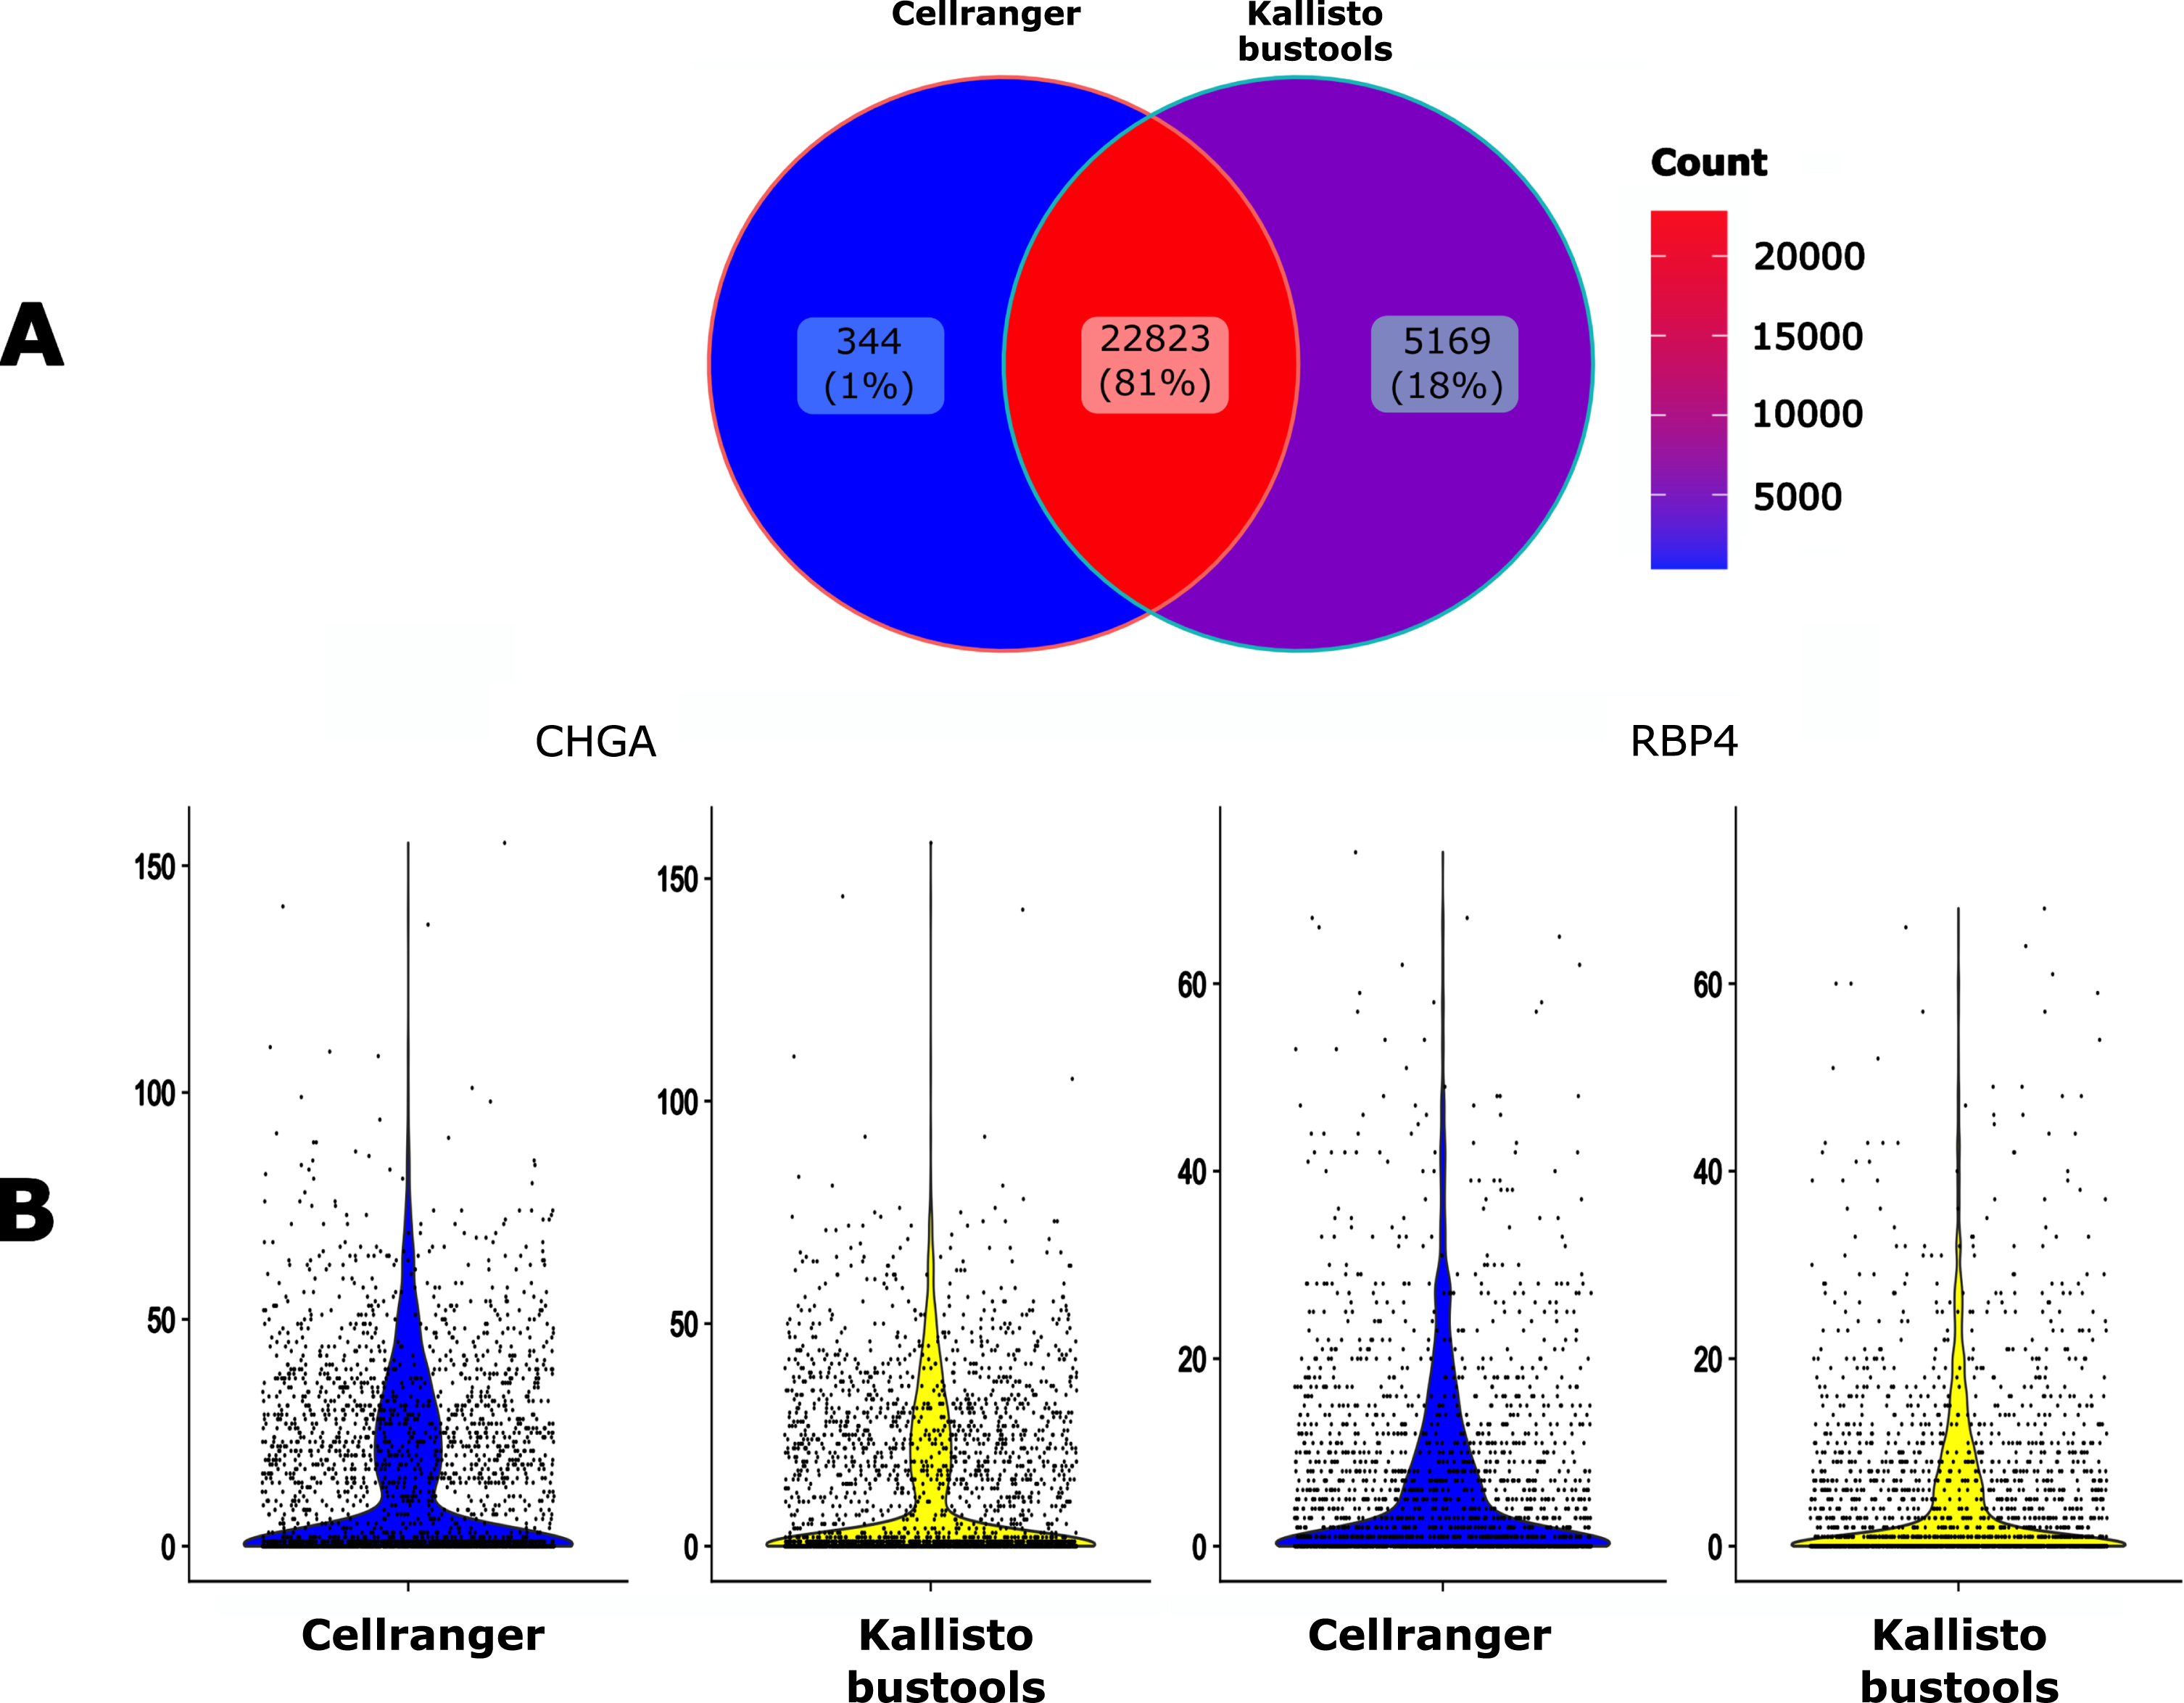
Impact of the mapping tool. A. Venn diagram of the number of the detected genes when using either Cellranger (CR) or Kallisto-bustools (KB) as an alignment tool. B. Violin plot representation on the UMI counts for two genes, CHGA and RBP4.
The impact of the mapper on counts for specific genes seemed to be negligible (Fig. 4B). Therefore this tends to favor Kallisto-bustools for downstream analyses.
We also assessed the impact of the mapper choice on the final clustering step. As seen in Fig. 5, the impact was modest but apparent (e.g. cluster number 1 in the Cellranger dataset was split in two in the Kallisto-Bustools dataset).

Cluster characterization: UMAP representation (A and B) and Silhouette scores (C and D) of the clusters obtained on data processed with CellRanger (A and C) or Kallisto-bustools (B and D). In E, is shown an alluvial plot highlighting the conservation and differences in cluster composition depending upon the initial mapping method.
Please, note that the different positioning of the clusters on each UMAP is due to known flaws associated with a 2D representation using UMAP (see e.g. [3])
The final combination that was found to be the most effective for our human dataset therefore was using Kallisto-bustools together with the filtered version of the 106
We decided to apply
As seen in Fig. 6, overall less genes were detected than observed in human cells with 11587 genes identified by both algorithms. Quite interestingly we observed the very same increase (plus 20%) in in the number of genes identified by Kallisto-bustools when compared with Cellranger.
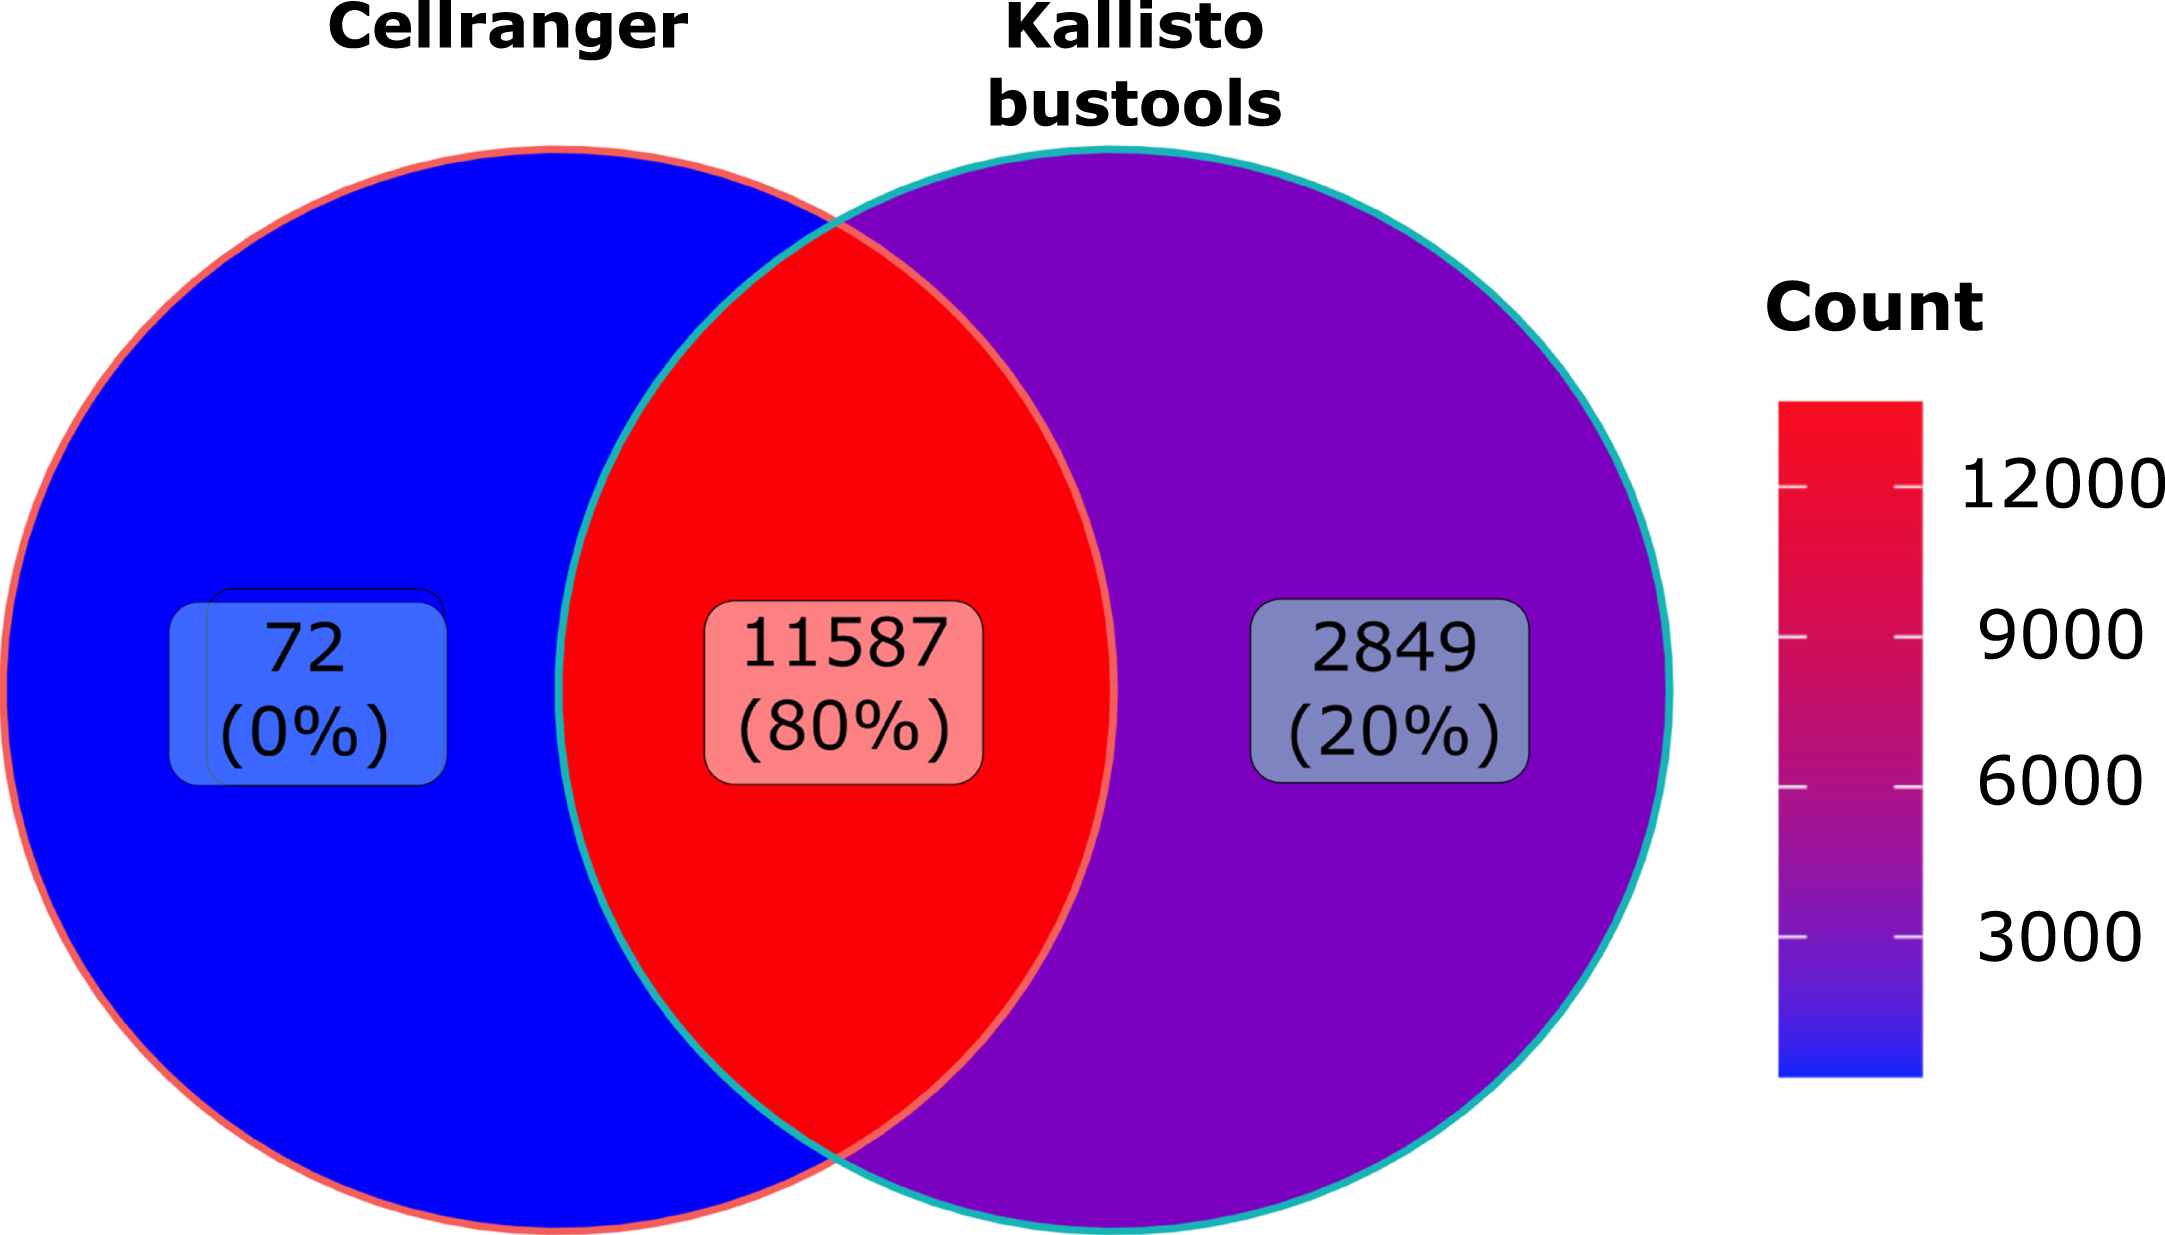
Murine dataset analysis: Venn diagramm of the number of genes detected using Cellranger (CR) or Kallisto-bustools (KB) as alignment tool the murine CD8 dataset.
We described
By applying
As expected, filtrating the
Futhermore, when using Kallisto-bustools instead of Cellranger the impact of the count numbers for specific genes seemed to be small but meaningful. Finally, Kallisto-bustools produced higher total number of genes detected than Cellranger on two very different datasets. For the human dataset, we obtained 5169 unique genes detected by Kallisto-bustool as compared to 344 unique genes detected by Cellranger. For the murine dataset, the ration was 2849 to 72.
From a biological standpoint, this represents a very significant increase in the amount of biological information at hand, and in our view, it fully justifies the use of Kallisto-bustools instead of Cellranger.
Thus,
The use of
Up to now, two solutions were offered to anyone wanting to process scRNAseq data: (i) using a turnkey solution like Seurat or (ii) chaining its own combination of required scripts (see e.g. [9]). Our solution bridges the gap between those two options: (i) it can be run easily in a “full Seurat mode” or (ii) it can used as it stands for exploring the impact of mapping solutions or (iii) it can be used for more advanced bioinformaticians to plug-in and easily chaining new algorithms.
One major limitation of using Nextflow is a lack of interactivity during pipeline running, which would allow the user to modify parameter on the fly. Instead, all pipeline parameters need to be defined and set in the launching command.
In conclusion, we believe that
Material and methods
Pipeline description
Figure 1 describes the overall processing of the sequencing files with the ordering of all steps described in subsection 4.5.
Gonadotroph tumour dataset
Single cell preparation and sequencing. A tumor fragment from a gonadotroph surgically-resected adenoma was collected in Dulbecco’s Modified Eagle Medium (DMEM, cat 41965062; Life Technologies). Single-cell suspension of the resected fragment was obtained through mechanical and enzymatic dissociation (Collagenase P, cat 11213865001) followed by filtration through a 100 μm mesh-strainer (#732-2759, VWR international).
Red blood cells were eliminated using a 10-minute incubation with a commercial red blood cell lysis buffer (eBioscience, cat #00-4300-54). The whole process was achieved within the 2 hours following the surgical resection, cell viability was evaluated to reach at least 70 percent prior encapsulation. Generation of the library was done using a Chromium controller from 10xGenomics. The entire procedure was achieved as recommended by the manufacturer’s for the v3 reagent kit (Chromium Next GEM Single Cell 3’ Kit v3.1 (10xGenomics cat#1000269). Single cell suspension was loaded onto a Chromium Single Cell A Chip, aiming for 5,000 cells in total. The cDNA was amplified after a reverse transcription step, followed by a cleaning using SPRIselect (Beckman Coulter), a quantification step, and enzymatic fragmentation before being sequenced using a NextSeq500 system (Illumina).
Study ethic approval. This work is part of the SPACE-PIT study (MR004 n21-5439). It was approved by the Hospices Civils de Lyon ethical committee and registered at the “Centre National Information et Liberté” (CNIL.fr) under the reference 20_098. Informed consent was obtained from the patients.
Processing. The dataset was processed using species = human (default option) min_cells= 3 min_feature_RNA = 500 max_feature_RNA = 7000 max_percent_mito= 25
The following options were used to choose either KB or CR: version = 106 quantif = cellranger or quantif = kb
The following options were used for filtrating filtergtf
The following options were used to choose version = 106 version = 103 version = 98 version = 93
The number of principal components of the PCA used for UMAP embedding and clustering was set to 10 as determined by the rule of thumb heuristic and the broken stick method [10]. The clustering resolution was set to 0.7.
CD8 T cells dataset
Single cells preparation and sequencing. We downloaded reads from GEO (GSE131847, https://www-ncbi-nlm-nih-gov.proxy.insermbiblio.inist.fr/geo/) with fastqdump (https://rnnh.github.io/bioinfo-notebook/docs/fastq-dump.html) using the
To briefly describe this dataset (see [4] for the full description), P14 transgenic CD8 T cell, which recognise an LCMV epitope, were transferred to histo-compatible hosts that were acutely immunised the day after with the virus. Six days after infection, single responding P14 CD8 T cells from the spleens of immunised hosts were sorted and loaded into Single Cell A chips for partition into Gel Bead In-Emulsions in a Chromium Controller (10x Genomics). Single-cell RNA libraries were prepared according to the 10x Genomics Chromium Single Cell 3 Reagent Kits v2 User Guide and sequenced (paired-end) on a HiSeq 4000 (Illumina).
Processing. The dataset was processed using version = 106 species = mouse filtergtf min_feature_RNA = 500 min_cells= 3 max_percent_mito= 5 chemistry V2
The following options were used to choose either KB or CR: quantif = cellranger or quantif = kb
Implementation
The
Input
The mapping steps requires the input of two additional files corresponding to the species of interest: A A
One should note that for human datasets,
Preprocessing & Mapping
First,
The processed files are then mapped to a reference genome in order to quantify gene expression. In Kallisto-bustools is used thought the Python wrapper: kb_python. Starting with Cellranger creates and prepares a reference package with
Quality control
Empty Droplets. With droplet-based technologies, most of the barcodes in the matrix correspond to empty droplets (e.g., barcodes with the sum of expressions over all genes being null). They must be removed from Kallisto-bustools generated gene expression matrices. Thus, the Kallisto-bustools outputs were imported into
On its side, Cellranger handles empty droplets by itself and matrices cleared of empty droplets were directly imported from the standard filtered barcode output.
After importation, either gene expression matrices were converted as Seurat object (Seurat v4.0.4) with
Low quality cells. On the resulting empty droplet-free matrices, the pipeline computes 3 QC metrics per sample: the number of unique features, the number of UMIs and the percent of mitochondrial gene counts; per cell. These QC metrics are then used to discard three main types of low quality cells [13]: Cells in apoptosis may exhibit high% mitochondrial and low number of UMIs per cell. Bad library preparation leads to low number of unique gene counts and low number of UMIs per cell. Cellular doublets in droplets leads to high number of UMI and unique gene count.
For this, a threshold can be set by the user on
Furthermore, the pipeline uses the
Non-expressed genes. Genes with sum count along cells equal to 0 (e.g. not-expressed genes) are removed.
Normalization
After selection of high quality single-cells droplets and significantly expressed genes, the count matrices are then normalized using
Clustering and two-dimensional visualization
A final step consists in variable features selection with
The resolution parameters used for clustering and the number of principal components kept for both clustering and dimension reduction embeddings can be respectively modified by the user at the start of the pipeline by the
Alternatively, this last step can be skipped allowing the user to use their own clustering method. Similarly, to avoid the introduction of layers of complexity and simplify the pipeline usage, the automatic annotation of clusters was not introduced. Users can annotate their dataset manually.
Output
The complete list of process outputs is available on the Readme file of the gitlab repository (see section 5).
By default, all outputs are saved in the results directory, which is structured into subdirectories that are named according to each process. Results and graphics are stored in the subdirectories that correspond to each process. For the post-quantification steps,
Availability
Acknowledgements
We thank the Institut Convergence Plascan (Grant Number ANR-17-CONV-0002) for their support.
Mirela Diana Ilie has been supported by the Fondation ARC pour la recherche sur le cancer (ARCMD-DOC12020020001361). We thank (i) Emmanuel Jouanneau and Alexandre Vasiljevic from the Neurosurgery and Pathology Departments, Reference Center for Rare Pituitary Diseases HYPO, “Groupement Hospitalier Est” Hospices Civils de Lyon, Bron, France for providing diagnosed Gonadotroph tumor material; (ii) Hector Hernandez-Vargas for his advices and support with setting the single cell dissociation and subsequent bioinformatic analysis; and (iii) Laurent Modolo from the LBMC for his help using the Nextflow syntax.
We gratefully acknowledge support from the PSMN (Pôle Scientifique de Modélisation Numérique) of the ENS de Lyon for the computing resources
We finally thank the BioSyL Federation (https://www.biosyl.org), the LabEx Ecofect (ANR-11-LABX-0048) and the LabEx Milyon of the University of Lyon for inspiring scientific events.
Author contributions
Maxime Lepetit wrote the