Validity of the bench press one-repetition maximum test predicted through individualized load-velocity relationship using different repetition criteria and minimal velocity thresholds
Free accessResearch articleFirst published online November, 2021
Validity of the bench press one-repetition maximum test predicted through individualized load-velocity relationship using different repetition criteria and minimal velocity thresholds
More practical and less fatiguing strategies have been developed to accurately predict the one-repetition maximum (1RM).
OBJETIVE:
To compare the accuracy of the estimation of the free-weight bench press 1RM between six velocity-based 1RM prediction methods.
METHODS:
Sixteen men performed an incremental loading test until 1RM on two separate occasions. The first session served to determine the minimal velocity threshold (MVT). The second session was used to determine the validity of the six 1RM prediction methods based on 2 repetition criteria (fastest or average velocity) and 3 MVTs (general MVT of 0.17 ms, individual MVT of the preliminary session, and individual MVT of the validity session). Five loads ( 2540557085% of 1RM) were used to assess the individualized load-velocity relationships.
RESULTS:
The absolute difference between the actual and predicted 1RM were low (range 2.7–3.7%) and did not reveal a significant main effect for repetition criterion ( 0.402), MVT ( 0.173) or their two-way interaction ( 0.354). Furthermore, all 1RM prediction methods accurately estimated bench press 1RM ( 0.556; ES 0.02; 0.99).
CONCLUSIONS:
The individualized load-velocity relationship provides an accurate prediction of the 1RM during the free-weight bench press exercise, while the repetition criteria and MVT do not appear to meaningfully affect the prediction accuracy.
Exercise intensity is a key variable when designing resistance training programs [1, 2]. Traditionally, exercise intensity is prescribed as a percentage of an individual’s one-repetition maximum (1RM) [1]. To correctly program resistance training based upon %1RM, coaches must attain a 1RM value. Briefly, the direct determination of 1RM consists of a gradual load-progression until reaching the maximum weight which an individual can lift only once [3]. Although direct assessment of 1RM provides a reliable indicator of maximal strength [4], its implementation has been frequently discouraged as it is not only time-consuming, but also physically and psychologically demanding [1, 5, 6]. Consequently, a challenge for sport scientists has been to develop more practical and less fatiguing strategies to accurately predict the 1RM [5, 7, 8, 9]. The individualized load-velocity relationship has been shown to be a potential alternative for predicting the 1RM across a variety of exercises [8, 10, 11]. This is owing to the advancement and proliferation of accurate and reliable technologies for measuring barbell velocity [12, 13, 14], as well as the low intra-subject variability observed for the linear inverse relationship between the relative lifted loads (%1RM) and movement velocity [15, 16]. However, a number of important aspects of load-velocity modeling still remain unresolved.
The determination of the individualized load-velocity relationship requires the assessment of movement velocity against two or more loads [7, 17]. Typically, this is done through an incremental loading test in which individuals perform 3 repetitions when lifting light loads ( 60% of 1RM), 2 repetitions for medium loads (60–85% of 1RM), and 1 repetition for heavy loads ( 85% of 1RM) [17, 18, 19, 20]. The next logical step to create an individual’s load-velocity profile is to select the velocity of each load according to a specific repetition criterion [7, 21]. Some researchers have used as a criterion the average velocity of all repetitions performed at each load to obtain a more robust metric [18, 22, 23], while the most frequent criterion is to use the fastest repetition of each load to represent the maximal performance of the individual [5, 10, 17, 24, 25]. However, the latter may be affected by outliers related to erroneous lifts [21]. However, no study has examined whether the repetition criteria affects the accuracy in the estimation of the 1RM through the individualized load-velocity relationship.
Once the final velocity output of each load has been selected, the next step is to determine the individual relationship between the absolute load and velocity through a linear regression equation [17, 18]. Thereafter, the 1RM can be estimated using the regression equation as the load associated with a minimal velocity threshold (MVT; velocity at 1RM or of the last repetition of a set to failure) [7, 17, 19]. In practice, coaches have two options for selecting the MVT used to predict the 1RM: (I) an individual MVT recorded in a previous session during a 1RM trial [5, 24] or during the last repetition of a set to failure [19] and (II) a general MVT proposed in the scientific literature (e.g., 0.17 ms for the bench press) [17]. The 1RM has been also predicted using the individual MVT recorded during the 1RM assessment performed in the same session in which the load-velocity relationship was modelled [6, 9]. From a practical point of view, this is illogical as there is no need to predict the 1RM in the same session where it has been determined. More important is to determine if a previous attained MVT can accurately predict 1RM in a subsequent session. Moreover, the use of a general MVT simplifies the testing procedure because it would not be necessary to perform a direct 1RM or repetitions-to-failure test at any time point [8], but it has been suggested that using the individual MVT could increase the accuracy in the 1RM prediction compared with using a general MVT [17]. However, the only study that have compared the accuracy in the estimation of the 1RM between general and individual MVTs failed to show significant differences in the deadlift exercise performed with and without lifting straps [9]. It is important to note that, although it does not make sense in practice, this study used the individual MVT recorded during the 1RM trial that was performed in the same session in which the individualized load-velocity relationship was modelled. Due to the low reliability of the MVT [6, 26], it is likely that the accuracy of the 1RM prediction could be worse when using the individual MVT obtained in a preliminary session. However, no study has compared whether the accuracy in the estimation of the 1RM differs when using the individual MVT obtained in the same or a preliminary testing session.
To fill gaps in the scientific literature, the present study was designed to analyze the influence of certain methodological factors (repetition criteria and MVT) on the 1RM prediction capability of the individualized load-velocity relationship. Specifically, the aim of this study was to compare the accuracy in the estimation of the free-weight bench press exercise between six velocity-based 1RM prediction methods based on 2 repetition criteria (fastest and average velocity) and 3 MVTs (general MVT of 0.17 ms, individual MVT of the preliminary session, and individual MVT of the validity session). We hypothesized that the MVT would not significantly affect the accuracy in the prediction of the bench press 1RM [9]. However, no specific hypothesis was formulated regarding the differences between the repetition criteria in the 1RM prediction accuracy due to the lack of similar studies.
Methods
Participants
Sixteen men collegiate sports science students (mean standard deviation [SD]: age 20.6 2.9 years [18–29 years], body mass 72.7 9.3 kg, body height 1.76 0.06 m, and bench press 1RM relative to body mass 1.0 0.2) volunteered to participate in this study. All participants had at least one year of resistance training experience and they reported to use the free-weight bench press exercise in their regular training. No physical limitations or musculoskeletal injury that could affect testing were reported. All participants were informed of the procedures to be used and signed a written informed consent form before initiating the study. The study protocol adhered to the tenets of the Declaration of Helsinki and was approved by the Institutional Review Board of the University of Granada (IRB approval: 988/CEIH/2019).
Design
Participants were tested on two sessions separated by at least 48-h. Both testing sessions were identical and consisted of an incremental loading test until reaching the bench press 1RM [25]. The first session was used to familiarize the participants with the lifting of submaximal loads at maximal velocity and to determine the individual MVT (i.e., velocity of 1RM). The second session was used to determine the validity of the six 1RM prediction methods based on 2 repetition criteria (fastest or average velocity) and 3 MVTs (general MVT of 0.17 ms, individual MVT of the preliminary session, and individual MVT of the validity session). Participants were asked to abstain from any other type of strenuous physical activity over the course of the study. Testing sessions were performed at the same time of day for each participant ( 1h) and under similar environmental conditions ( 22C and 60% humidity).
One-repetition maximum sessions
Each testing session began with a standardized warm-up consisting of dynamic stretching, arm and shoulder mobilization exercises, and 1 set of 5 repetitions of the bench press exercise performed with a 10-kg barbell. After warming-up, participants rested for 3-m before undertaking a standard incremental loading test [25]. The external load was increased in 15 kg until the mean velocity (MV) of the barbell was lower than 0.50 ms. From that point, the load was increased from 5 to 1 kg until the 1RM load was reached. In line with previous studies [8, 18, 19, 20], three repetitions were executed with light loads (MV 1.00 ms), two repetitions with medium loads (0.50 ms MV 1.00 ms), and one repetition with heavy loads (MV 0.50 ms). The average number of loads tested was 7.6 1.2. 10-s and 5-m of rest were implemented between repetitions with the same and different loads, respectively. Participants received feedback on their velocity immediately after each repetition and were encouraged to perform all repetitions at the maximal intended velocity.
The bench press was performed according to the standard five-point body contact position technique (head, upper back, and buttocks placed firmly on the bench with both feet flat on the floor). Participants initiated the task holding the barbell with a self-selected grip width and their elbows fully extended [27]. From this position, they lowered the barbell in a controlled manner until touching the chest at the level of the sternum, and then they pushed the barbell as fast as possible until their elbows reached full extension (touchand-go technique) [28]. Participants were not allowed to bounce the barbell off their chests or raise the trunk off the bench. If these conditions were not met, the repetition was repeated. Two spotters were standing on each side of the barbell to ensure safety.
Data acquisition and analysis
The MV (i.e., average velocity from the first positive velocity of the barbell until the velocity of the barbell was 0 ms) of all repetitions was recorded with a linear velocity transducer (T-Force System; Ergotech, Murcia, Spain) [20]. The cable of the linear velocity transducer was attached vertically to the right side of the barbell using a velcro strap. The T-Force System interfaced to a personal computer by means of a 14-bit resolution analog-to-digital data acquisition board and custom software. Instantaneous velocity was sampled at a frequency of 1000 Hz and subsequently smoothed with a 4 order low-pass Butterworth digital filter with no phase shift and 10 Hz cut-off frequency. Validity and reliability of the T-Force System for the recording of MV have been reported elsewhere [12, 13].
Descriptive data of the five loads used to determine the individualized load-velocity relationships
Absolute load (kg)
Relative load (%1RM)
Number of repetitions
Mean velocity (ms)
Fastest
Average
Load 1
17.5 5.8
23.8 4.9
2.9 0.3
1.37 0.19
1.31 0.17
Load 2
28.8 8.1
39.5 5.2
2.6 0.5
1.05 0.11
1.02 0.11
Load 3
40.0 10.3
55.1 4.9
2.0 0.0
0.81 0.08
0.78 0.08
Load 4
51.6 12.5
71.2 5.3
1.9 0.3
0.62 0.10
0.59 0.08
Load 5
62.6 16.4
86.1 5.5
1.1 0.3
0.41 0.10
0.40 0.09
Data are mean standard deviation. 1RM, one-repetition maximum. , significant differences between the fastest and average velocity ( 0.001; paired-samples -tests).
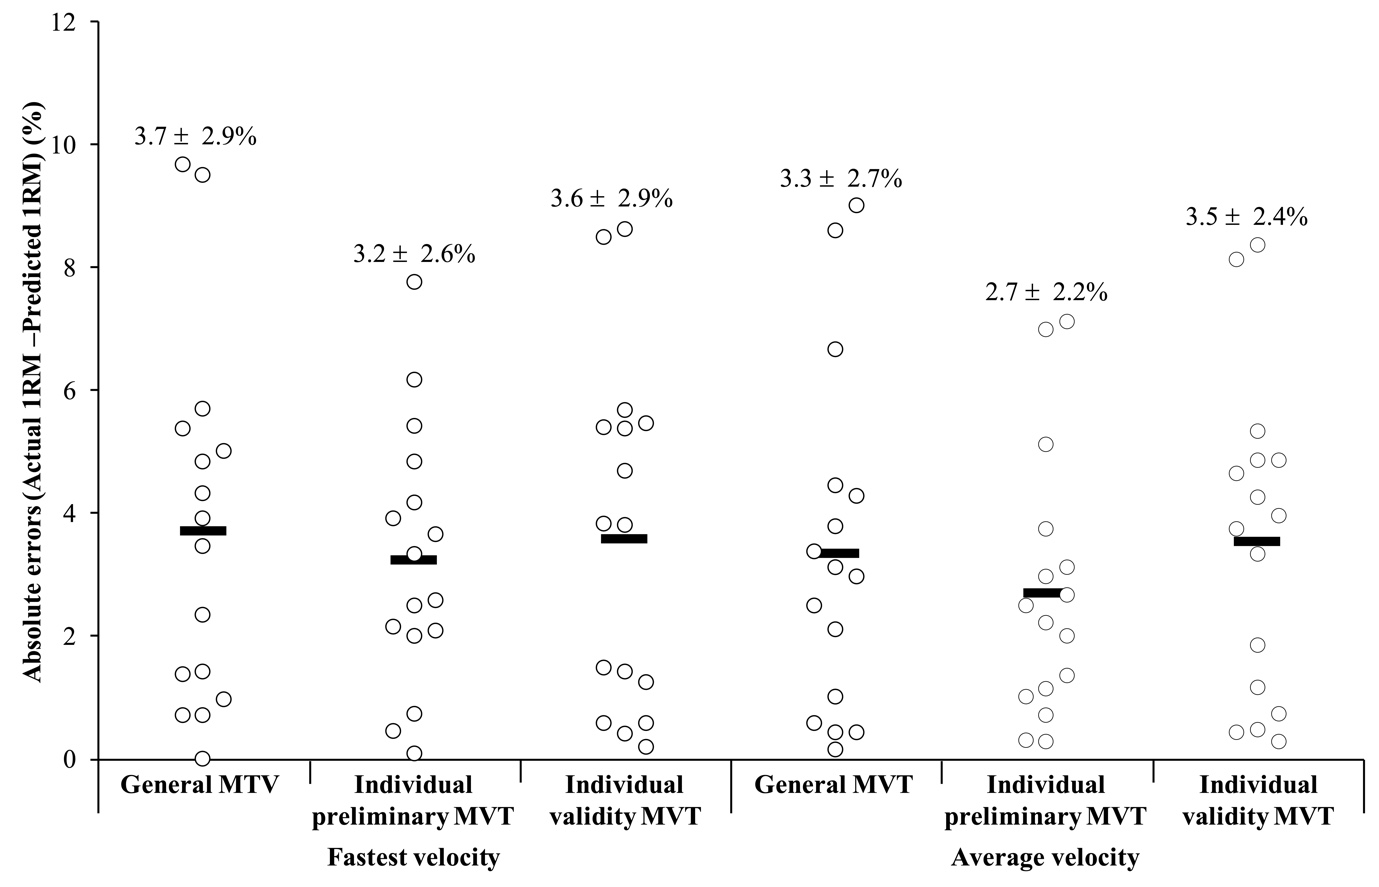
Absolute differences expressed as a percentage of the actual one-repetition maximum (1RM) for the six 1RM prediction methods based on 2 repetition criteria (fastest velocity or average velocity) and 3 MVTs (general MVT of 0.17 ms, individual MVT of the preliminary session, and individual MVT of the validity session). The black bar represents the median difference and the numbers the average difference standard deviation.
Data of five loads were used for modeling the individualized load-velocity relationships by linear regression models [15]. The absolute load (kg), relative load (%1RM), and MV associated with these loads are depicted in Table 1. Six 1RM prediction methods were analyzed based on 2 repetition criteria (fastest velocity and average velocity) and 3 MVTs (general MVT of 0.17 ms, individual MVT of the preliminary session, and individual MVT of the validity session). The fastest velocity of each load or the average velocity of the 2–3 repetitions performed at each load was used for subsequent analysis [21]. The 1RM was estimated from the individualized load-velocity relationships as the load (kg) associated with a general MVT of 0.17 ms (“general MVT”) [17], the individual MVT recorded in the preliminary session (“individual preliminary MVT”) [5, 24], and the individual MVT recorded in the validity session (“individual validity MVT”) [6, 9]. The individual preliminary MVT and individual validity MVT were 0.17 0.03 ms (range 0.10–0.22 ms) and 0.16 0.03 ms (range 0.05–0.19 ms), respectively.
Comparison between the actual one-repetition maximum (1RM) and 1RM estimated by different velocity-based prediction methods
Repetition criterion
MVT
Predicted 1RM (mean SD)
-value
ES (95% CI)
(95% CI)
Fastest velocity
General
73.2 20.9
0.994
0.00 (0.09, 0.09)
0.99 (0.96, 1.00)
Individual of the preliminary session
73.3 20.4
0.978
0.00 (0.07, 0.07)
0.99 (0.97, 1.00)
Individual of the validity session
73.6 20.5
0.674
0.02 (0.07, 0.10)
0.99 (0.96, 1.00)
Average velocity
General
73.4 20.6
0.894
0.01 (0.08, 0.09)
0.99 (0.96, 1.00)
Individual of the preliminary session
73.5 20.2
0.723
0.01 (0.06, 0.08)
0.99 (0.97, 1.00)
Individual of the validity session
73.7 20.2
0.556
0.02 (0.06, 0.11)
0.99 (0.96, 1.00)
SD, standard deviation; MVT, mean velocity threshold; ES, Cohen’s effect size ([Predicted 1RM – Actual 1RM/SD both]); , Pearson’s correlation coefficient; 95% CI, 95% confidence interval. The actual 1RM was 73.3 20.1 kg.
Statistical analyses
The normal distribution of the data was confirmed by the Shapiro-Wilk test ( 0.05). Paired-samples -tests were used to compare the 1RM and MVT between both testing sessions. Reliability of the 1RM and MVT was assessed by the coefficient of variation (CV) and the intraclass correlation coefficient (ICC; model 3.1). A two-factor repeated-measures analysis of variance (ANOVA) (repetition criterion [fastest velocity vs. average velocity] and MVT [general MVT vs. individual preliminary MVT vs. individual validity MVT]) with Bonferroni post hoc corrections were applied to the absolute differences between the actual and predicted 1RMs. Absolute differences were expressed as a percentage of the actual 1RM and the scale used to categorize the magnitude of the errors was: low ( 5.0%), moderate (5.0–10.0%), and high ( 10.0%). The validity of the 1RM prediction methods with respect to the actual 1RM was also examined through paired-sample -tests, the Cohen’s effect size (ES), the Pearson’s correlation coefficient () and Bland-Altman plots. The magnitude of the ES was interpreted as follows: trivial ( 0.20), small (0.20–0.59), moderate (0.60–1.19), large (1.20–2.00), and very large ( 2.00) [29]. The strength of the coefficients was interpreted as follows: trivial ( 0.10), small (0.10–0.29), moderate (0.30–0.49), high (0.50–0.69), very high (0.70–0.89), or practically perfect ( 0.90) [29]. Heteroscedasticity of error was defined as a coefficient of determination () 0.10 [30]. Alpha was set at 0.05. All reliability assessments were performed by means of a custom spreadsheet [31], while other statistical analyses were performed using the software package SPSS (IBM SPSS version 22.0, Chicago, IL).
Results
Trivial non-significant differences were observed for the 1RM ( 0.850; ES 0.01) and MVT ( 0.482; ES 0.27) between both testing sessions. The between-session reliability was high for the 1RM (CV 2.5%; ICC 0.99) and unacceptable for MVT (CV 19.2%; ICC 0.01).
The ANOVA did not reveal a significant main effect for repetition criterion ( 0.74; 0.402) or MVT ( 1.86; 0.173). Furthermore, the interaction repetition criterion MVT did not reach statistical significance ( 1.08; 0.354). The errors were categorized as low (range 2.7–3.7%) for all 1RM prediction methods (Fig. 1).
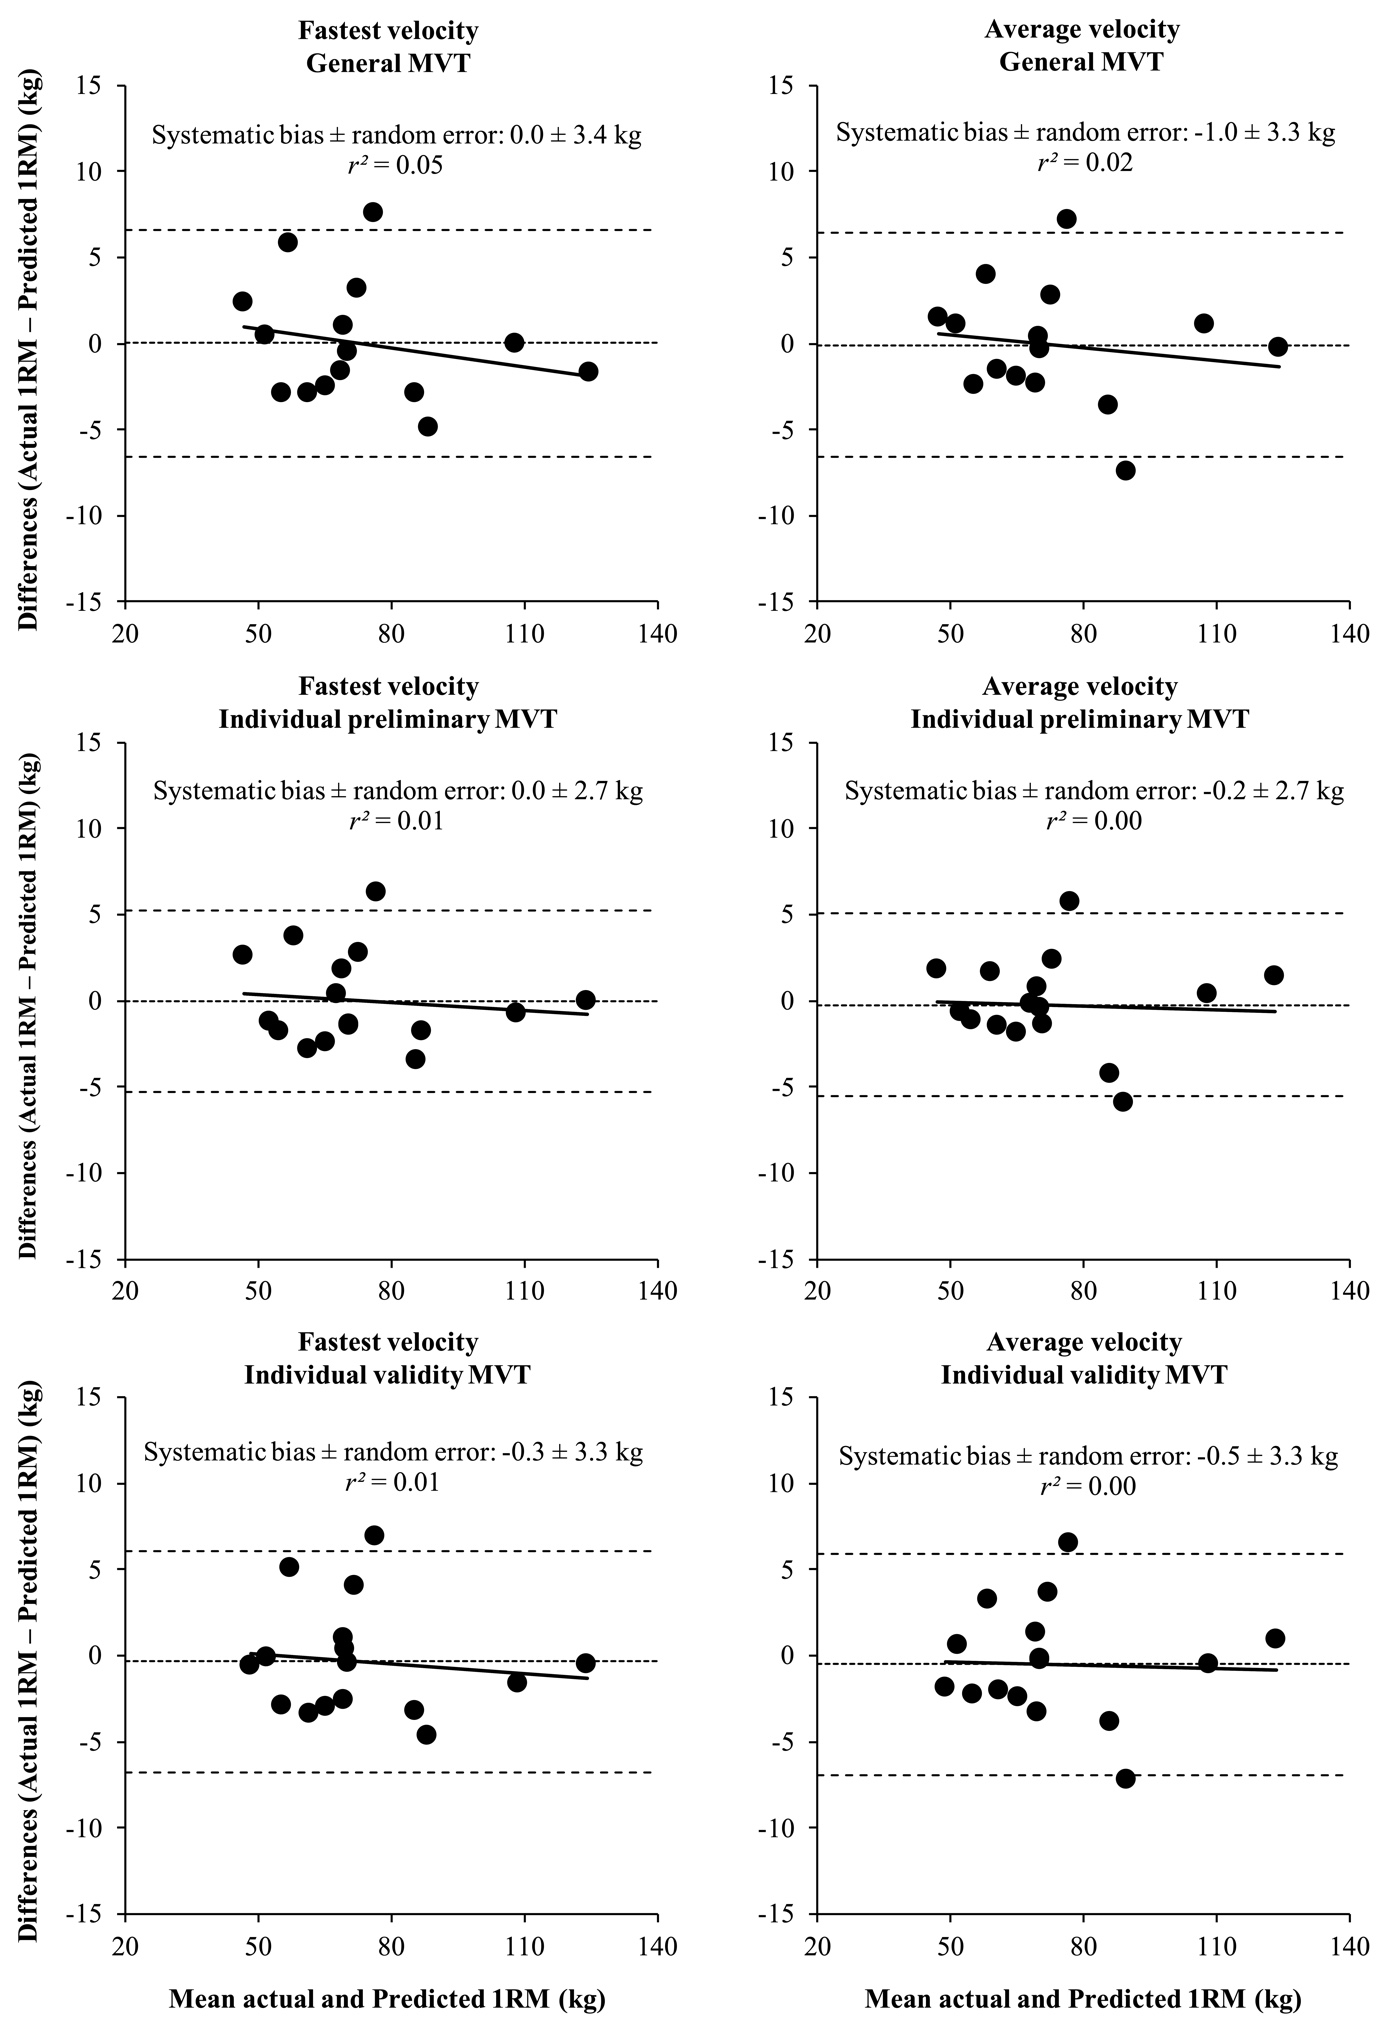
Trivial non-significant differences ( 0.556, ES 0.02) and practically perfect correlations ( 0.99) were observed between the actual and all predicted 1RMs (Table 2). Bland-Altman plots showed low and comparable systematic bias (range: 1.0 to 0.0 kg) and random errors (range: 2.7 to 3.4 kg) for all 1RM prediction methods (Fig. 2). No heteroscedasticity of the errors ( 0.05) were observed for any 1RM prediction method with respect to the actual 1RM.
Bland-Altman plots showing the differences between the actual one-repetition maximum (1RM) and the 1RM predicted by six 1RM prediction methods based on 2 repetition criteria (fastest velocity or average velocity) and 3 MVTs (general MVT of 0.17 ms, individual MVT of the preliminary session, and individual MVT of the validity session). Each plot depicts the systematic bias and 95% limits of agreement ( 1.96 standard deviation; dashed lines), along with the regression line (solid line). The strength of the relationship () is depicted in each plot.
Discussion
This study was designed to explore the influence of repetition criterion and MVT on the 1RM prediction capability of the individualized load-velocity relationship during the free-weight bench press exercise. The main finding of this study was that all prediction methods provided an accurate estimation of the bench press 1RM, being the accuracy comparable for the 2 repetition criteria (fastest velocity and average velocity) and 3 MVTs (general MVT of 0.17 ms, individual MVT of the preliminary session, and individual MVT of the validity session). Therefore, in principle practitioners are free to choose the different repetition criteria and MVT as the latter do not seem to affect the accuracy in the estimation of the free-weight bench press 1RM. However, a general MVT could be recommended to simplify the testing procedure because a direct 1RM assessment would not be required at any time.
There is compelling evidence that the individualized load-velocity relationship modelled using various submaximal loads (from 2 to 5) can provide an accurate estimation of the 1RM during the bench press exercise performed in a Smith machine [11, 32, 33]. For example, the individualized load-velocity relationship modelled considering only 2 loads has been shown to provide an accurate estimation of the 1RM during different variants of the bench press exercise regardless of the grip width with absolute errors lower than 5% [32]. By contrast, previous studies have warned about the lack of precision (absolute errors 5%) of the individualized load-velocity relationship to predict the 1RM during free-weight exercises such as back squat [6] or deadlift [9, 24], raising the question of whether its 1RM prediction capability is influenced by the execution mode (machine-guided vs. free-weight). This question has been recently addressed by Hughes and colleagues [34] who found an acceptable and comparable magnitude ( 0.05) and reliability (CV 2.6% and ICC 0.98) for predicted 1RM between Smith machine and free-weight variants of the bench press and prone row exercises. Instead, the 1RM predictions performed for back squat and overhead press exercises were more comparable ( 0.099–0.961 vs. 0.001–0.006) and reliable using a Smith machine (CV 2.6–3.8%; ICC 0.97–0.98) compared to free-weights (CV 3.9–7.7%; ICC 0.78–0.98). Those findings highlight that the accuracy of the predicted 1RM from the individualized load-velocity-relationship can be affected by the training equipment for some exercises but not for others. In line with the study of Hughes et al. [34], the results of this study also confirm that the free-weight bench press 1RM can be obtained with a high precision from the individualized load-velocity relationship. This is an important finding since most athletes commonly use the free-weight bench press exercise for training [35].
The load-velocity relationship has been indistinctly constructed using either the fastest or average velocity of the different repetitions (usually from 3 to 1) recorded against a range of loads [5, 22, 23, 25]. To our knowledge, this is the first study to examine whether the accuracy of individualized load-velocity relationship to predict the 1RM is affected by the repetition criteria. Our findings show that the accuracy of the predicted 1RM is not affected by the repetition criterion selected for the development of an individual’s load-velocity profile in the free-weight bench press exercise. It is important to note that the within-subject variability in the velocity recordings was low for the different loads included in the modeling (CV 4.3, 3.7, 4.9, 6.5 and 6.6% for 25, 40, 55, 70 and 85% of 1RM). These results are in line with those reported by Carroll and colleagues [23] in the back-squat exercise (CV 6.4, 8.6, 6.4 and 6.4% for 60, 70, 80 and 90% of 1RM). However, while the repetition criterion based on the average velocity provides a more robust measure, the repetition criterion established according to the fastest velocity may be related to an erroneous execution of the lift [21]. For example, in this study, the absolute differences between the measured and predicted 1RM for a representative participant were reduced by 3–5% using the average velocity compared to the fastest velocity due to the large amount of variation observed for the velocity measurements (CV range 2.5 to 13.7%). Therefore, caution should be taken when more than a 10% difference is observed between trials [7] particularly if the fastest velocity is used as repetition criterion to developed the load-velocity relationship of the individual. To solve this problem, an extra repetition should be performed and the most extreme value discarded from the analysis [7].
The 1RM is calculated from an individualized load-velocity profile regression equation as the load associated with an exercise-specific MVT [7, 17]. This MVT can be selected from a reference value for all individuals from the literature (“general MVT”) [8, 10, 11, 22] as well as from an actual (“individual validity MVT”) or previous (“individual preliminary MVT”) maximal lift for each participant [5, 6, 9, 24]. Our results indicate that these three MVTs approaches provides an accurate estimation of the 1RM during the free-weight bench press exercise (absolute and random errors 3.7% and 3.4 kg, respectively). These findings are in line with previous studies that have used a general MVT of 0.17 ms [11, 32, 33] or an individual preliminary MVT [34] to predict the bench press 1RM using different variants (concentric-only and eccentric-concentric) or execution modes (machine-guided and free-weight). An even more important and novel findings is that the accuracy in the estimation of the bench press 1RM did not improve when individual MVTs were considered instead of a general MVT. These results confirm the previous findings of Jukic and colleagues [9] who found that the accuracy of the 1RM was similar using either a general MVT (absolute errors from 7.3 to 15.4 kg) or an individual MVT recorded in the validity session (absolute errors from 6.6 to 16.3 kg) during the deadlift exercise performed with and without lifting straps. Furthermore, it is important to note that the MVT in this study demonstrated a poor consistency (CV 19.2%; ICC 0.01) and, therefore, it would not be appropriate to use the values obtained in a preliminary session to estimate the 1RM on subsequent occasions [5, 24]. Similarly, it would be illogical and impractical to use the MVT of the actual 1RM or MV of last repetition to failure to predict the 1RM within the same session [6, 9]. Collectively, these results suggest that practitioners can estimate the bench press 1RM using a general MVT. This will provide a simplified and less time-consuming assessment of bench press 1RM.
Finally, since the accuracy of the predicted 1RM could be affected by the sex (lower errors for women compared with men) [10] or resistance training experience (lower MVT for highly resistance-trained athletes than less-trained athletes) [36], the main limitation of our study is that the current findings are applicable to men with 1 year experience in resistance training (bench press 1RM 1.0 0.2 kgbody mass). However, the errors in the current study were homoscedastic (i.e., uniform errors) which indicates that those with lower or higher bench press 1RMs than our sample ( 72 kg) can still attain an accurate 1RM prediction from the individualized load-velocity relationship. On the other hand, it should be noted that a single linear velocity transducer was used to measure the velocity of barbell despite the fact that the velocity may be different on each side of the barbell [37]. This decision was made to increase the ecological validity of our findings because athletes rarely use two linear position transducers simultaneously.
Conclusions
This study confirms that the individualized load-velocity relationship is a highly valid approach for predicting the 1RM during the free-weight bench press exercise. Furthermore, our results demonstrate that the accuracy of the bench press 1RM prediction is not meaningfully affected by the repetition criteria or MVT. This indicates that the load-velocity relationship can be constructed using either the fastest or average velocity of the different repetitions recorded against a range of external loads. However, since the fastest velocity may be an outlier related to an erroneous lift [21], caution should be taken when more than a 10% in velocity is observed between trials [7], particularly if the fastest velocity is used as repetition criterion to develop the load-velocity relationship of the individual. However, it is also plausible that the outlier could be produced by a very slow velocity and in this case the precision could be compromised by using the average velocity of several trials. The accuracy in the estimation of the bench press 1RM did not improve when individual MVTs were considered instead of a general MVT. Practically, this is important because the general MVT can be recommended to simplify the testing procedure and avoid a maximal lift at any time point of the training cycle [8, 9].
Author contributions
CONCEPTION: Alejandro Pérez-Castilla, John F. T. Fernandes, and Amador García-Ramos.
PERFORMANCE OF WORK: Alejandro Pérez-Castilla.
INTERPRETATION OR ANALYSIS OF DATA: Alejandro Pérez-Castilla, John F. T. Fernandes and Amador García-Ramos.
PREPARATION OF THE MANUSCRIPT: Alejandro Pérez-Castilla.
REVISION FOR IMPORTANT INTELLECTUAL CONTENT: Alejandro Pérez-Castilla, John F. T. Fernandes, and Amador García-Ramos.
SUPERVISION: Amador García-Ramos.
Ethical considerations
All participants were informed of the procedures to be used and signed a written informed consent form before initiating the study. The study protocol adhered to the tenets of the Declaration of Helsinki and was approved by the Institutional Review Board of the University of Granada (IRB approval: 988/CEIH/2019).
Funding
This study was funded by the Centro Mixto Universidad de Granada – Mando de Adiestramiento y Doctrina (5/4/20 TR-COMBATE).
Footnotes
Acknowledgments
We would like to thank all participants that voluntary participated in this study.
Conflict of interest
Authors declare no conflict of interest.
References
1.
KraemerWJRatamessNA. Fundamentals of resistance training: progression and exercise prescription. Med Sci Sports Exerc.2004; 36(4): 674-688.
2.
BirdSPTarpenningKMMarinoFE. Designing resistance training programmes to enhance muscular fitness: a review of the acute programme variables. Sport Med.2005; 35(10): 841-851.
3.
NiewiadomskiWLaskowskaDGa̧siorowskaACybulskiGStraszALangfortJ. Determination and prediction of one repetition maximum (1RM): safety considerations. J Hum Kinet.2008; 19(1): 109-120.
4.
GrgicJLazinicaBSchoenfeldBJPedisicZ. Test-retest reliability of the one-repetition maximum (1RM) strength assessment: a systematic review. Sport Med – Open.2020; 6(1): 31.
5.
HughesLJBanyardHGDempseyARScottBR. Using a load-velocity relationship to predict one repetition maximum in free-weight exercise. J Strength Cond Res.2019; 33(9): 2409-2419.
6.
BanyardHGNosakaKHaffGG. Reliability and validity of the load-velocity relationship to predict the 1RM back squat. J Strength Cond Res.2017; 31(7): 1897-1904.
7.
Garcia-RamosAJaricS. Two-point method: a quick and fatigue-free procedure for assessment of muscle mechanical capacities and the one-repetition maximum. Strength Cond J.2018; 40(2): 54-66.
8.
Garcíc-RamosABarboza-GonzálezPUlloa-DíazD, et al. Reliability and validity of different methods of estimating the one-repetition maximum during the free-weight prone bench pull exercise. J Sports Sci.2019; 37(19): 2205-2212.
9.
JukicIGarcía-RamosAMalecekJOmcirkDTufanoJJ. Validity of Load-Velocity Relationship to Predict 1 Repetition Maximum During Deadlifts Performed With and Without Lifting Straps. J Strength Cond Res. 2020. Online ahead of print. doi: 10.1519/jsc.0000000000003596.
10.
Pérez-CastillaASuzovicDDomanovicA, et al. Validity of different velocity-based methods and repetitions-to-failure equations for predicting the one-repetition maximum during two upper-body pulling exercises. J Strength Cond Res. 2019. Onlinea ahead of print. doi: 10.1519/JSC.0000000000003076.
11.
Pérez-CastillaAPiepoliAGarrido-BlancaGDelgado-GarcíaGBalsalobre-FernándezCGarcía-RamosA. Precision of 7 commercially available devices for predicting bench-press 1-repetition maximum from the individual load–velocity relationship. Int J Sports Physiol Perform.2019; 14(10): 1442-1446.
12.
Courel-IbáñezJMartínez-CavaAMorán-NavarroR, et al. Reproducibility and repeatability of five different technologies for bar velocity measurement in resistance training. Ann Biomed Eng.2019; 47(7): 1523-1538.
13.
Pérez-CastillaAPiepoliADelgado-GarcíaGGarrido-BlancaGGarcía-RamosA. Reliability and concurrent validity of seven commercially available devices for the assessment of movement velocity at different intensities during the bench press. J Strength Cond Res.2019; 33(5): 1258-1265.
14.
FernandesJFTLambKLTwistC. The intra- and inter-day reproducibility of the FitroDyne as a measure of multi-jointed muscle function. Isokinet Exerc Sci.2016; 24(1): 39-49.
15.
Pestaña-MeleroFLHaffGGRojasFJPérez-CastillaAGarcía-RamosA. Reliability of the load-velocity relationship obtained through linear and polynomial regression models to predict the 1-repetition maximum load. J Appl Biomech.2018; 34(3): 184-190.
16.
Garcia-RamosAUlloa-DiazDBarboza-GonzalezP, et al. Assessment of the load-velocity profile in the free-weight prone bench pull exercise through different velocity variables and regression models. PLoS One.2019; 14(2): e0212085.
17.
WeakleyJMannBBanyardHMcLarenSScottTGarcia-RamosA. Velocity-based training: From theory to application. Strength Cond J. 2020. Online ahead of print. doi: 10.1519/SSC.0000000000000560.
18.
MooreJDorrellH. Guidelines and resources for prescribing load using velocity based training. Int Univ Strength Cond Assoc J.2020; 1(1).
19.
LakeJNaworynskyDDuncanFJacksonM. Comparison of different minimal velocity thresholds to establish deadlift one repetition maximum. Sports.2017; 5(3): 70.
20.
García-RamosAPestaña-MeleroFLPérez-CastillaARojasFJGregory HaffG. Mean velocity vs. mean propulsive velocity vs. peak velocity: which variable determines bench press relative load with higher reliability? J Strength Cond Res.2018; 32(5): 1273-1279.
21.
PicernoP. Good practice rules for the assessment of the force-velocity relationship in isoinertial resistance exercises. Asian J Sports Med.2017; 8(3): e15590.
22.
van den TillaarRBallN. Push-ups are able to predict the bench press 1-RM and constitute an alternative for measuring maximum upper body strength based on load-velocity relationships. J Hum Kinet.2020; 73(1): 7-18.
23.
CarrollKSatoKBazylerCTriplettNStoneM. Increases in variation of barbell kinematics are observed with increasing intensity in a graded back squat test. Sports.2017; 5(3): 51.
24.
RufLCheryCTaylorK-L. Validity and reliability of the load-velocity relationship to predict the one-repetition maximum in deadlift. J strength Cond Res.2018; 32(3): 681-689.
25.
García-RamosAPestaña-MeleroFLPérez-CastillaARojasFJHaffGG. Differences in the load-velocity profile between 4 bench press variants. Int J Sport Physiol Perform.2018; 13(3): 326-331.
26.
García-RamosAJanicijevicDGonzález-HernándezJMKeoghJWLWeakleyJ. Reliability of the velocity achieved during the last repetition of sets to failure and its association with the velocity of the 1-repetition maximum. PeerJ.2020; 8: e8760.
27.
Pérez-CastillaAJerez-MayorgaDMartínez-GarcíaDRodríguez-PereaÁChirosa-RíosLJGarcía-RamosA. Influence of grip width and anthropometric characteristics on the bench-press load-velocity relationship. Int J Sports Physiol Perform.2020; 15(7): 949-957.
28.
Pérez-CastillaAGarcía-RamosA. Changes in the load-velocity profile following power- and strength-oriented resistance training programs. Int J Sports Physiol Perform. 2020; 15(10): 1460-1466.
29.
HopkinsWGMarshallSWBatterhamAMHaninJ. Progressive statistics for studies in sports medicine and exercise science. Med Sci Sports Exerc.2009; 41(1): 3-13.
30.
AtkinsonGNevillAM. Statistical methods for assessing measurement error (reliability) in variables relevant to sports medicine. Sports Med.1998; 26(4): 217-238.
31.
HopkinsW. Calculations for reliability (Excel spreedsheet). A New View of Statistics. Available at: http://www.sportsci.org/resource/stats/relycalc.html#excel. Accessed December 7, 2020.
32.
García-RamosAHaffGPestana-MeleroF, et al. Feasibility of the two-point method for determining the one-repetition maximum in the bench press exercise. Int J Sports Physiol Perform.2018; 13(4): 474-481.
33.
Pérez-CastillaAJerez-MayorgaDMartínez-GarcíaDRodríguez-PereaÁChirosa-RíosLJGarcía-RamosA. Comparison of the bench press one-repetition maximum obtained by different procedures: direct assessment vs. lifts-to-failure equations vs. two-point method. Int J Sports Sci Coach.2020; 15(3): 337-346.
34.
HughesLJPeifferJJScottBR. Load-velocity relationship 1RM predictions: a comparison of Smith machine and free-weight exercise. J Sports Sci. 2020; 38(22): 2562-2568.
35.
McBurnieAJAllenKPGarryM, et al. The benefits and limitations of predicting one repetition maximum using the load-velocity relationship. Strength Cond J. 2019; 41(6): 28-40.
36.
HelmsERStoreyACrossMR, et al. RPE and velocity relationships for the back squat, bench press, and deadlift in powerlifters. J Strength Cond Res.2017; 31(2): 292-297.
37.
ApplebyBBBanyardHCormackSJNewtonRU. Validity and reliability of methods to determine barbell displacement in heavy back squats: Implications for velocity-based training. J Strength Cond Res.2020; 34(11): 3118-3123.