
Abstract
BACKGROUND:
Stages device is an affordable power meter used by several professional and competitive cyclists. However, few studies have investigated its validity and reliability.
OBJECTIVE:
The aim of this study was to analyze the validity and the reliability of the Stages mountain biking power meter.
METHODS:
Twenty-six cyclists (age: 35
RESULTS:
The power output of the Stages was significantly lower during each step of the incremental exercise test (11.8 to 16.4%) and performance testing (
CONCLUSIONS:
The interchangeable use of the power from the Velotron and Stages is not recommended due to the observed high within-subject variation.
Introduction
Cycling power output (PO) has traditionally been measured using cycle ergometers in laboratory conditions; however, with the development of several portable power meters, the PO can be measured during cycling training, races, and testing in the field [1, 2, 3, 4]. In this regard, cycling is a sport where PO can be measured on the road, on off-road terrain, track cycling and BMX via portable devices attached to the bicycle.
Olympic cross-country is a modality in mountain biking that depends on the capacity of the cyclist to produce high PO in a variety of up-hill climbs during races [3, 5]. The cyclists and their bicycles need to be light since the peak power output (PPO) relative to body mass was previously strongly correlated with cross-country mountain biking performance [6]. The majority of the portable power meters are heavy and add 300 to 500 g in added weight to the bicycle [7]. Stages device (Stages Cycling, Saddleback Ltd., UK) is a power meter that measures torque via strain gauges in a tiny box weighing the only 20 g that is attached to the left crank-set of the bicycle. This seems to be an interesting advantage compared to the other models designed for cross-country MTB races. The device is not complicated to use since it only needs a bicycle computer to pair with the power meter via ANT
A literature survey revealed one study case related to the comparisons between the Stages MTB (Shimano XT M8000) and the SRM portable power meter during mountain biking up-hill climbs [7]. This study indicated that both power meters provided a reliable means of recording mean PO and cadence though peak power values were less reliable. In addition, significant differences were found between the two systems for mean PO (
One of the most traditional tests to determine the PO of the physiological marker determinants of endurance performance is the graded exercise test (GXT) performed on cycle ergometers [9]. In addition, cycling endurance performance is frequently measured by a range of short, medium, and long time trials (TT) [10]. A number of cycle ergometers have been developed and assessed including the Velotron Dynafit Pro cycle ergometer (RacerMate Inc, WA, USA). The Velotron is a reliable and valid ergometer that was compared over a range of exercise intensities and durations with the calibration rig [11]. Therefore, the Velotron may be used as a valid criterion to evaluate PO during GXT and cycling performance during TT [11, 12, 13]. In this regard, the aim of this study was to analyze the validity of the Stages mountain biking power meter with a cycling GXT. In addition, the study aimed to verify the test-retest reliability and validity of the power meter during performance tests.
Methods
Participants
Twenty-six male mountain bikers (mean
Study design
The study was a repeated, measured, controlled trial where cyclists completed six testing sessions within a 4-week period. In the first session cyclists performed a GXT. The second session was used as a familiarization, and the athletes performed a 5-min TT followed by a 20-min TT separated by 20-min of rest. The following sessions were in a randomized order where participants performed a 5-min TT or a 20-min TT. All physiological and performance assessments were completed on a Velotron Dynafit Pro (RacerMate Inc, WA, USA) cycle ergometer calibrated in accordance with the manufacturer’s instructions. The Velotron ergometer has previously been shown to provide valid and reliable power measurements during steady state output in comparison to a gold standard calibration rig [11]. Prior to testing each participant was fitted to the ergometer in a position to replicate his own racing bicycle. The positions were recorded and repeated for the subsequent session. During each session, the Velotron was attached with the Stages mountain biking power meter paired (via ANT+ protocols) to a Garmin (Edge 520) cycle computer and recorded data at
Maximal incremental exercise test
Cyclists initially completed a 10-minute warm-up at a self-selected intensity. The Velotron ergometer was then set to the isokinetic mode for the test to ensure that power output remained constant regardless of any fluctuations in pedal cadence. Cyclists were requested to maintain a preferred cadence throughout the test. The test commenced at 100 W and was increased by 25 W every minute until volitional exhaustion. The PPO was determined as the last completed stage plus the fraction of time spent in the final non-completed stage multiplied by 25 W [15]. For the PO mean comparison between Velotron and Stages, the power output was selected from the beginning of the test up to a complete power of 300 W. Mean PO for each exercise step was downloaded from the Stages and used for subsequent data analysis.
Oxygen uptake (VO
Time-trials
The first TT session was used as familiarization and cyclists performed a 5-min TT and a 20-min TT, respectively, with a passive rest interval of 20-min between the trials. The following sessions were performed in a randomized order separated by at least 48 hours. The tests were using the same cycle ergometer that allowed the cyclists to manually shift the gears attached on the handlebar while pedaling. For each test, the Velotron was connected to a laptop computer interfaced with a projector that displayed the computer-generated image of the 3D course profile in front of the cyclist (Interactive 3D, RacerMate, Seattle, WA, USA). A flat terrain without wind was modeled through the proprietary software. During the TT, participants were able to view their progress over the course on a computer screen and were provided with information on elapsed time and gear selection, to avoid any pacing effects.
Statistical analysis
Simple descriptive statistics are shown as means
Mean power output, coefficient of variation, and intra-class coefficient of correlation from Stages and Velotron during the 5-min time trial
Mean power output, coefficient of variation, and intra-class coefficient of correlation from Stages and Velotron during the 5-min time trial
PO: power output; TT: time trial; CV: coefficient of variation; ICC: intra-class correlation coefficient. *: Significant different to Velotron (
Mean power output, coefficient of variation, and intra-class coefficient of correlation from Stages and Velotron during the 20-min time trial
PO: power output; TT: time trial; CV: coefficient of variation; ICC: intra-class correlation coefficient. *: Significant different to Velotron (
Stages and Velotron power distribution during time-trials.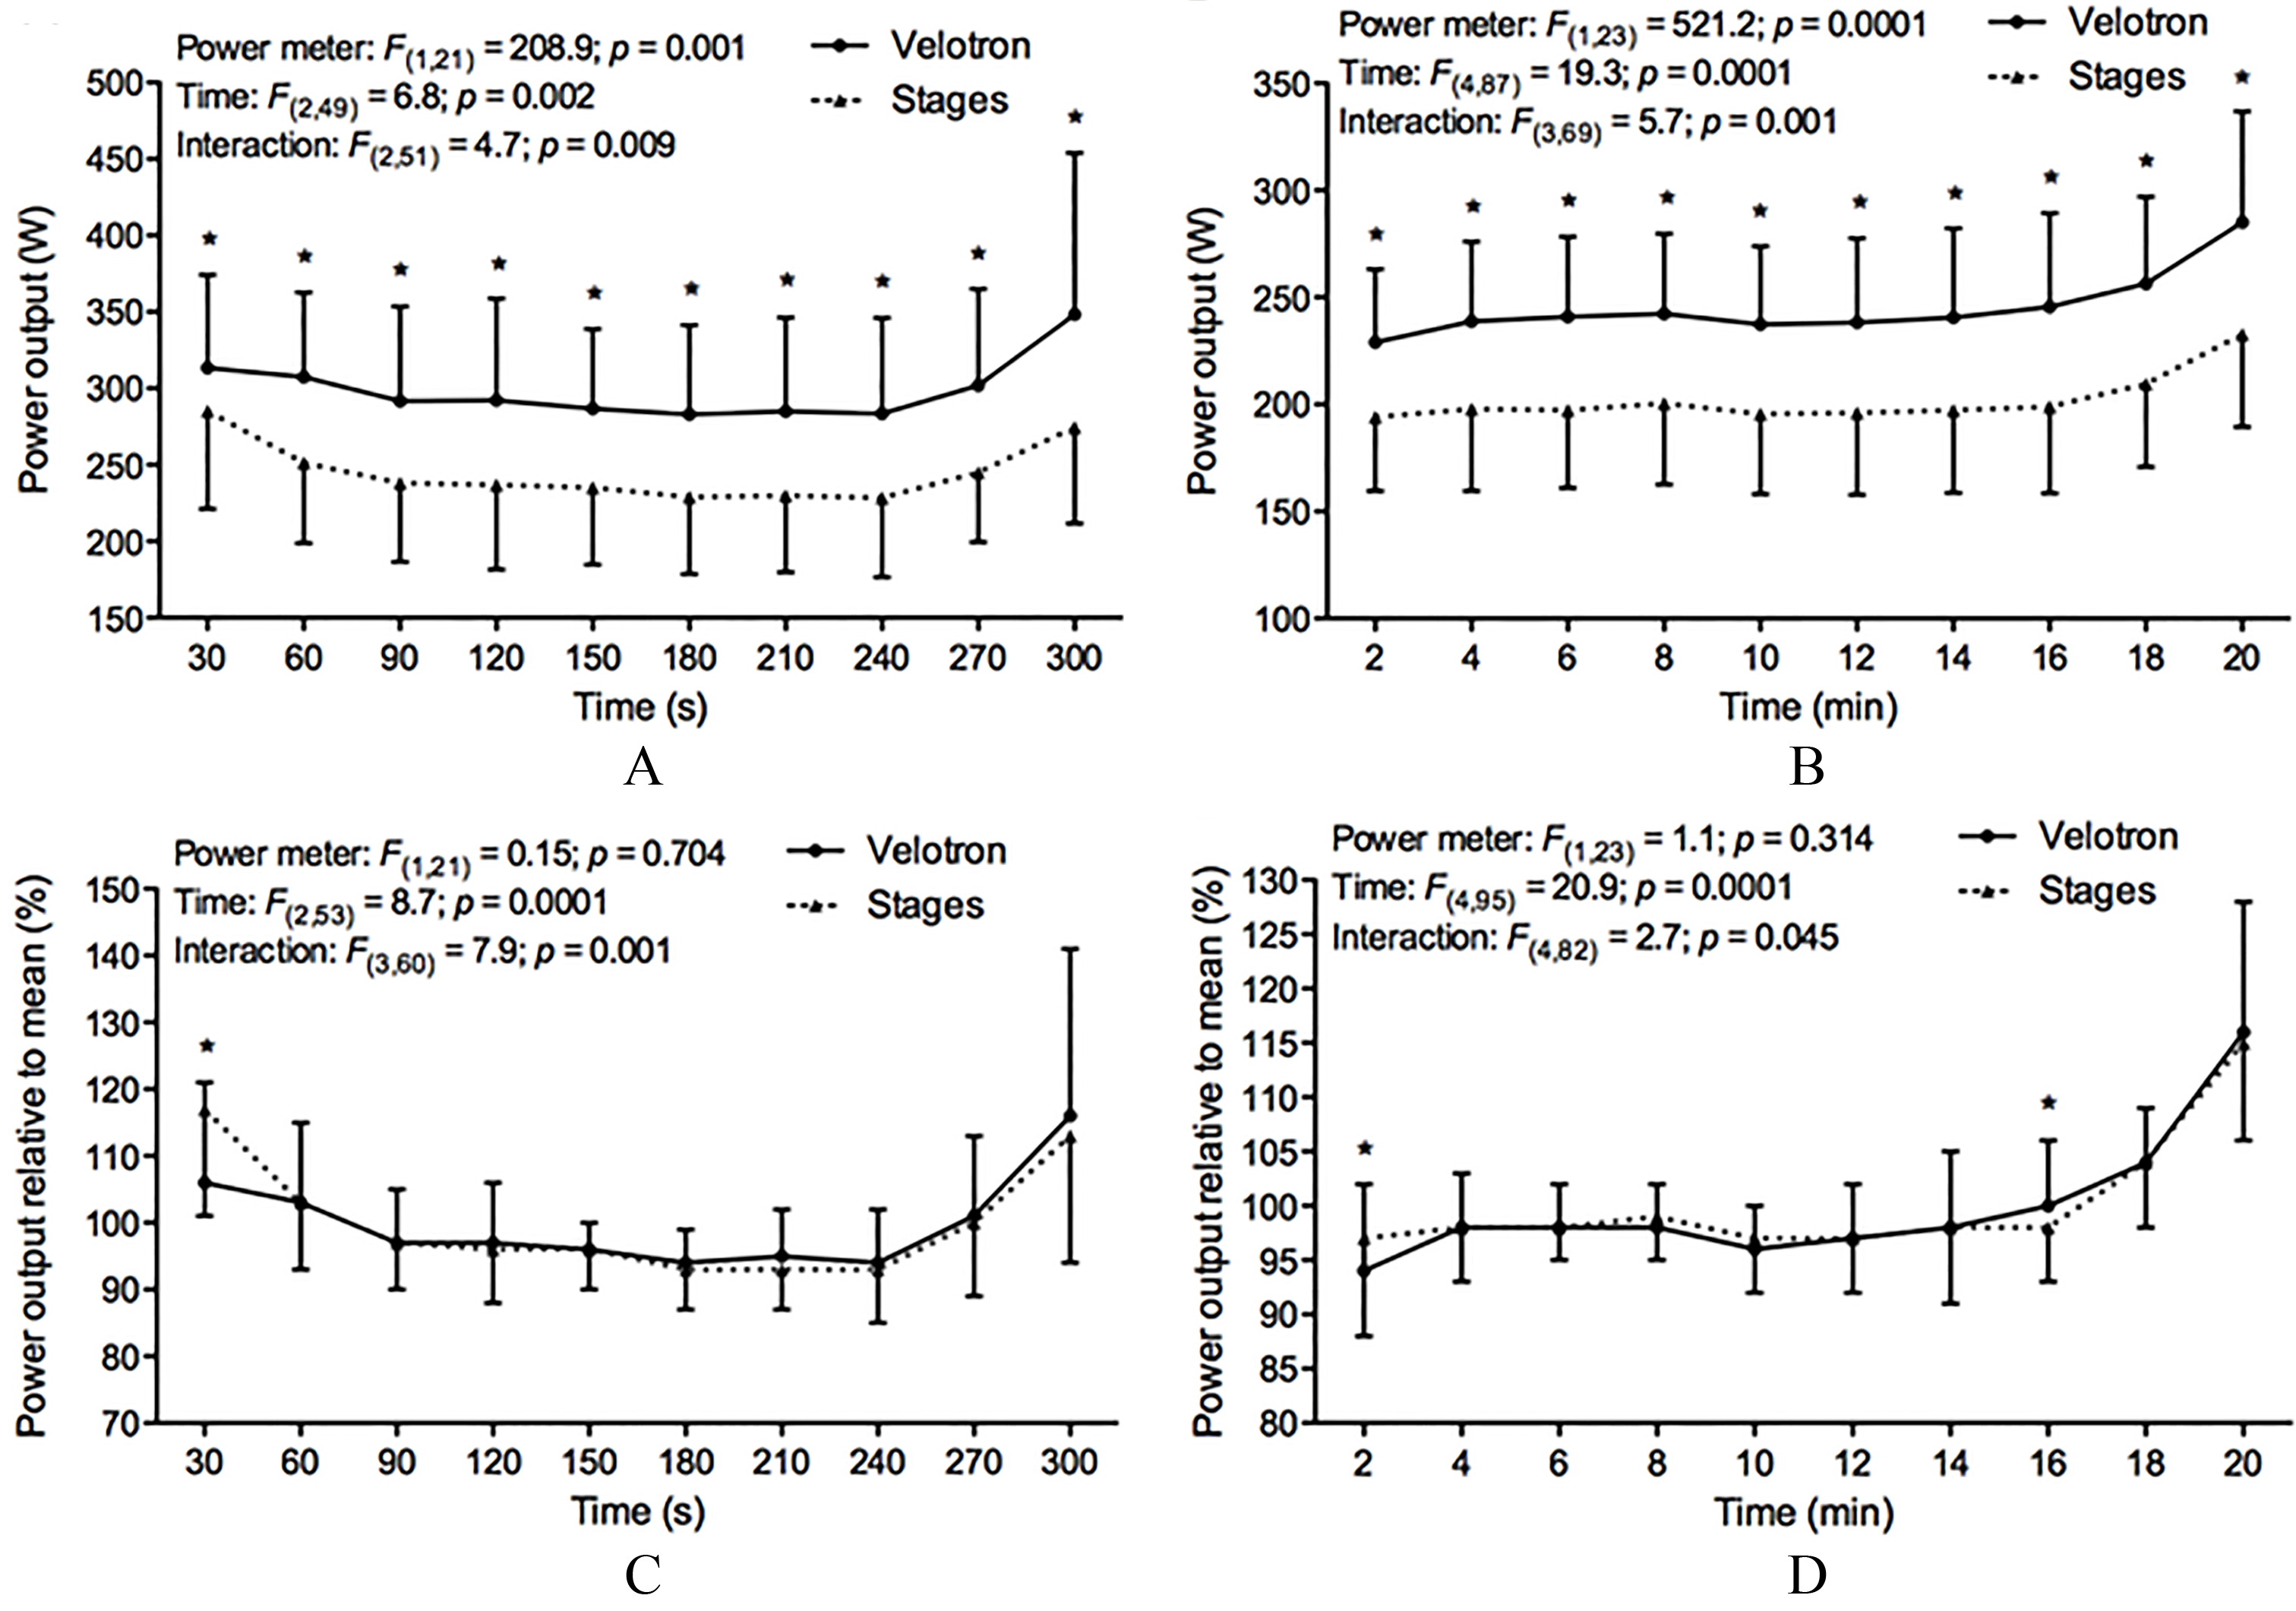
Bland-Altman plots of power output between Stages and Velotron.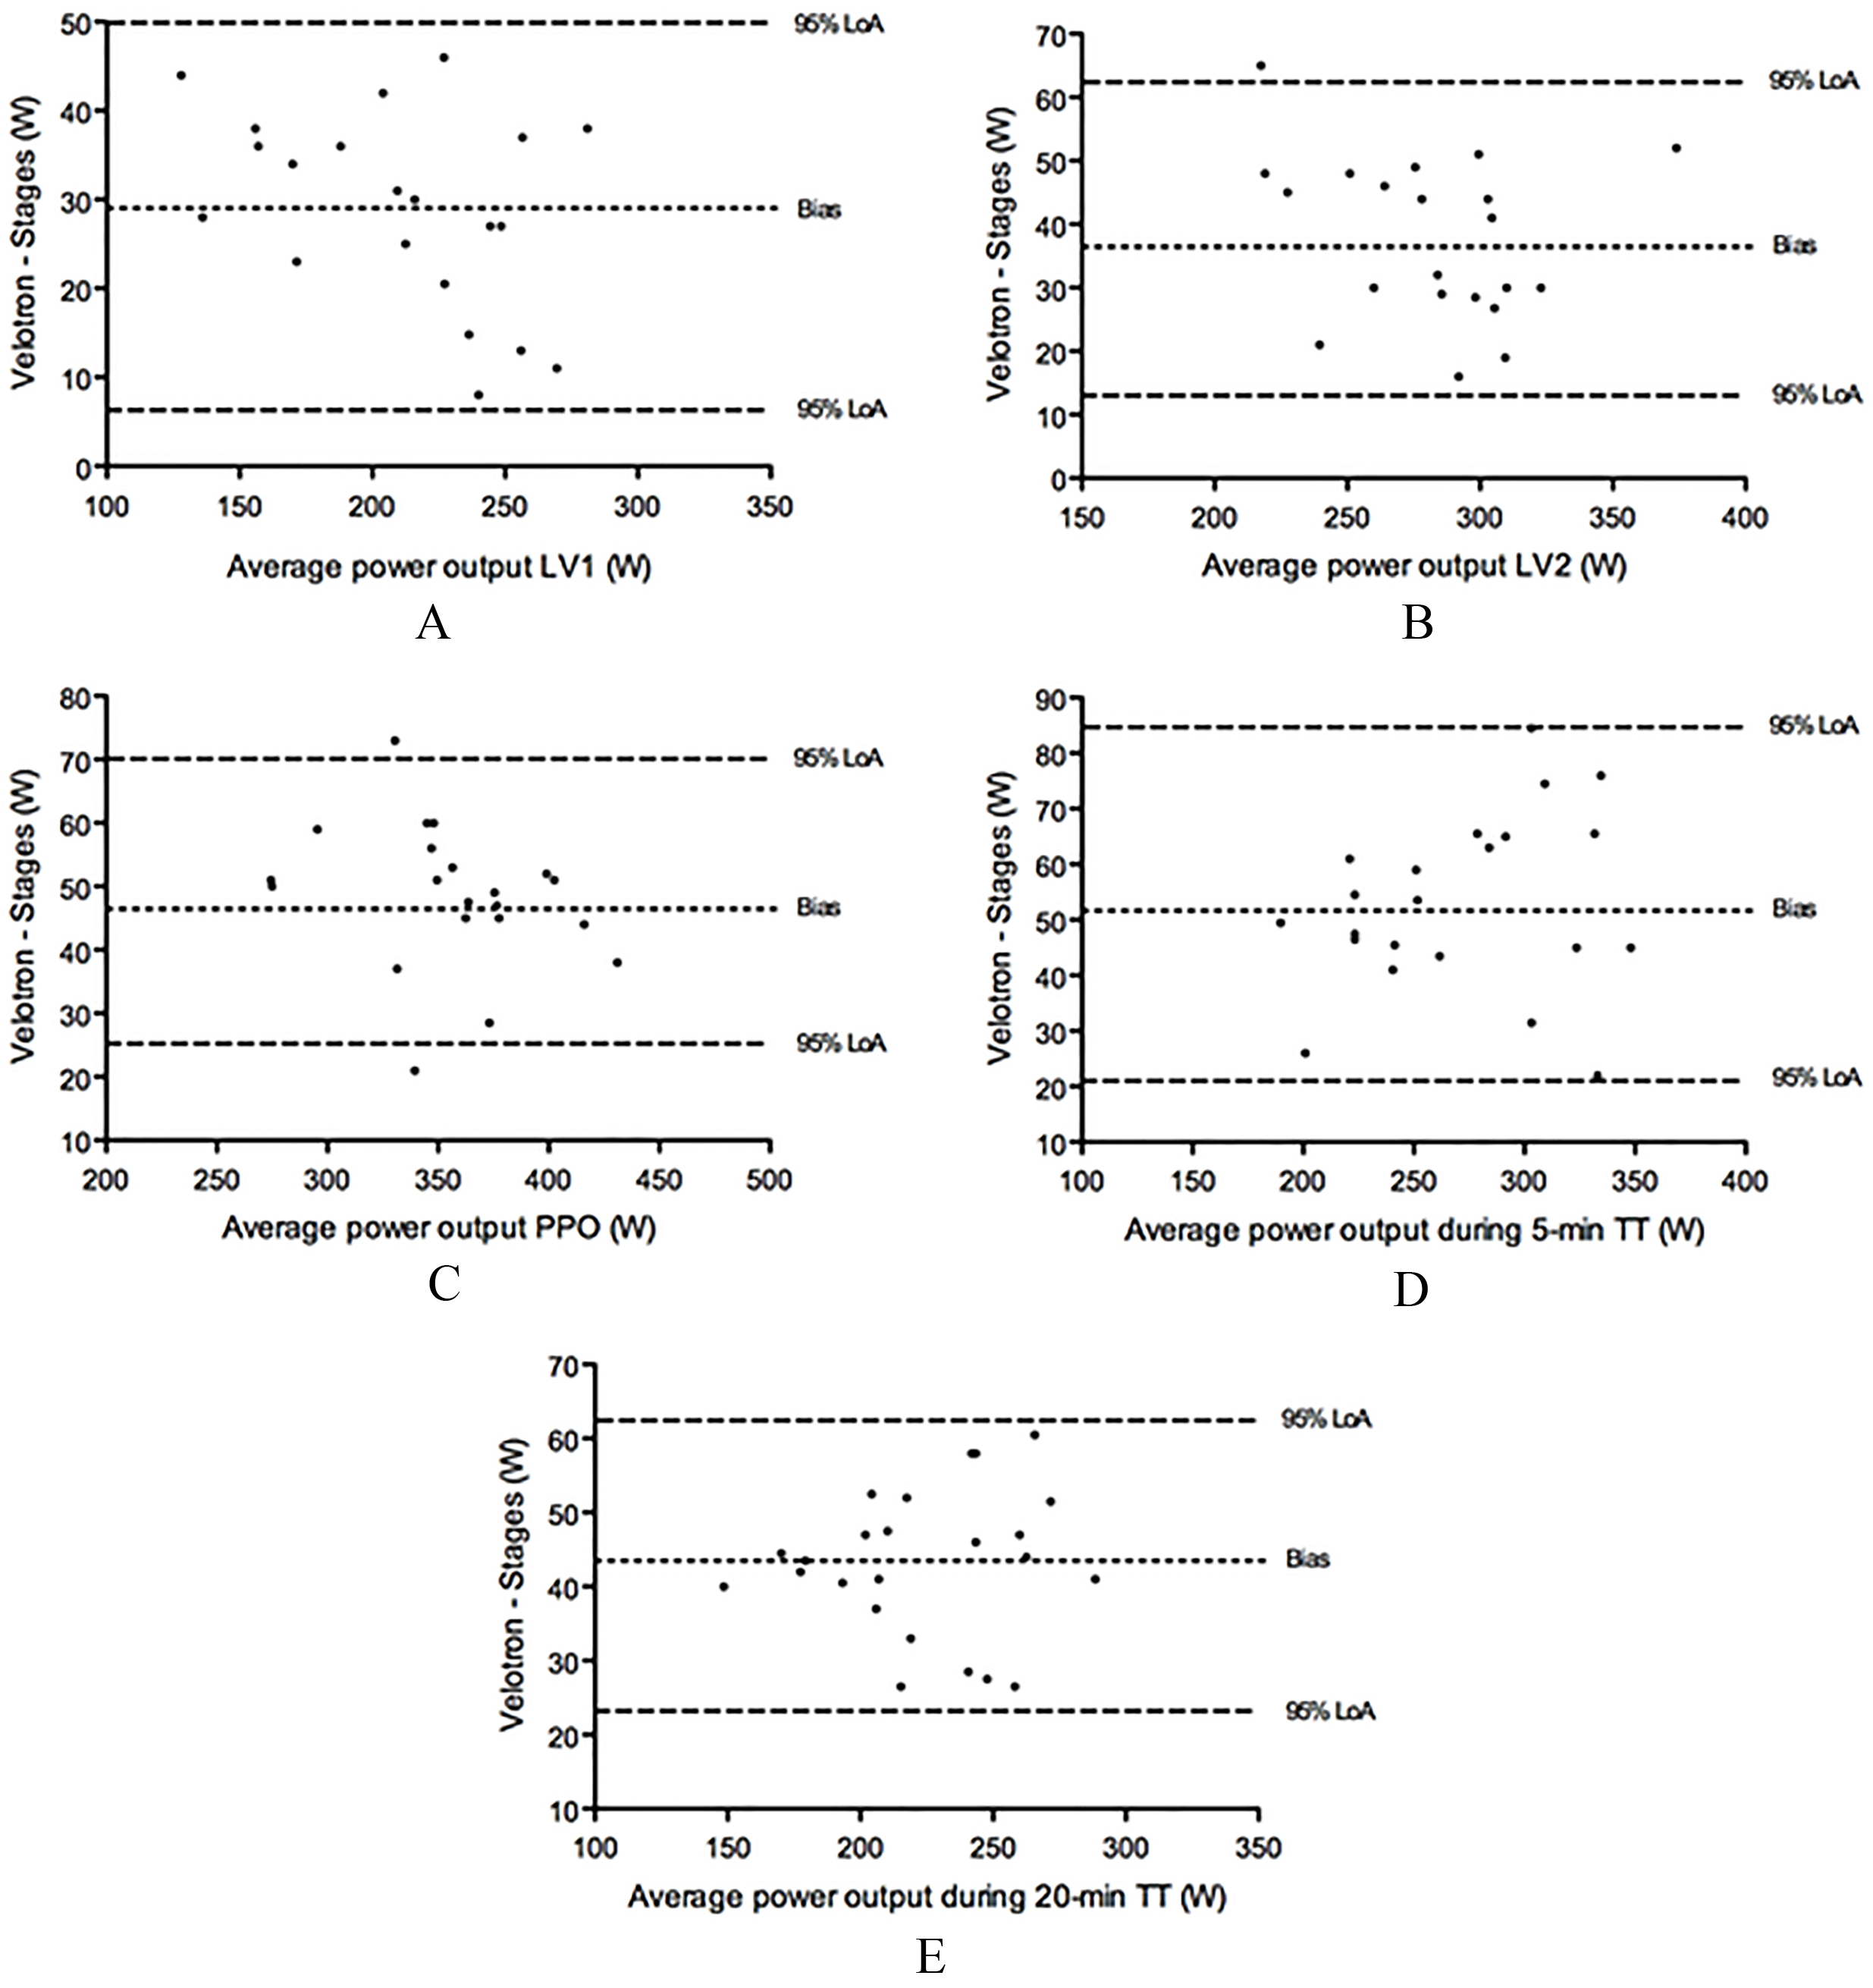
The Velotron and Stages mean
The mean values in each step of the GXP were significantly (
The absolute and normalized PO during each 30 s of the 5-min TT and each 2 min of the 20-min TT for the Velotron vs. Stages are shown in Fig. 1A–D. The PO in each step over the both TT was significantly (
Discussion
The main finding of this study was that the PO of the Stages MTB power meter was significantly lower during each step of the GXT (11.8 to 16.4%) and performance testing (
A previous study reported a CV of 5.5% for the mean PO of the Stages MTB power meter across three consecutive days on an off-road terrain for the same subject [7]. The high CVs found by Hurst et al. [7] was related to the MTB terrain where vibrations and changes in cycling position (i.e. seating vs. standing). In addition, the cumulative fatigue of the consecutive days could provide for a less reliable PO. Recently, Granier et al. [19] investigated the reliability of the Stages road cycling device in eleven males during GXT and sprint exercise. The authors found CV values of 3.8% and 4.2% for the GXT and the sprints, respectively. Similarly, the results of the present study showed high CV values of 6.2% and 4.1% for the 5-min TT and 20-min TT, respectively. The reasons for the high CV are unknown but certainly not related to the “off-road conditions” due to a more controlled environment in the laboratory. The high CV associated with the Stages might be related to the lower level of experience of the mountain bikers and consequently affects the mean PO and pacing strategy during the performance test. This is supported by the lower intensity sustained during the 5-min TT (
The Stages produced significantly lower power in all the subjects during each step of the GXT. The mean bias in PO over the 100–300 W range was substantially lower for the Stages, ranging from 16.4% to 11.8%. Despite the Stages differences with the cycle ergometer, it reported strong linear relationships with the Velotron PO (Fig. 2). Given the strong correlations and low standard error of estimate between the measured PO, a correction formula for each individual’s test data could be used interchangeably between the Stages and the Velotron. In addition, during the performance tests, the Stages device was around 18% lower than the Velotron. However, when the PO was normalized by the mean PO both devices presented similar percentage values. Therefore, the normalized PO displayed a pacing strategy of a “U” shape and reverse “J” shape [22] for the 5-min TT and 20-min TT, respectively.
The reason for the large bias range between Stages and Velotron is unknown, but it is presumably associated with the technology to measure the PO. While PO of the Velotron is calculated as a combination of the known resistance from eddy current braking, and any change in speed/inertia to the flywheel; Stages records power using a meter on the left crank arm that measures torque and cadence. The tiny box attached to the left crank contains strain gauges and an accelerometer. Once torque and cadence are collected they are multiplied together to determine the power of a single stroke. Therefore, PO is multiplied by two to provide the estimative for both legs. In fact, Stages power meter is limited by the measured torque and cadence in a single crank arm. This could enhance the errors of the PO for cyclists with larger asymmetries between the legs. Previous data reported that cyclists present an imbalance in bilateral force production from 5–20% [23]. Thus, although the leg asymmetries can indeed affect PO calculation using the Stages devices, a weak link was found between leg asymmetries pedal forces and 4-km TT and 40-km TT [24, 25].
Conclusions
The Stages MTB power meter (G1) is a simple to use lightweight device designed to monitor PO with cyclists. While the Stages may provide some estimation of PO it lacked validity compared to the Velotron cycle ergometer, and reported poor performance retest reproducibility (CV
Footnotes
Conflict of interest
The authors declare no conflict of interest.