
Abstract
In order to identify and locate flaws in solar thermal images, this research suggests using an optimization-tuned CNN classifier. The input thermal images are initially pre-processed to remove the noise present in them. After pre-processing, features like LBP, LDP, and LOOP are extracted. The collected features are then combined to produce a feature vector, which is the input to the proposed CNN classifier. Single hotspots, multiple hotspots, and string hotspots are the three types of faults that are supposed to be classified. After the classification process, the defects are located using the VGG-16 model. The weights of the CNN and VGG-16 models are modified using the proposed AqWH algorithm, which includes the distinctive characteristics of the wild horse and the Aquila search agents, to enhance classification and localization accuracy. The suggested possesses accuracy levels of 90% for classification and 96.11% for localization tasks, showing its superiority over conventional methods.
Introduction
Due to the technology advancements and the rising desire for a low-consumption economy, PV electricity production has taken a leading role in the generation of renewable energy. The only option to reduce the consumption and pollution of fossil fuels is RES. Because of this, PV power plants are among the most widely used techniques for creating renewable energy [1]. Unfortunately, as time goes on, numerous faults might occur in PV modules, which cause negative issues including low power efficiency. Typically, all of the PV cells in a series have identical electrical properties and run at MPP current to provide their maximum performance. The single string current, meanwhile, is unable to function at every cell’s MPP when there is a disparity in the electrical properties of the cells, which results in low efficiency [2]. The most frequent causes of this disparity include short-circuited bypass diodes, deterioration, partial shade, and others. Every time there is a single low current PV cell in a string of several high short-circuit current PV cells, the forward bias in each of these cells reverse biases the shaded cell, considerably increasing the cell temperature and resulting in hot spots [3]. It may result in cell damage and lower overall solar panel power production. For maintaining the best efficiency levels, frequent PV module examination is essential [4].
In addition to preventing energy waste, maintaining a plant’s proper operational state is also economically advantageous because deteriorating long-term performance and overall dependability of PV facilities can significantly lower anticipated profits [5, 6]. The increasingly huge PV plants are composed of many thousands of modules, and they are prone to the accompanying fault types: optical degeneration or failures, electrical abnormalities, and unclassified issues [1, 7]. Commercial monitoring techniques ensure that power dissipation in a particular region of the PV area will be identified, but accurate localization of defective modules requires the deconstruction of strings, visual checks, and/or electrical analysis. The PV modules’ reliability coefficient and long-term efficiency are solely dependent on problems that develop during normal operating conditions or transit and placement [8, 9]. The task of ensuring appropriate intervals and effective energy production of the PV modules, as well as a dependable operation of the PV plants, falls on the accurate and rapid identification of problems in the PV panels [10].
To find faults, O&M procedures are being used. O&M procedures take a lot of time, interrupt energy production, and frequently call for laboratory equipment, making them uneconomical for routine checks [11]. It should be emphasized that PV plants are frequently situated in difficult-to-reach locations, rendering any involvement risky. Using a thermal imaging camera to evaluate a PV system enables the detection of any module faults since areas with multiple colors correspond to various operational temperatures. Since IRT enables the collection of each array’s operating temperature, a key metric for performance assessment, it is crucial for the study of PV installations [1]. The electromagnetic spectrum includes infrared. Human vision cannot see its radiance, but one can feel it. Near-infrared, mid-infrared, and far-infrared are the three sub bands of the infrared spectrum. In essence, a thermal imager, often called a thermal camera, is a heat sensor. The amount of heat that a substance emits depends on its temperature. In practice, an entity produces higher radiation when it is hot. The system gathers infrared radiation from nearby objects and builds an electronic representation of the scene using data on temperature variations. A thermal camera can identify variations between items since they seldom have the same temperature as other entities, and each will show as unique in a thermal image [12, 13].
The eventual goal of the research is to use thermal imaging to identify and localize solar panel defects. To remove noise and improve contrast, the thermal images from the PV thermal image collection are first pre-processed using filtering and an adaptive histogram. Then, the pre-processed images are put through a process called feature extraction, where the important characteristics, such as LBP, LDP, and LOOP, are retrieved. The combined retrieved characteristics are then used to create a feature vector, which is the input for the Proposed CNN [14] classifier that classifies the thermal images. Using the suggested AqWh optimization process, the CNN classifier’s weights are optimized to their maximum potential [15]. The AOA’s Aquila search agents and the WHO’s Wild horse search agents were used in the development of the Proposed AqWh algorithm. The AqWh-adjusted CNN classifier is then used to discover and locate the faults after the classification procedure has been finished. Finally, the output shows the localized output.
The major contributions of this work are listed below:
To design and develop a unique fault classification and localization in Solar PV modules using thermal images via a novel hybrid optimization approach. To design and develop an efficient AqWh algorithm as a hybrid algorithm that inherits the characteristics and features of AOA and WHO algorithms. To verify the suggested approach’s performance in terms of accuracy and convergence rate, compare it to current techniques.
The paper is organized as: In Section 2, the challenges of traditional techniques are addressed. The suggested fault classification and localization system’s system model is described in Section 3, and the Proposed AqWh algorithm’s thorough explanation is shown in Section 4. The outcomes of the system that was implemented are explained in Section 5, and the paper’s conclusion is summarized in Section 6.
In this part, the techniques for defect localization and classification in solar PV modules are discussed, along with their benefits and drawbacks.
In 2021, Yonghe Su et al. [16] addressed the issue of PV module fault diagnosis with the hot zone in thermographic images. The conversion of many large-scale images is the first step in precisely locating objects with overheated portions. Regions of concern are then identified from these images to identify any probable overheating areas. The hot area type and location are finally identified from such areas using a deep joint learning strategy. Various types of research are run on the gathered database to assess the system. It demonstrates that the designed methodology performed better in terms of efficiency and effectiveness than the benchmarked alternatives.
The stability and effectiveness management of PV modules was covered by Kamran A. K. Niazi et al. in 2019 [17]. A machine learning model is used on thermal images of PV panels to identify, assess, and classify hotspots in a specific way. Thermal images of PV panels are classified to accomplish this using the texture and HOG features. By developing the machine learning model, or NB classifier, the categorized hotspots are found. As a consequence of the experiments, it was found that the approach successfully identified 375 samples with a mean identification score of about 94.1%.
In 2021, Venkatesh S. N. et al. demonstrated the usage of a deep CNN to extract visual input and conduct precise defect identification using ML approaches [18]. Contrary to recent research, they evaluated five different fault situations in their analysis. The system model is broken down into three parts to effectively investigate various PVM problems. The module was first photographed utilizing UAVs, and after that, a homogenous database was produced using data augmentation. The next step is to obtain image features using a pre-trained deep CNN. Using several ML classifiers, the obtained image features were successfully categorized. The final results show the value of deep CNNs that have already been trained as well as the precision of ML classifiers.
In 2020, A.H. Herraiz et al. [19] introduced a ground-breaking method for identifying solar panel faults using a thermographic camera built into an unmanned aerial vehicle. In this case, the panels are recognized to locate and identify hot spots. To create a reliable detection framework, two brand-new region-based CNNs are combined. To provide a solution for the panel status assessment, the thermography and telemetry records were integrated. The dynamically processed data from the acquisition enabled defect detection during the examination. To confirm the accuracy, reliability, and effectiveness of the methodology under various real-world conditions for achieving satisfying results, a thermographic examination of a genuine PV solar energy system was conducted.
SolAIr, an AI method based on DNN for anomalous cell identification in PV images captured from unmanned aerial aircraft outfitted with a thermal infrared sensor, was introduced by Roberto Pierdicca et al. in 2020 [1]. The Mask R-CNN architecture-based anomalous cells detection method is helpful for automatic inspection and testing since it simultaneously does object recognition and instance segmentation. The system makes use of solar thermal images, and the abilities of three traditional DNNs are assessed to demonstrate its efficiency and applicability in terms of IoU and the Dice coefficient.
Chris Henry et al. [4] suggested an autonomous drone-oriented model for PV power plant surveillance in 2020 that is outfitted with thermal imaging cameras. The drone equipped with both RGB and infrared cameras can quickly find and determine the precise position of defective PV panels. The algorithm for automated drone flight path planning does away with the need for manned drone control. In order to enhance performance, the model additionally uses an image processing algorithm. The outcomes of the experiments show how successful the approach works.
A method of image analysis that reliably locates the solar module producing the hot spots was introduced in 2020 by Heon Jeong et al. [20]. The MSER is utilized to extract feature points, and it determines the area of focus by employing the in-range operator in conjunction with the PV module’s blue colour. The system makes use of a homography translation methodology and an efficient feature point-matching method. To enhance performance, the temperature readings method and the normal/abnormal determination method are given. About 240 modules’ thermal image analysis was proven to be 97 percent compared with the visual assessment in the trial outcome.
Masoud Alajmi et al. [13] created an effective method in 2019 to locate and identify hot-spot defects using IR Thermal Energy Analysis. The PV array is captured in a series of thermal images using infrared light. The images were processed using a Computer program, which also identified if the hot-spot fault was transitory or permanent by spotting variations between images and localizing hot-spot faults. The system’s rapid and precise fault detection increases system efficiency and increases the lifespan of solar cells.
In 2022, Koloko et al. [21] introduced a novel technique for the detection and classification of the GPV with the Bald Eagle Search Optimization Technique along with the SVM algorithm. Herein, the normal as well as faulty are detected with the SVM and the classification (healthy, shaded, fault of series and parallel resistors) was also performed with the same SVM technique. Where the parameters of the SVM are optimized with the Bald Eagle Optimization Technique. At last, the model provides high classification accuracy and the diagnosis of the model is also robust.
Problem definition
Review of fault detection, classification, and localization of PV module
Review of fault detection, classification, and localization of PV module
Table 1 summarizes research on PV module fault localization, classification, and identification with solar thermal images. The hot spot in thermographic images can be found using a defect detection mechanism for PV modules that was described in [16]. In terms of systems performance, it performs better than benchmarked approaches. However, because all ROIs of each thermal image must be processed in two phases, executing these types of categorization and area localization operations in the conventional model requires a lot of computing time. In [17], the thermal image hotspot of a PV module was diagnosed using an NB classifier, which improves fault diagnosis by the automatic identification of non-uniformity in PV modules and its precise categorization. In [18], it was detailed on how to use deep CNN for fault identification and machine learning-based techniques for classification in PV modules. The system model has excellent feature extraction properties and can train quickly over big datasets with minimal training error. However, it is focused on locating and analyzing a small number of flaws. In [19], a thermographic camera integrated into an unmanned aerial vehicle was used to detect PV faults. The method has been validated and shown to be reliable. The outcomes demonstrate that the technique is suitable for automated localization and recognition. However, when processing time increases, the error decreases due to a bigger maximum number of epochs. An AI approach based on deep learning was developed [1]. The Mask R-CNN design is helpful for automatic quality control since it can partition occurrences and recognize objects at the same time. However, this method was only effective for locating a particular kind of fault. For tracking PV power plants, an autonomously drone-based approach is outfitted with thermal cameras as described in [4]. It independently finds and properly identifies defective modules. However, the technicians who operate the drones in these techniques must operate them remotely, which makes the process more labour-intensive. The MSER methodology was used to develop an image-processing technology that helps identify hot spots in solar modules [11]. However, the inability of the degrading image’s brightness intensity to correlate with the visible image’s level prevents the automatic generation of a correspondence moment due to illumination. In [13] an effective method for employing the IR Thermal Energy Approach to determine and fix hot-spot defects in PV modules was presented. It promptly and precisely diagnoses problems, boosting efficiency and extending the lifespan of solar cells. However, when it comes to specific items with unpredictable temperatures, the Images are challenging to understand.
From the aforementioned review and Table 1, it is observed that the detection and classification of fault in thermal images have a better performance such as high effectiveness, more accurate classification, less error etc. Still, the model suffers from certain issues like high computation, slower convergence, and high error at the time of training the classifiers.
Hence, this research work focuses on developing a new optimization AqWh model which is the hybridization of Standard Aquilla Optimization and Whild Horse Optimization Technique which overcomes the challenges of the standard deep learning concept at the time of training.
The importance of PV energy production in the generation of renewable energy has increased in response to the rising need for a low-consumption economy and recognition of advancements in technology. the only option to reduce the consumption and pollution of fossil fuels is the application of res. because of this, PV power stations are among the most widely used technologies for creating renewable energy. European nations have committed significant resources to promoting the use of clean energy. Maintaining a system’s vitality is essential; the only way to guarantee excellent performance over time is to identify solar panels’ deterioration. In addition to preventing energy losses, preserving a plant’s proper operating condition is also economically advantageous because deteriorating long-term productivity and the overall dependability of PV facilities can significantly lower anticipated profits. Millions of units make up the increasingly large PV plants, which are susceptible to many failure types such as optical deterioration or failures, electrical discrepancies, and unclassified faults.
The Proposed system of fault classification and localization.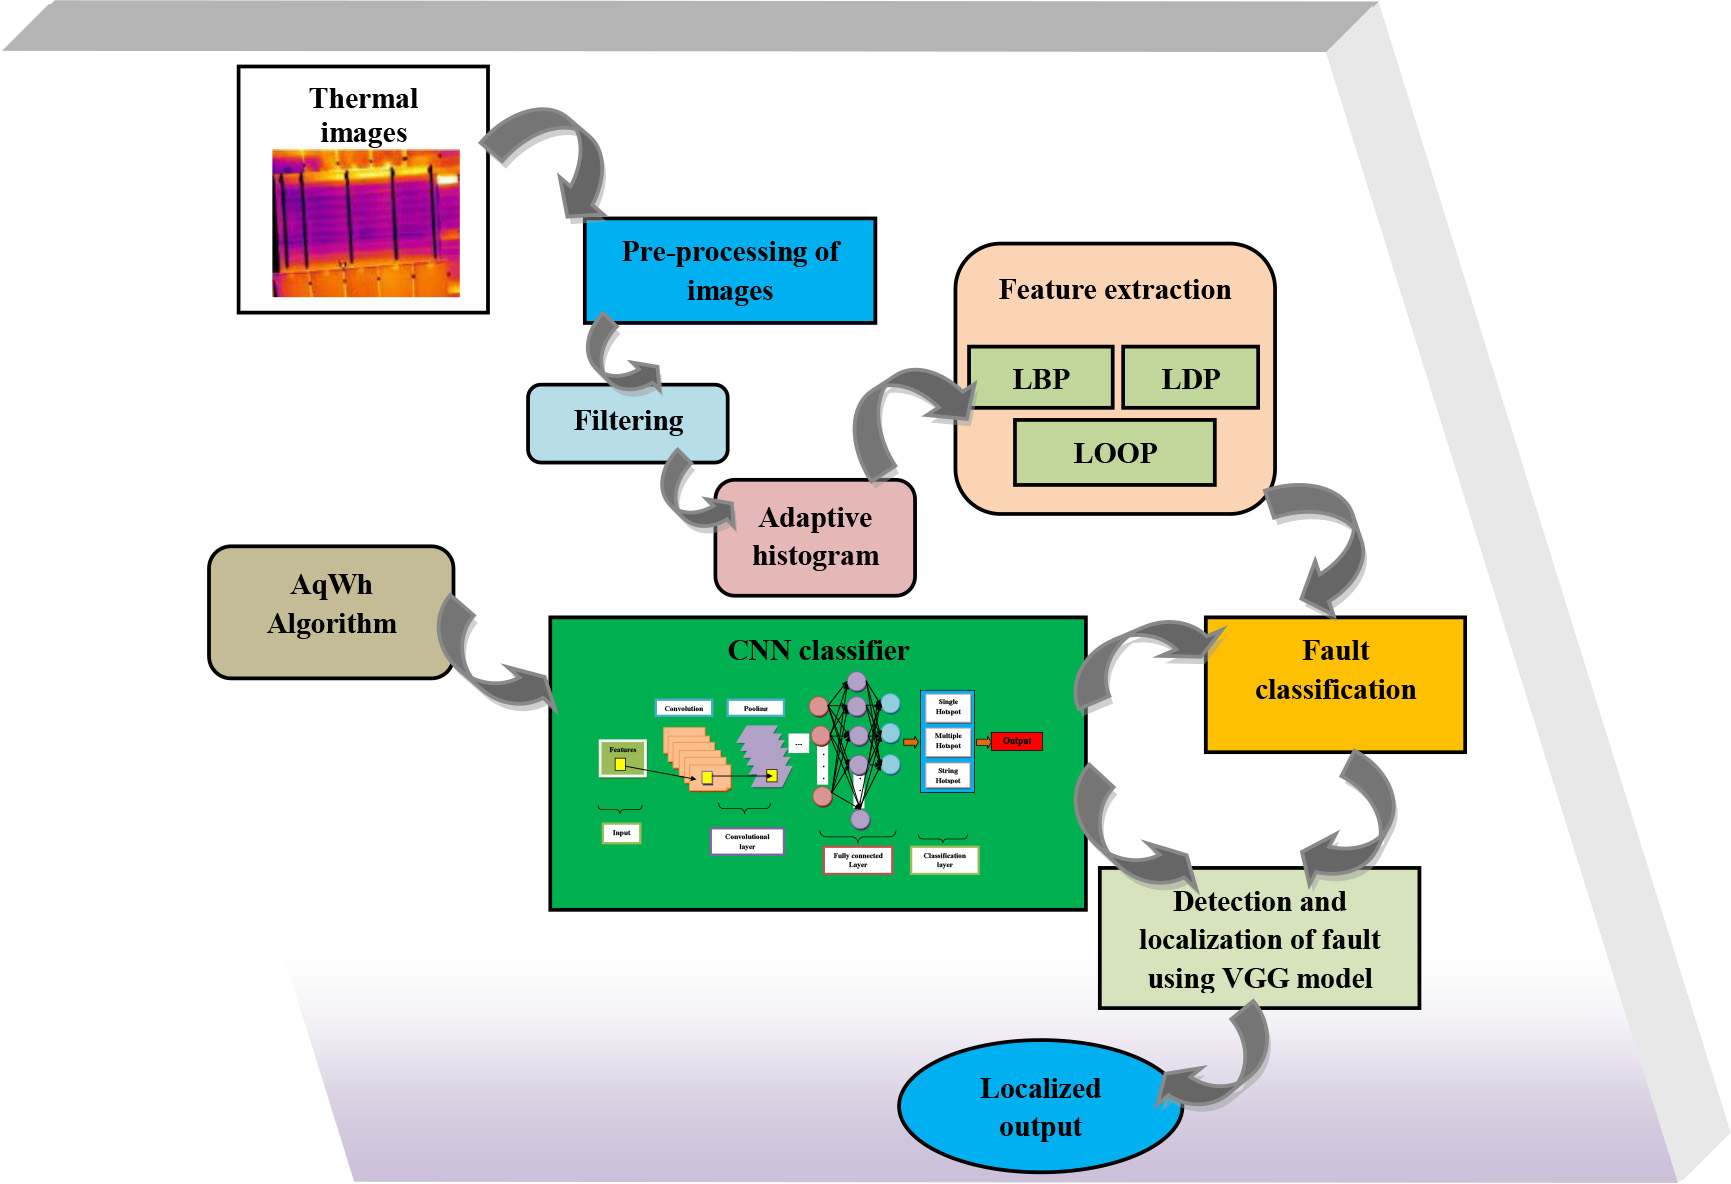
Rapid and accurate detection of PV module flaws is essential for guaranteeing the PV modules’ proper durability, effective power output, and reliable performance of the PV plants. In this study, a novel method of categorizing and locating problems in PV modules using thermal imaging is proposed. The characteristics of thermal images are crucial for increasing classification accuracy. The suggested method is used to tune the weights of the CNN classifier, which is used to carry out the classification and localization tasks. Figure 1 shows the Proposed fault categorization and localization model.
The random images selected from the solar thermal image dataset serve as the input images for research. Consider the mathematical formulation of the images considered from the input datasets:
where,
A useful method to identify the PV module’s degradation pattern is image processing. PV modules, also aid in identifying unhealthy and faulty cells. Additionally, the approach offers thorough details regarding the module’s status. To make diagnosis easier, the image’s resolution and colour must be improved. To lessen sharpening and eliminate noise from the image, a filter is applied. The employment of filtering techniques typically occurs before image processing. In this study, median filtering is employed to remove extraneous information and noise from the thermal image. While preserving the image’s crisp edges, median filtering is particularly successful in reducing impulse noise. However, flaws like hot spots and cracks can also impact the PV modules’ ability to maintain a consistent temperature. To improve the brightness of the thermal image, an adaptive histogram should be used for the filtered image. The image is initially divided by the adaptive histogram into a square sub-array. Then, to make the grey value in the high-temperature area tend to be uniform, the exceeding standard grey levels are allocated to each pixel. By just doing away with the assumption of a uniform transition, this method turns the area into a ladder shape, emphasizing the curves of the high-temperature areas. As a result, the improved image helps the Proposed system’s classification and localization accuracy.
Feature extraction
A crucial phase in the proposed fault classification and localization procedure is the feature extraction phase. To create the feature vector from a regular vector, the feature extraction approach is employed. The suggested classification and localization unit extracts features, which are unique findings, from the input thermal images. Selecting the most important features or data is required to carry out the categorization procedure. The LDP, LBP, and LOOP features are those that must be retrieved in the proposed system.
Local binary pattern
LBP [22] is a straightforward but efficient texture operator that identifies the image pixels by applying the threshold of each pixel’s neighborhood and producing a binary output. The LBP can distinguish between different visual components and record variations and patterns related to the image’s brightness. The mathematical representation of LBP’s score is,
where,
When compared to LBP, the LDP [22] is the robust feature that is typically employed to analyze the image and deliver improved outcomes. To preserve the texture of the image, the LDP assesses the edge response value with various orientations. It is clear that the edge solutions are less susceptible to noise and show the locals, comprising different kinds of bends, corners, and intersections. As a result, the gradient magnitude of the adjacent pixels returns the intensity values. LDP is used in the proposed research of fault classification and localization by examining its benefits. The LDP value of the image
Where,
LOOP [22] is stated as the non-linear joining together of both LBP and LDP to get around the problems with those methods. The LOOP concept is used to get around limitations like LBP’s incorrect binary data and LDP’s identity limitations. The LOOP measure of the image
The LDP parameter’s value cannot be determined empirically because the LOOP descriptor incorporates rotation invariance into the primary description.
To perform fault classification and localization in thermal images, the LDP, LBP, and LOOP features derived from the pre-processed thermal images are concatenated to generate a feature vector that serves as the input to the CNN classifier. The resulting feature vector is written as,
The feature vector’s size is [1009
Schematic diagram of CNN in fault classification.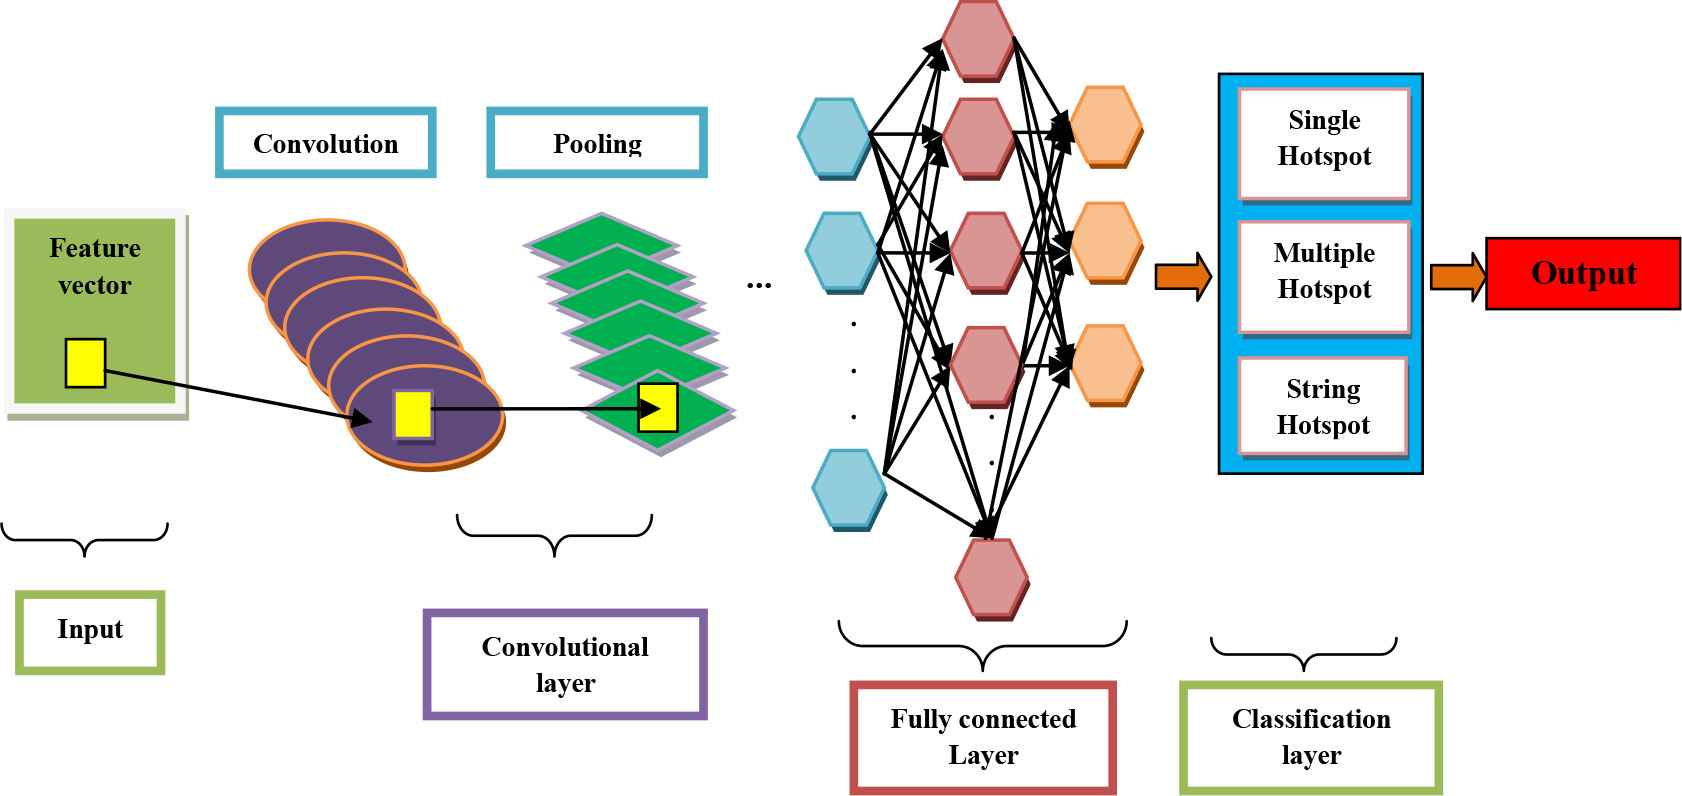
The general structure of the CNN network is as portrayed in Fig. 2. Initially, the features gathered from the thermal images are given to the CNN classifier which is followed by several operations of convolution and the pooling blocks. Then, the indications generated with these layers work as the input to the FC layers, which can be one or more. The grouping of the class is done by the fully connected layer as three classes of faults, such as single hotspots, multiple hotspots, and string hotspots. In addition, the localization of the faults after the classification process is also attained using the CNN classifier.
Input layer: The characteristics extracted from the thermal images framed
Convolutional layers: The input features are used to create the feature maps, which are then assembled from the separate convolution layers to improve the effectiveness and accuracy of the classification process. Convolutional filters are also used to aid in the development of feature maps. Similar to this, customizable weights are used to link the neurons of the layers to one another [23]. Consequently, the convolutional layers’ output is expressed as,
where, * stands for the convolutional operator, and
Batch Normalization Layer: This layer is present in between the ReLU and conv layer to improve the suggested classification model’s training quality.
ReLU Layer: The non-parametric ReLU layer, which does not inherit any bias or weight components, is used to transmit the maps of succeeding convolutional layers.
Max Pooling Layer: To minimize spatial size and data, the Max pooling layer down samples the feature maps made with the conv layers [24].
FC layers: The FC layer receives the feature maps from the convolutional layer, and there, the concluding administration is carried out to provide the outcome as,
The weights of CNN are obtained using the Proposed AqWh algorithm optimally to make an effective classification.
Softmax Layer: The activation function of the softmax layer is used to generalize the fully connected layer’s output to carry out increased analysis in the classification stage [23].
Classification Layer: The last layer of CNN is the classification layer that makes use of the possibilities generated from the softmax activation role to the entire inputs in such a way as to classify the input to the system. The type of fault is classified using the CNN classifier as a single hotspot, multiple hotspots, and string hotspot, and based on the classification outcome, the localization of the fault is done using the same AqWh-based CNN classifier.
After the completion of the fault classification process, the CNN is involved in the localization of the faults in thermal images. The VGG-16 architecture of the CNN model is thus used for the same. The 12 convolutional layers in the VGG-16 architecture are followed by a Softmax layer, a fully connected layer, and an average pooling layer [25]. The VGG is a more effective model than AlexNet because it uses a stack of convolutional layers with a 3
Proposed aquila wild horse optimization algorithm
Over the past ten years, optimization algorithms have gained enormous popularity. These algorithms are more common than traditional optimization techniques because of their flexibility, adaptability, non-inference method, and avoidance of locally optimal solutions. The CNN classifier’s weights are adjusted using the Proposed AqWh technique to optimize the Proposed model’s classification and localization performance [27]. The Proposed AqWh algorithm inherits the characteristics and features of natural creatures, such as Aquila and wild horses. In other words, the moral behavior of the wild horses and the hunting characteristics of the Aquila are inherited together to frame a novel strategy termed the AqWh optimization algorithm.
Wild horse optimization algorithm
Horses can often be split into two sorts, like territorial and non-territorial, based on their social structure. They coexist in herds of various age groups, including young, stallions, and mares. Mares and stallions share a living area and graze together. When foals mature, they leave their original herds and ally with others to raise their own families [28]. This behavior prevents stallions and siblings from mating. The WHO algorithm takes the social characteristics of horses as its model. The WHO approach consists of the following five distinct phases, which are stated below:
Step 1: Population initialization: The numbers of wild horses are initialized in the first stage. Each wild horse has a position vector that shows its whereabouts right now as,
where,
The above formula, which assesses the survival of the fittest based on the fitness value, stores the equivalent fitness (objective) measure of each wild horse. There are as many groups as members
The remaining members of the group
Step 2: Grazing Techniques: As was said earlier, a foal spends most of its life grazing close to its herd. The stallion location was thought to be in the middle of the grazing field to reflect the grazing phase. To make it possible for others to move, use the formula below.
where,
where,
where, iter and
Step 3: Horse Mating Styles: As was already noted, separating the young from their mother’s herds before adulthood and reproduction is one of the distinguishing traits of horses when related to other creatures. To replicate the way that horses mate, the formula shown below is used:
where
Step 4: Team Leadership: Stallions will direct the rest of the gang to a suitable place while serving as the group’s leaders (waterhole). Since the waterhole will be contested by the leaders (stallions), the dominant group will use it first [29]. Utilize the following formula to emulate this behavior:
where
Step 5: Transformation and the Choice of Leaders: At first, leaders are selected at random. The selection of leaders is then made by their fitness-related values. To simulate interactions between leaders and followers, use the formula below:
where,
The algorithm’s design will be based on the Aquila hunters’ to-and-from hunting behaviours as well as their traversing velocity characteristics [30]. The Aquila hunters are regarded as the most studied species in the world because of their courage in the field. When compared to female Aquila hunters, male Aquila is proven to be effective at hunting prey [31]. The Aquila hunters use one of four different sorts of hunting techniques, switching between them fast and deftly depending on the situation and the necessity to capture the game. The following list of the hunting techniques used by Aquila hunters is provided as follows:
Method 1: In the first technique, the Aquila hunters ascend from the ground to a very high elevation to catch the birds in flight. Method 2: In the second technique, the Aquila hunters barely raise their heads slightly above the ground to capture their prey; this technique is known as a “short sliding attack”. Method 3: This technique, in which the Aquila hunters are low to the ground, is mostly utilized to pursue slow-moving prey. It is known as a slow decent attack. Method 4: In this technique, the Aquila hunters draw the prey from the coverage area as they walk and attack.
The Aquila hunters, therefore, alternate between hunting techniques to capture their prey depending on where the prey is located. As a result, hunters from the Aquila species are regarded as the most knowledgeable and skilled. The algorithm’s steps, which were designed depending on the traits of Aquila search agents, are as follows:
Step 1: Position modification using technique 1: The first exploration process, also known as method 1 of predation, is used to calculate the position update equation. It is expressed as follows:
where,
Step 2: Position modification using technique 2: The second exploration procedure is also known as technique 2 of hunting, and it depends on the features of Aquila hunters. The position update equation is provided as,
where,
Step 3: Position modification using technique 3: According to the traits of the Aquila hunters using technique 3 of hunting, also known as the first exploitation phase, the position update equation is constructed as follows:
where,
Pseudocode of proposed AqWh method
Step 4: Position modification using technique 4: The second exploitation method, also referred to as hunting strategy 4, is based on the characteristics of Aquila hunters [32]. The following is the construction of the position update equation:
Also,
where,
Comparative analysis based on positive metrics, (a) Accuracy, (b) Sensitivity, (c) Specificity, and (d) Precision.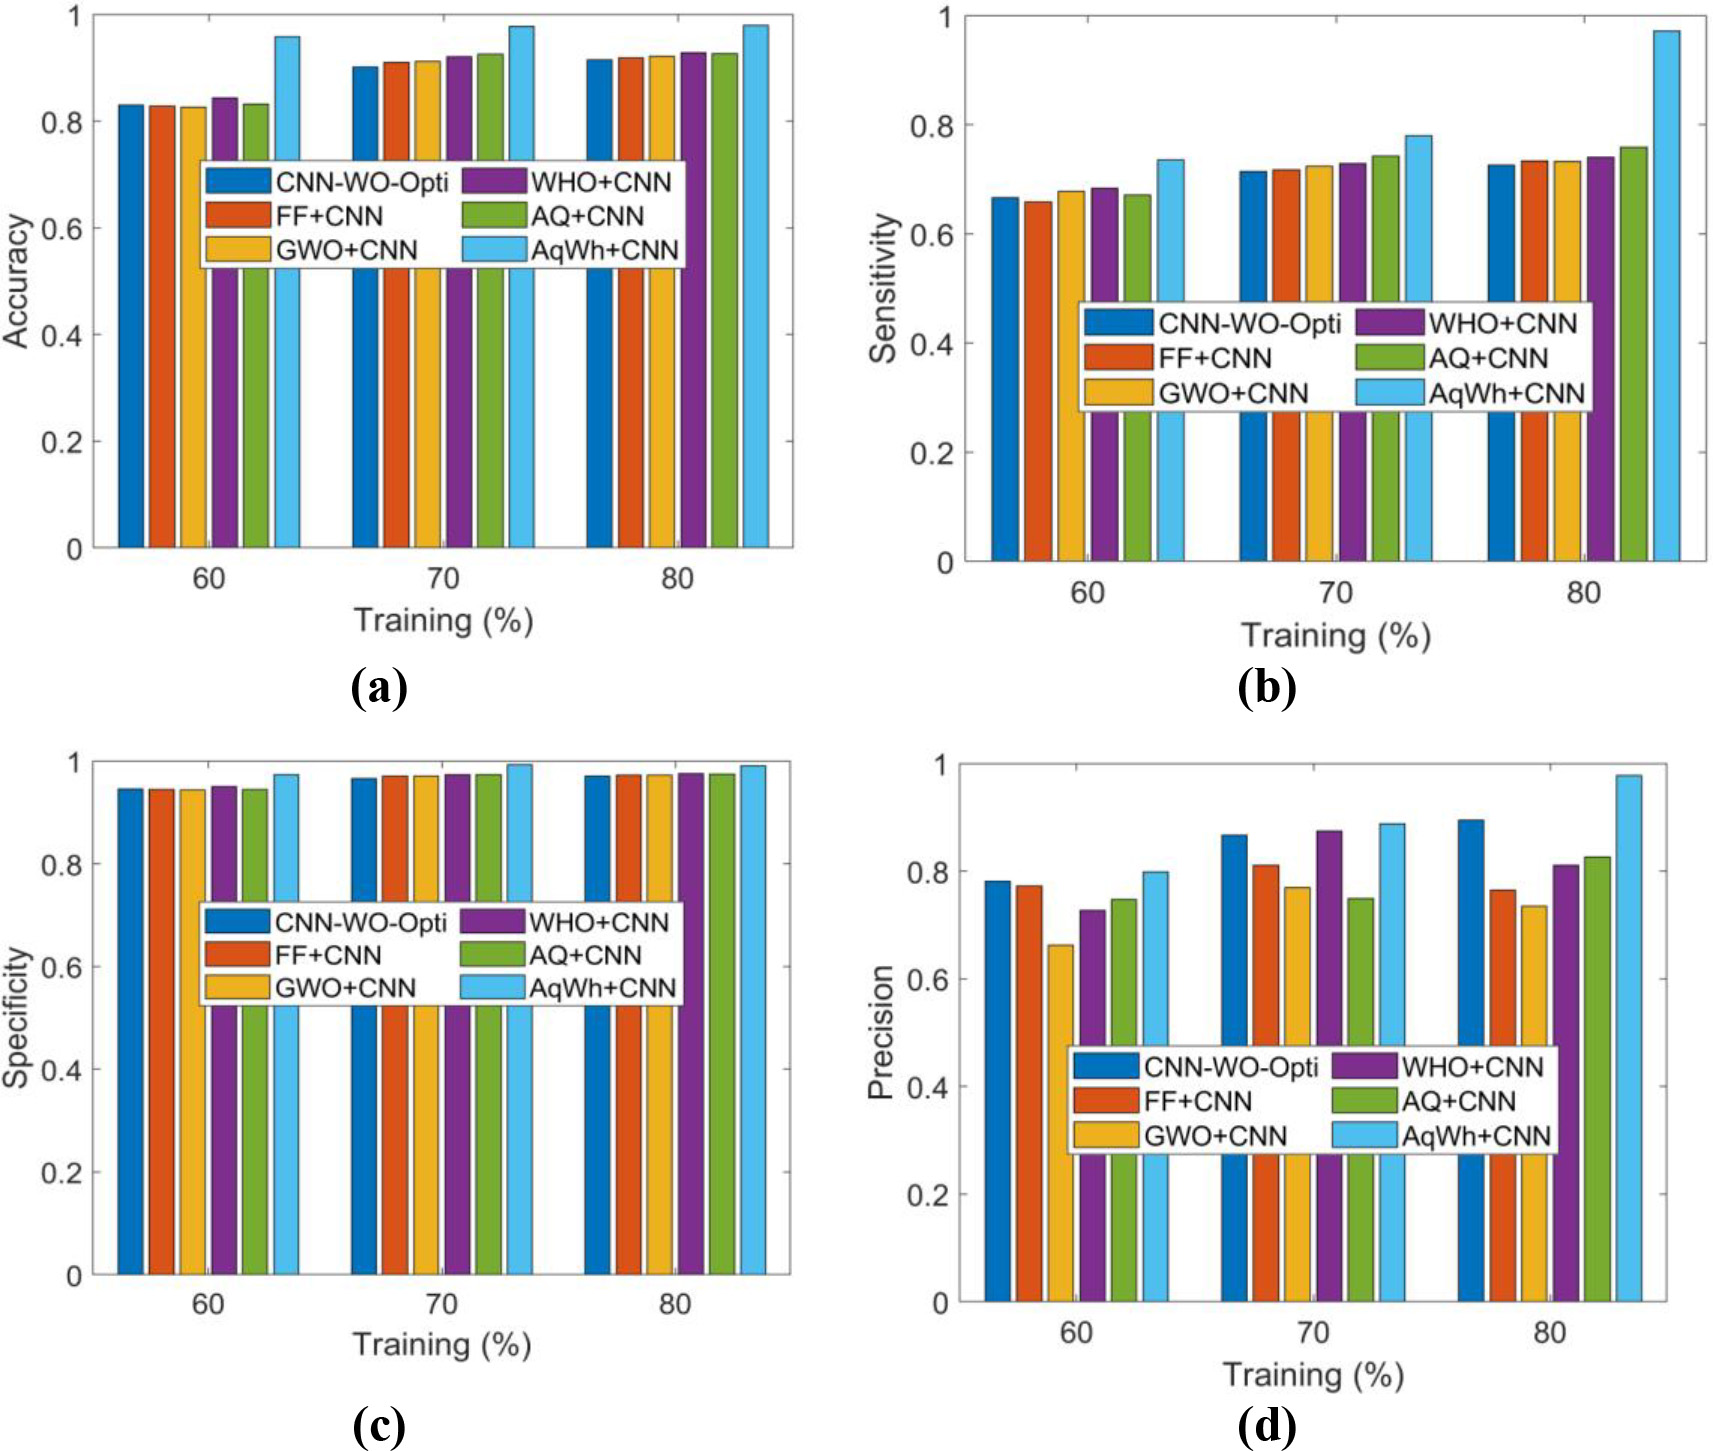
Comparative analysis in terms of neutral metrics, (a) F1-Score, and (b) MCC.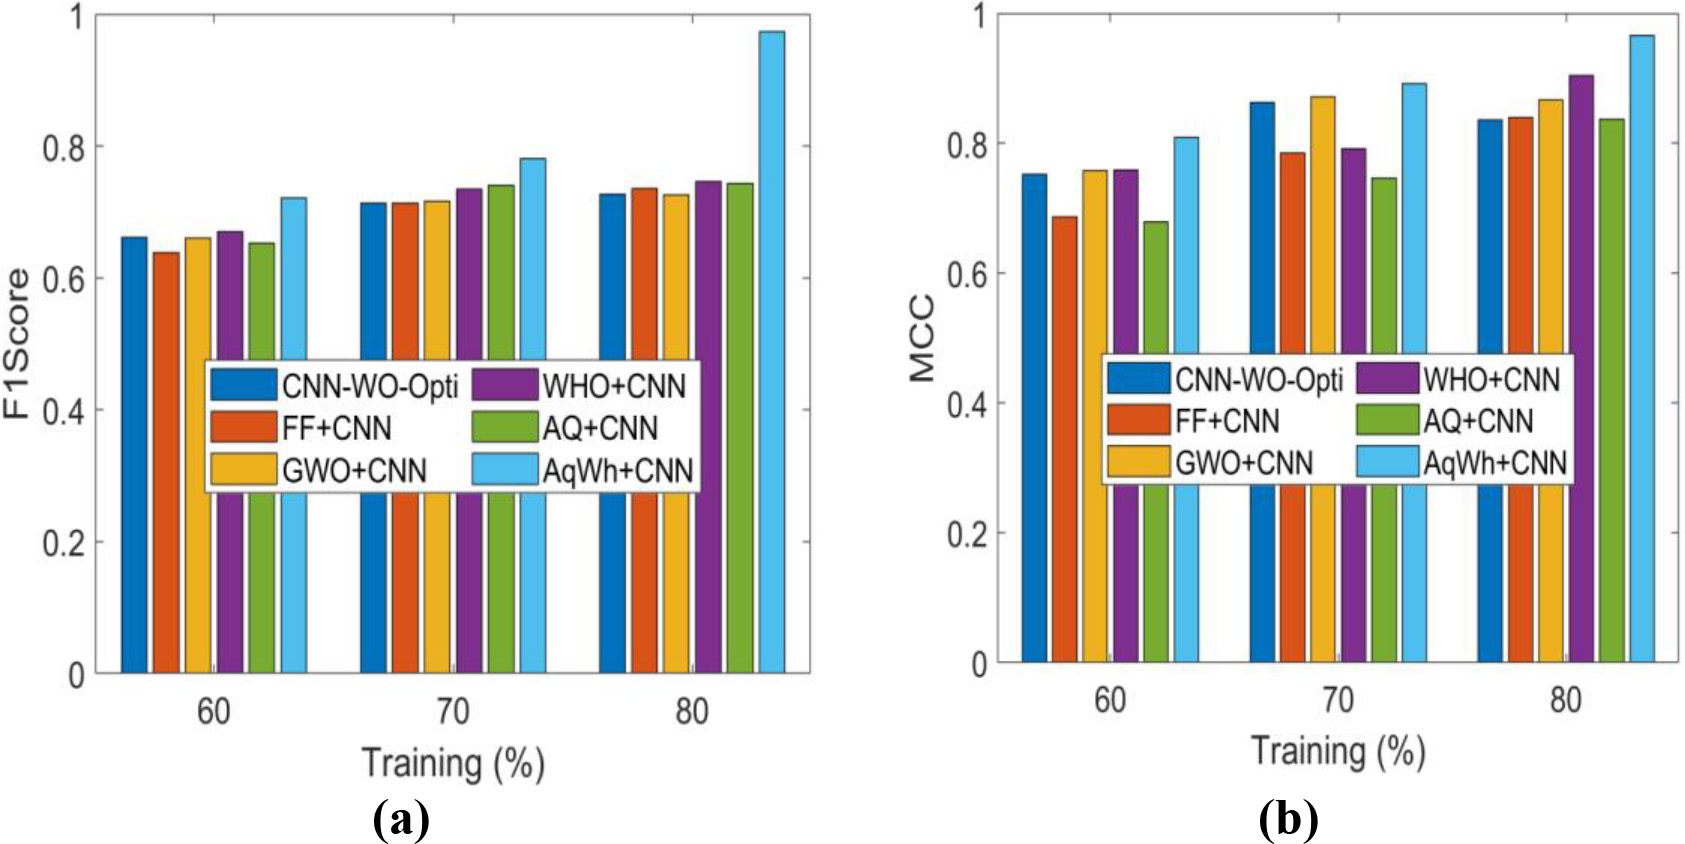
Comparative analysis based on negative metrics, (a) FDR, (b) FNR, (c) FPR, and (d) NPV.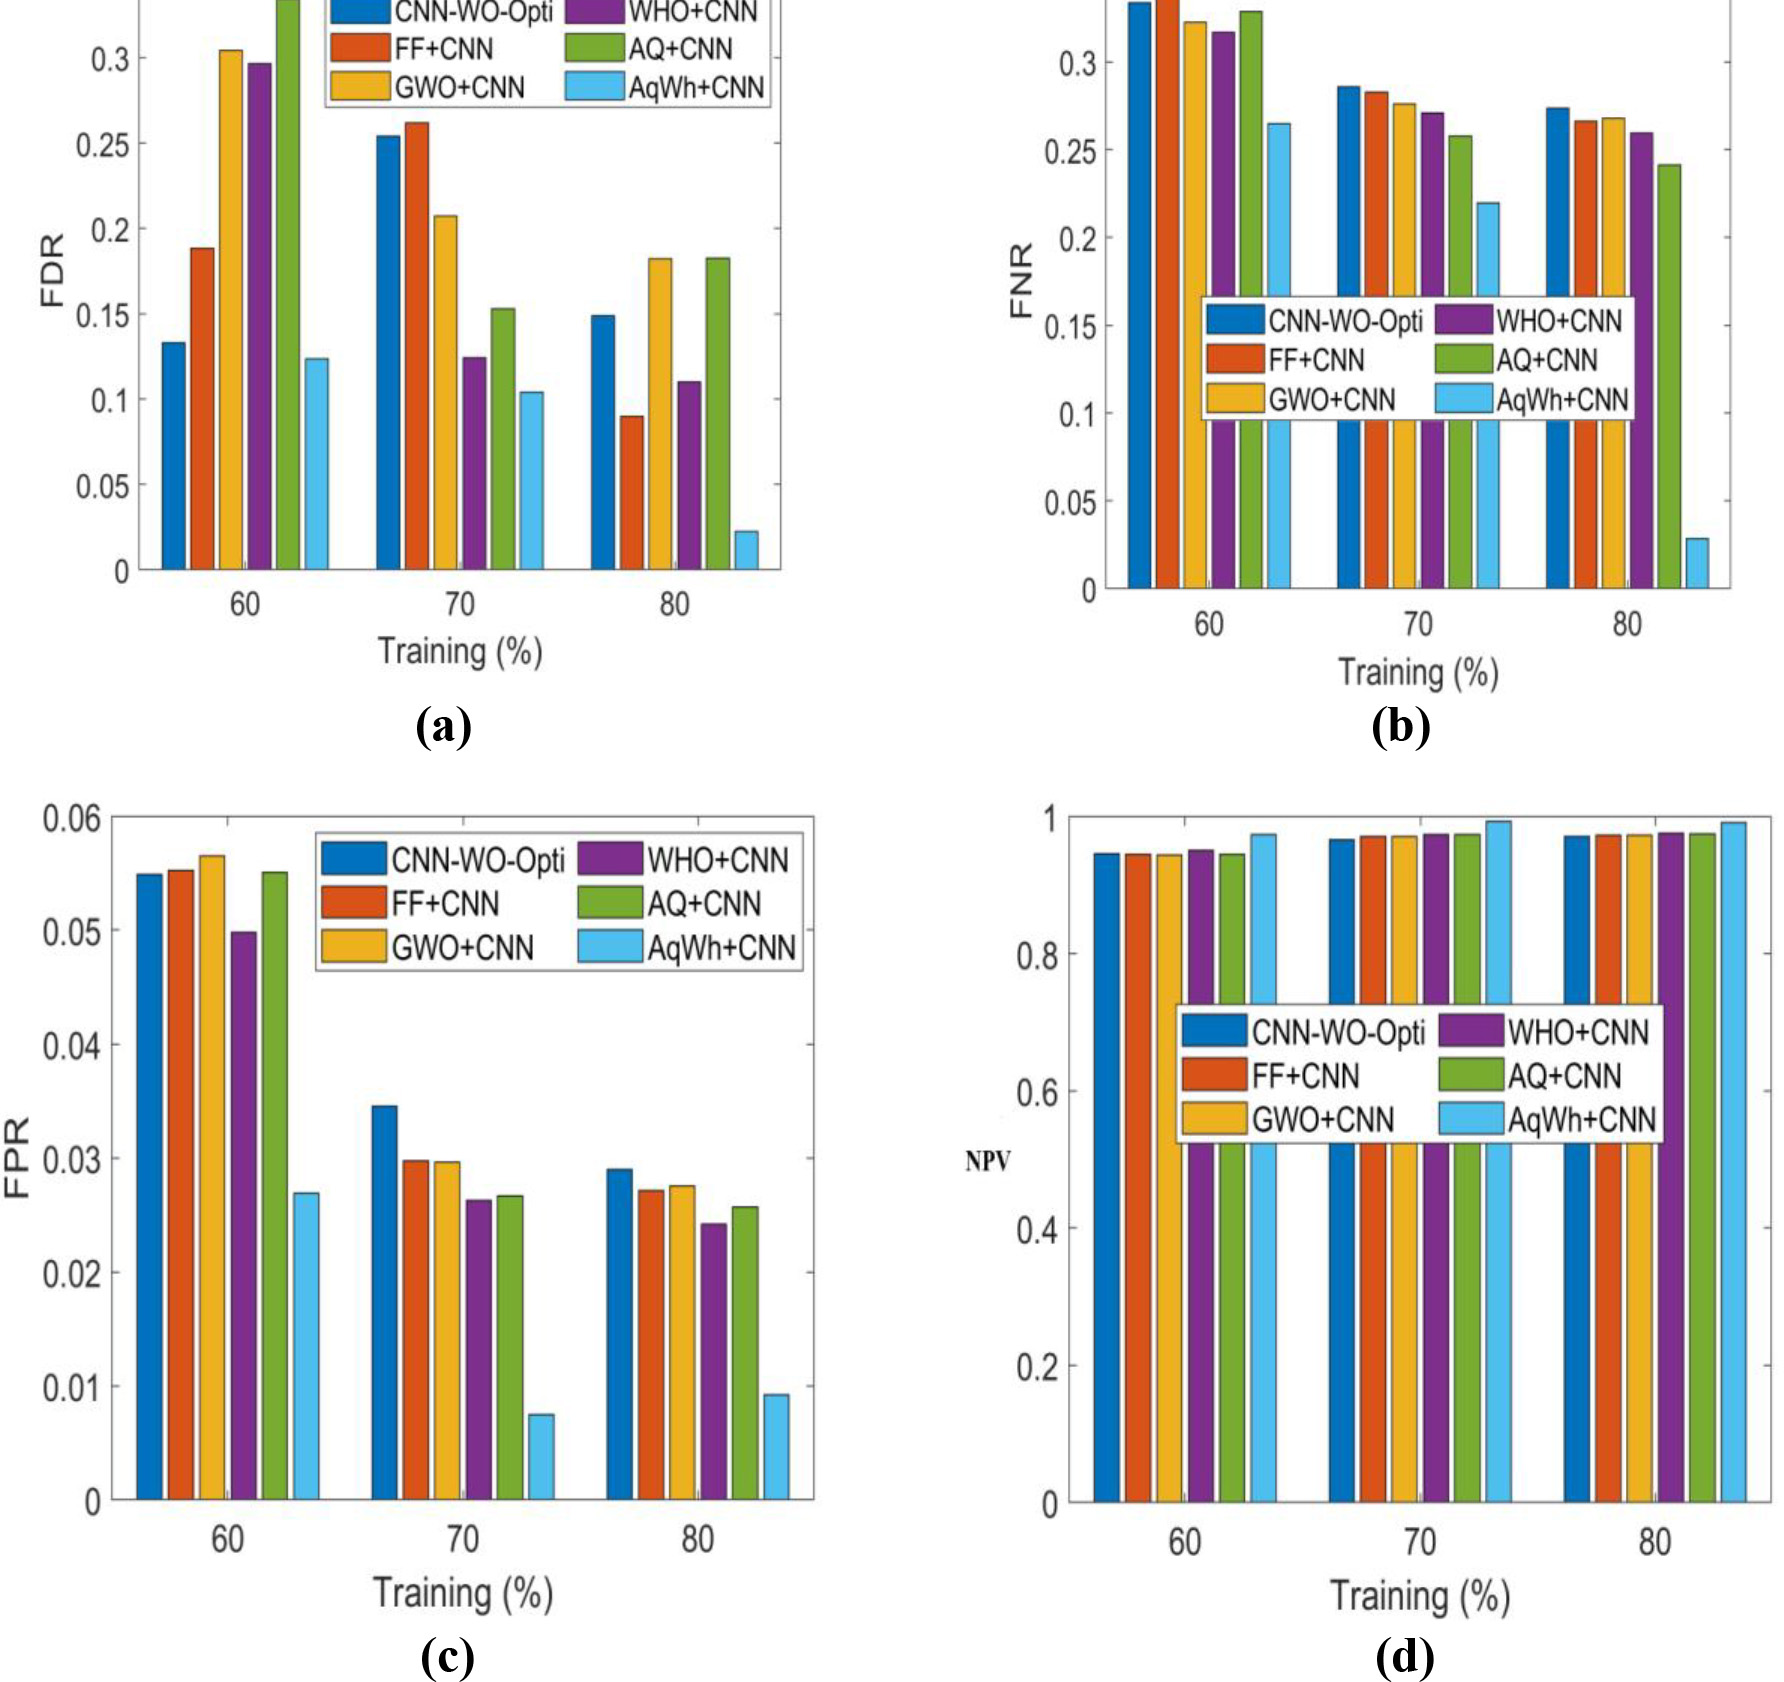
This section discusses the findings obtained utilizing the suggested thermal image classification unit and the comparison analysis to reveal the efficacy of the AqWh-based CNN classifier. The Experiment is carried out using the Matlab/Simulink tool. Simulation using computational time is used to test the Proposed AqWh-based CNN classifier. Accuracy, sensitivity, precision, F1-score, specificity, FDR, FPR, FNR, NPV, and MCC are some of the performance indicators used to assess the effectiveness of the suggested approach.
Description of dataset
The dataset used to perform the task of thermal image classification is the “Photovoltaic system thermal images dataset” accessed from [33]. A thermographic inspection of a ground-based PV system was conducted on a PV plant with a capacity of around 66 MW in Tombourke, South Africa, for its collection. The “Pv thermal images Dataset” is composed of 3336 images collected as follows: 1007 images with damaged PV cells. This work mainly focuses on damaged cells and the classification of faults based on three labelled classes is used.
Evaluation metrics
Accuracy, sensitivity, precision, F1-score, specificity, FDR, FPR, FNR, NPV, and MCC are some of the performance indicators used to assess the effectiveness of the suggested approach. The analysis is made on the image of a type PNG file. The size of the input image is 515 kB with the dimension of 640
Comparative analysis for classification task
By evaluating the proposed AqWH-based CNN’s performance against the established techniques using the aforementioned evaluation metrics, it is shown to be superior to them. A comparison of the approaches is shown in Fig. 3 in terms of the training percentage for positive metrics including accuracy, sensitivity, specificity, and precision. The comparative study of the approaches is shown in Fig. 4 in terms of training percentage in comparison to neutral measures, like the F1-score and MCC. A comparison of the approaches’ training percentages with regard to negative metrics including FDR, FNR, FPR, and NPV is also portrayed in Fig. 5. Likewise, Fig. 3(c) represents the specificity of developed AqWh-based DCNN technique through altering training learning percentage. When the training data percentage is 60, the specificity value of firefly, GWO, WHO, AQ and AqWh DCNN is 83.73, 80.32, 81.29, 81.19 and 92.98, respectively.
Comparative analysis for the task of localization
Comparative analysis for the task of localization
Analysis based on confusion matrix.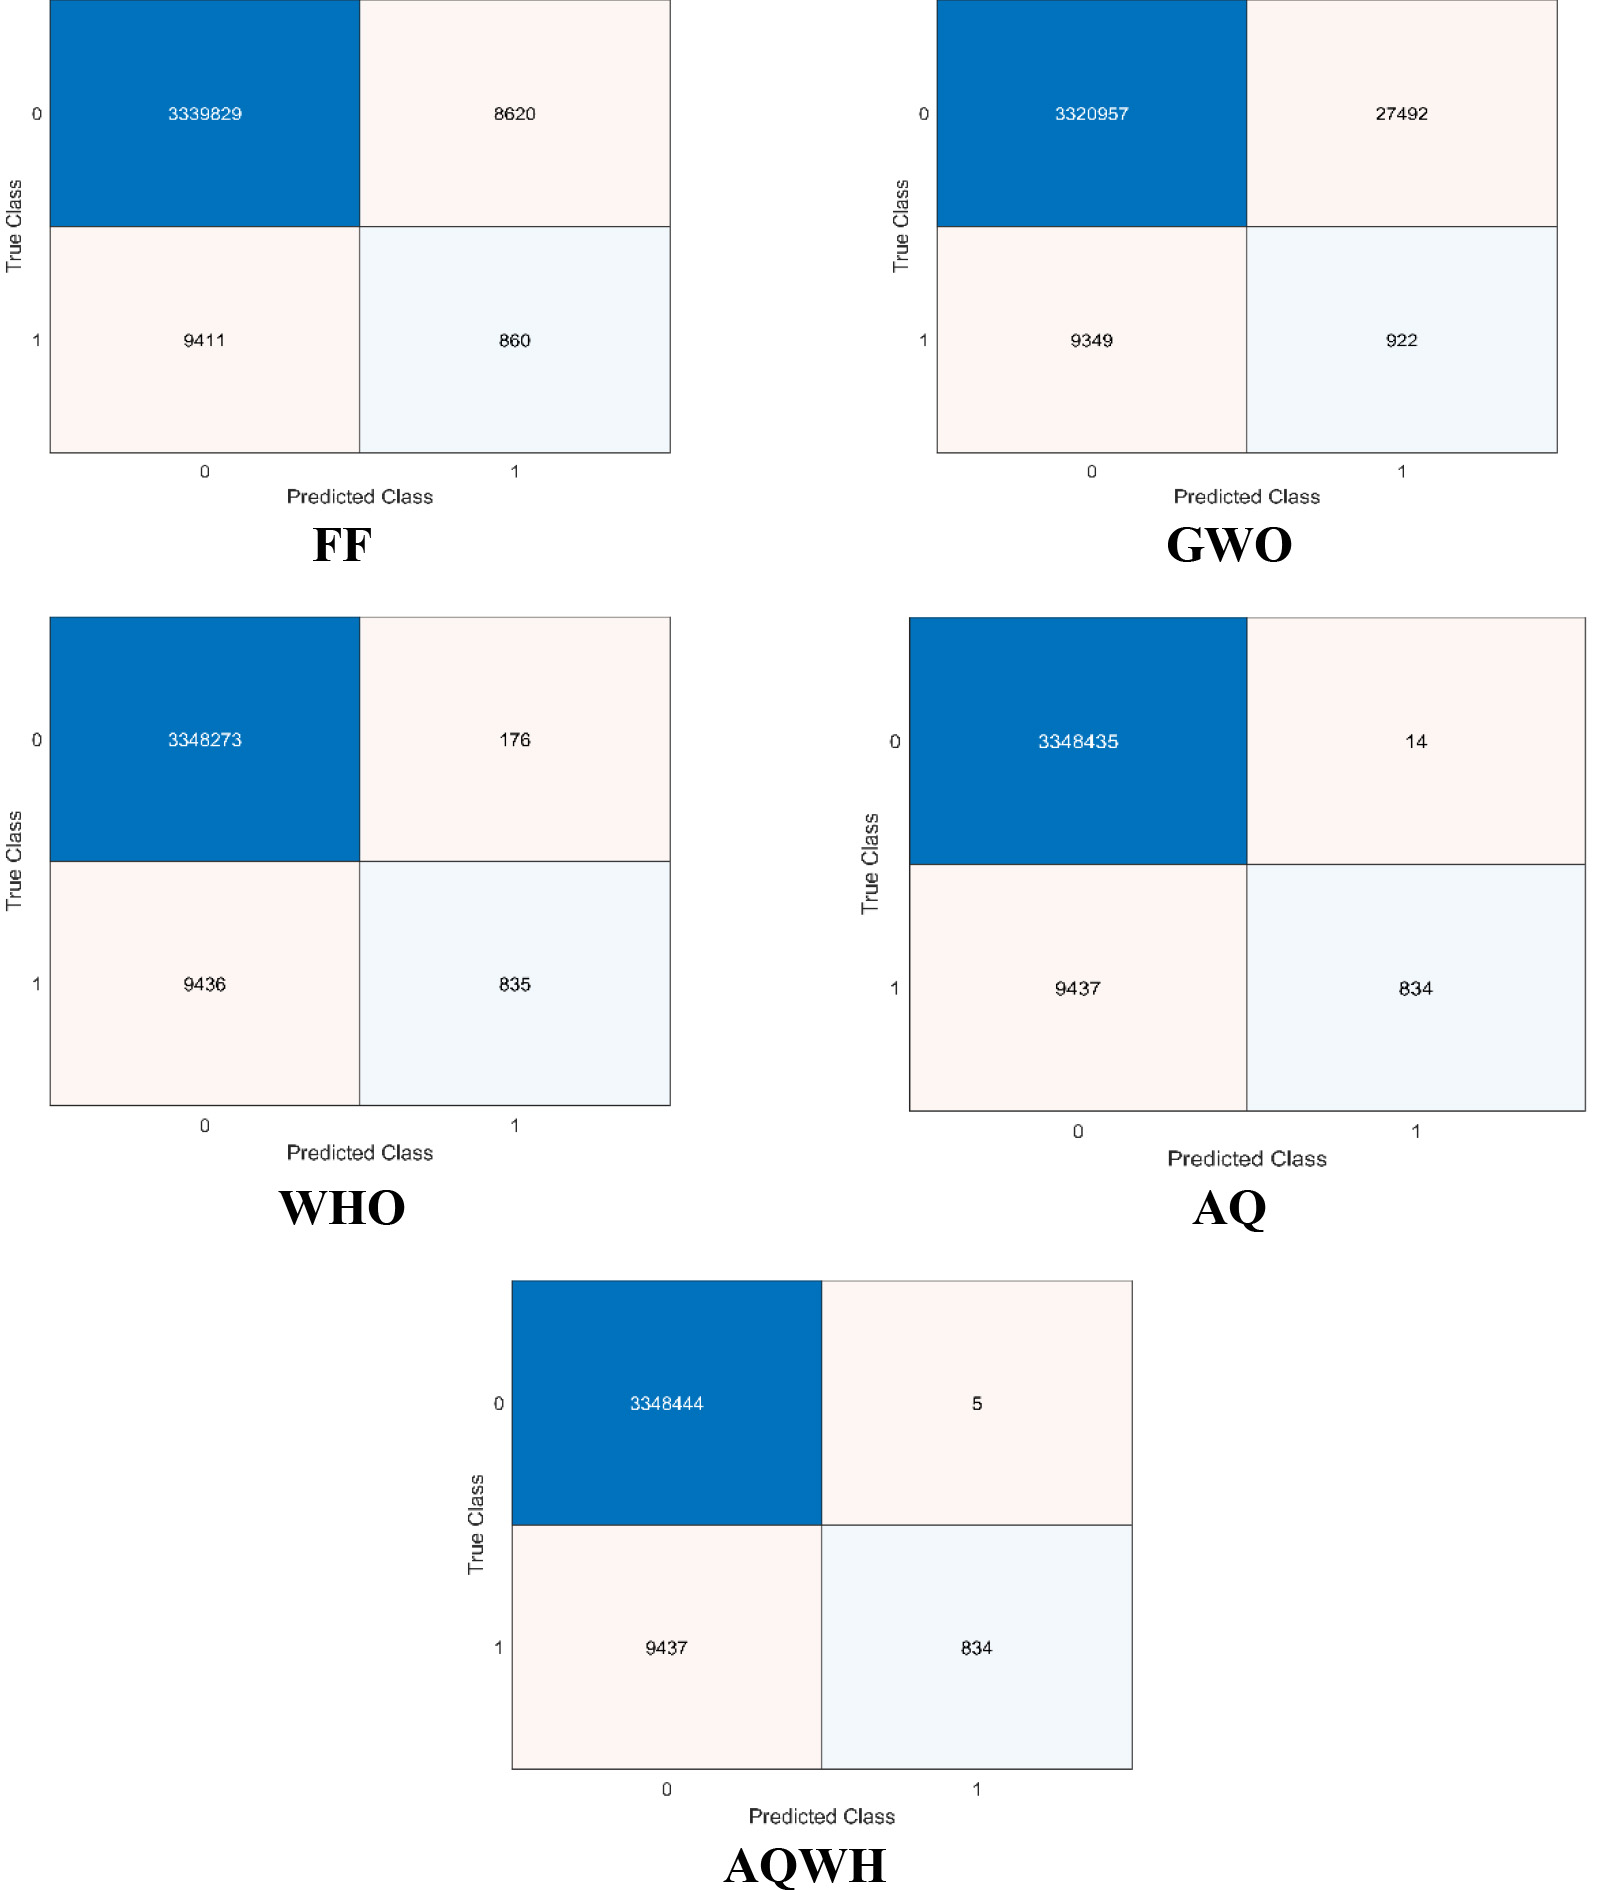
The traditional technique such as without optimization method, the result provided in Table 3, depicts the comparative analysis of the classification task at the first level by varying training percentage at the range of 60 percent as shown in Fig. 4 and Fig. 5. Classical method obtains parameter such as Accuracy, Precision, Sensitivity specificity is 0.89, 0.87, 0.93, 0.81.
The comparative analysis of classification tasks by varying training learning percentage is shown in Fig. 5. The sensitivity obtained by the developed AqWh-based DCNN approach is 98.56 percent, whereas the existing methods, like, firefly, GWO, WHO, and AQ is 89.33, 88.90, 97.13 and 90.71. From the observation of the evaluation metrics, it compares and contrasts the effectiveness of the recommended approach and the traditional techniques. In this research work, it is evident that the suggested technique outperforms other approaches in terms of efficiency.
The analysis based on the confusion matrix is portrayed in Fig. 6. Based on the obtained values of the Confusion matrix1classifier AQWH successfully identified the highest prediction of the data points which is called true positive (TP) and (TN) data points are successfully classified 0, 1 and 2 respectively; from the matrix some data points are incorrectly classified by classifier 1, of which (FN) data points should belong to class 1 but are classified as class 0, and (FP) data points should belong to class 0 but are classified as class 1.
Convergence analysis.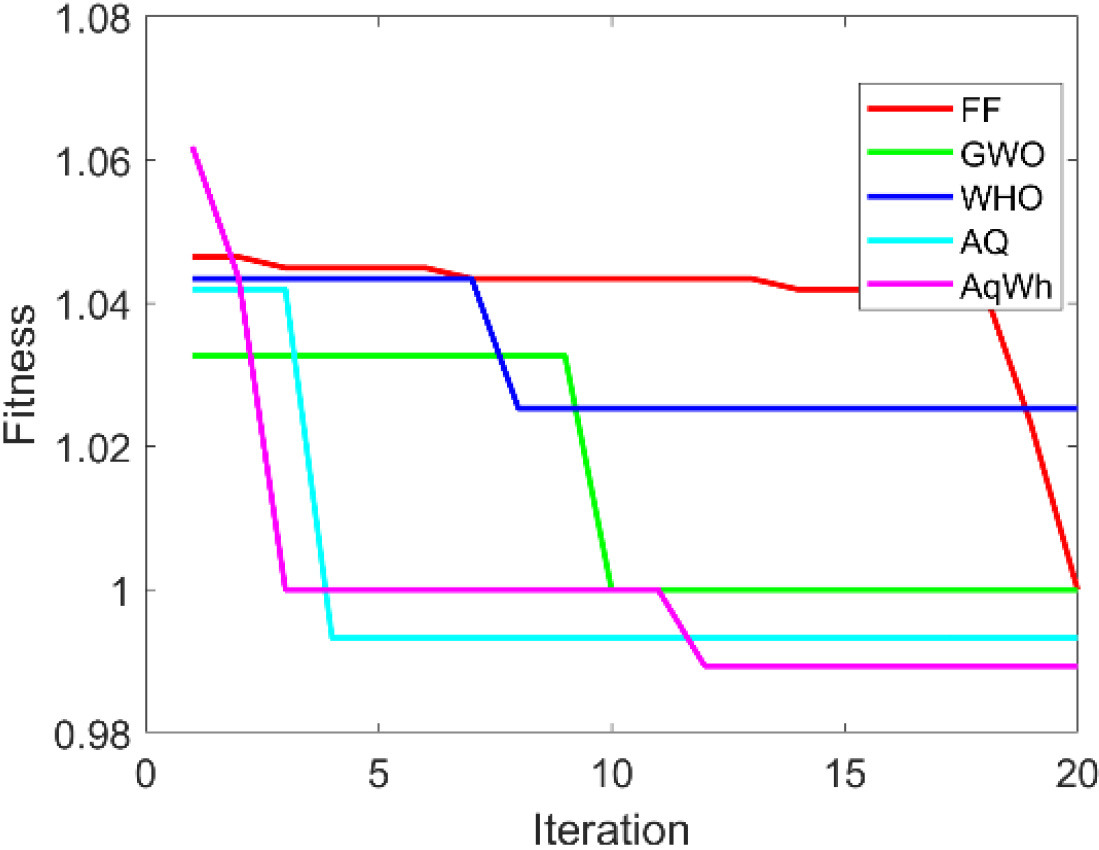
From the table, it is evident that the AqWh-based CNN method is highly efficient in performing the localization task as compared to traditional methods. Figure 7 depicts the fitness measure of the recommended strategy and the conventional techniques, and the convergence analysis is shown in Fig. 7.
The suggested technique converges faster than the traditional techniques, as seen in Fig. 7. The fitness value of the optimizer should be an optimum value near 1. Figure 7 portrays the ROC curve of the methods, such as FF, GWO, WHO, AQ, and the proposed AqWh that represents the classification and localization accuracy of the proposed model. The AQ is integrated with WHO; thereby, appropriate 1st-level and 2nd-level classification and localization of PV fault is highly improved. Besides, the developed AQWH-based DCNN approach classifies Multiple hotspots. In addition, the computational time and complexity are decreased based on the DCNN classifier.
This paper proposes an optimization-tuned CNN classifier to perform the classification and localization of faults in solar thermal images. In order for the noise included in the input thermal images to be removed during the feature extraction process, it must first undergo pre-processing. Following the pre-processing phase, features like LBP, LDP, and LOOP are extracted and concatenated to make a feature vector, which is fed to the Proposed CNN classifier, which carries out the process of fault classification and the localization of fault is done with the assistance of VGG-16 architecture. The faults are classified as, single hotspots, multiple hotspots, and string hotspots. After the completion of the classification task, the faults are localized using the VGG-16 model of the CNN classifier. The suggested AqWH algorithm, which incorporates the distinctive properties of the wild horse and the Aquila search agents, is used to adjust the CNN classifier’s weights to achieve improved accuracy in classification and localization. The suggested AqWH-based CNN classifier’s accuracy for the classification task is 90%, and for the localization task, it is 98.56%, demonstrating its superiority to traditional approaches. In the future, a deep learning strategy will be used to improve the effectiveness of the suggested method even more.
Footnotes
Nomenclature
| Abbreviation | Description |
| PV | Photovoltaic |
| CNN | Convolutional Neural Network |
| AqWh | Aquila Wild Horse Algorithm |
| AOA | Aquila Optimization Algorithm |
| WHO | Wild Horse Optimization Algorithm |
| FDR | False Discovery Rate |
| MCC | Matthews Correlation Coefficient |
| FPR | False Positive Rate |
| NPV | Net Present Value |
| O&M | Operation and Maintenance Actions |
| FNR | False Negative Rate |
| IRT | Infrared Thermography |
| EM | Electromagnetic radiation |
| MPP | Maximum Power Point |
| NB | Naïve Bayes |
| HOG | Histogram of Gradient |
| AI | Artificial Intelligence |
| Deep-CNN | Deep Convolutional Neural Network |
| FC | Fully Connected Layer |
| ML | Machine Learning |
| UAVs | Unmanned Aerial Vehicles |
| Mask R-CNN | Mask Region-Based Convolutional Neural Network |
| DNN | Deep Neural Network |
| IoU | Intersection Over Union |
| RGB | Red, Green, and Blue |
| MSER | Maximally Stable Extremal Regions |
| LBP | Local Binary Pattern |
| LDP | Local Directional Pattern |
| LOOP | Local Optimal Oriented Pattern |
| RES | Renewable Energy Sources |