
Abstract
In the era of increasingly prominent energy crisis and environmental protection issues, New Energy (NE) Power Generation (PG) has increasingly attracted people’s attention with its advantages of cleanness, environmental protection and renewable. However, the output of the generation power of the NE generation system has periodicity, volatility and randomness. After grid connection, it becomes an uncontrollable power source and may affect the security and stability of the grid. Therefore, it is of great significance to carry out in-depth discussion on the power prediction of NE generation. This paper explored the NE PG prediction method from the perspective of photovoltaic (PV) PG, and put forward the PV PG power prediction method: the prediction method combining meteorological data and gray correlation degree, and the prediction method combining PG data and wavelet Neural Network (NN). This paper analyzed the prediction effect after putting forward the generation power prediction method, and evaluated the prediction effect through the sum of squares, mean square error and mean absolute error. The following conclusions were drawn: From the perspective of error sum of squares and mean square error, the prediction method combined with PG data and wavelet NN had better prediction effect; the difference of the average absolute error of the PV power generated by the two prediction methods was 2. From the point of view of the average absolute error, the prediction method combined with PG data and wavelet NN had better prediction accuracy.
Introduction
In today’s energy crisis and increasingly serious environmental pollution, the development of new and renewable energy has become an important energy resource solution. In this process, wind power, PV, hydropower and other NE PG systems have developed rapidly. Although the NE PG method can provide people with cleaner and more environmentally friendly energy and open up a new way to obtain energy, there are also some drawbacks in the NE PG method [1]. By taking solar PG as an example, due to the constraints of climate conditions, the power generated by solar PV grid-connected PG has the characteristics of intermittent and fluctuating, so it must be accurately predicted to reduce the impact on the grid and ensure the stability of the grid.
Many scholars have studied the prediction of energy generation. Tang Ningkai proposed a solar PG prediction model and algorithm based on the minimum absolute contraction and selection operator. Through experiments, the algorithm could use less training data to achieve higher accuracy [2]. Abedinia Oveis proposed a new improved version of empirical mode decomposition to decompose the wind measurement value, so as to measure the power of wind PG [3]. Sanjari Mohammad Javad proposed a forecasting method for PV and wind PG to achieve good forecasting accuracy under different weather conditions [4]. Wang Yu proposed a new adaptive learning hybrid model for accurate solar intensity prediction based on meteorological data, which provided support for solar PG [5]. Kim Dohyun proposed a deep learning method based on multi-scale short-term and short-term memory recurrent NN that could predict ultra-short-term PV PG, so as to carry out effective PV PG management [6]. Akhter Muhammad Naveed made a systematic and critical review of the methods used to predict PV power output, which mainly focused on meta-heuristics and machine learning methods [7]. VanDeventer William proposed a support vector machine model based on genetic algorithm for short-term power prediction of residential scale PV system [8].
Behera Manoja Kumar expressed short-term PV power prediction by constructing a three-stage method combining empirical mode decomposition technology, sine-cosine algorithm and limit learning machine technology [9]. Labati Ruggero Donida proposed a decision support system based on NN, which could predict power production and estimate the predicted variability index. He also analyzed the production characteristics of wind farms [10]. Carriere Thomas proposed a new seamless probability prediction method that could cover multiple time ranges to solve the power prediction problem of PV PG [11]. Jahangoshai Rezaee Mustafa studied the short-term output power of the power plant from the perspective of climate factors, and designed an adaptive neuro-fuzzy inference system [12]. Behera Manoja Kumar used optimized and improved limit learning machine technology to predict solar PV power [13]. Based on the collected wind speed data of the numerical weather forecast system of the Central Meteorological Administration of Taiwan, Wu Yun-Kang adopted the lower bound estimation method to build a reliable prediction interval for wind PG, and proposed an improved non-parametric method for building a reliable prediction interval [14]. Lin You studied the wind PG prediction and proposed a multi-model combination probability prediction method [15]. The above scholars carried out research on energy generation prediction and put forward valuable suggestions.
In order to solve the problems of intermittence, randomness and volatility of PV PG and ensure the stability of the power grid and the reliable use of electricity by users, this paper adopted the forecasting method combining meteorological data and grey correlation degree, as well as the forecasting method combining PG data and wavelet NN to study the PV PG power prediction. The prediction effects of these two prediction methods were evaluated from the aspects of the sum of squares of error, mean square error and the mean value of absolute error. Both prediction methods could well predict the starting power. Compared with other studies, the prediction method combining meteorological data and grey correlation degree proposed in this paper was simpler to use and did not need to be trained through a large amount of data.
Evaluation of the influence factors and prediction feasibility of PV PG system and PV PG
PV PG system
At present, crystalline silicon is mainly used in PV cells. It is the core component of the PV PG system. Under the sun’s illumination, its photons would cause the movement of electrons in the whole system, thus forming a kind of electric energy, which is realized through the “photoelectric effect”. Generally, the energy provided by a single solar panel is limited, and the general solar power station would arrange corresponding PV modules according to a certain scale. The solar cell system is composed of battery, control equipment, inverter, etc., as shown in Fig. 1.
PV PG system.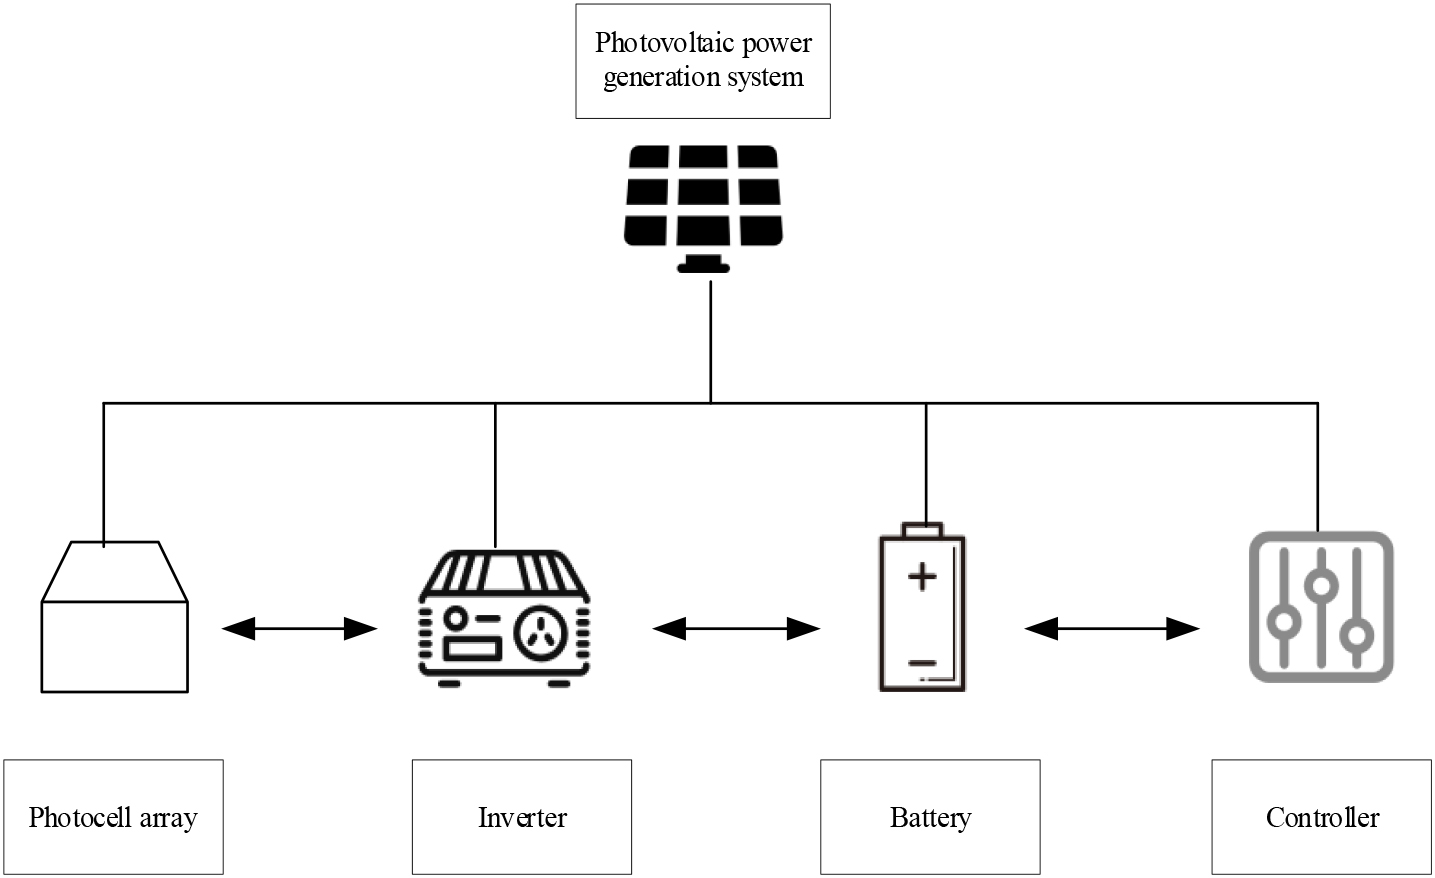
Photoelectric element array: Photoelectric element array can generate electricity. Its principle is to convert solar energy into electric energy by using photoelectric effect. This is one of the most critical components that can be adjusted according to the voltage level and power during operation.
Inverter: Inverter is also an important part of the photoelectric system. It converts solar energy into electric energy through electronic devices such as thyristor, and converts it into Alternating Current (AC) power supply that can be used by the load or meet the requirements of grid connection. The power of the inverter should be slightly higher than the output of the PV array. However, the standard solar radiation cannot be achieved most of the time, so the capacity of PV modules may be slightly higher than the rated capacity of the inverter within the permitted range. At present, the requirements for power conversion of solar inverters are more than 90%, and the best is 98%.
Battery: The essence of battery is to convert chemical energy into electrical energy. The role of adding battery is to increase the active output of solar PG and ensure that the solar PG system can meet the needs of the grid. The role of the battery goes beyond that. The battery has both charging and discharging functions, so it has a two-way energy working mode.
Controller: Whether in solar PG system or other renewable energy systems, the function of PV controller is like the core of computer, which controls the energy flow of the whole system. By monitoring the temperature, illumination, environmental temperature and other data of the battery, the photoelectric control system implements the battery charging and discharging operations, thus achieving the protection of the battery. It can be embedded in the inverter or applied independently.
In actual use, PV PG system can be divided into two types according to whether it is connected to the grid: One is independent PV PG, and the other is connected to the grid. The design of independent solar PG system is quite simple. It can be installed locally, and it does not need to comply with local power standards. It only needs to select appropriate PV equipment according to the power demand, and then provide users with electricity through the controller and energy equipment. The separate PV PG system is shown in Fig. 2.
Separate PV PG system.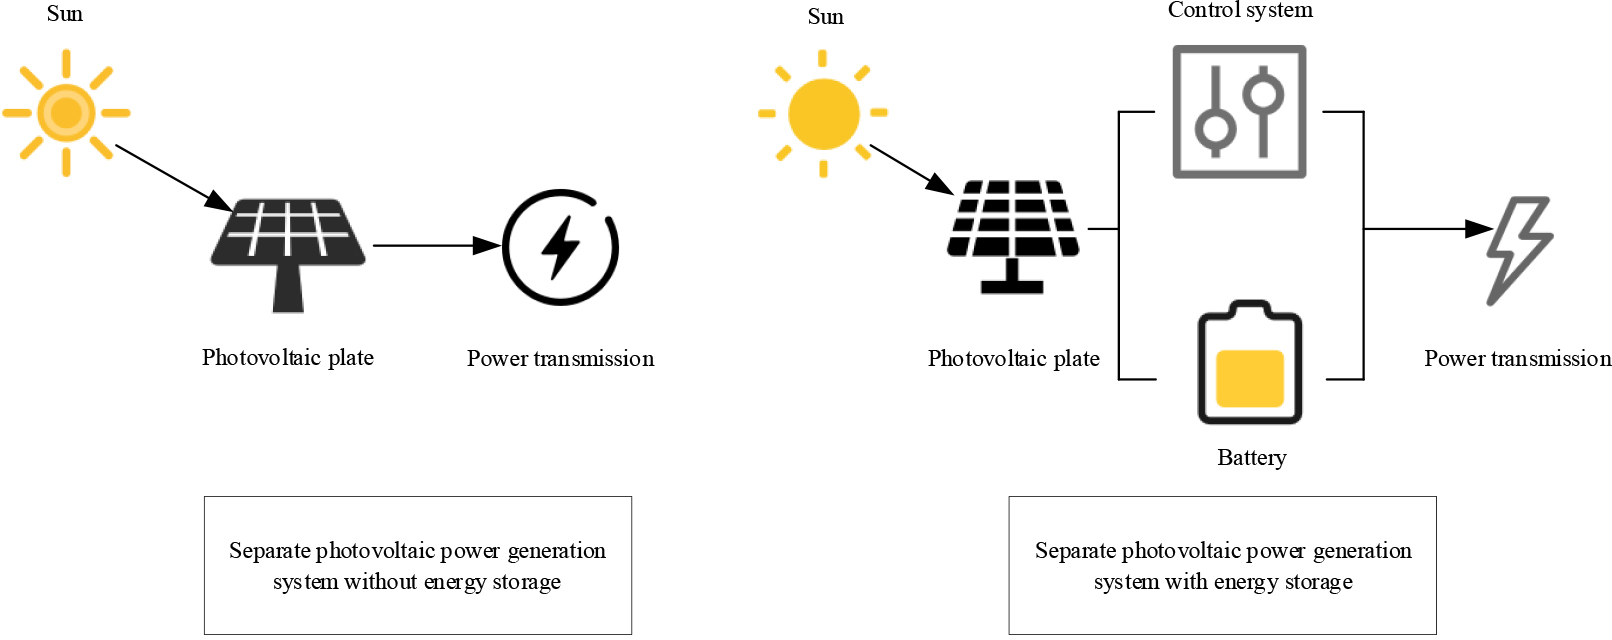
PG system without energy storage: Since the PG system does not have energy storage batteries, its output power would also change, which is suitable for the power demand with low requirements for power quality. There is no need for controller and energy storage, so solar PV conversion efficiency is high and the cost is relatively low. PG system with energy storage: Compared with the solar system without energy storage, after the installation of batteries, the power supply becomes more stable and would not be limited by climate and time. Under the condition of sufficient sunshine, the PV PG system temporarily stores the surplus electric energy to the storage battery to ensure the normal use of the load. When the weather conditions change, such as rainy days, solar cells would be used as power supply. The PG system with energy storage has been widely used in people’s life.
The grid-connected PV PG system uses the array combination of solar panels to generate Direct Current (DC) power, and then converts it to a voltage level that meets the requirements of the grid through the inverter, which then connects it to the corresponding power system. Grid-connected PV PG system includes the following types. The system with countercurrent connection: The system can transmit excess power to the grid, and also receive power from the grid, so as to achieve two-way flow, which is called countercurrent. Non-countercurrent grid-connected system: Under the condition of sufficient lighting, the power would not be transmitted to the grid. In case of power shortage, power can be claimed from the power grid. Switched grid-connected system: When the system cannot provide enough load due to climate and other factors, it is switched to the public grid by the automatic switchgear [16]. When the power supply of the system is sufficient, or the power supply of the power grid is insufficient, it would be automatically converted to system power supply. System with energy storage equipment connected to the grid: Energy storage equipment with corresponding capacity can be configured as required to ensure uninterrupted or stable load. Large-scale grid-connected system: The voltage output by the inverter in the grid is raised to a suitable voltage through a step-up transformer, and then transmitted through the high-voltage grid, which finally distributed to customers.
The influencing factors of PV PG can be divided into internal and external factors. Due to the need to consider the interaction and influence between multiple components in the evaluation of internal factors, and the need for actual testing or monitoring of the system to obtain relevant data, which is complex and time-consuming, this article only evaluates external factors. External environmental factors mainly refer to various meteorological factors that can affect PV PG. The following is a brief introduction to the influencing factors of PV PG, as shown in Fig. 3.
Influencing factors of NE PG.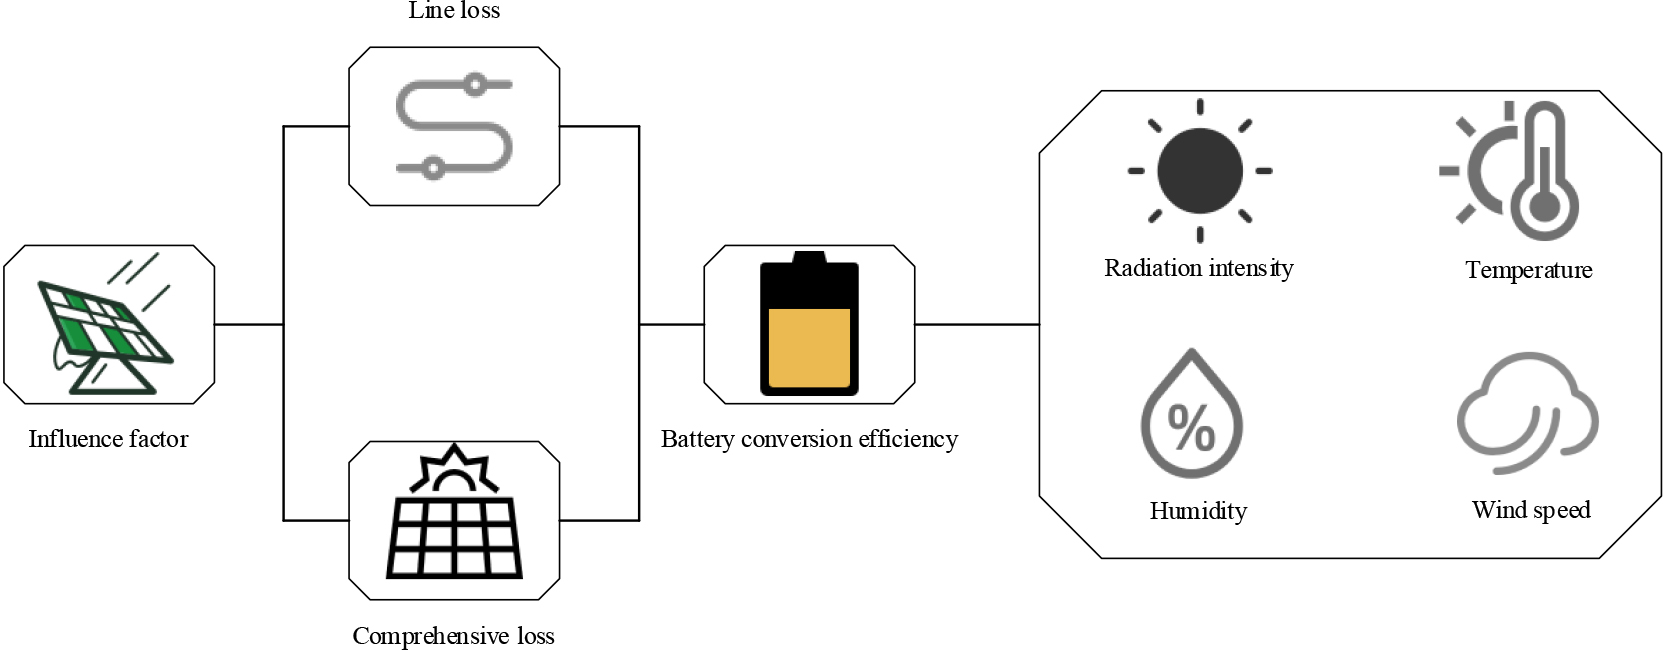
Line loss: Both DC and AC circuits would cause line loss. Therefore, during the design, the wire with good conductivity and large diameter should be selected. During line maintenance, special attention should be paid to the connection between connectors and terminals.
Comprehensive loss: Due to the different current of each component, any series connection would cause current loss; due to the different voltage of components, any parallel connection would cause voltage loss.
Battery conversion efficiency: Silicon wafer is dominated by silicon, and conversion rate has become the bottleneck of the entire industry development.
Irradiation intensity: There is a significant positive relationship between solar energy and PV PG. The lower the solar radiation intensity, the lower the photoelectric conversion efficiency. Under different meteorological conditions, the intensity of solar radiation is obviously different; under the same sunny weather conditions, its radiation intensity would also vary with the regional distribution.
Temperature: The PG of PV PG is affected by temperature, which has a certain positive impact on the PG. However, with the increase of temperature, the efficiency of PV PG would also decline. This is because the external temperature would make the temperature of PV cells higher, which would affect the conversion efficiency of solar cells.
Humidity: Humidity represents the dryness in the air. Generally, the higher the humidity, the weaker the light, and the lower the output photoelectric efficiency. Therefore, the relationship between humidity and energy is completely opposite to the relationship between radiation intensity.
Wind speed: Wind power also has a certain impact on the output of PV PG. Under the influence of wind speed, the heat dissipation effect of the battery pack is better, and some dust can also be blown down, thus improving the conversion efficiency. In the case of haze, the dust on the solar panel would become more serious, and the increase of wind would reduce the dust on the solar panel, thus improving the power of the battery.
The following theories support the feasibility of PV PG power prediction:
Possibility theory: The power conversion of PV PG is affected by both internal and external factors. Different influence factors may have different impacts on the power system, which makes the change of PV PG possible. In order to accurately predict the generation power of a specific power system, it is necessary to consider the possibility of generation power variation, so as to make different predictions to determine the correct generation power. Knowability theory: People can get the change rule of historical PG data of NE, so they can master the change rule of PG, and people can infer the future results from the previous PG data. Cycle law: Most things have cycles. That is to say, the future development of things has similar laws with the current development. Through the analysis of PV PG, the power in a specific time in the future can be predicted. The theory of continuity: Everything would change constantly under its inherent nature, thus producing new characteristics. The past, present and future values of PV PG have continuity.
Prediction method of NE PG
Prediction method combining meteorological data and grey correlation degree
From the perspective of external factors, temperature, irradiance and wind speed have obvious influence on PV PG, so they are regarded as the key environmental factors for PG prediction. In addition, the PG of solar power plants is highly consistent. Under the same climate conditions, the same solar PG is also very similar. Therefore, the historical meteorological and climatic types that are close to or similar to the forecast period can be selected from the previous data, and the future PG can be predicted using the previous meteorological and PG data. For the identification of meteorological types in similar periods, data mining and fuzzy classification are used to select variable factors with specific weather characteristics, and fuzzy classification and labeling are carried out to form a forecast database. On this basis, the grey correlation degree algorithm is used to select the sequence that is very close to the prediction period and predict the generation power.
Similar meteorological conditions can be obtained through fuzzy recognition and classification. The meteorological test equipment conditions of solar PV power station are limited, so the meteorological information provided by the meteorological website can be used to comprehensively analyze the temperature, irradiance and other factors affecting the PV power station with the previous PG data. In this paper, the daily maximum temperature, daily minimum temperature, humidity, wind speed and overall weather type were used as the identification factors of weather type.
The dimensions of the five factors are different, and their orders of magnitude are different, so they can be fuzzy assigned. The temperature level is divided into five levels: very low, low, medium, high and very high. Very low level is below 5
Information about weather types can be learned in advance on the meteorological website. For example, the weather conditions on the forecast day can be learned from the meteorological website as follows: The lowest temperature is low; the highest temperature is medium; the relative humidity is relatively dry. The type of wind speed is light wind; the weather attribute is overcast. The data set obtained by marking is (2, 3, 4, 2, 4). Through this method, the same meteorological indicator vector can be reversely extracted from the solar PV PG database and used as I.
The grey correlation theory can be used to screen out the data with high correlation with the forecast date. On the weather forecast website, the weather data of the forecast day can be obtained. It is assumed that the temperature of the forecast day is
After data mining and processing, the samples in the sample library I are marked. If the comparison sequence of these meteorological data is
The dimensionless processing is carried out, and the formula is as follows:
The following matrix is obtained:
The correlation coefficient is calculated as follows:
The following matrix is obtained from the correlation coefficient:
The correlation between
First, the meteorological data of the forecast day is set as the reference sequence vector
Through screening the historical PG and meteorological data, the abnormal data is excluded. In order to prevent the network prediction error and neuron saturation caused by the large order of magnitude difference of input and output data, the data is standardized and converted between [0,1] [17]. Standardized formulas are used:
Among them,
Determination of nodes in the input/output layer: The input quantity is as follows, including the 10-hour PG during 7:30–17:30, the temperature of the previous day and the forecast day, the temperature and of the light plate, and the humidity. The node of the output layer is the 10-hour PG from 7:30–17:30.
Determination of hidden layer nodes: Its range is determined using the following formulas:
Among them, a is the number in
The output values of the hidden layer and the output layer are as follows:
Among them,
The excitation function of the output layer is as follows:
The output of the PV PG system at the c th moment is as follows:
This paper improves the training and convergence speed of the model by using a higher learning rate. When a batch of samples propagates in the network, due to the different distribution of each batch, the internal parameters of the network will continuously change during training, and the input value distribution of neurons in each layer will be different. This leads to the need for the upper layer to constantly adapt to these different distributions, which is the problem of internal coordination variable shift. This makes the training of the model even more difficult. In the forward propagation of the Batchnormalization network model, the data input from each layer to the network layer is standardized. It is expressed as:
Among them,
By normalizing the linear combination output of the hidden layer, the input of the hidden layer is transformed from a normal distribution of each variable to a normal distribution with an average variable of 0 and a variance of 1. By using this method, the loss function can undergo relatively significant changes when the input variables are not large, thereby reducing the phenomenon of gradient disappearance and improving the convergence of the model.
In the training process of large-scale networks, overfitting often occurs due to the large number of model parameters and the small number of training samples. In response to this issue, this article uses the Dropout layer to randomly select several neurons from each layer of the network, but does not update their weights, even if they fail. Dropout can be seen as a model mean, where hidden layer nodes in the network are randomly ignored at each training stage, and the network is different at each training stage. Therefore, there will be no overfitting of the dataset.
This paper conducts research on photovoltaic power generation prediction at the photovoltaic power plant in S city. This paper takes the photovoltaic power generation data of S city’s photovoltaic power plant from January 1 to January 30, 2022 as the dataset. The total installed capacity of the photovoltaic power station is 75 KW, and the photovoltaic power generation data is recorded in steps of 10 min. This paper uses all meteorological data and historical power generation data from January 1st to January 20th as the training set, and uses photovoltaic power generation data from January 21st to 30th as the test set for prediction.
In this paper, the PV PG prediction research was carried out at the PV PG site in S City. The generation power of 10 time periods between 7:30 and 17:30 on the forecast day was predicted by the prediction method combining meteorological data and grey correlation degree and the prediction method combining PG data and wavelet NN. The forecast day was sunny, and the data values obtained were shown in Table 1.
Predicted data value obtained
Predicted data value obtained
The data obtained in this paper was the PV PG data of S City in sunny days. It could be seen from Table 1 that the power of PV PG was high in the 9:30–14:30 time period, while the power of PV PG was not high in other time periods; compared with the actual PV PG data, the predicted PV PG results by combining meteorological data and grey correlation degree prediction method, as well as combining PG data and wavelet NN prediction method, were closer to the actual value. However, it could be seen that the prediction method combining PG data and wavelet NN was closer to the actual PV PG.
The sum of square error, mean square error and mean absolute error were used to evaluate the prediction effect of the prediction method combined with meteorological data and grey correlation degree and the prediction method combined with PG data and wavelet NN. The error values were shown in Table 2.
Error value of prediction method
As shown in Table 2, the error value reflected the difference between the predicted value and the actual value of PV PG. From the perspective of each time period, the prediction error generated by the two PV PG prediction methods was within the acceptable range, and both methods could play a role in the PV PG prediction. However, from the specific error value, compared with the error value generated by the prediction method combining meteorological data and grey correlation degree, the error value generated by the prediction method combining PG data and wavelet NN in each time period was smaller. From the perspective of specific error value, the prediction method combining PG data and wavelet NN had higher prediction accuracy.
The sum of squares of errors was used to evaluate the two PV PG prediction methods, as shown in Fig. 4.
a: Error square value under the prediction method combining meteorological data and grey correlation degree. b: Error square value under the prediction method combining PG data and wavelet NN. Error square value of prediction method.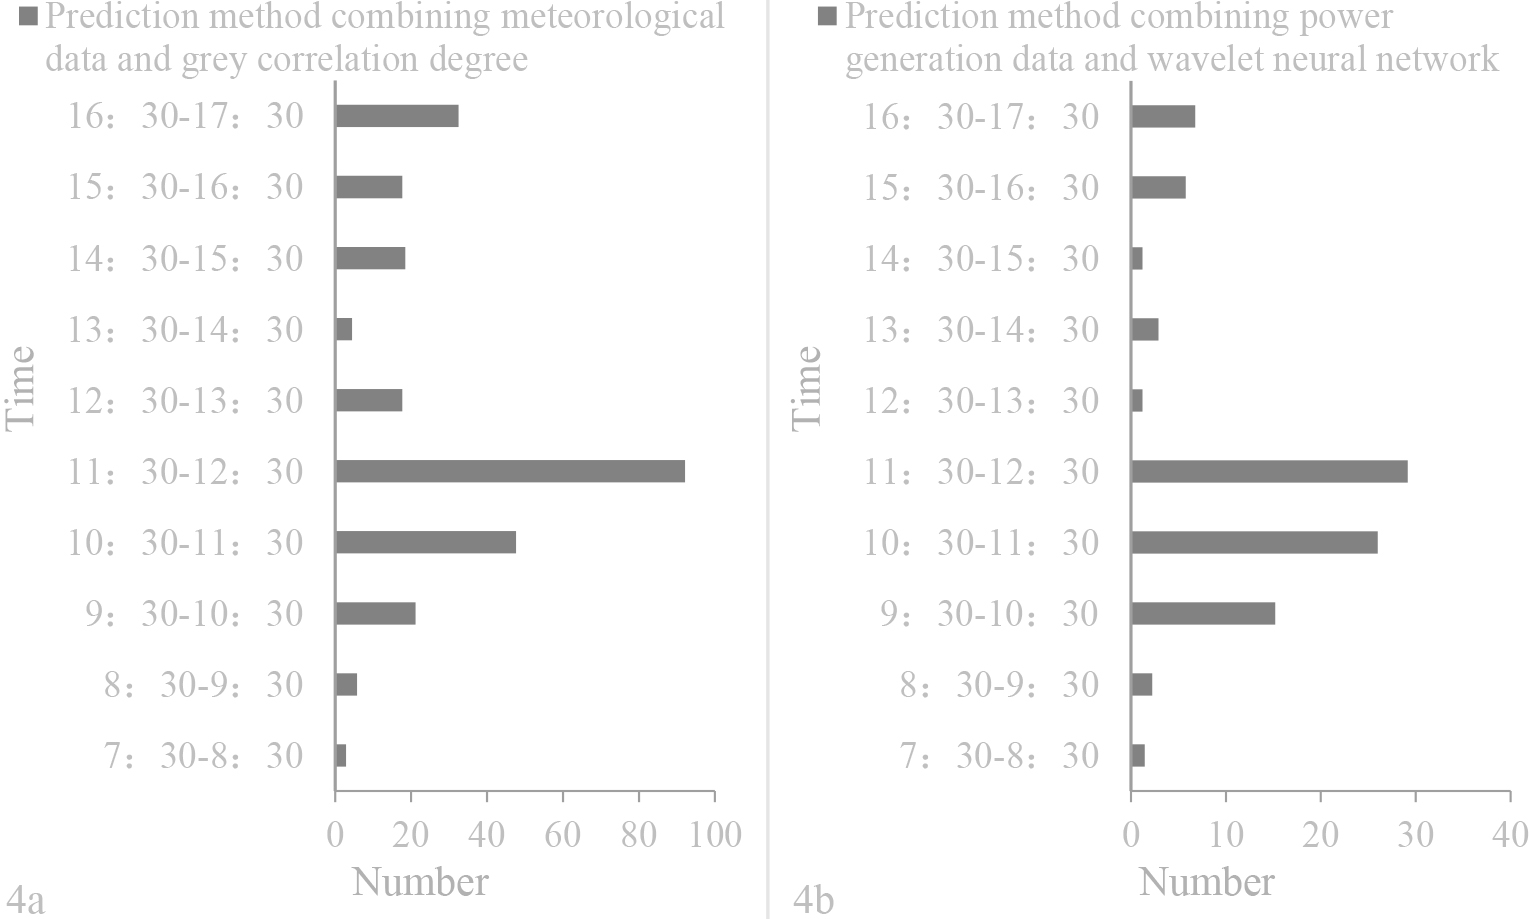
As shown in Fig. 4, the square value of the PG error for 10 time periods could be seen from 4a. Through further calculation, it could be seen that the sum of the square error of the predicted power of PV PG was about 260.3 in combination with the prediction method of meteorological data and gray correlation degree. From 4b, the square value of the generated power error for the same 10 time periods could be seen. Through the sum calculation, it could be seen that the sum of the square error of the predicted power value of PV PG was about 91.9 in combination with the PG data and the prediction method of wavelet NN. Compared with the error value of each time period, the sum of error squares could better reflect the prediction accuracy of the two prediction methods as a whole. From the perspective of the sum of error squares, the prediction method combined with PG data and wavelet NN had better prediction effect.
The mean square error was used to evaluate the two PV PG prediction methods. The calculation formula was:
And the calculation results were shown in Fig. 5.
a: Mean square error value under the prediction method combining meteorological data and grey correlation degree. b: Mean square error value under the prediction method combining PG data and wavelet NN. Mean square error value of prediction method.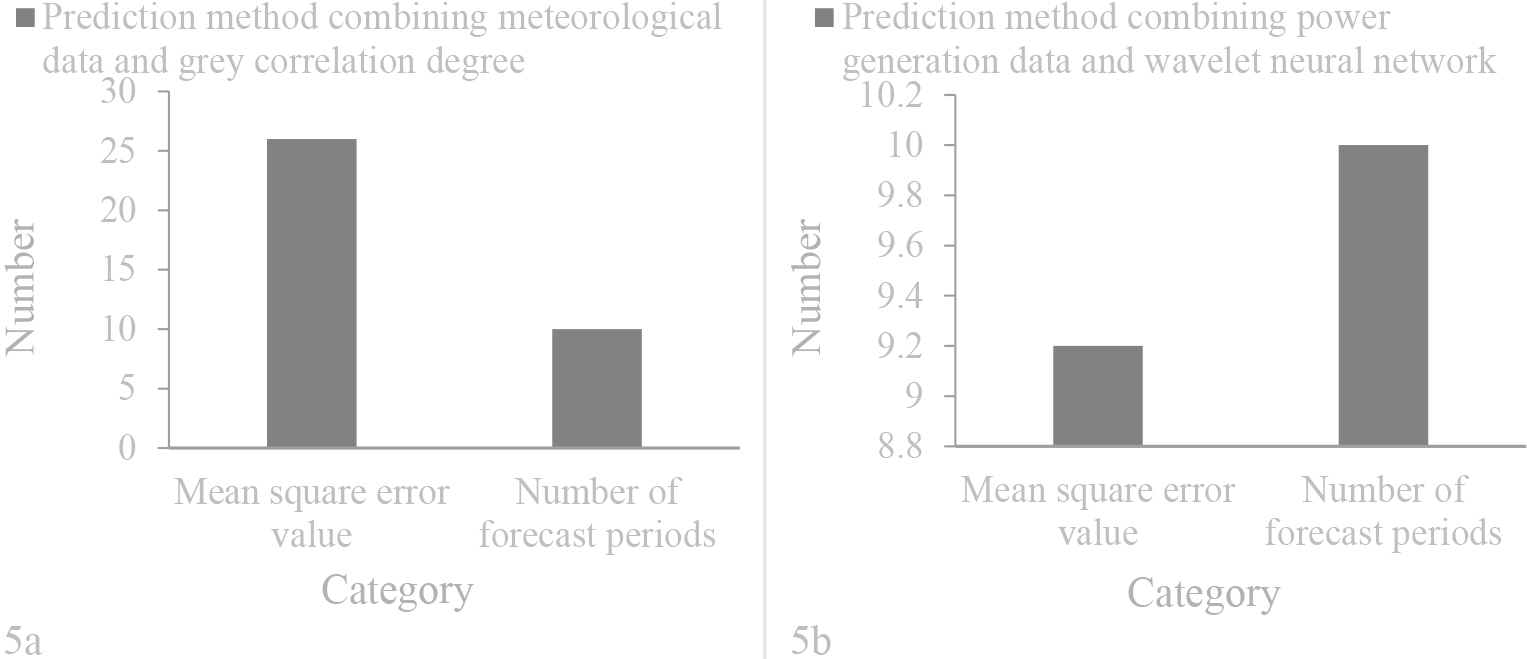
As shown in Fig. 5, it could be seen from 5a that the mean square error of PV PG value was 26 under the prediction method combining meteorological data and grey correlation degree. It could be seen from 5b that the mean square error of PV power value was 9.2 under the combination of PG data and wavelet NN prediction method. From the perspective of mean square error, the prediction method combining PG data and wavelet NN had more advantages.
The average value of absolute error was used to evaluate the two PV PG prediction methods, and the calculation results were shown in Fig. 6.
a: Average absolute error value under the prediction method combining meteorological data and grey correlation degree. b: Average absolute error under the prediction method combining PG data and wavelet NN. Average absolute error of prediction method.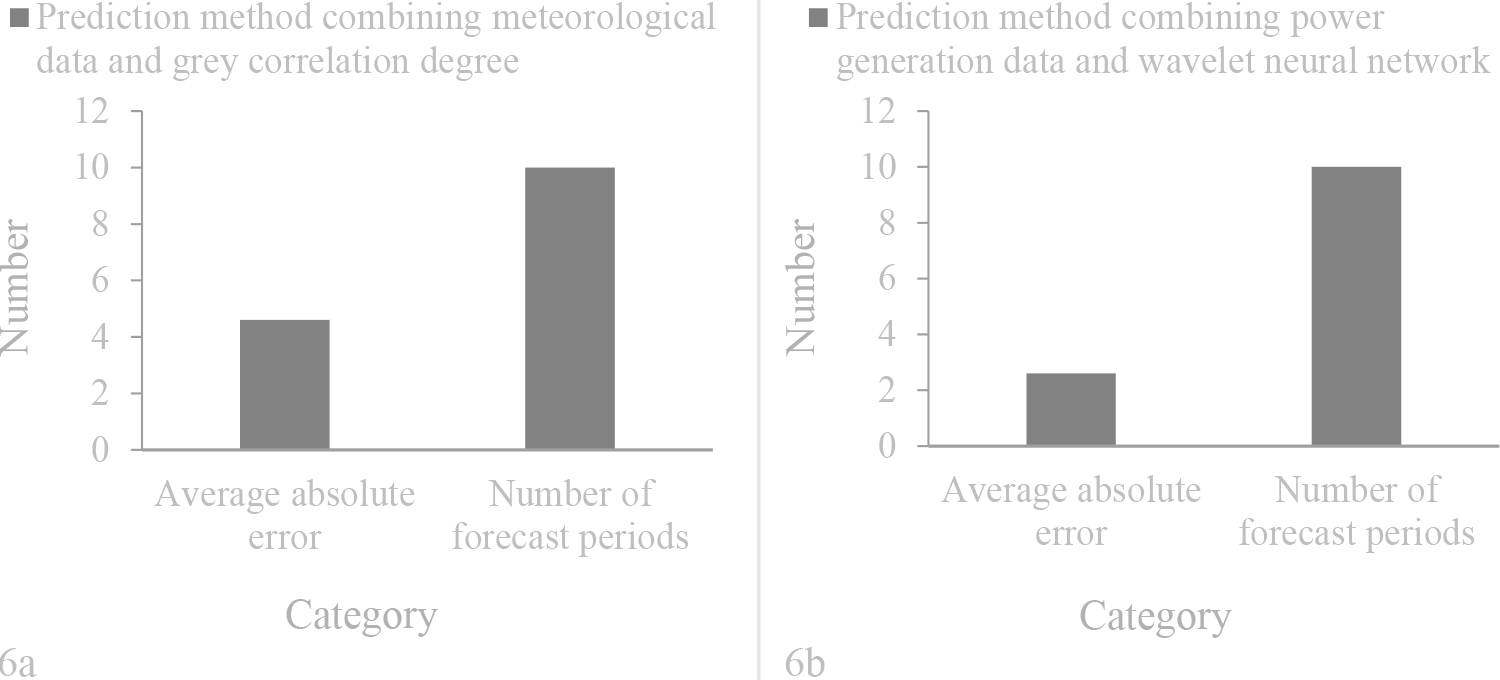
As shown in Fig. 6, it could be seen from 6a that the average absolute error of PV PG value was 4.6 under the prediction method combining meteorological data and grey correlation degree. It could be seen from 6b that the average absolute error of PV power value was 2.6 under the combination of PG data and wavelet NN prediction method. The average absolute error difference of the PV power generated by the two prediction methods was 2. From the perspective of the average absolute error, the prediction method combining PG data and wavelet NN could play a more important role in PV PG prediction.
In order to ensure the comprehensiveness of the experimental results, a certain rainy day was selected from the test set as the prediction day, and the power generation data for 10 time periods from 7:30 to 17:30 are shown in Table 3.
Power generation data during the rainy forecast period from 7:30 to 17:30
a: The prediction method combining meteorological data and grey correlation degree. b: The prediction method combining PG data and wavelet NN. Mean Square Percentage Error and Mean absolute percentage error.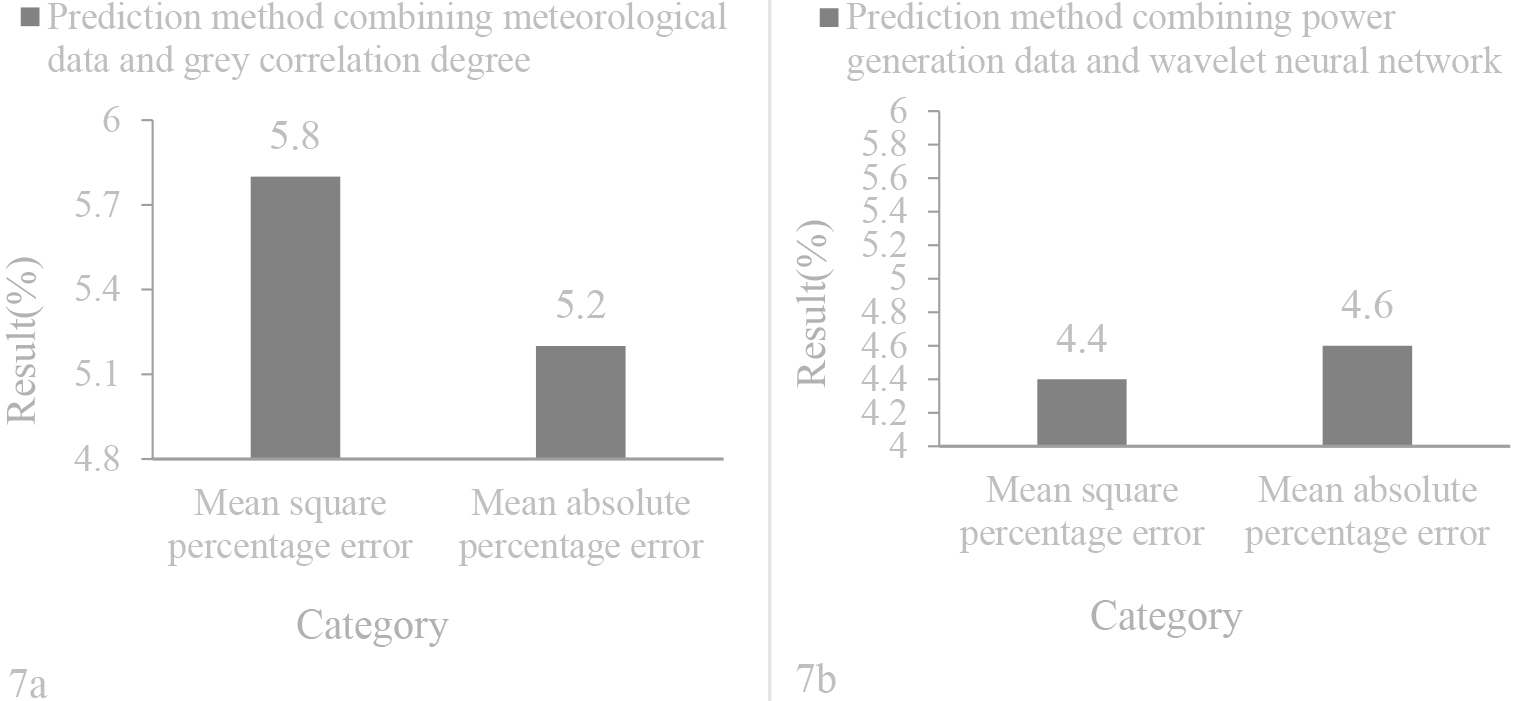
From Table 3, it can be seen that the overall photovoltaic power generation on cloudy and rainy days is lower than that on sunny days. In the prediction analysis, compared to the prediction method combining meteorological data and grey correlation degree, the prediction method combining PG data and wavelet neural network results are closer to the actual values.
In order to objectively compare the effectiveness of two types of methods in power generation prediction on cloudy and rainy days, this article analyzes them using Mean Square Percentage Error (MSPE) and Mean absolute percentage error (MAPE), and their calculations are expressed as follows:
The final result is shown in Fig. 7.
From the overall prediction comparison results in Fig. 7, it can be seen that the combination of PG data and wavelet neural network prediction method has a more ideal effect. In Fig. 7b, the mean square percentage error and average absolute percentage error of the prediction method combining meteorological data and grey correlation degree are 5.8% and 5.2%, respectively; In Fig. 7b, the mean square percentage error and average absolute percentage error of the prediction method combining PG data and wavelet neural network are 4.4% and 4.6%, respectively. From its results, it can be seen that compared to the prediction method combining meteorological data and grey correlation degree, the prediction method combining PG data and wavelet neural network also has significant advantages in predicting photovoltaic power generation in cloudy and rainy days.
This paper first introduced the PV PG system from the aspects of photoelectric element array, inverter, battery, controller, etc. PV PG system was divided into separate PV PG system and grid-connected PV PG system, and two PV PG systems were further introduced. Secondly, this paper studied the factors that affected PV PG from both internal and external factors, and summarized the factors that affected PV PG, including line loss, comprehensive loss, battery conversion efficiency, radiation intensity, temperature, humidity, and wind speed. Thirdly, this paper proposed two forecasting methods of PV PG, namely, the forecasting method combining meteorological data and grey correlation degree, and the forecasting method combining PG data and wavelet NN. Finally, this paper evaluated the effect of the two PV PG prediction methods, and drew the conclusion that both methods could predict PV PG.Although this article provides a reference for the study of photovoltaic PG power prediction, there are also limitations to this study. This paper only predicts PV PG on sunny and rainy days, and does not predict PV PG for other weather types. In future research, we will consider improving our research from the perspective of sample diversity to promote the intelligent development of the new energy industry.
Footnotes
Acknowledgments
This work is supported in part by the Science and Technology Project of State Grid Hebei Electric Power Co., Ltd. (kj2021-002).