
Abstract
With the rapid development of artificial neural networks, more sophisticated network models and more accurate prediction results are provided for solving engineering applications. In this paper, the weights and thresholds of the feedforward neural network model were optimized using the pelican algorithm, and the optimal solution was output by simulating the pelican predation scheme and assigned as the new parameters of the neural network. A POA-BP network model was proposed, and its better prediction was demonstrated by comparing the fitting and prediction performance with 13 neural network models such as random forest, support vector machine, and wavelet basis by evaluating metrics such as RMSE, MSE, and MAE. To further improve the prediction accuracy, different hidden layer topologies of POA-BP were compared, and the Monte Carlo method was used to obtain seven design variables for the lithium battery shell size parameters, and parameter regression prediction was performed for the structure after the variable density topology optimization used the isotropic material interpolation model (SIMP) with the moving asymptote method by invoking the MinGW-w64 compiler, and the 1-3-1 neural network was selected model to predict each dimension of the battery shell structure, the final shell weight reduction ratio was 18.12% and the first-order intrinsic frequency was increased by 14.56%.
Introduction
With the rapid development of modern technology, as people have a deeper understanding of the natural world, more and more bionic algorithms are applied to practical engineering design. Neural networks are used in a wide range of applications, including parameter prediction and regression analysis, 1 visual recognition and target tracking of blurred images,2,3 adaptive control and real-time monitoring,4,5 and intelligent interfaces and many more. To improve the accuracy of the prediction of engineering design parameters, most researchers have turned their research focus to the direction of optimizing artificial neural networks. The initialization of threshold and weights is the key to influencing the training and learning of neural network, therefore, people apply to change the weights of the neural network model as well as the endowment of the threshold by imitating the way of predation and hunting of natural creatures, to get the optimized neural network, which can be seen that the optimized neural networks are mostly characterized by fast training and high prediction accuracy. The optimized neural network models are applied to real engineering problems to verify their accuracy and reliability.
Ma et al. used ant colony algorithm, genetic algorithm, and difference algorithm to adjust the initial threshold and optimize BP neural network for predicting the trajectory of a vessel, which solved the defects of traditional neural network such as easy to fall into local minimum and obtained more accurate prediction effect6,7; Wei et al. used Monte Carlo to process the parameters of input variables and used multi-objective genetic algorithm to optimize the feed-forward neural network model by calculating the optimization weights, so as to find the optimal solution and use it to predict the driving speed of excavators, which is of great practical significance8,9; Li et al. proposed a model based on the grey wolf algorithm to optimize BP neural networks with two design variables as input values and one objective function as output value and compared the prediction results with traditional neural network models, which showed that the optimized errors were smaller and more accurate10,11; Yang et al. used the additional momentum method and particle swarm optimization to train the thresholds and weights of the BP neural network model, and verified the reliability of the new network by estimating the predictions of the Kalman filter12,13; to solve the problem of too many parameters, Zhang et al. used genetic algorithm to normalize the data of the BP neural network before optimizing it to improve robustness and accuracy, and to control the error within 1%.14,15
With the rise of oil prices and environmental pollution,16,17 the development of new energy vehicles is becoming more and more important, the most critical of which is its power core: battery pack as well as the shell, from reference to several kinds of literature, we can know that the mass of most BPE is thick and heavy, which makes them useless work done by electric vehicles increase and seriously affects the improvement of the range of electric vehicles, so the design of the dimensional parameters of its BPE structure The design of the dimensional parameters of the BPE structure will be particularly necessary.
In this paper, the pelican algorithm is used to introduce the fitness function to update the weights and thresholds of the BP neural network model. One hundred eighty-five data sets are used to compare the prediction performance such as the mean square error of POA-BP with 13 popular models trained respectively, and the better two groups are extracted. Sixty-five data sets are used again to further compare the better two groups to prove the accuracy of POA-BP.
Because the number of layers of the topology of the neural network model has an impact on the prediction accuracy, this paper compares the training fit of the 1-1-1, 1-2-1, 1-3-1, and 1-4-1 models, respectively, and get the topology of 1-3-1 with the best effect. This paper uses it for the engineering application of new energy vehicle battery shell processing size prediction. Three dimensional topology optimization using the MinGW-w64 encoder for prediction of the overall imitation Π-shaped battery shell.
Feed-forward (BP) neural network models
The artificial neural network is based on the biological brain after receiving external stimuli, simulating the response mechanism of receiving through the end of dendrites, as well as each neuron and nerve endings to produce neural conflict and respond accordingly and build the network structure, 18 neurons will process and fuse these signals, layer by layer transmission process, first construct the neural network model each neuron structure, this structure can be simplified into the input layer to the hidden layer to the output layer topology form, and each layer includes multiple neurons. The neural and BP neural network topology of the human brain is shown in Figure 1.

Neural and topological structure of the human brain: (a) nerve impulses pass through the human brain and (b) artificial neural network model.
BP neural network is a kind of forward feedback neural network, in which the adjustment and assignment of threshold and weight are reverted from the output layer to the input layer, while the error is in the opposite direction, which is the basic characteristic of BP neural network.
BP neural network model (BP-ANN) training key is adjusting the threshold of hidden layer and output layer, and the weights of each neuron in the error to be corrected when, as a kind of according to, and the error backpropagation from hidden layer to get the error of the assigned to each neuron, which is then according to the gradient descent (L–M) repeatedly in the form of training, Output the best training result until the error between the actual value and the predicted value is minimized.
To ensure the accuracy and efficiency of the results obtained, the Gauss-Newton iterative algorithm is usually adopted. However, this algorithm has defects, that is, the Jacobean matrix has full rank in the iterative process. Therefore, the training method of the sample model in this paper adopts the combination of L-M gradient descent and the Gauss-Newton algorithm. Therefore, formula (1) 19 is used for continuous correction of the above errors and weights, and the training of sample data is finally completed.

In the expression, J and w represent the related full-size Jacobian matrix, I represent the identity matrix, n represents the combinatorial coefficient, e represents the error and w represents the weight deviation between neurons.
In the L–M algorithm, the errors of the output layer and hidden layer in the model are calculated by the formula (2)–(4):


The expression y represents the output, t represents the expected output and j represents the neural network node.
After the training of sample data is completed, equations (5)–(6) are used to calculate the reverse Jacobian matrix:

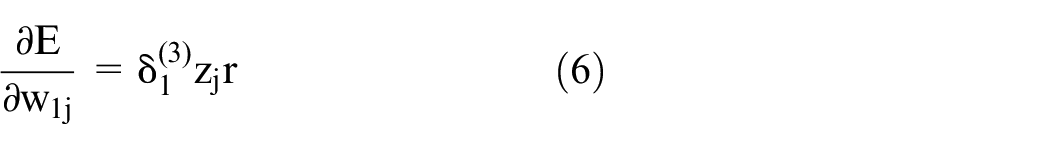
In the expression, i represents the neural network node, z represents the first-layer output, and E represents the error.
After the training error of the whole data set is corrected by the above calculation formula of sample data, the required training results of sample data can be obtained, and then the optimization target result value can be obtained by screening the results based on the corresponding optimization objective function set.
New energy vehicle power BPE
In this paper, this paper finds the power core battery pack and its shell of a new energy vehicle from the new energy vehicle factory near the practice base, use three-level scales to carry out solid weighing of the battery pack as a whole, use vernier calipers and other tools to carry out solid measurement of various sizes and carry out THREE-DIMENSIONAL modeling. The overall weight of the battery pack is measured to be 236 kg, and the first mode is 88.56 Hz. The field measurements show that the influence factors of quality of BPE size for the top and bottom shell thickness, the thickness of each of the lug around to remove parameters such as size, first mode modal is calculated by constraint modal analysis and finite element static analysis under the working condition of the bumpy road, get the stress and stress and displacement of size, each size parameters as the input of design variables, Mass (M), first-order modal frequency (F), stress (F1), and stress displacement (s) are taken as the output target scalars. The BPE physical object and 3D modeling are shown in Figure 2:

BPE physical drawing and 3D modeling simulation drawing.
Wherein, T1 (mm) represents the thickness of the lower shell; T2 (mm) represents the thickness of the rear side plate; T3 (mm) represents the cover thickness; L1–L4 (mm) represents the thickness of the lug (1–4).
Pelican optimization algorithm for BPE parameter fitting function test
By natural selection and survival of the fittest, organisms in nature have evolved different structures and optimal living and predation modes to adapt to different habitats, as shown in Figure 3. Trojovsky and Dehghani 20 invented a new bionic algorithm, the pelican Optimization algorithm, based on the predation modes of pelicans, and found the optimal search mode suitable for modern engineering from these predation modes and changed it. The optimal search algorithm used in this paper is the newly discovered pelican optimization algorithm, which is a new algorithm based on the way pelicans hunt and attack prey.

The way pelicans hunt.
The basic principle of the algorithm: Pelican in see prey, will be arranged in a semicircle is u-shaped driving fish to shallow water, or is a straight line shape their prey to the flank, the pelican mostly group collaboration, they will be near to prey from behind, because they have a long beak, therefore, the pelican with stretching its wings in the sky of the floating on the surface of the small fish, small fish forced to descend, They can catch them all at once, and highlight excess water. Skilled and clever hunting is the foundation of modeling pelican algorithms.
Mathematical modeling of pelican algorithm searching for prey
When searching for prey, pelicans first estimate the number of colonies. When searching for fish, the matrix of X represents each uncertain pelican individual, and the adaptability function is shown in formula (7):
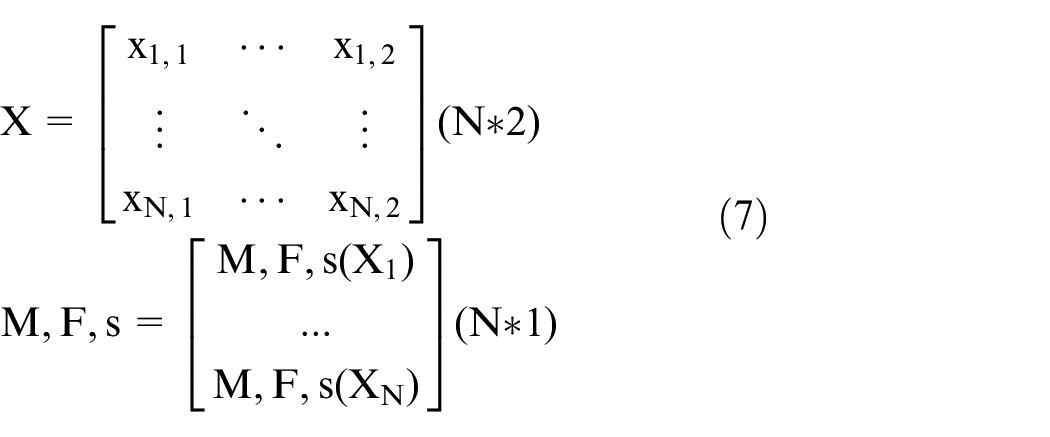
In the expression, this paper takes the two-dimensional population dimension; N stands for population number; M, F, and s represent the output mass, frequency, and stress respectively. In this paper, the optimal result of a one-dimensional target problem is searched through the nested model of population size with dimension two, and the search mathematical model is established as shown in formula (8):
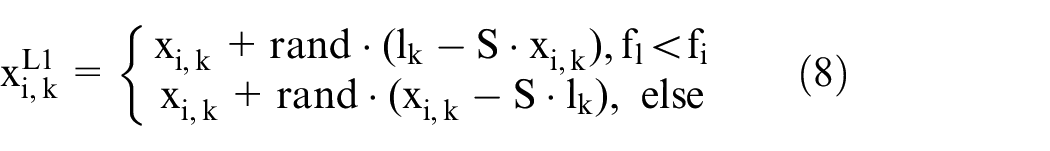
In the expression,
Mathematical modeling of prey capture process by pelican algorithm
The process by which pelicans force their prey into shallow water and catch them from below can be simplified into a mathematical model as shown in formula (9). 20

In the expression, R represents a fixed constant; t represents the current iteration algebra; T represents the maximum number of iterations.
After the above search and capture process, the pelicans will attack and hunt again, which is to perform iterative computation. To continuously update the optimal position is the best output variable, and the pelican flock needs to continuously perform position updates, replacing the original optimal position with the newly obtained optimal position based on the new selection of design variables and objective function values obtained above, and the iterative computation continues until the optimal solution is found. The iteration stops and the final computational result is output.
Pelican optimization algorithm test response surface optimization fitting function
In this paper, response surface optimization was used to accurately fit the function relations corresponding to the three output objectives and the selected design variables, and the pelican optimization algorithm was used to test the function. To avoid the situation where the dimension index is exceeded, this paper firstly classifies and selects the parameters of the battery shell that affect the quality, frequency, stress, and stress displacement of the battery shell, that is, firstly conducts sensitivity analysis. Design-expert software is used to classify the sensitivity of each objective function relative to the size of the selected seven design variables and carry out function fitting and prediction respectively. The accuracy of the fitting function can be proved by constantly debugging the generated function according to the precision of fitting until the fitting rate is higher than 95%. In this paper, the pelican population was set to 31, the maximum iteration was 5, and the iteration line graph was obtained.
Fitting function and function test
In this paper, quasi monte Carlo method is adopted to improve the Latin hypercube sampling design, establish the mathematical model of target variables for each design variable mapping, based on the variance,21,22 and sensitivity analysis to get the output target to the sensitivity of the input variables, the first-order sensitivity index, and the main effect index values, for different output target, Design variables choice is different, therefore, will have sensitivity to the different output target of each design variable data set, with the combined for seven design variables, respectively on the battery shell, shell plate, shell plate, after the two relatively according to lug around on size, thickness, as far as possible to avoid the above index dimension and reduce the computation time. In this paper, the seven groups of design variables are divided into two groups according to their influence on different output targets, discarding the variables with too small total effect index, which provides a basis for fitting function and optimization by the pelican algorithm. Combined with the engineering application of this paper using MATLAB test as follows. Through sensitivity analysis, the sensitivity index of the output target to each design variable is obtained, as shown in Figure 4:
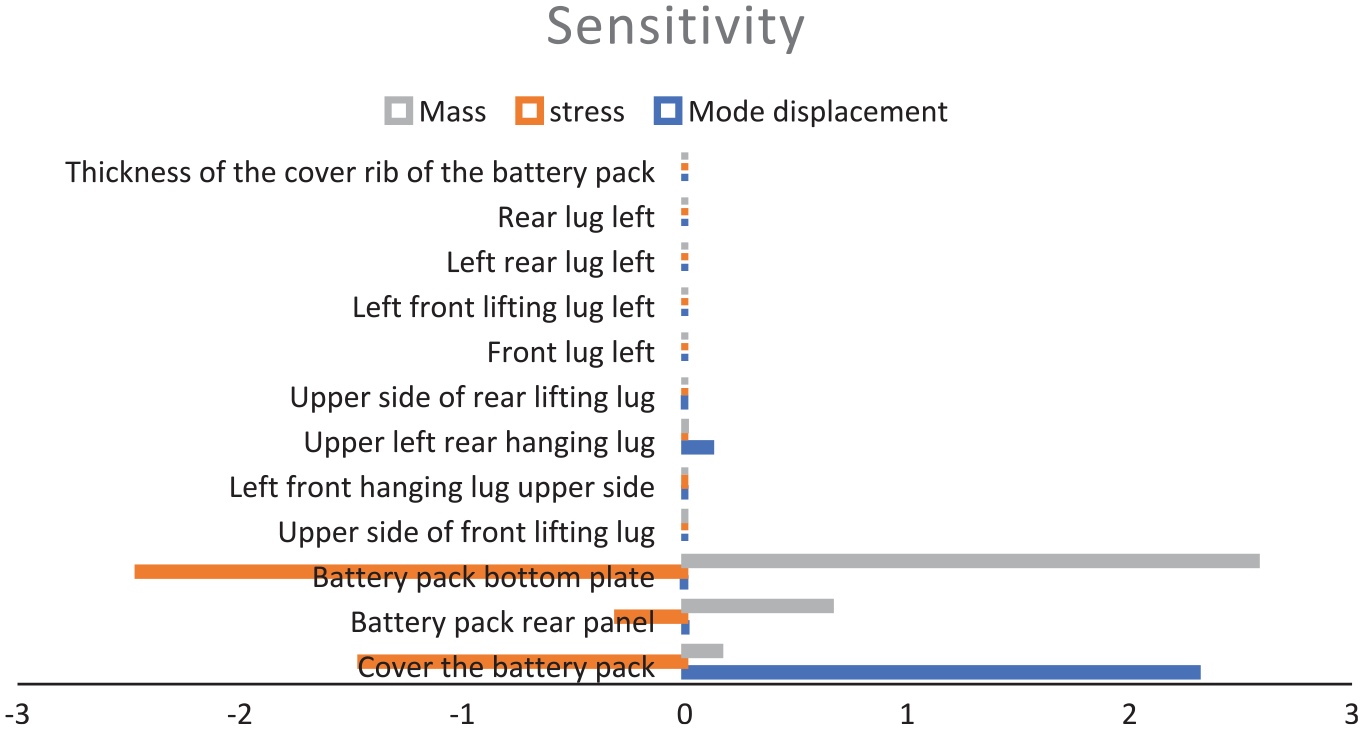
Sensitivity analysis.
Figure 4 can clearly express that the dependent variable is the output variable as the independent variable is each size parameter of the design change, can be seen from the sensitivity analysis results, that the biggest influence on the output target battery shell thickness on the battery shell, shell under the base plate and the thickness of the plate after each lug around seven variables such as the upper thickness as the design variable, this paper As can be seen from the figure, the quality of BPE, one of the three output target variables, has the highest sensitivity to the bottom plate and rear plate of the shell under the battery pack. The second BPE first order constrained modal frequency of the output target variable has the highest sensitivity to the thickness of the upper shell and the thickness of the upper layer of the rear lifting lug. The stress of output target no. 3 BPE under the condition of abrupt braking on a bumpy road is the most sensitive to the thickness of upper shell extraction and bottom plate of the lower shell, to determine the dependent variables of each fitting curve and the corresponding independent variables. The response map and pelican optimization algorithm combined with the fitting function of this paper is tested as follows.
Quality fitting function
Using multiple sets of orthogonal experiments, 23 the quality of the response of the two design variables changes the map, as shown in Figure 5(a), and the actual and estimated values of the fitting are as shown in Figure 5(b), a and b in the figure represent after plate under the battery shell and plate thickness, as can be seen from the Figure 5(b), most of the data points fall near the tropic of cancer, p-value of the obtained data is less than or equal to 0.0001, and the fitting accuracy is 99.2%, which proves that the fitting effect of the data model is good, indicating the rationality and accuracy of the model.

Quality response map and fitting accuracy: (a) quality response diagram and (b) quality actual and predicted fitting line graph.
The mass response Box-Cox power conversion curve is shown in Figure 6 For the data set that does not meet the normal distribution, the data conversion method adopted in this paper is generalized power transformation. By introducing an appropriate parameter λ, the data is modified to meet the normal linear regression characteristics.

The Box-Cox graph.
It can be seen from the figure that the optimal parameter λ = 1.05 and the current data λ = 1.00, indicating the rationality of the data model transformation in this paper.
It can be seen from the figure that the fitting degree between the predicted value and the actual value is 99.2%, and the prediction rate is higher than 95%. Therefore, this fitting function can accurately express the relationship between the two design variables, namely the dimension thickness of the rear plate of the battery shell and the dimension thickness of the bottom plate and the mass. The fitting formula is shown in formula (10):

Frequency fitting function
As mentioned in the previous section, the response surface was used to draw the response graph of frequency to the changes of the two design variables, as shown in Figure 7(a). The fitting of predicted and actual numbers is shown in Figure 7(b), in the figure, L1 and X3, respectively represent the thickness of the upper layer of the rear lifting lug of BPE and the thickness of the upper shell of the battery pack.
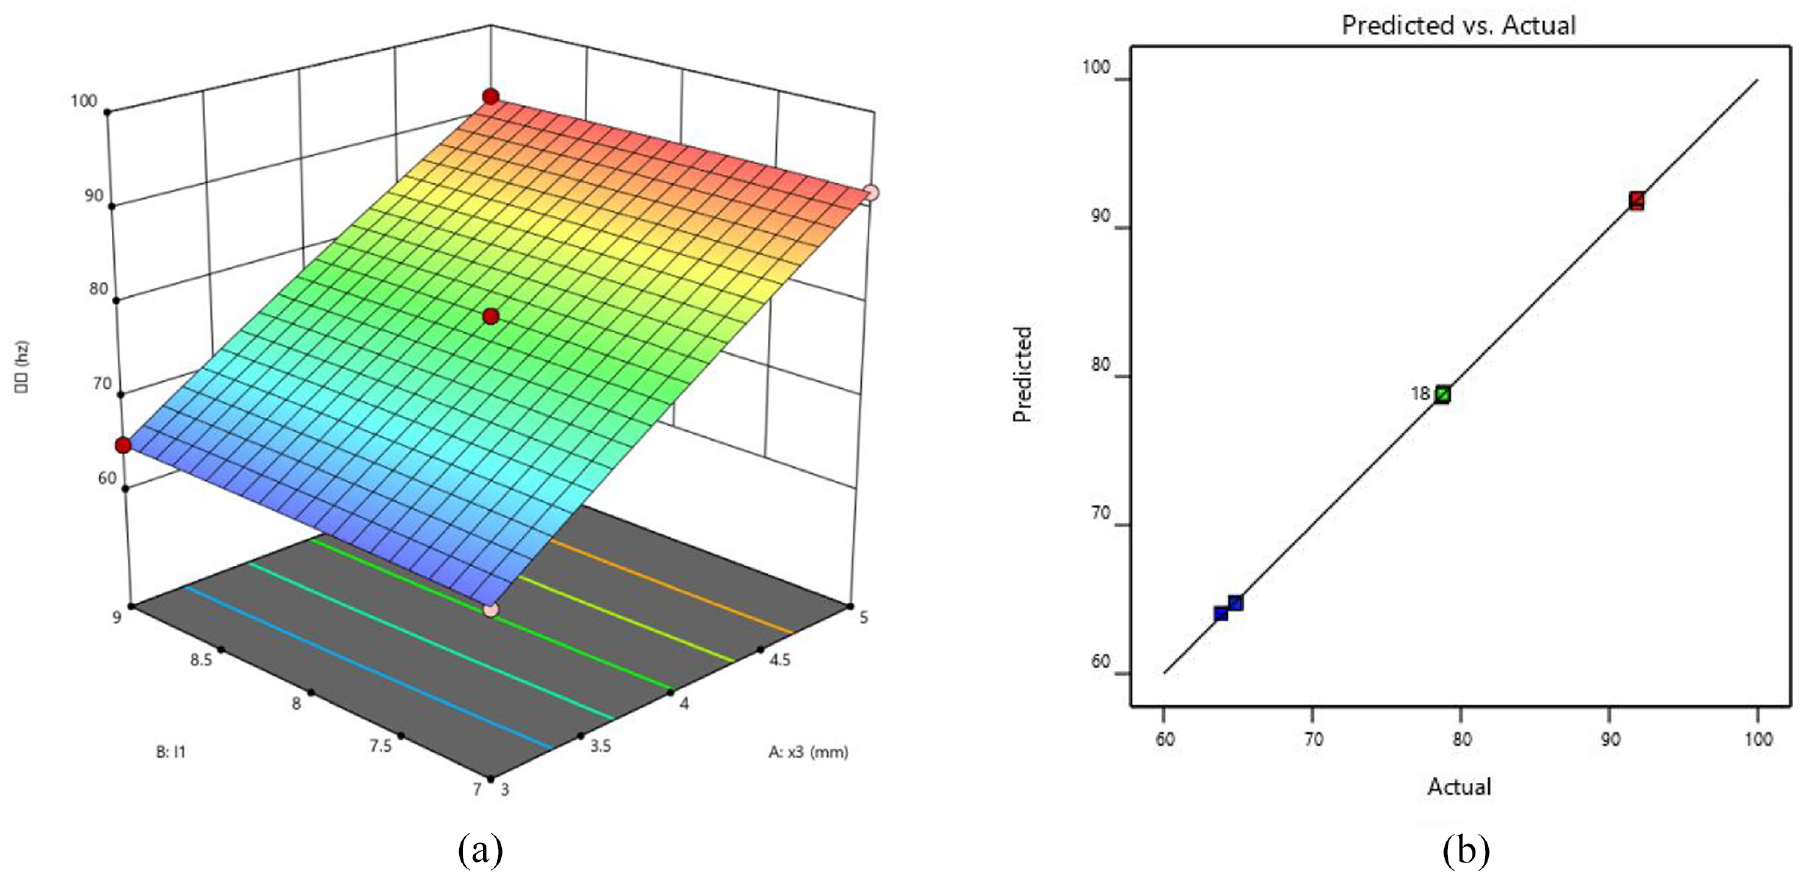
Frequency response spectrum and fitting accuracy: (a) frequency response diagram and (b) frequency actual and predicted fitting line graph.
As can be seen from the figure in the first-order modal frequency of the actual value and predictive value of the fitting degree, to some extent represents the rationality of selecting the data and the accuracy of the mathematical model is established in this paper, the selected 30 groups data point of the design variables are left on the fitting line, fitting accuracy can reach 99.8%, which proved the accuracy of the frequency mathematical model.
The fitting function can accurately express the relationship between the thickness of the upper shell of the battery pack and the thickness of the upper dimension of the rear lifting lug and the mass. The function expression between the selected design variable and frequency is shown in equation (11):

Stress fitting function
The stress analysis is as described in the previous section. Response surface was used to draw the response spectrum of frequency to the changes of two design variables, as shown in Figure 8(a). The fitting of the predicted value and actual value was shown in Figure 8(b), where A and B respectively represent the thickness of the extraction shell of the upper shell and the thickness of the bottom plate of the lower shell of the battery pack.

Stress response spectrum and fitting accuracy: (a) stress response diagram and (b) stress actual and predicted fitting line graph.
It can be seen from Figure 9(b) that all design variable points of the selected 30 data groups fall on the fitting line, and the fitting accuracy can reach 98.18%, proving the accuracy of this mathematical model.

Graph and mapping graph: (a) sensitivity of stress to design variables and (b) Box-Cox curve.
The mapping relationship between stress and design variables and the Box-Cox curve are shown in Figure 9(a) and (b):
It can be seen from the figure that the optimal parameter λ = −0.92 and the current data λ = 1.00, indicating that the transformation of the data model in this paper is reasonable to a certain extent.
The function expression between selected design variables and stress is shown in equation (12):

The fitting functions for the two design variables of mass are defined as independent variables, defined as X1 and X2, and the other dimensions of the battery housing variables are fixed values, and the pump housing dimensions are the battery housing thickness, while the dimensions are fixed for the thickness around the lugs, using this algorithm to calculate Equation 10 and perform training. The mapping of the mass output target to the two design variables is shown in Figure 10(a), and the number of mass iterations and the number of generations of iterations to reach the optimal state are shown in Figure 10(b). During the calculation of the frequency, the two design variables in the fitting function are defined as X3 and L1 as independent variables, and the other-dimensional variables of the battery case are defined as fixed values. The pelican algorithm is used to calculate and train equation (11). In the calculation of the stress, the two design variables in the fitting function are defined as X3 and X1 as independent variables, and the other-dimensional variables of the battery case are defined as fixed values. The pelican algorithm is used to calculate and train equation (12). The obtained results are shown in Figure 10.

Parameter space and iterative process: (a) quality response surface, (b) quality iteration diagram, (c) frequency response surface, (d) frequency iteration diagram, (e) stress response surface and (f) stress iteration diagram.
As can be seen from Figure 10, the data iteration between generation 2 and generation 2.5 is to find the optimal value between two points with a short computation time. The number of iterations is small, the optimization effect is good, and the defects such as falling into local minima and computational redundancy are avoided, which shows that the pelican optimization algorithm chosen in this paper is reasonable and effective. The mathematical model using the same frequency iterative calculation can be completed in a shorter time and fewer iterations, and also can quickly search for the optimal set of results, which conveniently and quickly proves the rationality of the stress pelican mathematical model and the superiority of the optimization algorithm. The mathematical model using the same frequency iteration calculation can be completed in a shorter time and fewer iterations, and also can quickly search for the optimal set of results, which conveniently and quickly proves the rationality of the stress pelican mathematical model and the superiority of the optimization algorithm.
Function testing section
This section in the size parameter design and selection, using the method of the control variables, using the pelican algorithm analysis training and prediction, the first to classify the size parameters of the design variables, can be seen from the sensitivity analysis, the influence factors of the objective function is the dimension of the size parameters of the design variables are two-dimensional, and the fitting function respectively using the pelican algorithm verification and calculation, From the generated graph, it can see the number of iterations, training effect, 3D graph of the dependent variable and independent variable of function, as well as the minimum value or maximum value point corresponding to the optimal output target variable.
Employing Design-Expert software, function extraction of fitting of three groups of output targets and input design variables is carried out. Pelican optimization algorithm is used for function testing, and three-dimensional graphs corresponding to the selected independent variables and output target-dependent variables are obtained, as well as the relationship between error analysis and iteration times. It can be seen that three groups of functions all reached the best after iteration to the second generation, which proved that the pelican optimization algorithm had a good effect on the data set optimization in this paper with less iteration time, proving its applicability and accuracy, and laid a good foundation for the improvement of BP neural network by using the pelican optimization algorithm in the following.
Optimization of BP neural network by pelican algorithm
As we all know, for the topological model of backpropagation (BP) neural network, 24 the most common algorithm to generate the bias and weight required by training is stochastic gradient descent. In this paper, the pelican algorithm is used to optimize BP neural network and the trained network is used for prediction. In short, Is on the backpropagation (BP) neural network in the process of communication and feedback in the bias and weights are further optimized, compared with the traditional gradient descent method of the threshold value and the weight of the initial assignment way, using the pelican algorithm to generate new weights and threshold to avoid local minimum value, and enhance the training and predicting accuracy and other advantages, The accuracy of the two kinds of training is compared and analyzed. It is equivalent to data migration. This paper uses the new bias and weight value calculated by the pelican algorithm to replace the old value, and to update the training results of the neural network.
Traditional BP neural network model training
Pre-processing of dimensional parameters for pure electric vehicle battery casing stamping
On the design parameters of the neural network model to predict before the first interpolation method is used to analyze the battery shell variable density topological optimization, by changing the microparticle to affect the change of structural parameters of the whole. The number of cells in this paper is large, which will lead to large matrix size, this paper has to improve the speed of sparse matrix operations, this paper calls the MinGW-w64 compiler to compile the mex file required for the sparse function, using the compiler compiled function can greatly reduce the computation time of the large matrix in this paper, as described in the previous section, the battery pack is equivalent to a rectangular geometry, set the constraints position and collision stress, and define the stiffness interpolation and iterative computation with the constraint objective of minimizing flexibility. This paper will be to simplify the structure of the pure electric vehicle power battery shell, it is simplified to equivalent geometry – cuboid, according to the constraint position and size of the original model, the same constraints are made on the equivalent topology optimization geometry, as shown in Figure 11(a), and the optimization results are shown in Figure 11(b). The 3D modeling simulation model is reconstructed according to the topology optimization results, as shown in Figure 11(c). The internal battery pack arrangement of the 3D model of the battery pack shell is shown in Figure 11(d).

Topology optimization results: (a) constraints and force position, (b) topological volume iteration diagram, (c) 3D modeling after optimization and (d) optimized after 3D modeling interior.
Based on the projection of topology optimization volume retention density given by MATLAB, type π staffers are set at the retention site to further design the battery shell to be predicted by stamping parameters, which lays a foundation for the selection and optimization of the following data set.
Traditional gradient descent algorithm
The neural network model is shown in Figure 12.

Neural network models.
The calculation method of the threshold value of each layer and total optimization dimension (DIM) in this paper 25 is shown in formula (13):

In the expression, the
In the process of improvement, the fitness function is assigned by employing variance. For neural network training, to solve the traditional gradient descent algorithm easy to fall into local minimum values, and the problem of slow training speed, this paper needs to improve the optimization algorithm of the BP neural network, which can be improved in many aspects, such as a change of learning rate and driving factor of the algorithm, by changing the weights and threshold to find the optimal. This paper imitates the pelican on prey will backpropagation method to form the pelican optimization algorithm of weight and threshold, the threshold value of each as well as the weights of superposition based on the former one is directly proportional to the threshold value, and the change of weight, and to carry on the backpropagation, continuous iterative calculation, this paper takes the reciprocal of weights of criteria to judge the learning rate, In the iterative process, if the output objective function is the same as the reciprocal quadrant, it will increase the learning rate; otherwise, it will decrease the learning efficiency. Due to the large span of the data set in this paper, to ensure the accuracy of the neural network model in learning and training and reduce the training time, this paper first normalizes the input and output data sets.
Description of the POA-BP methodology and comparison of training
The pseudo-code and flow chart of POA-BP (Figure 13, Table 1)

Flowchart.
Pseudo-codes.

Neural network model parameter settings and selection rules
The neural network parameters include the number of model layers, the number of network nodes in each layer, the minimum learning rate, the determination of the initial weights, the number of iterations, the minimum error of the training target, the rules for dividing the training set, the validation set, and the test set, etc. The advantages of the pelican algorithm: first of all, it has a higher ability to search for the optimal, and is closer to the global optimal, which has a better effect on finding the optimal in solving the single-peak function problem and is widely used in solving the minimum cost problem in mechanical engineering. Because the initialization of the set weights and thresholds is very arbitrary, which will lead to poor prediction, this paper introduces the fitness function, the mean square error (MSE) of 185 groups of samples as the objective function and calculate the value of the fitness function of the POA algorithm. Root mean square error (MSE) and correlation coefficients as rubrics and the equation 26 are shown in equation (14):
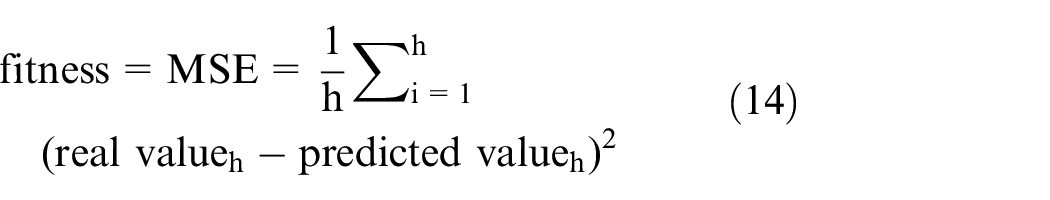
In the formula, h represents the number of individuals in the requested model.
The number of nodes in each layer of the network: this paper chooses seven-dimensional parameters as input, so the input layer is set with seven nodes, the mass, as well as the first-order intrinsic frequency, is chosen as output, so the output layer is set with two nodes, and the number of nodes in the hidden layer is determined by equation (15). 27

In the formula, O means the number of nodes in the hidden layer, o means the number of nodes in the input layer, and α means any value from 1 to 10.
Chen et al. proved by comparison positive that the initial weights of 0.01 are the most suitable, 28 so this paper set the initial weights to 0.01, where the learning rate, usually taken as a constant between 0 and 1, this paper set to the default value of 0.01 suitable for multilayer neural networks, 29 and the allowable error is set to 0.001, and when the non-convergence reaches the allowable error, this paper set the maximum number of iterations to 1000 times when the computation stops.
Initializing the parameters of the population size of the pelican (N), the maximum number of iterations (T), the dimension of the search space (S), and the upper and lower limits of the search position (l), the function expression is shown in equation (16).

The best predation location

In the formula, N represents the number of samples,
In 1990, Picard et al. 27 found that the division ratio of the training set, validation set, and training set, although not mandatory but has a certain impact on the evaluation performance, as can be seen from a large number of training studies on neural networks in recent years, most researchers have used a ratio of 80% for the training set and 20% for the rest.30,31 For BP-ANN and its derivative models, this paper uses the ratio of the training set, validation set, and test set 8:1:1 to divide them, and for other neural network models, this paper uses the ratio of the training set to test set 8:2 to divide them.
Neural network model parameter settings and selection rules
Since each dimensional parameter has a great influence on the overall mass, stress, displacement, and resonance frequency of a new energy cell shell, and the processing experiments are time-consuming and labor-intensive one by one, it is necessary to use the excellent prediction ability of machine learning to predict the dimensional processing parameters, thus requiring the neural network model to have a very high prediction accuracy. This paper set the input of the neural network model to seven-dimensional variables, which are the thickness of the upper shell, the thickness of the bottom plate of the lower shell and the backplate, and the thickness of the four upper layers of the eight lugs installed symmetrically around two by two; the output is the mass, and the simulation yields 185 sets of data. Although there are many excellent models of BP neural network optimization by bionic algorithm, and all of them have very outstanding optimization results in the corresponding fields, there are still different optimization effects for different experimental data sets. Therefore, for the processing prediction of outer shell size parameters of the new energy power battery in this paper, this paper chooses the pelican optimization algorithm that can solve qualified quasi-optimal solutions to optimize BP neural network, to obtain a new optimization model POA-BP. This paper compares it with the current popular 13 models such as whale algorithm (WOA-BP), genetic algorithm (GA-BP), particle swarm algorithm (PSO-BP), ant colony algorithm (ACO-BP), sparrow algorithm (SSA-BP), firefly algorithm (FA-BP), traditional gradient descent algorithm to optimize BP and support vector machine (SVM), random forest, wavelet basis (WNN), radial basis (RBF), and extreme learning machine (ELM), neural network models, as shown in Figure 14.

Some comparative plots of model training results (see appendix for details of the remaining subplots): (a) POA-BP, (b) PSO-BP, (c) WOA-BP, (d) GA-BP, (e) SVM and (f) ELM.
Because of the large order of magnitude differences between the data in this paper and the relatively small differences between equivalent orders of magnitude, this paper uses bar charts as well as groupings to express the differences between individual models, and this paper uses mean square error (MSE) root mean square error (RMSE), mean absolute error (MAE), coefficient of determination (R), mean absolute percentage error (MAPE), and symmetric mean absolute percentage error (SMAPE), as shown in Figure 15.

Comparison of the training effects of 13 groups of models.
Figure test set data and curve trends to show that from the evaluation indexes of seven prediction performances and fitting rates such as mean square error, it can be seen that the 13 neural network models with more prominent optimization effects are POA-BP and PSO-BP. To further prove the accuracy of the optimization effect of POA-BP, this paper also does multiple simulations on the battery pack shell to obtain a 65-group data set. To alleviate the overfitting phenomenon as well as to improve the prediction accuracy, this paper normalizes the data and used this data set to retrain two neural network models, using the same seven-dimensional parameters as input and two mass and frequency as output as described in the previous section to obtain the following results (Figure 16).

POA-BP versus PSO-BP fit: (a) PSO-BP and (b) POA-BP.
As can be seen from the figure, the training and learning effect of the two neural network models on the 65 data sets is compared, and the POA-BP neural network model fits about 9% more than PSO-BP overall, and the comparison is shown in Figure 17.

POA-BP versus PSO-BP training effect graph.
From the fitting accuracy in the figure, this paper can see that our proposed POA-BP neural network training fitting effect still has better results for small data sets, further proving the superiority seeking of this model.
Comparison of the structure of neural network models with different numbers of layers
From researchers’ studies,30,31 it can be seen that the number of layers of the hidden layer structure of the neural network affects the prediction accuracy of the overall model as well as the computing time, especially for the prediction of the processing parameters of a very complex mechanical structure such as a pure electric vehicle power pack, it is more necessary to increase the number of layers of the structure of the neural network to improve the accuracy of the prediction, but too many layers will increase the difficulty of the calculation. This paper set up a single input layer with an output layer and increase the single hidden layer in order according to a sequence of equal differences with a tolerance of 1. The number of input, output and hidden layer neurons is the same as described in the previous section, using a 122-group data set, and to reduce the training burden, 32 this paper set the number of neurons in all three hidden layers to be the same.
The fitting rate of Figure 18 shows that the training effect of the neural network model gradually becomes better when the total number of layers is from 3 to 5, and the accuracy of training starts to decrease when the total number of layers is 6. Therefore, this paper chooses three hidden layers with a single input and output layer, a total of five layers of POA-BP neural network structure for the final machining size parameter prediction.

Comparison of multi-layer neural network training performance: (a) A total of three layers of neural network, (b) A total of four layers of neural network, (c) A total of five layers of neural network, (d) A total of six layers of neural network and (e) Training of each division dataset.
The iterative calculation process of the BP neural network optimized by the pelican optimization algorithm is shown in Figure 19. It can be seen from the figure that the maximum number of iterations set in this paper is 1000 and the population number is 50.
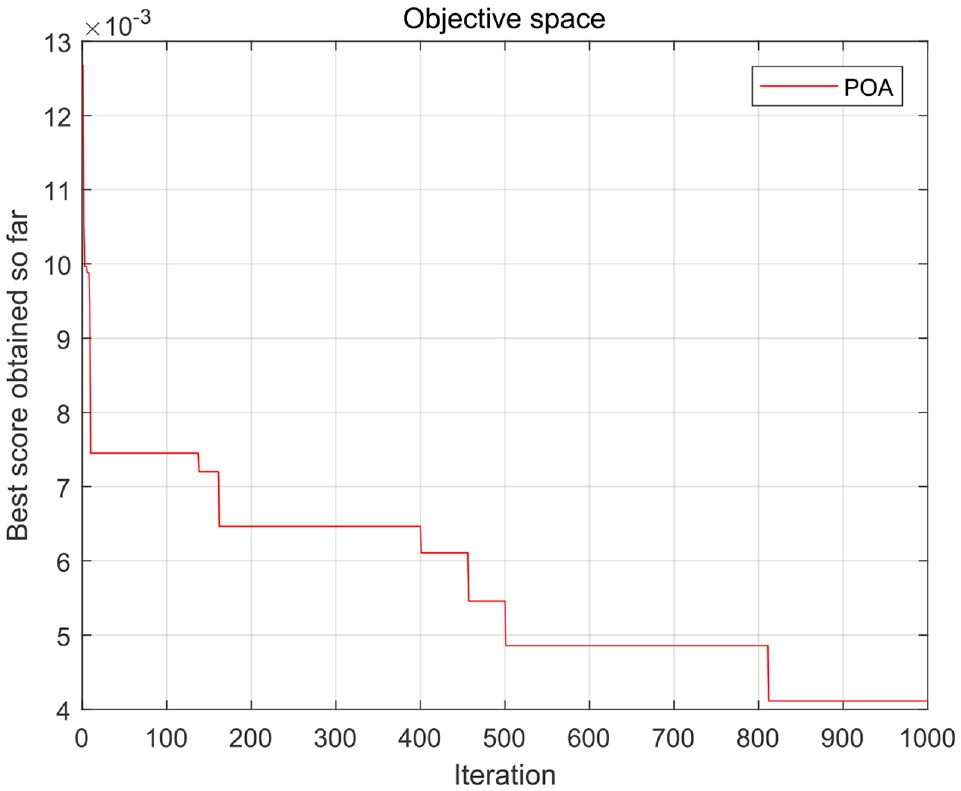
Pelican algorithm neural network iteration process.
As can be seen from the graph, the error is less than or equal to 0.0075 when the data is at the 20th generation and less than or equal to 0.004 at around the 810th generation. It can be seen that the pelican algorithm iterates quickly and can be used for the optimization of BP neural networks with the traditional gradient descent method.
The error of the traditional BP neural network is compared with that of the BP neural network optimized by the pelican algorithm. As can be seen from the cross-sectional third plot in Figure 14 - BP neural network test errors before and after, and the pelican algorithm proposed in this paper the optimized BP neural network training model error compared with the traditional BP neural network model training, not only has more obvious error size down, and all fluctuate around zero, training error data less volatile, change is relatively stable, therefore, The BP neural network model optimized by pelican algorithm has more accurate prediction effect and less training error, which proves that the optimization method proposed in this paper has certain forward-looking and practical.
As can be seen from the graph, the quality of output targets the actual value and the predicted values of the fitting degree of ideal, error distribution is relatively uniform, for output target frequency, in addition to individual units of the deflection error, the rest of the fitting degree of points are ideal, so are the pelican algorithm has the function of the neural network are optimized, and the effect is better.
POA-BP prediction and finite element simulation calibration
Comparison of the structure of neural network models with different numbers of layers
In this paper, the optimized neural network “net” is used to predict the size parameter data group. The data group randomly arranges and combines the seven design variables with a specific step size of 0.5 mm, forming hundreds of thousands of design variables experimental group. The pelican optimized BP neural network is used to predict. The calculation is shown in Formula (18).

In an expression Y representative predictive function, K represents the array found with a frequency greater than 70 Hz, and R and C represent rows and columns.
After using the trained network training, the first-order constraint mode (F) of constraint conditions is set to be greater than 70 Hz, namely, find(F > 70), and then the array with the lowest quality is found among these column numbers as the array of final prediction. Finally, this paper finds the best set of data: C1 = 4228 columns, R = 1, F = 103.2278 Hz; C2 = 2486 columns, R = 1, M = 186. 3392.
Finally, a group of optimization schemes is selected from 196,875 groups of data, as shown in Table 2:
The neural model predicts the optimal results and the error analysis.

According to the design variables and the choice of target quantity standard, the forecasting results of all parts of modeling analysis, through the finite element software quality and first-order frequency analysis and calculation comparison results, as shown in Table 2, optimization and simulation results of the error is within ±1.5%, conform to the requirements of the theoretical calculation, namely, the optimized prediction scheme has certain reliability and accuracy.
As can be seen from the table, this paper selects the 2486 group of data by integrating the finite element simulation results of quality and frequency, where the values of each design variable are [1.5, 1, 5, 7.5, 7, 7, 7] (mm). The corresponding frequency is 102.33 Hz and the mass is193.23 kg.
Structural safety checks for battery cases
From a large number of studies on mechanical damage scrapping, it can be seen that for most electrical components, the damage caused by the occurrence of resonance thus reaches 21%−30%, 33 especially for such machinery as electric vehicle battery housing, random vibration testing is performed to verify its safety as well as reliability. For mechanical structures battery packs as well as its shell, the resonance due to road excitation with its generation is more fatal than the damage caused by extrusion, this paper set the power density excitation spectrum of random vibration on the X-axis, Y-axis, and Z-axis 34 as shown in Table 3 (ISO 19453-6:2020).
Power spectral density of random vibration.

The power density of the three axes is input to the Random vibration module according to the data in Table 3, and the obtained stress and displacement clouds are shown in Figure 20.

Random vibration stress and displacement.
From the analysis results of random vibration, it can be seen that the probability of 3σ equivalent stress, that is, the root mean square value of stress, is 99.73%, and the 3σ equivalent stresses in X-axis, Y-axis, and Z-axis are 78.402, 69.853, and 79.134 MPa, respectively, all of which appear at the surrounding link lugs, which are much smaller than the stress limit of 210 MPa of material DC01, allowing The data has a large fluctuation space, which can be adapted to other complex working conditions, and the stress displacement is around 0.3 mm, and the visible deformation is also small, so it proves that the optimization effect is excellent, and the optimized battery shell has an excellent structure to bear the vibration caused by the excitation from the road, with high safety and reliability. The optimized BPE has a better anti-resonance ability, so the battery box has a better optimization effect and the ability to protect the internal power core battery pack of the new energy vehicle.
Summarizes
This paper proposes a new neural network model POA-BP. It is compared with 13 popular models to obtain the best performance. It is applied to the prediction of case size processing for new energy vehicle power stations. This paper uses a quasi-Monte Carlo method applied to a Latin hypercube sampling design. A mathematical model of the target variables mapped by each design variable is developed. A MinGW-w64 encoder is used for 3D topology optimization. The reinforcement is added to the lower shell by imitating the Π type. The five-layer POA-BP neural network model is used to accurately predict the seven dimensions. The results show that the errors are all within ±1.5%, proving its good prediction accuracy. The 3σ random vibration calculations for the optimized battery shell structure show that the optimized structure still has an adequate safety factor. The values for each design variable are [1.5, 1, 5, 7.5, 7, 7, 7] (mm). The optimization results in a corresponding increase in the frequency of 14.56% and a weight reduction of 18.122%.
Footnotes
Appendix

| Comparison of 13 kinds of neural networks in certain training learning results | |
|---|---|
| BP | ACO-BP |
| SSA-BP | FA-BP |
| WNN | |
| RBF | |
| Random forest | |
| BP neural network test errors before and after | |
Acknowledgements
In this section, you can acknowledge any support given which is not covered by the author’s contribution or funding sections. This may include administrative and technical support, or donations in kind (e.g. materials used for experiments).
Handling Editor: Chenhui Liang
Author contributions
First author, Y.G.; methodology and writing – original draft preparation, P.L., and C.W.; investigation, Conceptualization, N.L.; supervision and funding acquisition. All authors have read and agreed to the published version of the manuscript.
Declaration of conflicting interests
The author(s) declared no potential conflicts of interest with respect to the research, authorship, and/or publication of this article.
Funding
The author(s) disclosed receipt of the following financial support for the research, authorship, and/or publication of this article: This study was funded by [1. Open Fund project of Transportation Industry Key Laboratory of Vehicle Testing, Diagnosis and Maintenance Technology: “Structural optimization design of Vehicle Power Battery Pack,” JTZL2004; 2. A Project of Shandong Province Higher Educational Science and Technology Program, J18KA006].