
Abstract
This paper focuses on the application of deep learning (DL) based model in the analysis of novel coronavirus disease (COVID-19) from X-ray images. The novelty of this work is in the development of a new DL algorithm termed as optimized residual network (CO-ResNet) for COVID-19. The proposed CO-ResNet is developed by applying hyperparameter tuning to the conventional ResNet 101. CO-ResNet is applied to a novel dataset of 5,935 X-ray images retrieved from two publicly available datasets. By utilizing resizing, augmentation and normalization and testing different epochs our CO-ResNet was optimized for detecting COVID-19 versus pneumonia with normal healthy lung controls. Different evaluation metrics such as the classification accuracy, F1 score, recall, precision, area under the receiver operating characteristics curve (AUC) are used. Our proposed CO-ResNet obtains consistently best performance in the multi-level data classification problem, including health lung, pneumonia affected lung and COVID-19 affected lung samples. In the experimental evaluation, the detection rate accuracy in discerning COVID-19 is 98.74%, and for healthy normal lungs, pneumonia affected lungs are 92.08% and 91.32% respectively for our CO-ResNet with ResNet101 backbone. Further, our model obtained accuracy values of 83.68% and 82% for healthy normal lungs and pneumonia affected lungs with ResNet152 backbone. Experimental results indicate the potential usage of our new DL driven model for classification of COVID-19 and pneumonia.
Introduction
Novel coronavirus disease (COVID-19) created global pandemic [1, 2]. Most of the countries have been suffering from its effect since December 2019. Several common symptoms like cough, fever, dyspnea, sore throat, pneumonia, etc., are associated with it [3]. One of the common symptoms is lung infection or pneumonia [4, 5]. That can be detected by chest X-ray. Therefore, early diagnosis is required to break the spread of the coronavirus infection [6]. This can be a step for the preventive measure of COVID-19 [7, 61, 63]. Recently, the second wave of coronavirus has affected many countries [8]. Daily affected rate and death rates are increasing due to the second wave [9]. In current methods, there are various limitations for early detection and management of COVID-19. Many researchers in the world are contributing to develop an effective treatment and vaccines and to find applicable diagnostic techniques.
There are three diagnosis systems, such as blood tests, medical imaging, and viral tests [10]. The blood test can recognize the antibodies of severe acute respiratory syndrome coronavirus 2 (SARS-CoV-2) [11]. Moreover, antigens of coronavirus can be identified by viral tests. Reverse transcription polymerase chain reaction (RT-PCR) is a standard system for COVID-19 detection. However, it cannot rapidly detect coronavirus. Moreover, a number of studies show that the sensitivity of this test is 50 to 62% [12]. This indicates that the obtained results of RT-PCR can be inaccurate. Hence, multiple tests of RT-PCR are accomplished to ensure the correct results of this test [13]. Due to the lacking of RT-PCR in some countries, it can be costly diagnosis for people or healthcare authorities [14]. Therefore, we need an alternative process for COVID-19 detection. Next, artificial intelligence (AI) can support in the detection of SARS-CoV-2 from X-ray or other imaging like ultrasound or computed tomography (CT) scan.
Likewise, radiologic imaging such as X-rays, is usually applied to diagnose various lung diseases like pneumonia or other viral or bacterial infection. Furthermore, chest X-ray or CT images are deployed as coronavirus diagnosis [15]. The presence of virus is directly measured by RT-PCR. It has particularly high specificity, RC-PCR can provide the idea for diagnosing coronavirus disease. However, it cannot provide an idea about pneumonia or pulmonary fibrosis. The treatment of COVID-19 will be difficult, without the scanning of the chest by X-ray or other radiological processes. Nevertheless, X-rays may provide false-negatives values in some cases. It can merely identify any complications for some bacterial and viral infections. In [16], the authors reported that they detected COVID-19 from CT-scans, while RT-PCR provided COVID-19 negative. It was an early stage of COVID-19 affected patients where those scans comprise abnormalities and coronavirus recognition. Afterward, a research work compared the sensitivity of CT-scan images and RT-PCR of COVID-19 infected patients [17]. Studies have shown that CT-scan abnormalities and X-rays can be seen before symptoms appear even in the initial stages of coronavirus diseases [18]. Moreover, a later finding was offered by authors of [19], who exhibited that CT images have better sensitivity than RT-PCR. Therefore, they used CT-scan images for COVID-19 detection [19]. To meet this deficit, X-rays and CT-images are applied to identify and monitor COVID-19 patients with the help of RT-PCR tests. Several recent studies have provided substantial effort for recognizing COVID-19 from CT-scan images. Despite this benefit, CT-scan images are not usually employed owing to its unavailability and high cost of CT-scan machines in test centers and clinics. Because of the accessibility and proliferation of X-ray devices in developing nations, which are widely applied to analyze some other infections, chest X-ray images can efficiently be executed to diagnose COVID-19. Computer-aided diagnosis may assist radiologists or medical professionals in analyzing radiology due to the rapid integration and progress of AI in every field of life. Computer-assisted technology used for the outbreak of COVID-19 [20, 21, 22].
Several studies used deep learning (DL) methods for the detection, diagnosis of different diseases i.e., lung cancer, spine, skin cancer, brain tumor, gastric cancer, breast cancer etc. [23, 24, 25, 26, 27]. It used for image classification, segmentation, feature extraction etc. DL has been utilized for X-ray images, i.e., for lung images reconstruction and segmentation [28, 29], tuberculosis diagnosis [30] and pneumonia diagnosis [31]. Several researchers have proven accurate and effective respiratory disease diagnosis deploying chest radiology and DL [32, 39]. Recent DL models such as NASNet can also effectively classify the COVID-19 patients from CT scanned images [33]. Owing to a small number of radiologists for the massive number of coronavirus affected patients, AI-based diagnosis system is necessary for correctly diagnosis and to manage the COVID-19 pandemic. Though radiologists can play a key role owing to their extensive knowledge of X-ray images and CT-scans analysis, the involvement of DL systems in radiology can be useful in achieving accurate diagnoses. This automated system can timely assist to radiologists for finding infectious lung or COVID-19.
To address the benefits and challenges mentioned, we offer a DL-based model like residual networks for analyzing chest X-rays for COVID-19 patients. Apart from feature extraction, our model can efficiently determine COVID-19 or pneumonia or normal lungs. The proposed technique can assist radiologists accurately.
The key point of this experiments are as follows.
We formed a dataset of 5,935 chest X-rays, and the dataset was split into training and testing samples using holdout method. A new algorithm termed as optimized residual network for COVID-19 (CO-ResNet) was proposed by applying hyperparameter fine-tuning to traditional ResNet 101. We classified images for the case of suspected COVID-19, pneumonia infection and healthy lungs.
Example of the (a) normal, (b) pneumonia, and (c) COVID-19 experimental X-ray images [65].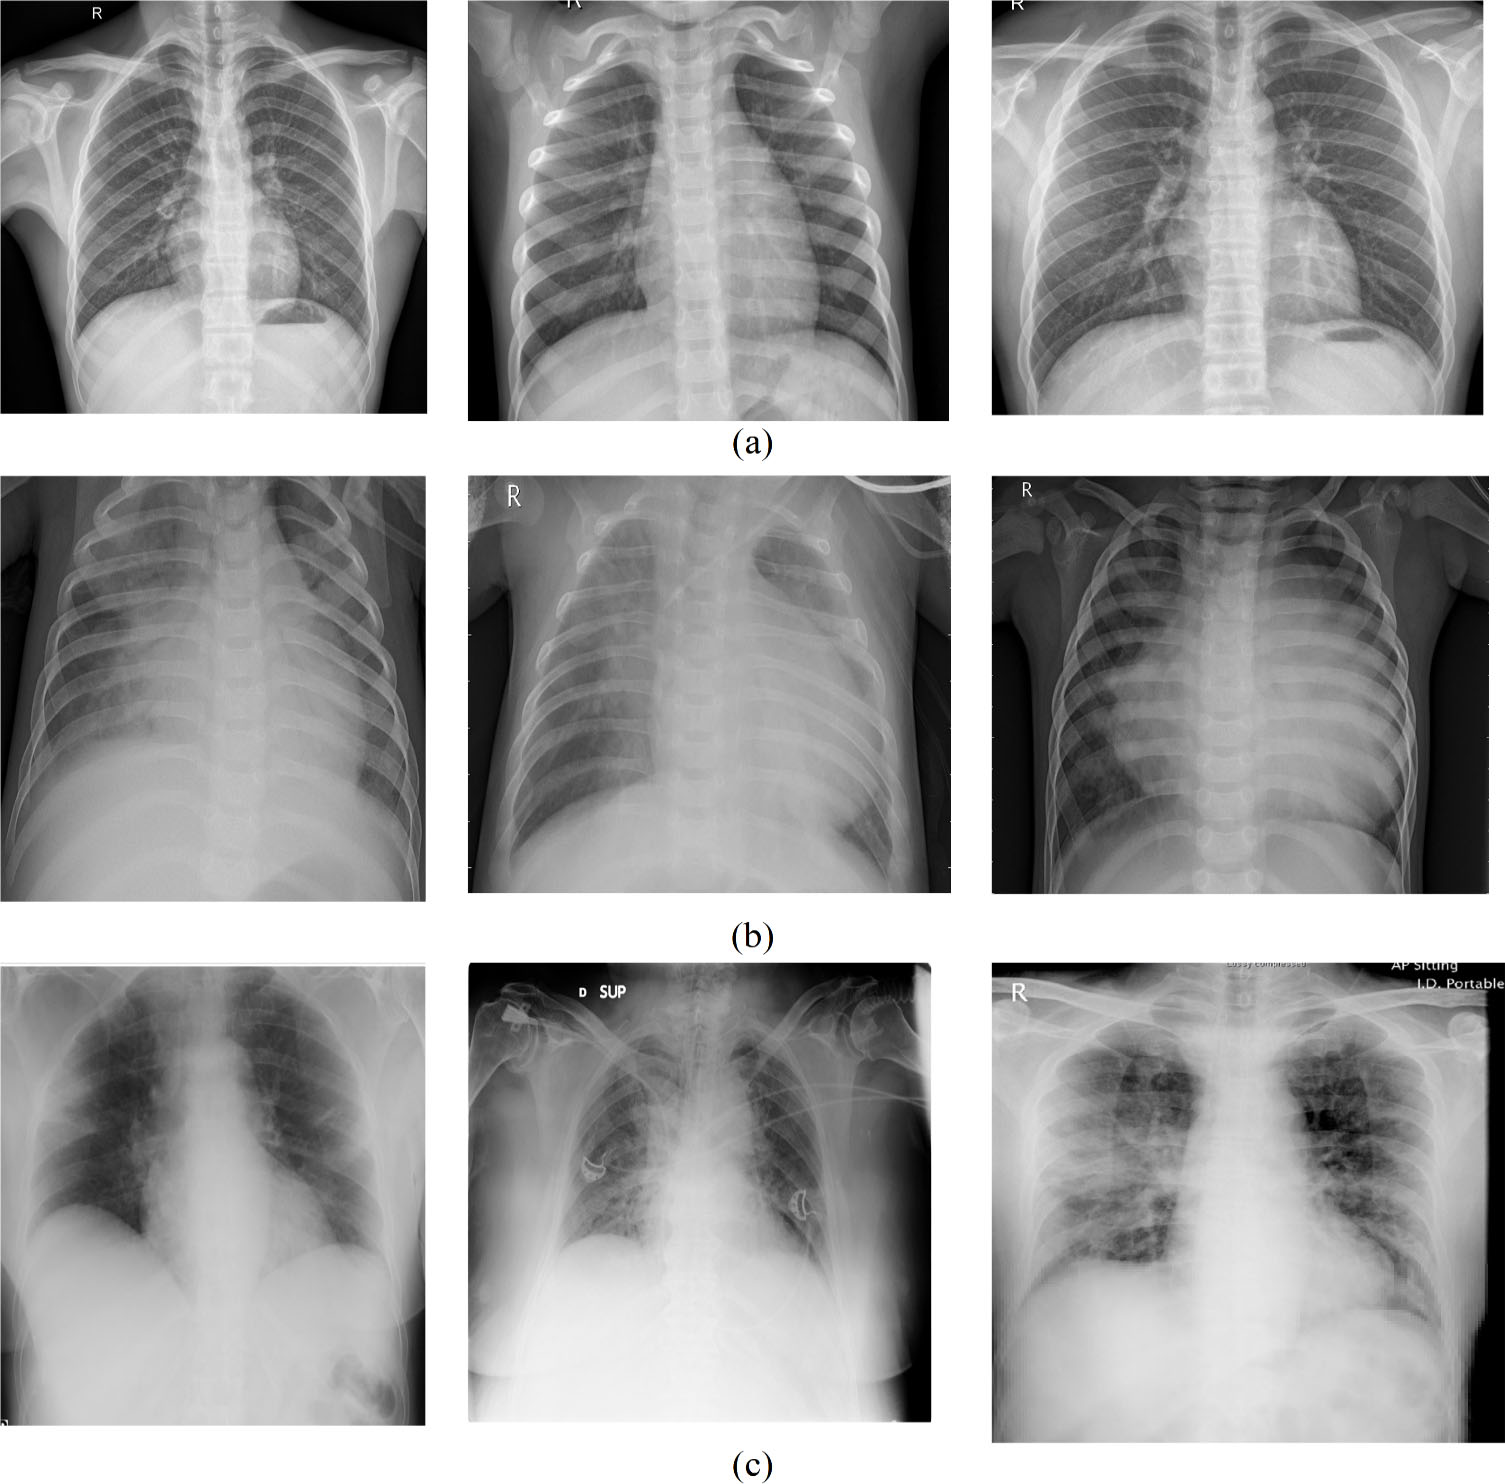
Methodology of proposed CO-ResNet method.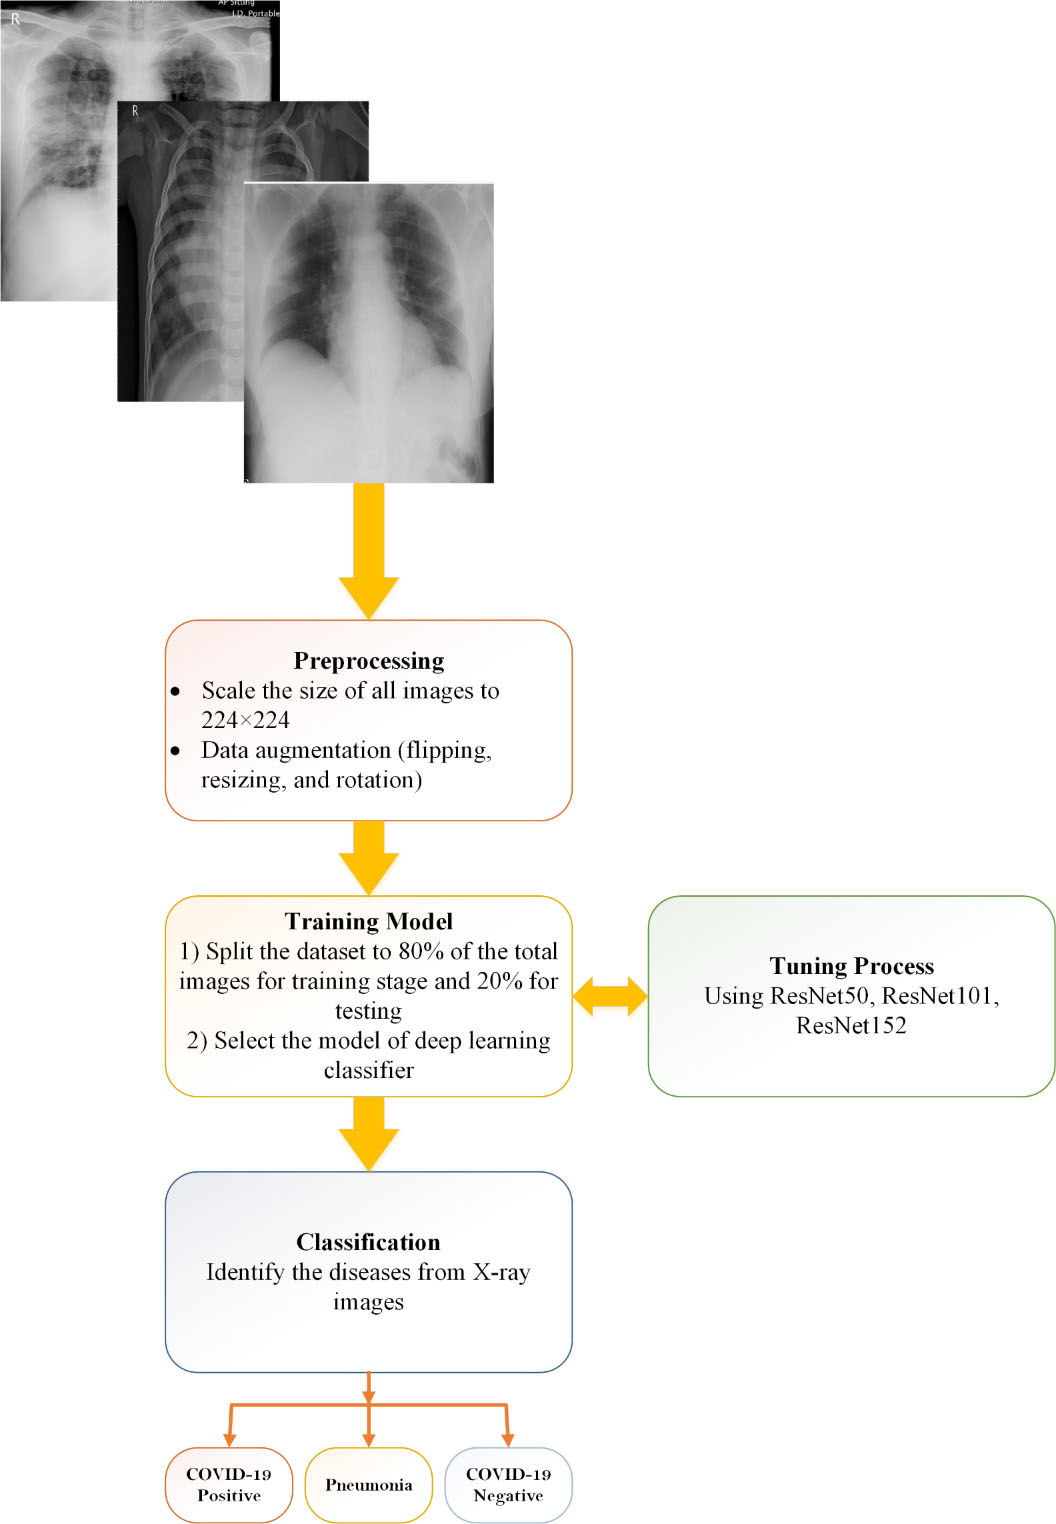
A significant number of papers on DL and X-rays were manifested in COVID-19 for detecting or diagnosis. Some noticeable studies will be pointed out in this section.
A recent work [33] developed a model named COVIDX-Net. This work contained a comparative study of various DL models including ResNetV2, VGG19, InceptionV3, DenseNet201, MobileNetV2, Xception, and InceptionResNetV2 for binary classification. They used 50 data samples of X-ray where 25 samples had COVID-19 and 25 samples had normal patients [33]. The achieving results of experiments were for two databases of COVID-19 X-ray [34]. It contains 123 X-ray images of lung anterior view and the data of [35]. The achieving accuracy was 90% for both DenseNet201 and VGG19 [33]. However, their using dataset was small, which was a limitation of this work. Similarly, ResNet50 and VGG19 models were applied for comparing the result with COVID-Net model [36]. The work [36] pre-trained ImageNet with Adam optimizer for classification of multiclass data including pneumonia, COVID-19 and normal cases. They obtained 93.3% accuracy which is better than the work mentioned previously. They used 13,975 X-ray images that were retrieved from multiple sources [34, 37, 38, 39, 40]. The dataset was imbalanced and data augmentation procedure was applied. Likewise, another work [41] applied VGG19 model. This work retrieved the dataset from four sources, including Ref [34, 38], SIRM [42] and Radiopaedia [43]. The number of pneumonia, normal and COVID-19 images were 700, 504 and 224, respectively. Experiments were presented with multiclass and binary classification. The highest accuracy was 98.75% for binary classification, where multiclass provided the highest accuracy of 93.48% [41]. In earlier studies [33, 36], VGG19 provided better results than other models with respect to accuracy. Next, the authors of [44] applied SVM and ResNet50 for COVID-19 classification deploying X-ray images. The using chest X-ray was accumulated from two dissimilar databases, including Kaggle [45] and Cohen [34]; although, they used 50 X-rays for experimental purpose. This study [44] achieved 95.38% accuracy for binary classification that was outperformed the results achieved by the work [33]. Additionally, DarkNet was proposed by the authors of [46]. This research work also used two datasets, including [34, 47] of X-ray in COVID-19 diagnosis for both multiclass (500 no-findings, 500 pneumonia, and 124 COVID-19) and binary (500 no-findings and 125 COVID-19) classifications. The DarkNet model consists of 17 layers’ convolution with a leaky ReLu. This model achieved 82.02% accuracy for multiclass. For binary class, DarkNet obtained 98.08% accuracy [46]. The authors of [50] proposed a modified Unet model where they presented their result with segmentation and without segmentation. They also utilized 18479 X-ray images where 3616 images were COVID-19 affected patients. The images they considered were retrieved from two independent databases. They classified lungs including healthy lungs, lung opacity and COVID-19 infected [50].
Brief of literature reviews
Brief of literature reviews
Despite these advantages, these models have a few limitations of X-ray images for COVID-19 diagnosis. Therefore, we propose CO-ResNet algorithms.
The experimental data was accumulated from two different open access sources. Chest X-ray images of normal patients and pneumonia affected patients was retrieved from the database of [45], where pneumonia affected X-rays were 4,273 images and healthy lung X-rays were 1583 images. After collecting these images, we collected COVID-19 affected X-ray images from the other dataset of [48] where the collecting images were 79 chest X-rays. The total X-ray images were 5,935. Afterward, we split the dataset into 80% training and 20 testing. Table 2 depicts a brief of our experimental dataset and Fig. 1 is an example of our sample dataset.
Summary of dataset splitting into training 80% and testing 20%
Summary of dataset splitting into training 80% and testing 20%
Figure 2 depicts the overall system of our proposed system. It has several stages of our experiments. Apart from the overfitting, normalization and resizing of X-ray images has performed to assist data generalization. Resizing image is 224
Proposed CO-ResNet
ResNet architecture [64].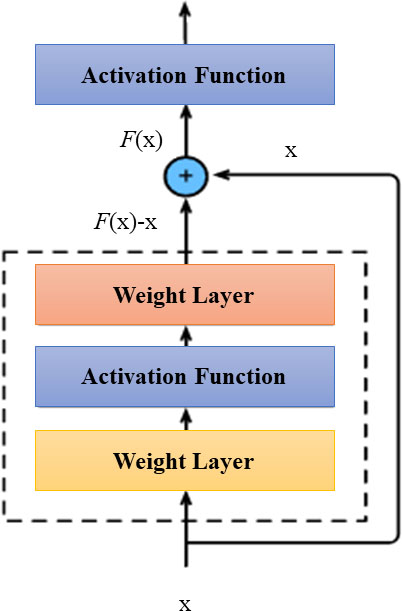
ResNet50 architecture.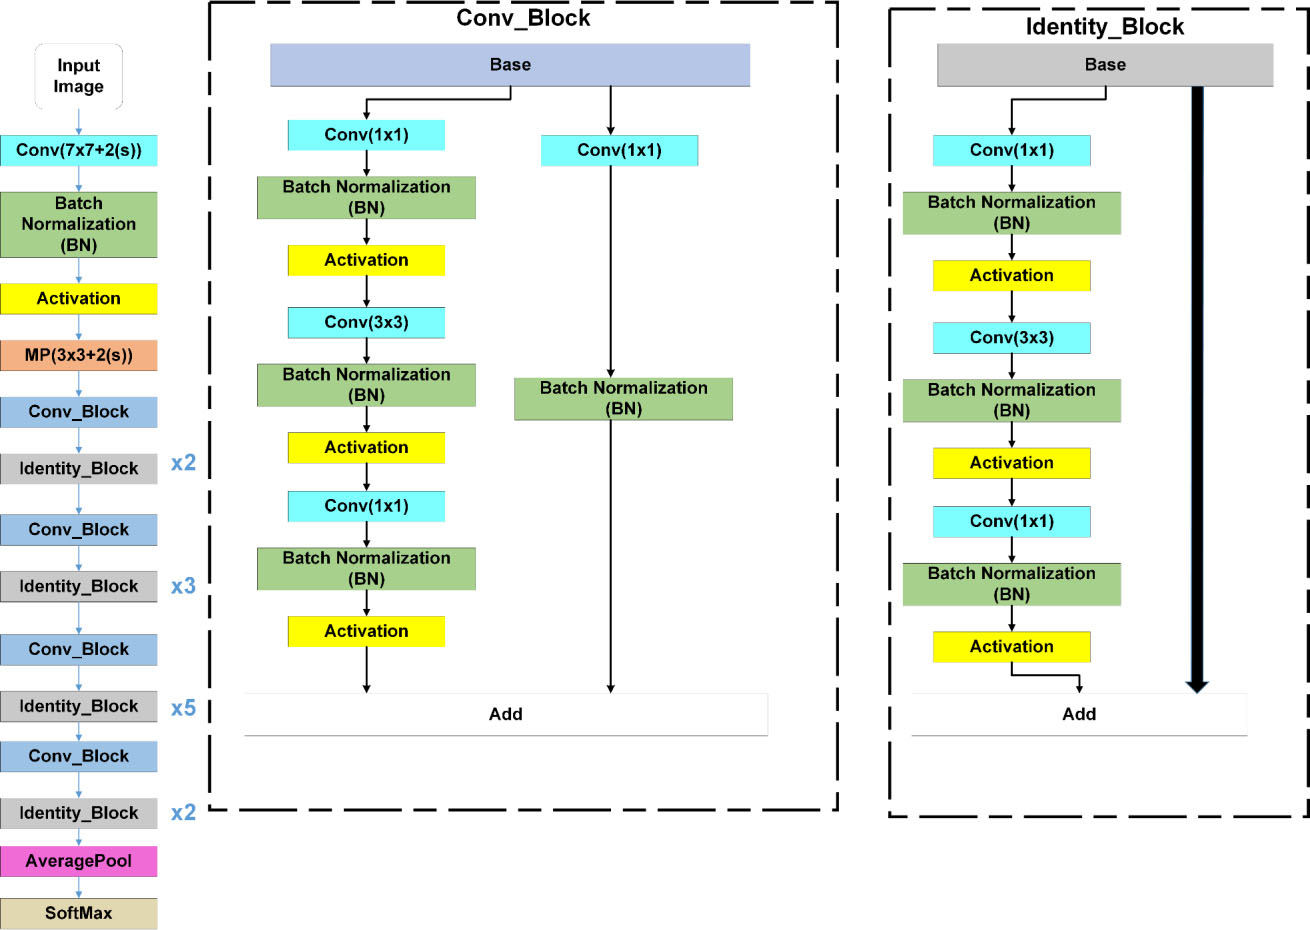
Our proposed CO-ResNet architecture.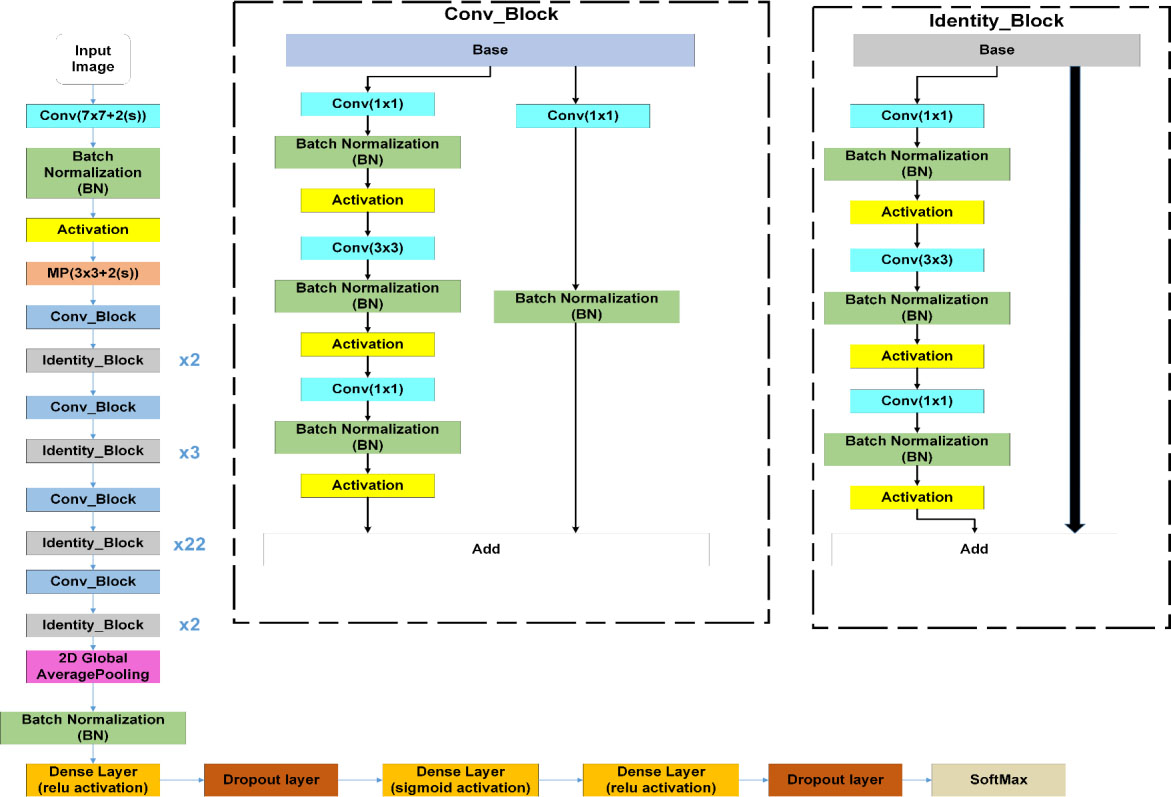
This subsection illustrates ResNet model with CO-ResNet. Figure 3 focuses a neural network like a ResNet architecture where the input is
The main components of CO-ResNet are convolutional layers, Activation unit, pooling, batch normalization, etc.
Convolution layer In neural networks, convolution layers perform the fundamental operation of extracting specific information from the input images. This convolution is performed using filters placed in successions. This layer produces feature maps from the input images. Activation function In a convolution neural network, a transformation is applied to the output of each convolution layers. This is to incorporate nonlinearity into the framework. One popular activation function is the ReLU function. This ReLU has low computational expense and has a good gradient convergence than other activation functions. The output of ReLU is zero if the input is negative, while the output becomes equal to input in case input is positive. Pooling layer A pooling layer is used to summarize the feature maps that are derived from convolution operations. This layer reduces the number of parameters that are considered during the training operation. This also ensures reduction in the computation time. Moreover, this layer contributes the control of the over-fitting operation. For the case of max-pooling, the output is the maximum value of the input element. On the other hand, in case of average-pooling, the output is the mean value of the input element. Batch normalization layer The test of batch normalization is to improve the quality of convergence during the training period. This layer regularizes the output of the previous layer. One advantage of this layer is to allow the use of a higher learning rate.
Recall curve on the basis of 30 epochs for (a) ResNet50, (b) CO-ResNet, (c) ResNet152.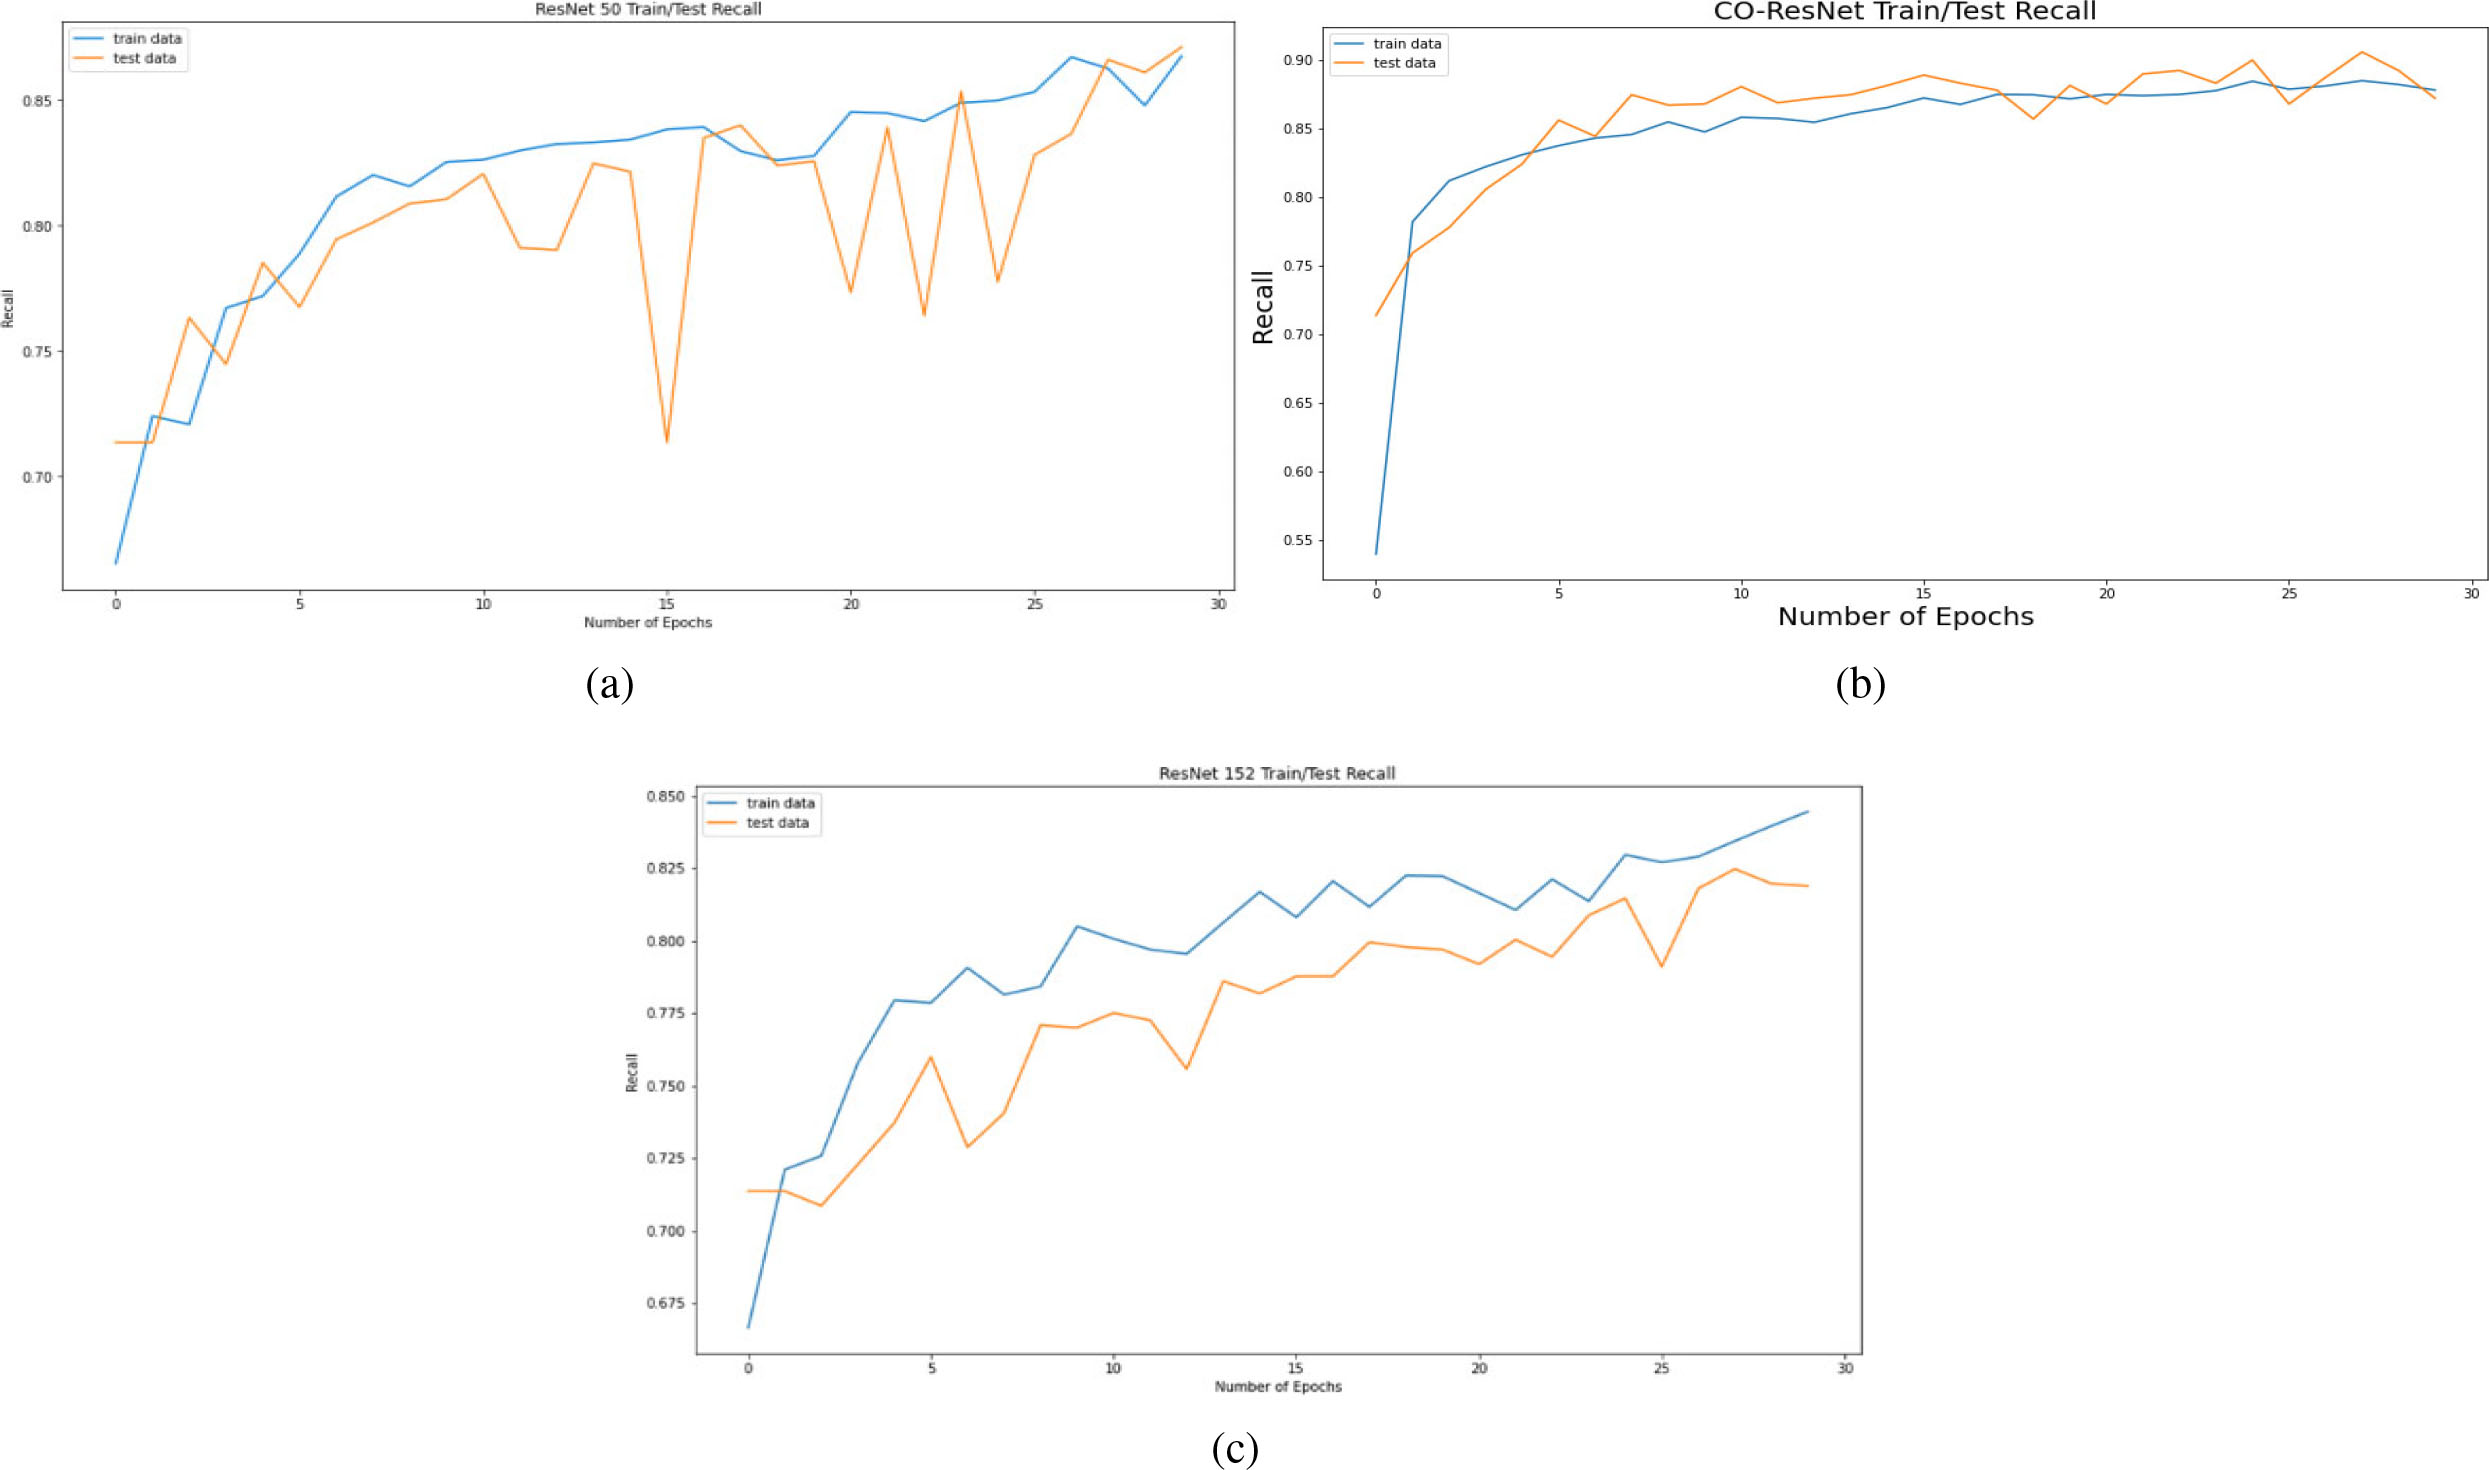
This section describes the experiments and the results obtained. The experiments were performed by Google Colaboratory, known as Colab. The Colab can ensure a service with K80 GPU (Tesla). The 12 GB NVIDIA can ensure an operation of 12 hours.
Google Collaboratory is a cloud-based open-source platform distributing knowledge as Jupyter notebook for DL. We used this cloud-based service for experimental purposes. Moreover, for the experiment, Sklearn, numpy, Tensorflow and Matplotlib were deployed as libraries. In the experiments, an optimizer known as Adam was considered for the case of a learning rate (at initial phase) of 0.002. The training of the model was performed done using a dynamic learning method. The learning rate was reduced when the improvement phase stops. This is done using ReduceLROnPlateau. The experiments were carried out for the case of a number of parameter values, including factor as 0.5, patience as 10, and minimum learning rate of 10
where, the number of chest X-ray samples are indicated by
Next, data preprocessing, image normalization, and data augmentation are described. First, consider data preprocessing. This preprocessing improves the training operation with visual capacity. A number of factors can improve visual capacity. These are the increase in contrast, the removal of high/low spatial frequency components and the reduction of the noisy component in the images. In this work, changing the size of the images to 224 by 224 pixels, and normalizing the intensity of the images are performed as part of preprocessing. In intensity normalization [62], the intensity of the image pixels is normalized from their original 0–255 values to a normal distribution using ‘min-max normalization’ technique. In this way the bias element is removed achieving uniform distribution. This uniformity can accelerate the convergence of the Co-ResNet algorithm.
Data Augmentation: For training a model, data augmentation is used, resulting in the diversity of the images. Some of the augmentation methods used in this paper are padding, horizontal flipping, cropping, which can be used to remove overfitting of the data.
Transfer Learning: The proposed CO-ResNet model uses transfer learning which is the process of reusing the learning from a base model to a target model. The starting point of the target model can get contributions from a previously trained model. It is often considered as an optimization technique saving time and achieving better performance. This is useful when the features are general, which means these are suitable for the base dataset and the target dataset, rather than being suitable only for the base task. The transfer learning can save resources like computing power and time. There are two types of transfer learning operation. Firstly, to remove fixed features and after that the model is trained using the data at the middle layer. Secondly, to fine tune the data samples. The CO-ResNet uses the net weights of ResNet 50, ResNet 101 and ResNet 152 and replaces the fully connected layer placed at the end. Moreover, dense and regularization layers are taken into consideration.
Performance evaluation of ResNet50
Performance evaluation of CO-ResNet
Performance evaluation of ResNet152
Precision curve on the basis of 30 epochs for (a) ResNet50, (b) CO-ResNet, (c) ResNet152.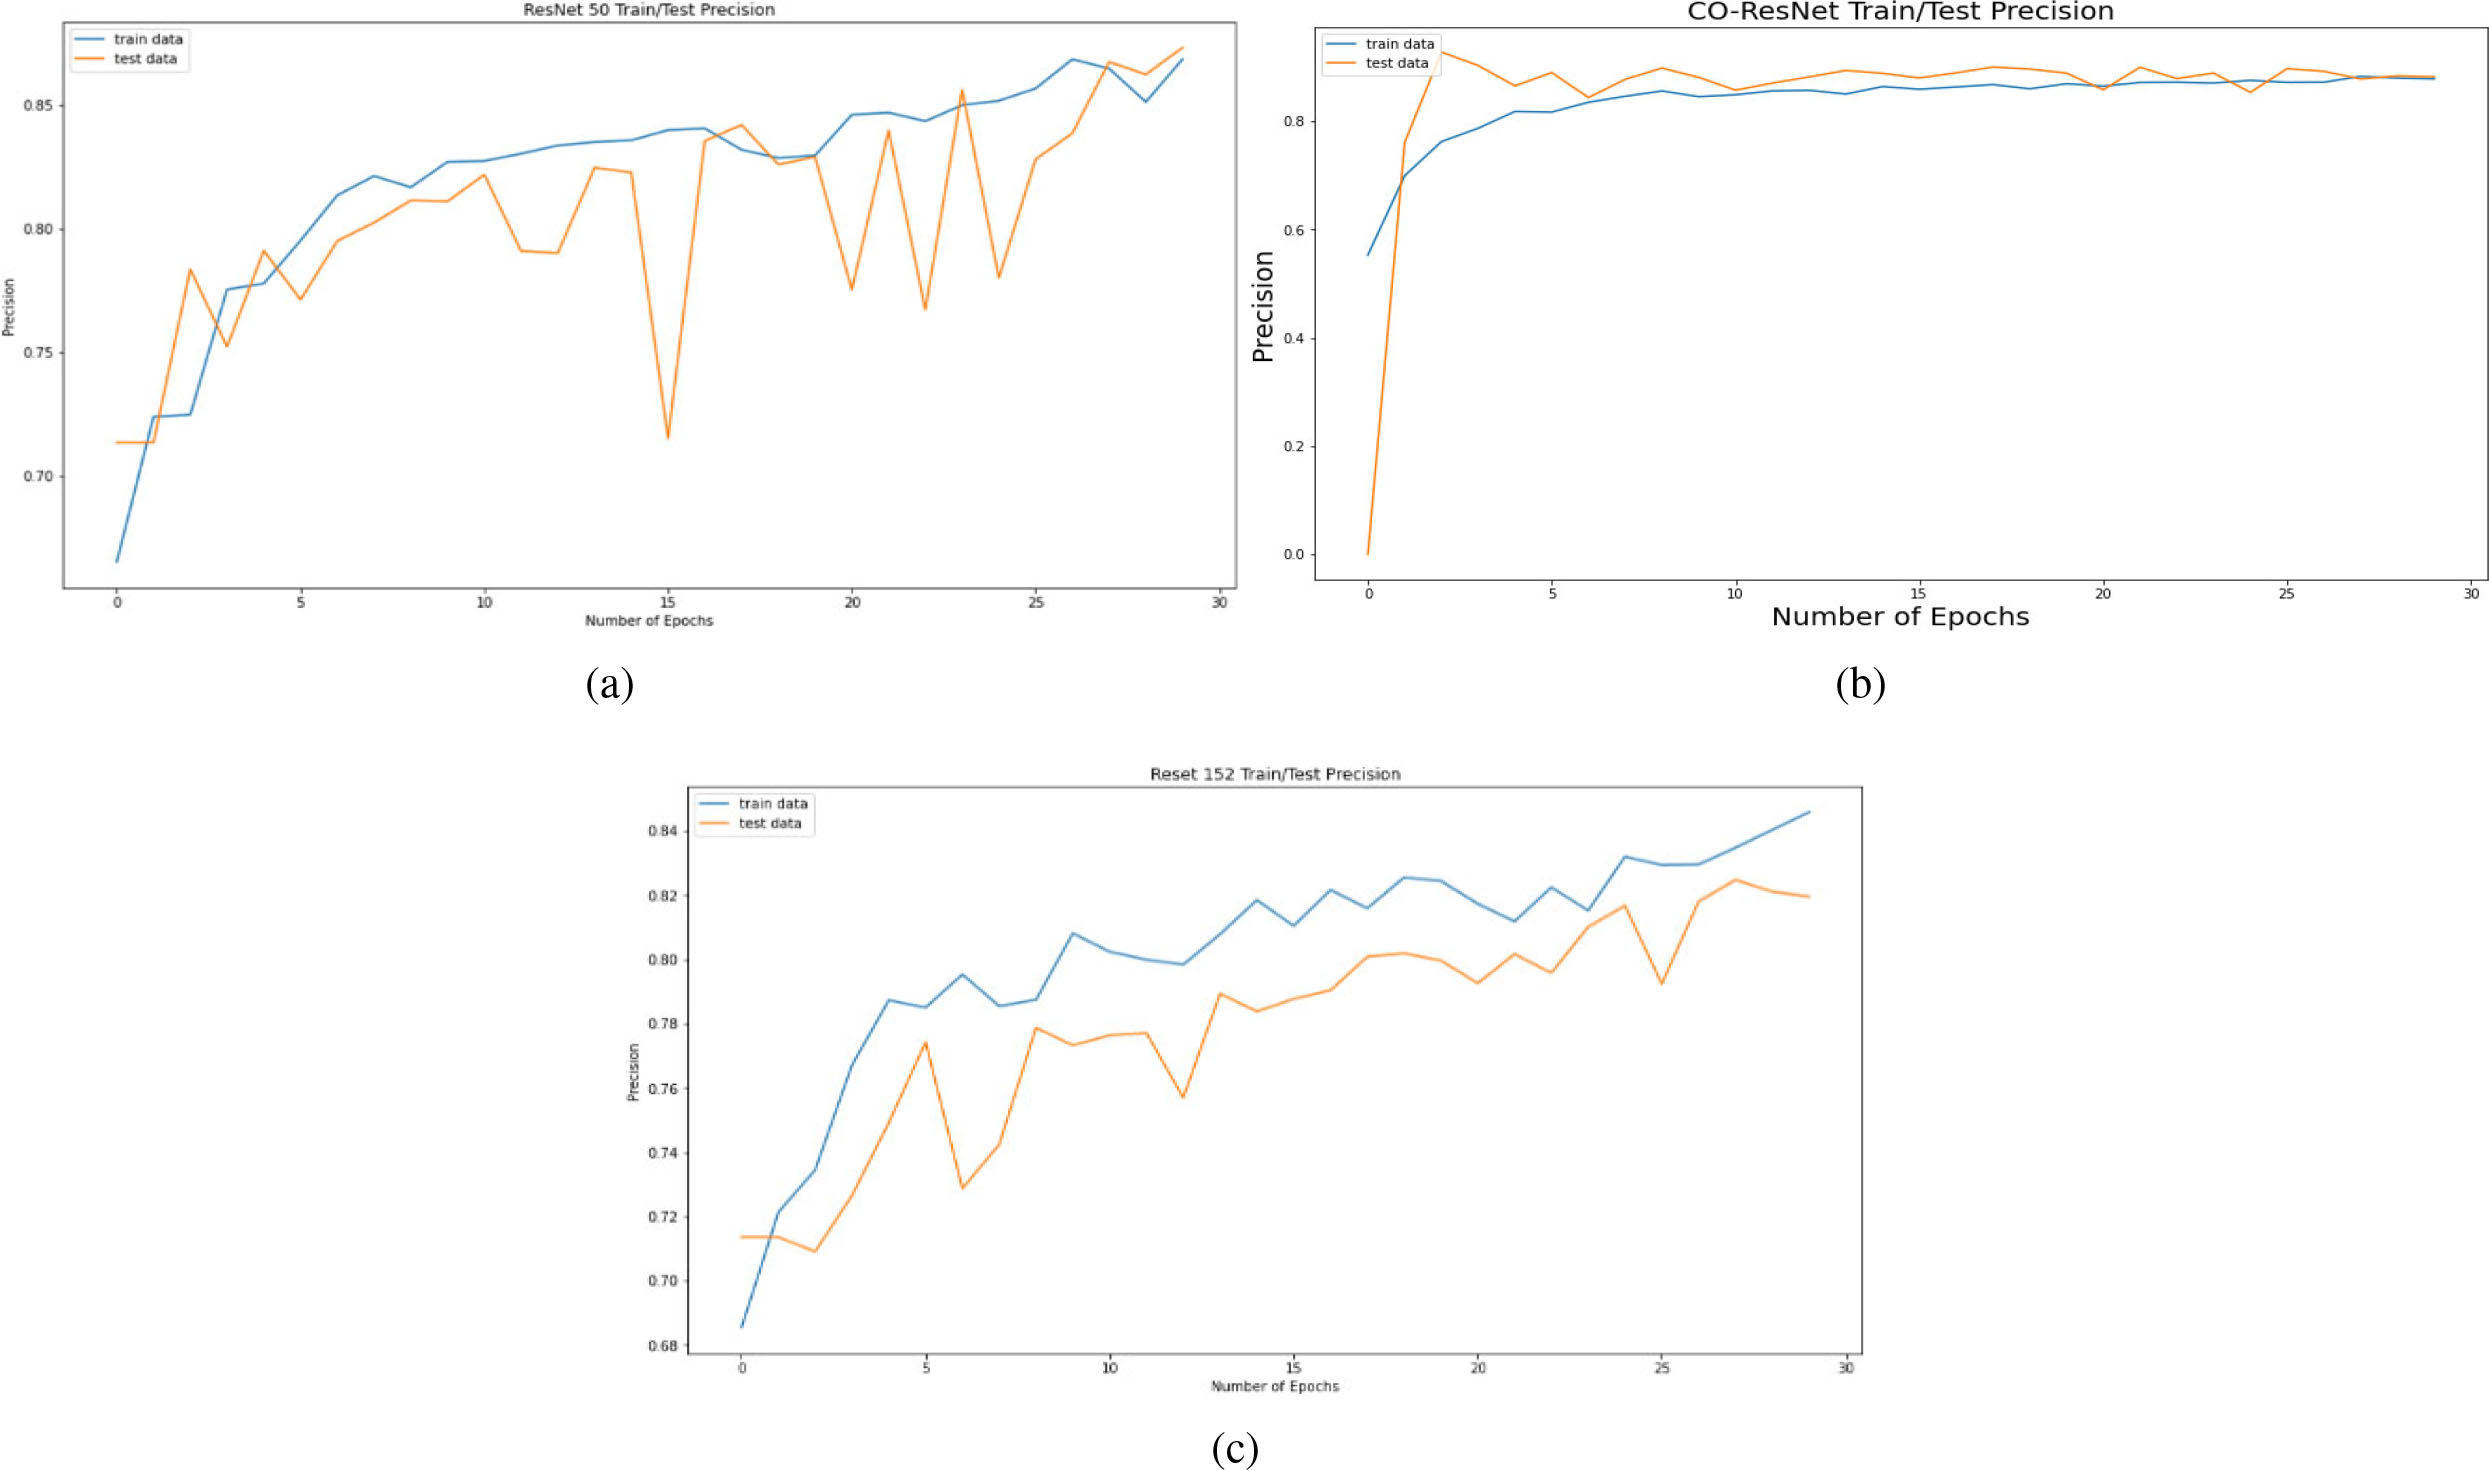
AUC curve on the basis of 30 epochs for (a) ResNet50, (b) CO-ResNet, (c) ResNet152.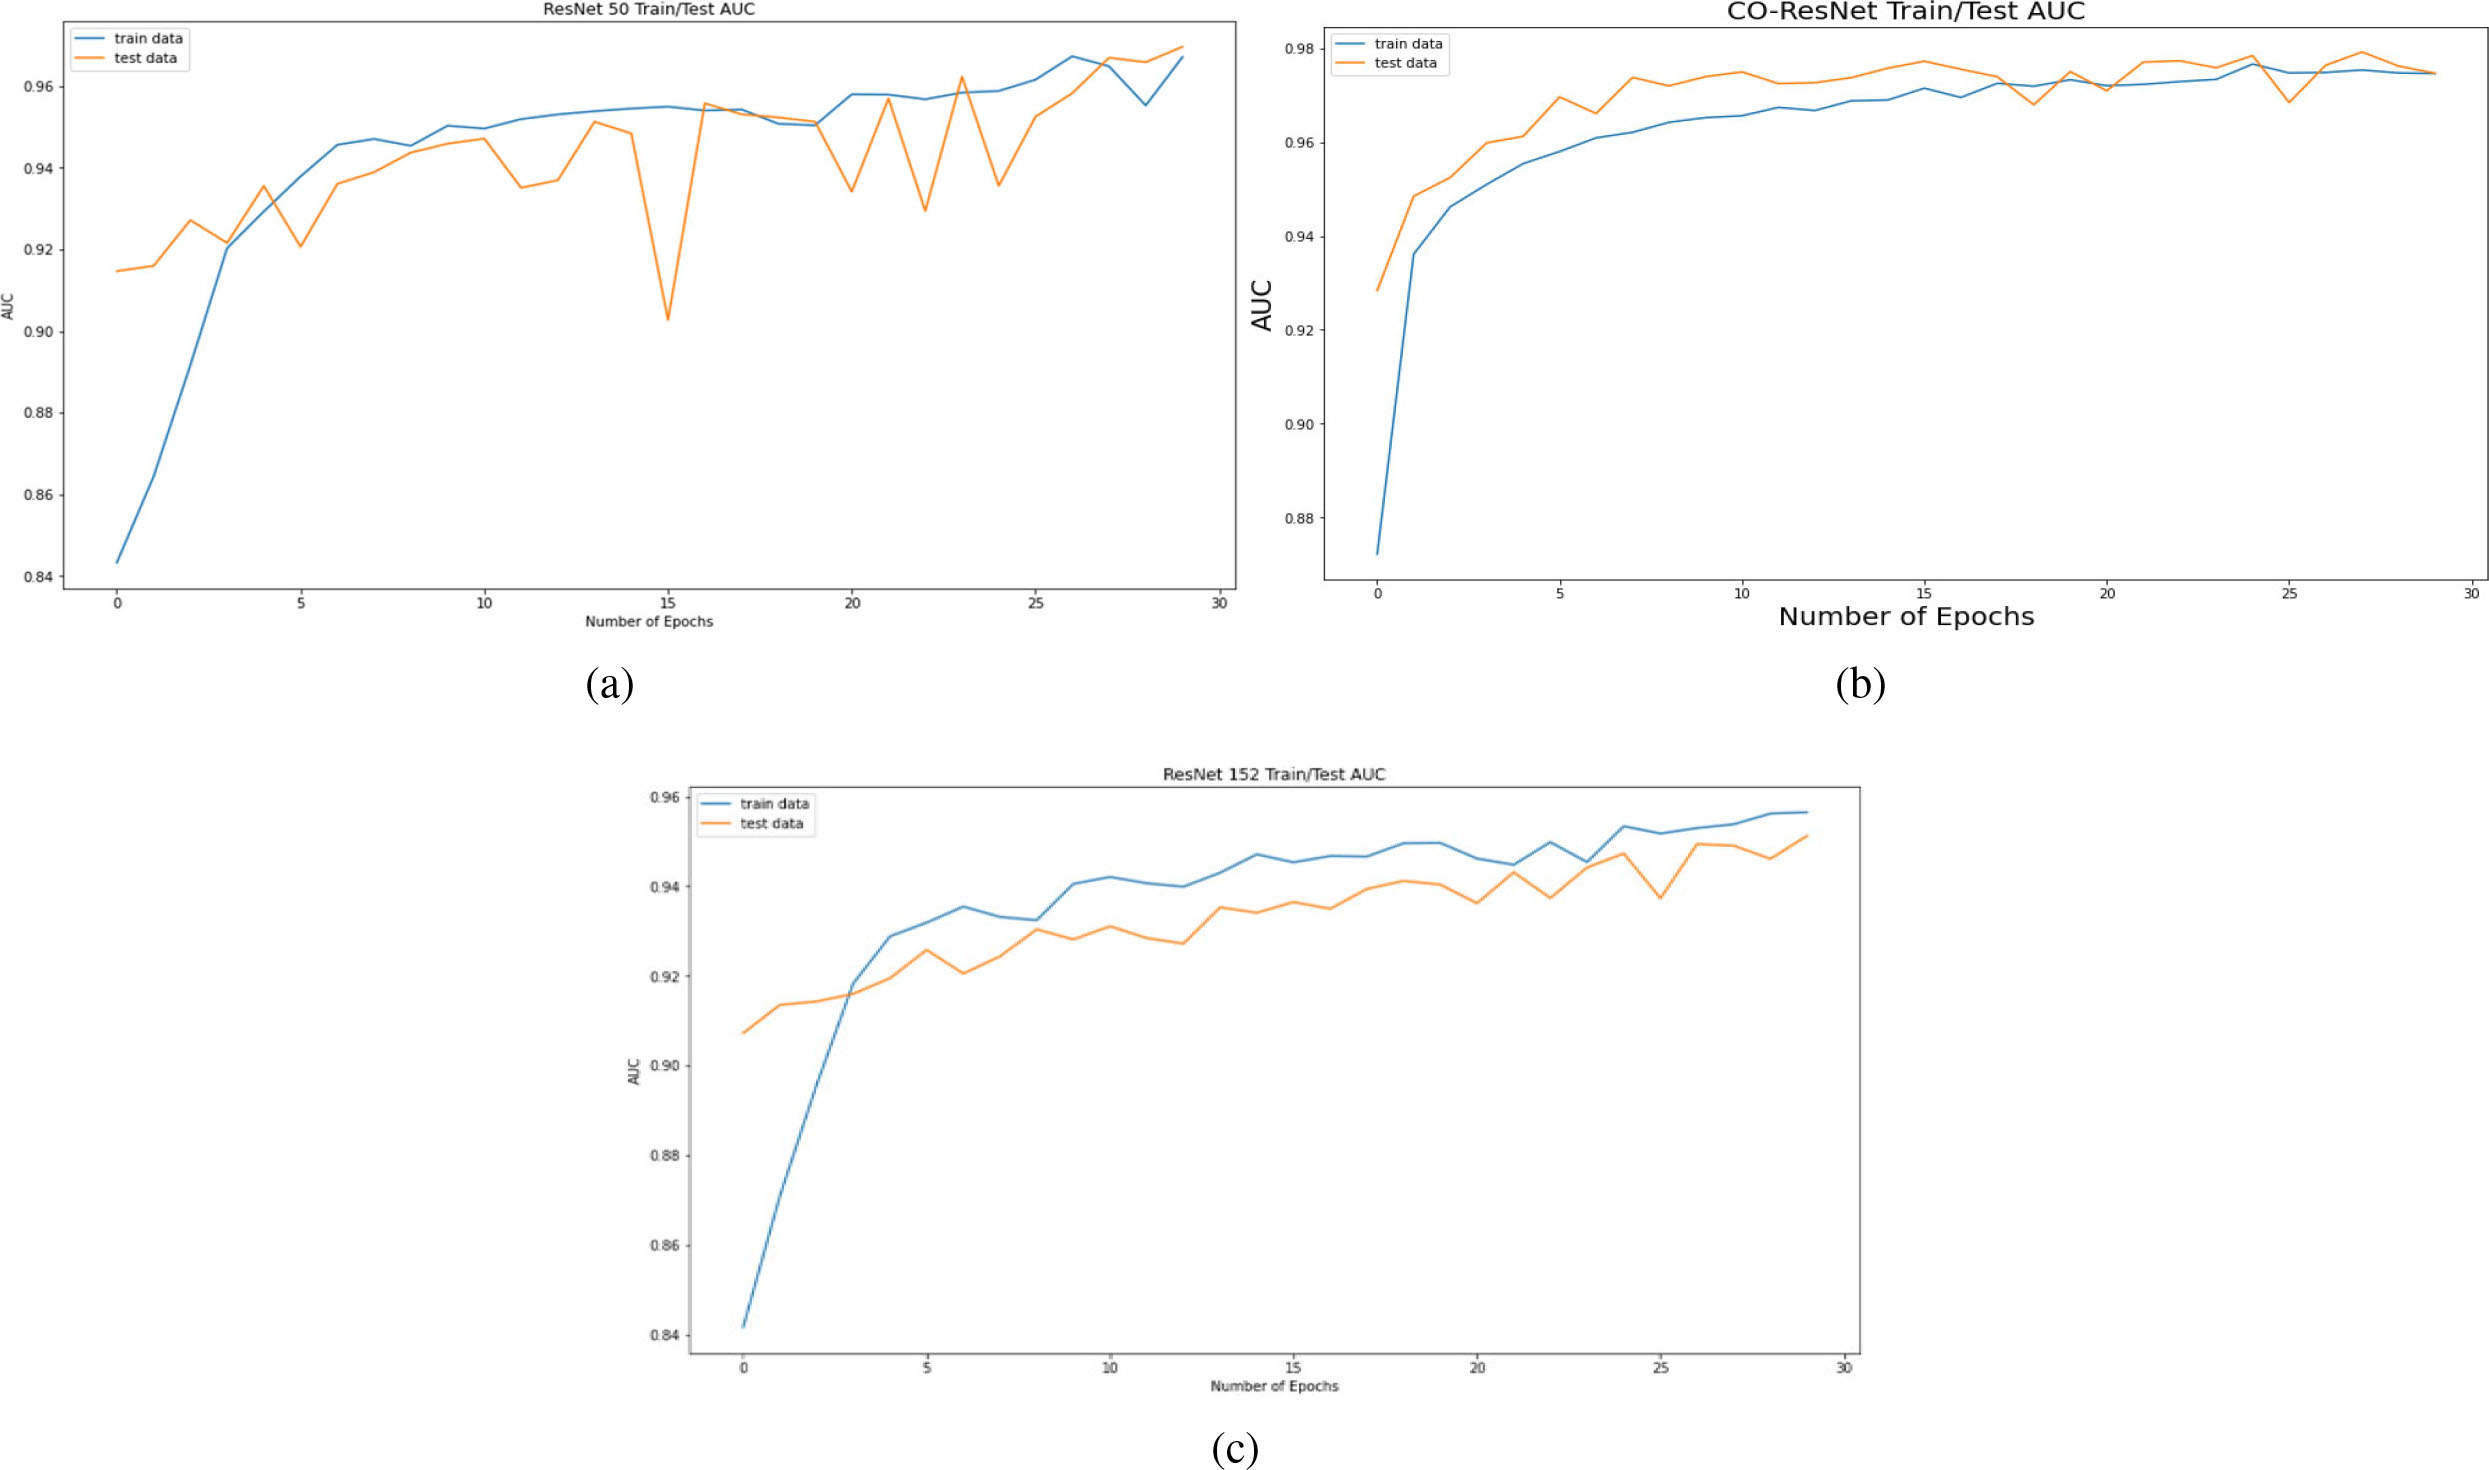
Accuracy curve on the basis of 30 epochs for (a) ResNet50, (b) CO-ResNet, (c) ResNet152.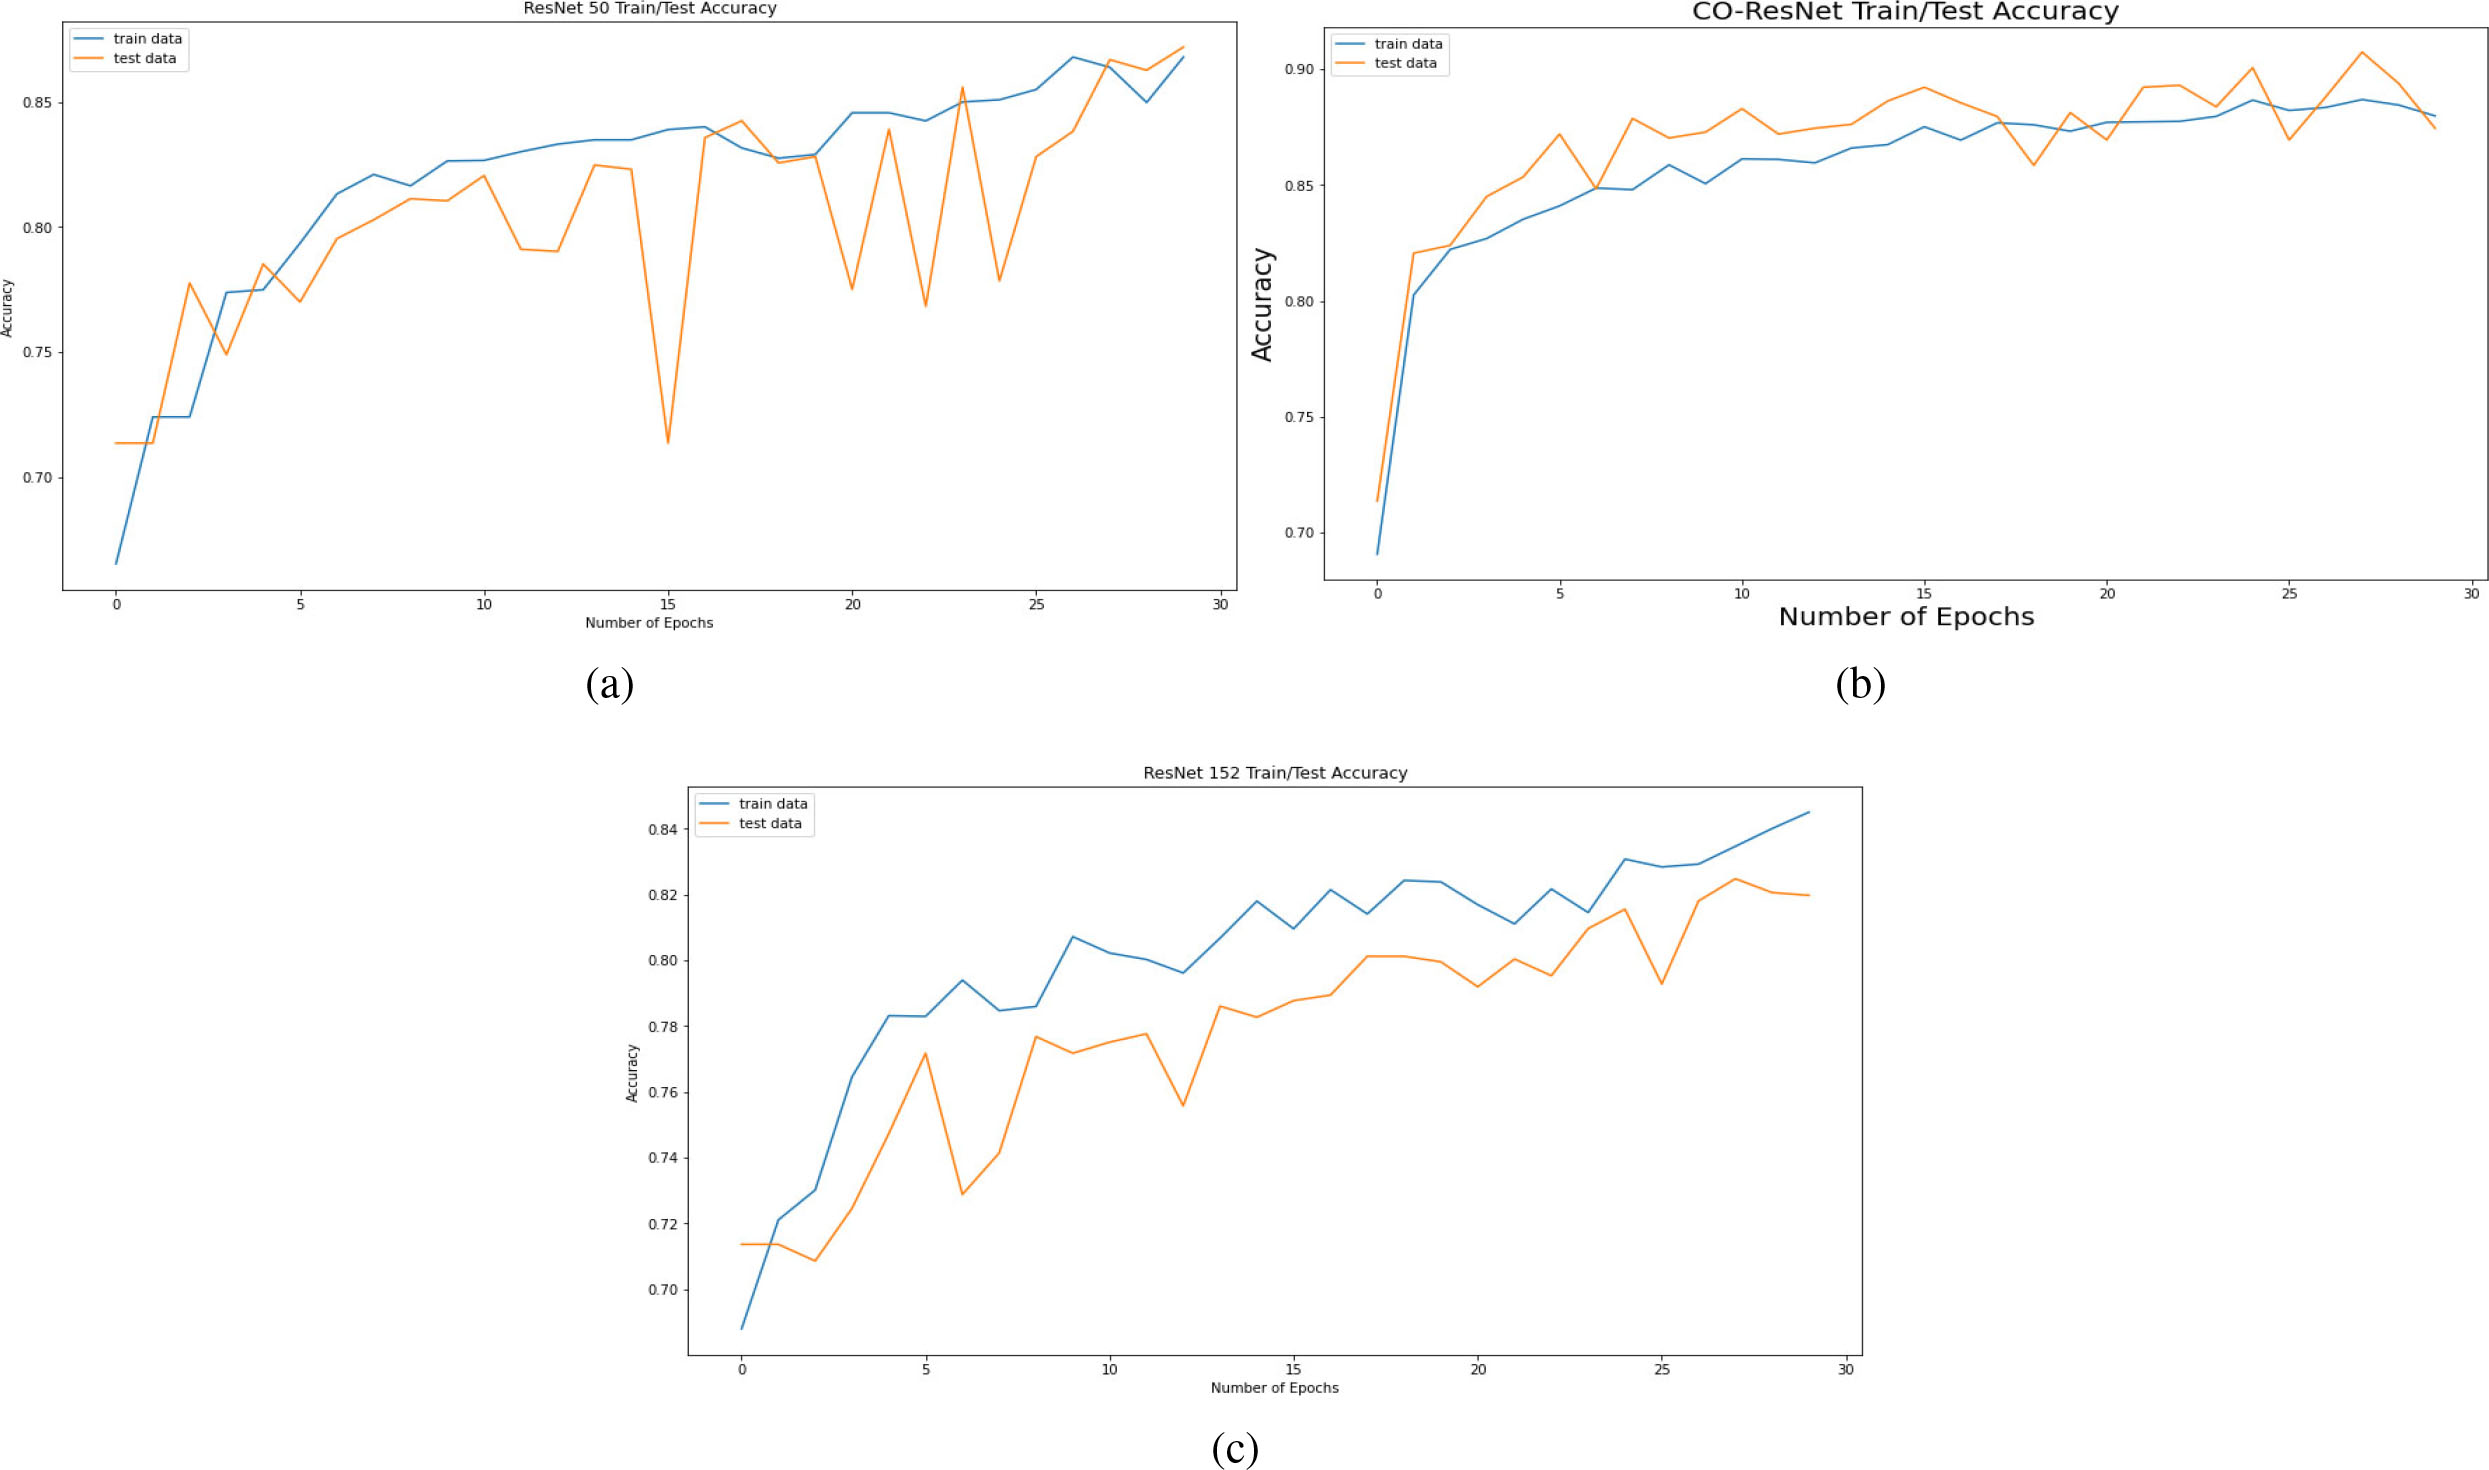
Losses of model based on 30 epochs for (a) ResNet50, (b) CO-ResNet, (c) ResNet152.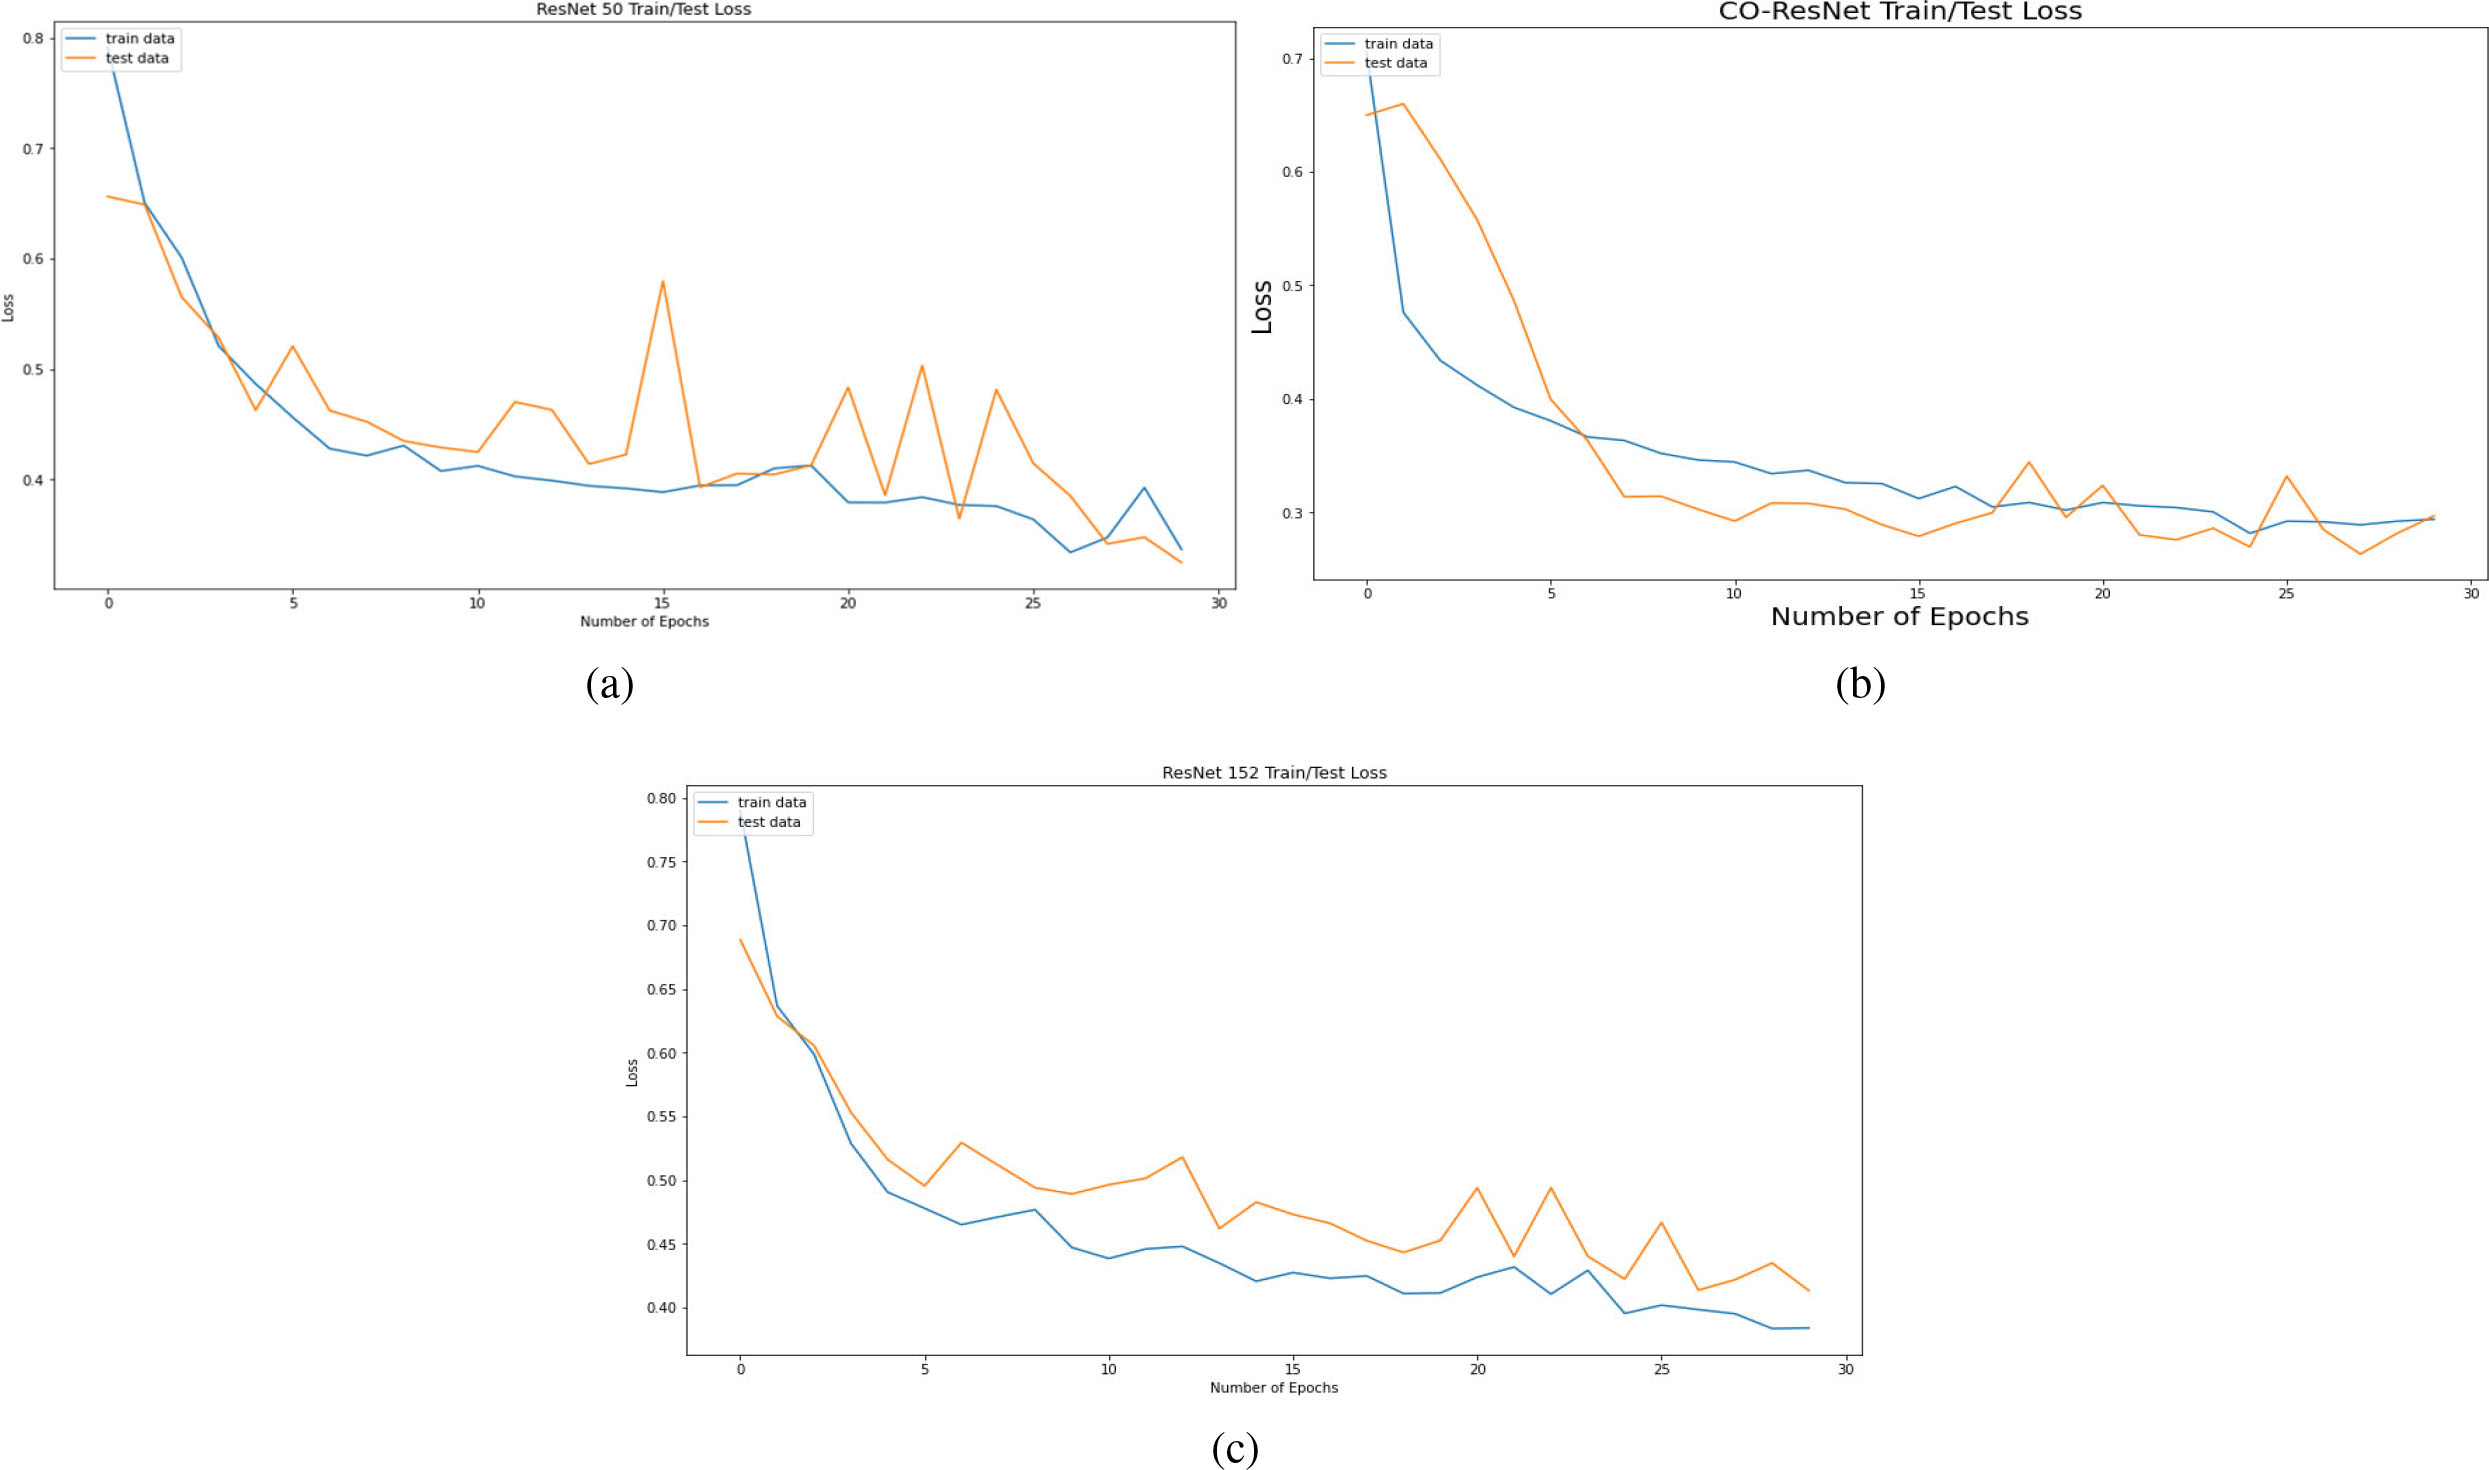
The key theme of our CO-ResNet is to detect or analyze of coronavirus infection. We classified our data and leveling as pneumonia, normal lung, and COVID-19 infected lung. From the 3 by 3 confusion matrix, we got the detection rate of 3 level classification, where we calculated true positive, false positive. Moreover, we also considered true negative and false negative. These values indicate that how many lungs are actually affected or how many cases are wrongly detected. In some cases, several lungs are affected, but they indicate that it is not affected. Conversely, several lungs are healthy, but they indicate that it is not healthy. When we evaluated our data, our CO-ResNet provided better results than other traditional algorithms or traditional ResNet algorithms. Different performance matrices are obtained where we employed Adam optimizer. This optimizer helped us to calculate the results more quickly and accurately. Apart from a high memory constraint, Adam optimizer worked efficiently. Table 3 depicts the result of ResNet50. ResNet50 provides the 98.32% accuracy for COVID-19. Additionally, the accuracies of pneumonia and normal lungs for ResNet50 are 87.28% and 88.8%, respectively. The overall accuracy of this model is 87.19%.
Next, Table 4 depicts the evaluation values of CO-ResNet where the accurate detection rate of COVID-19 is 98.74%. In addition, normal lungs and pneumonia affected lungs are achieved 92.08% and 91.32% accuracy, respectively, where normal lungs and pneumonia affected lungs are achieved 83.68% and 82% accuracy, respectively for ResNet152 as shown in Table 5. Overall accuracies of CO-ResNet and ResNet152 are 91.07% and 82%, respectively.
Figure 6 depicts the recall curve of ResNet 50, CO-ResNet, ResNet152 with respect to epochs. Moreover, Fig. 7 depicts the precision curve of ResNet 50, CO-ResNet, ResNet152 with respect to epochs. We applied 30 epochs for obtaining pick value of the ResNet models. Recall values of ResNet50 for COVID-19 infection, pneumonia infection and healthy lungs are 50%, 92% and 87%. Moreover, ResNet101 offers 86%, 92% and 87% for COVID-19 infection, pneumonia infection and healthy lungs, respectively. A recall value of 85% is obtained for pneumonia by ResNet152.
ROC curves of ResNet50.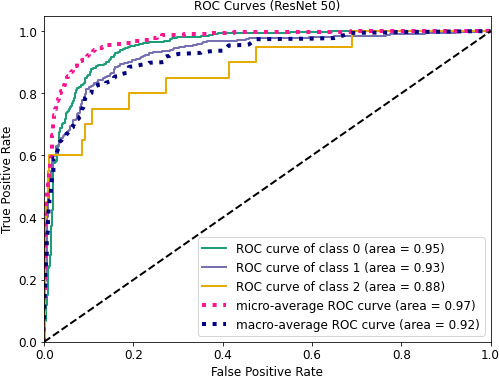
Figure 8 depicts AUC values of training and testing state for each epoch where the using epochs are 30. Moreover, Fig. 9 shows the accuracy curve for 30 epochs. We can determine the pick value from this curve. Likewise, Fig. 10 depicts curves of losses for different ResNet models. It can be presented that while epochs are increasing, the losses are decreasing. We got the most accurate result for these algorithms while the value of the loss is low.
ROC values for CO-ResNet.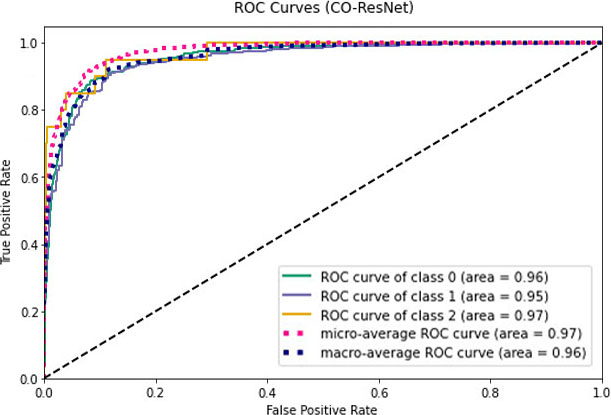
ROC curves for ResNet152.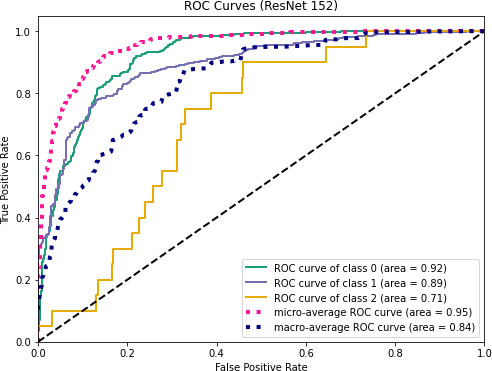
Heatmap of infectious lung.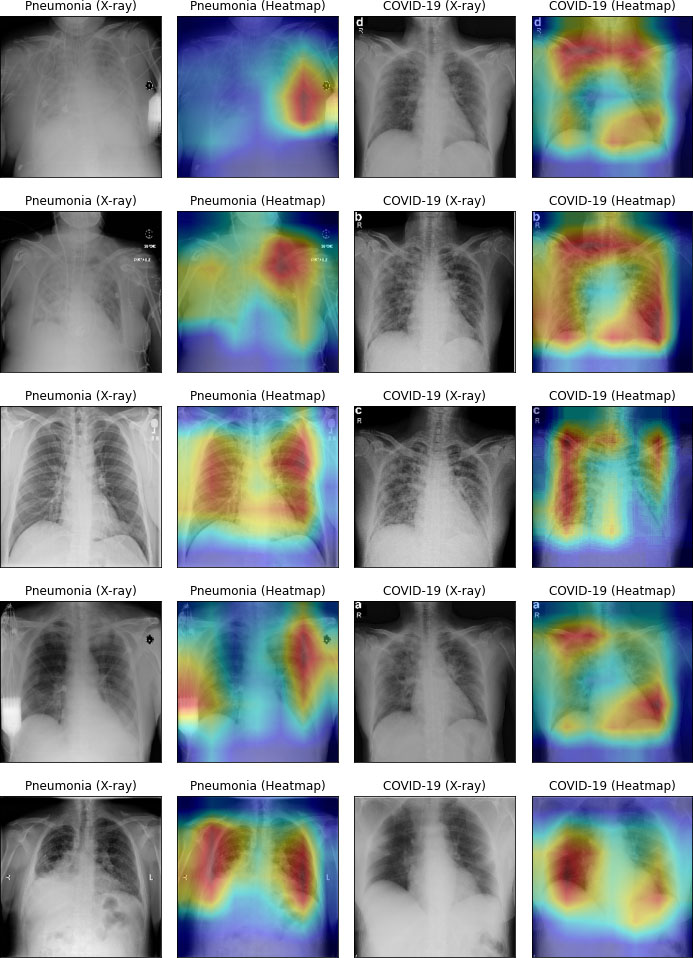
Figures 11–13 visualize the ROC curves. We can obtain the ROC values from these Figures. In the figures, “0” indicates normal lungs, “1” indicates pneumonia affected lungs and “2” indicates SARS-CoV-2 affected lungs. From Fig. 11, it can be seen that ROC values of healthy, pneumonia affected and COVID-19 affected lungs are 95%, 93%, and 88%, respectively. Moreover, ROC values of 96%, 95% and 97% are normal, pneumonia affected and COVID-19 affected, respectively as shown in Fig. 12. Furthermore, COVID-19 achieves 71% ROC values for ResNet152 as shown in Fig. 13.
State of the art comparison
Next, we compared our CO-ResNet with the traditional ResNet model. CO-ResNet obtained better results than other existing algorithms, including ResNet50 and ResNet152. In the literature, we discussed existing studies on COVID-19 for X-ray images. The work of [34] and [60] illustrated binary classification where the work of [34] achieved 80% accuracy for Xception and InceptionResNetV2 individually. Moreover, the authors [60] showed the result of VGG 16 model for Adam and RMSprop optimizer where Adam optimizer provided the accuracy of 90.55% and RMSprop optimizer also provided the accuracy of 90.55%. The number of images of the work of [34] and [60] were limited where our proposed work used 5,935 X-ray images. Furthermore, the authors of [58] and [59] depicted three level classification including COVID-19, pneumonia and normal lungs. In [58], ResNet 34 was used and it achieved a precision of 88.4% where our proposed CO-ResNet achieved a precision of 90.20%. In addition, MobileNet-V2 achieved an accuracy of 90% in the work of [59] for three level classification where our proposed Co-ResNet achieved an accuracy of 90.90% for three level classification. The comparisons are summarized in Table 6. The dataset of our work and discussed existing literature is not the same in the analysis of the literature. Therefore, direct comparison is not feasible. Accordingly, we compared our CO-ResNet with ResNet50 and ResNet152.
Figure 14 visualizes heatmap for COVID-19 and pneumonia. In left side of Fig. 14, pneumonia-infected areas are indicated in heatmap’s red color. In the right side of Fig. 14, COVID-19 infected areas are specified in red color of the heatmap. The heatmap was processed by our CO-ResNet model, and shows the actual outputs that indicate appropriate infected areas.
This work suggests a novel CO-ResNet algorithm for multiclass classification of lung infection, including COVID-19 and pneumonia. We evaluate the result of normal vs. pneumonia infection vs. COVID-19 infection. For experimental and model evaluation purposes, we formed a dataset from two dissimilar databases where the number of images were 5,935. The proposed CO-ResNet algorithm is the optimized version of ResNet101 where optimization is achieved by hyperparameter tuning. It provided better results than other traditional ResNet models. In the evaluation values of ResNet101, the detection rate of COVID-19 is 98.74%. In addition, normal lungs and pneumonia affected lungs are detected at 92.08% and 91.32% accuracy values, respectively. On the other hand, for the case of ResNet152, normal lungs and pneumonia affected lungs are detected at 83.68% and 82% accuracy values, respectively. Afterward, we visualized a heatmap that was indicated infected areas of lungs.
Footnotes
Data availability
The experimental data is accessible at S. Bharati, P. Podder and M.R.H. Mondal, X-ray images three levels, Figshare 2021, doi: 10.6084/m9.figshare.14755965.v1.