
Abstract
OBJECTIVES:
To explore the technical and clinical evaluation of ultrasound-derived fat fraction (UDFF) measurement in adult patients in whom fatty liver was suspected.
MATERIALS AND METHODS:
In this prospective study, 41 participants were initially enrolled in our hospital between October 2022 and December 2022 and received UDFF assessment using Siemens ACUSON Sequoia system equipped with DAX transducer. UDFF measurement was performed three times to obtain UDFF values from each imaging location (V hepatic segment and VIII hepatic segment) per participant, and the depth (skin-to-capsule distance) was automatically measured. The echogenicity of liver tissue in B mode ultrasound (BMUS) was compared to the normal kidney tissue, and fatty liver was graded as mild (Grade 1), moderate (Grade 2), and severe (Grade 3). The median of the acquired overall median UDFF values was used for statistical analysis. All ultrasound examinations were performed by one of two radiologists (with 20 and 10 years of liver ultrasound imaging experience).
RESULTS:
Finally, UDFF measurement was successfully performed on 38 participants to obtain valid values, including 21 men with a median age of 40.0 years (interquartile range [IQR]: 23.0 – 58.5) and 17 women with a median age of 60.0 years (IQR: 29.5 – 67.0). Fatty liver was diagnosed by BMUS features in 47.4% (18/38) participants. Among all participants, the median UDFF value was 7.0% (IQR: 4.0 – 15.6). A significant difference in UDFF values was found between participants with fatty liver and without fatty liver (U = 7.0, P < 0.001), and UDFF values elevated as the grade of the fatty liver increased (P < 0.001). The median UDFF values from the three UDFF measurements obtained during each ultrasound examination showed excellent agreement (ICC = 0.882 [95% confidence interval: 0.833 – 0.919]). The Spearman correlation of UDFF values in different depths was moderate, with a rs value of 0.546 (P < 0.001). No significant differences in UDFF values were found between V hepatic segment and VIII hepatic segment (U = 684.5, P = 0.697).
CONCLUSIONS:
UDFF provides a novel non-invasive imaging tool for hepatic steatosis assessment with excellent feasibility.
Keywords
Introduction
Non-alcoholic fatty liver disease (NAFLD) is a potentially serious liver disease that affects approximately 25% of the adult population worldwide [1]. The initial and characteristic pathological feature of NAFLD is isolated hepatic steatosis (non-alcoholic fatty liver, NAFL), which is defined as the accumulation of fat droplets in hepatocytes. NAFLD can lead to non-alcoholic steatosis and hepatitis (NASH), which is a leading cause of progression to hepatic fibrosis, cirrhosis, and even hepatocellular carcinoma [2–5]. NAFLD is considered part of multisystem disease, and the hepatic manifestation of metabolic syndrome [6, 7]. Although NAFLD is strongly related to obesity, it also occurs in individuals with normal weight, especially in Asian populations [8, 9]. The cardiovascular disease is the main cause of death in patients with NAFLD; other common causes include extrahepatic malignancies, liver-related complications, chronic kidney disease, and type 2 diabetes mellitus [7, 10–12]. Currently, liver biopsy is the gold standard for quantifying hepatic steatosis [13]. However, as it is invasive, liver biopsy is impractical for evaluating liver fat content in a large number of patients with NAFLD, who may merely have simple steatosis. Furthermore, liver biopsy only obtains 0.002% of liver tissue, which is prone to sampling error [14].
Hepatic steatosis is a dynamic process that may change in a short time, requiring a non-invasive method that can be repeated multiple times to accurately evaluate the progression or regression of NAFLD [13], and imaging technologies meet these requirements. Currently, the magnetic resonance imaging proton density fat fraction (MRI-PDFF) is considered to be the non-invasive clinical standard for, assessing liver fat content quantitatively [15]. However, using MRI-PDFF to monitor the increasing number of NAFLD patients is costly and impractical. There is an urgent need to develop non-invasive, accurate, cost-effective, and widely available measures to assess hepatic steatosis [16].
According to the current World Federation for Ultrasound in Medicine and Biology position paper [13], B mode ultrasound (BMUS) is a convenient and promising imaging method, which can diagnose fatty liver in real-time by detecting the typical features such as hyperechogenicity of the liver parenchyma, increasing attenuation of the ultrasound waves in the deeper parts, and intrahepatic vessels blurring. However, as the operator must qualitatively evaluate the amount of fat infiltration based on subjective visual impression, it is more difficult to use ultrasound to grade steatosis. The hepatorenal index (HRI), a semiquantitative method, is defined as the ratio of the echo intensities of the liver parenchyma to the renal cortex, which avoids the potential impact of subjective vision of operators [13].
Various quantitative ultrasound methods have been explored to extract quantitative parameters and improve the assessment of steatosis. The controlled attenuation parameter (CAP, FibroScan/EchoSens) is the most widely utilized approach to detect hepatic steatosis. The other ultrasound imaging methods, such as 2-D attenuation imaging (ATI, Aplio i800 series/Canon), attenuation coefficient (ATT, Aloka-Arietta systems/Hitachi), ultrasound-guided attenuation parameter (UGAP, LOGIQ E9 series/General Electric), and UltraSound ATtenuation Imaging Technology (USAT, Resona R9/Mindray) [13, 16], quantify steatosis based on only one parameter, which has its own limitations (required use of a reference phantom during measurement, or calculated liver fat content with external special software) and it is nonlinear to MRI-PDFF [17–19]. Therefore, a multivariable approach may be beneficial [20, 21].
The ultrasound-derived fat fraction (UDFF) method is designed to assess hepatic steatosis by estimating the frequency-dependent attenuation coefficient (AC) and backscatter coefficient (BSC) through processing acoustic radiofrequency (RF) signals returned from the liver tissue as fat vesicles in hepatocytes have different characteristic impedance compared to normal liver tissue [22]. UDFF is available on the Acuson Sequoia ultrasound system (Siemens Healthineers, Issaquah, WA, USA), with reference to integrated phantom data to correct for system impact, and produces a UDFF value presented as a fat fraction (%), which is potentially related to MRI-PDFF and can be directly compared with MRI-PDFF [22]. However, previous studies did not explore the potential impact of the presence of hepatic steatosis on UDFF measurements [22–24] and may have potentially underestimated measurement variability, as UDFF values were obtained during one segment of liver and by one technologist [23]. In addition, there is no consensus to indicate the number of measurements to determine valid UDFF assessment [24].
The aim of this study was to investigate the feasibility of UDFF measurement in adult livers to evaluate liver steatosis.
Materials and methods
Study design
The Institutional Review Board approved this prospective study, and all participants gave written informed consent (ID: XHEC-C-2022-121-1). Research participants were consecutively recruited from two hospitals between October 2022 and December 2022.
Inclusion criteria were as follows: participants age 18 years or older, who annually visited our institute for health check-ups and in whom fatty liver was suspected or detected by prior BMUS, and had willingness and ability to participate.
Exclusion criteria were participants with known history of liver resection of right lobe or liver transplantation, or known hepatic malignant disease of right lobe.
Ultrasound data acquisition
All ultrasound examinations were performed by one of two radiologists (with 20 and 10 years of liver ultrasound imaging experience with more than 3000 ultrasound examinations/year) using a high-end ultrasound system (Acuson Sequoia®/Siemens), equipped with a special deep penetration DAX probe (1.0 –5.7 MHz).
Participants were instructed to fast 6 hours prior to the ultrasound examination and were in the dorsal decubitus position with right arm abduction maximal. A breath-holding maneuver (holding a breath for 10 seconds at the end of expiration during a calm breathing cycle) was applied to all participants to avoid image artifacts caused by excessive motion during the ultrasound data acquirement.
During BMUS scan, the liver morphology, echogenicity, intrahepatic vessels borders, and the diaphragm were detected [13]. Color-coded Doppler sonography (CCDS) evaluation for the liver vascularization was performed with optimized flow parameters for the portal vein, hepatic artery, and liver veins. The peak systolic velocity (PSV), resistance index (RI), and Doppler signal were recorded [25, 26].
UDFF measurement was performed when the probe was placed perpendicular to the liver capsule, avoiding the areas of motion artifacts, multiple reflections, and liver capsule. A fixed size region of interest (ROI) (3.0 cm×3.0 cm, laterally by axially) containing 15 sub-ROIs was positioned in the liver parenchyma 1.5 cm from the liver capsule. The major intrahepatic vessels and focal lesions would be automatically deselected when assessing UDFF. A valid measurement is considered if the UDFF value was displayed. UDFF measurements were performed three times from participants’ V hepatic segments and VIII hepatic segments respectively. Simultaneously, 15 shear wave velocity (SWV) values and 15 Young’s modulus from 15 sub-ROIs in a single acquisition were acquired using the auto point shear wave elastography (auto-pSWE) method. The overall UDFF (%), depth (cm), SWV (m/s), and Young’s modulus (kPa) were automatically calculated and shown on the bottom left portion of the screen (Fig. 1). The depth was automatically measured from the skin surfaces of the patient to the center of the ROI.
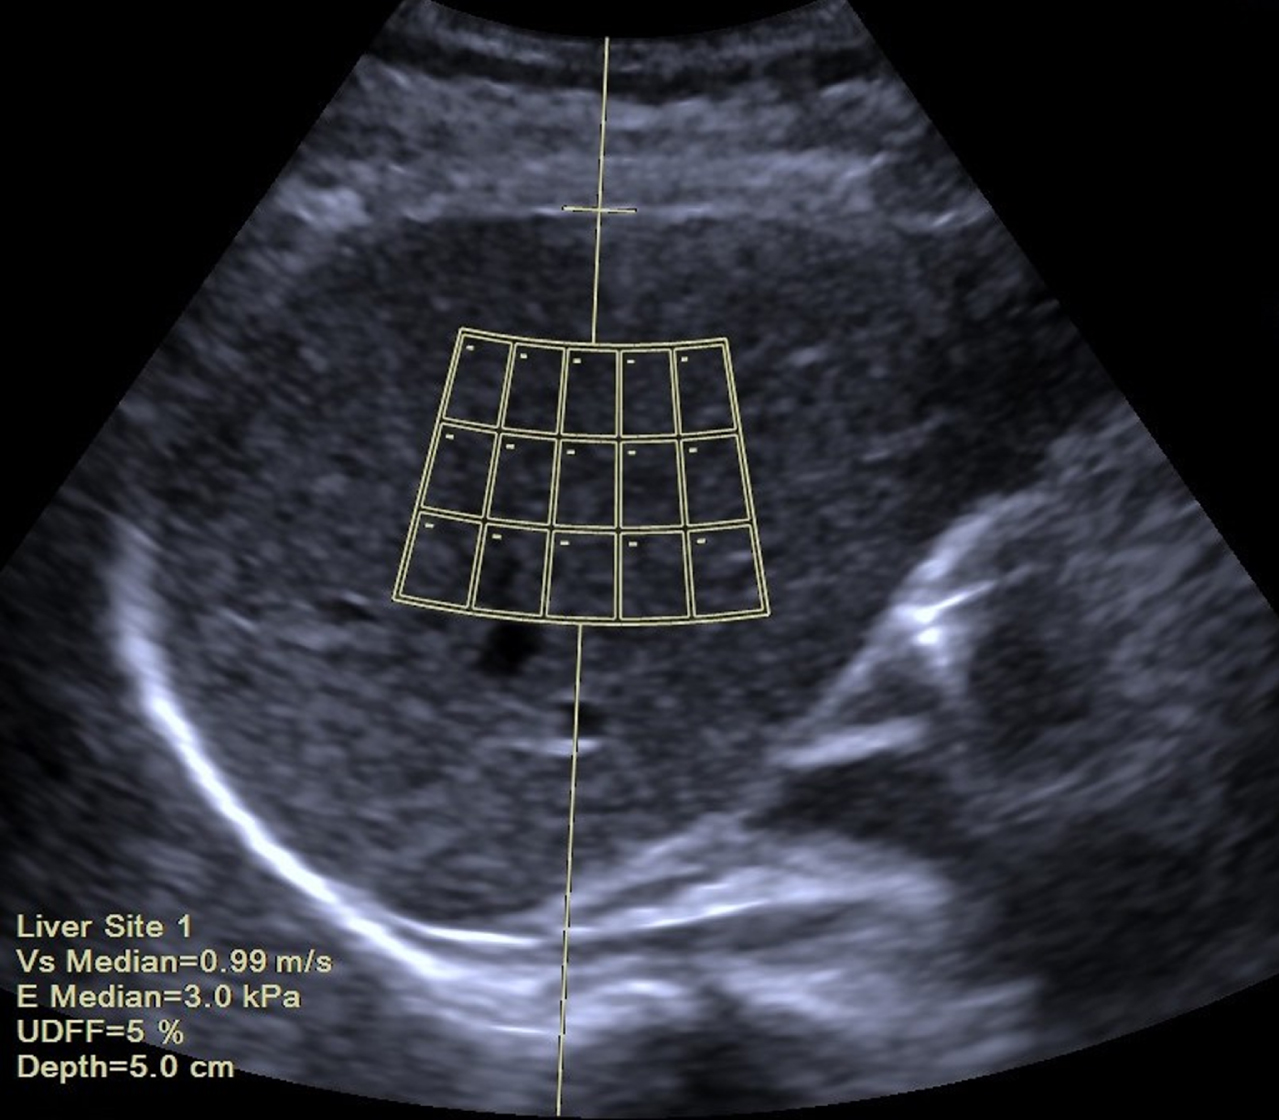
Ultrasound image show ultrasound-derived fat fraction (UDFF). A region of interest is placed on the V hepatic segment 1.5 cm from the liver capsule (a horizontal line placed on the liver capsule), avoiding large intrahepatic vascular structures. Automatic display of UDFF values (5%), depth (5.0 cm), shear wave velocity (SWV) (Vs Median = 0.99 m/s), and Young’s modulus (E Median = 3.0 kPa), and is shown in the bottom left corner.
All three UDFF values along with overall statistics of mean, standard deviation, median, interquartile ranges (IQR), and IQR/median for three UDFF evaluations were presented on one report, and the median of the acquired overall median UDFF values was used for statistical analysis. UDFF measurement failures were recorded when no valid UDFF values were obtained in V hepatic segment or VIII hepatic segment.
SWV values of more than 1.8 m/s and/or Young’s modulus of more than 9.9 kPa are considered advanced fibrosis of the liver [15, 27].
Grading of fatty liver can be assessed using a qualitative grading system of mild (Grade 1, slightly increased echogenicity of the hepatic tissue with normal visualization of intrahepatic vessels borders and the diaphragm), moderate (Grade 2, moderately increased echogenicity of the hepatic tissue with slightly impaired visualization of intrahepatic vessels borders and the diaphragm), or severe (Grade 3, marked increase echogenicity of the hepatic tissue with poor or no visualization of the intrahepatic vessel borders, diaphragm, and posterior portion of the hepatic right lobe) [28]. For fatty liver diagnosis, the increased echogenicity is defined as the similar echogenicity as the perirenal fat tissue (Fig. 2) [28].
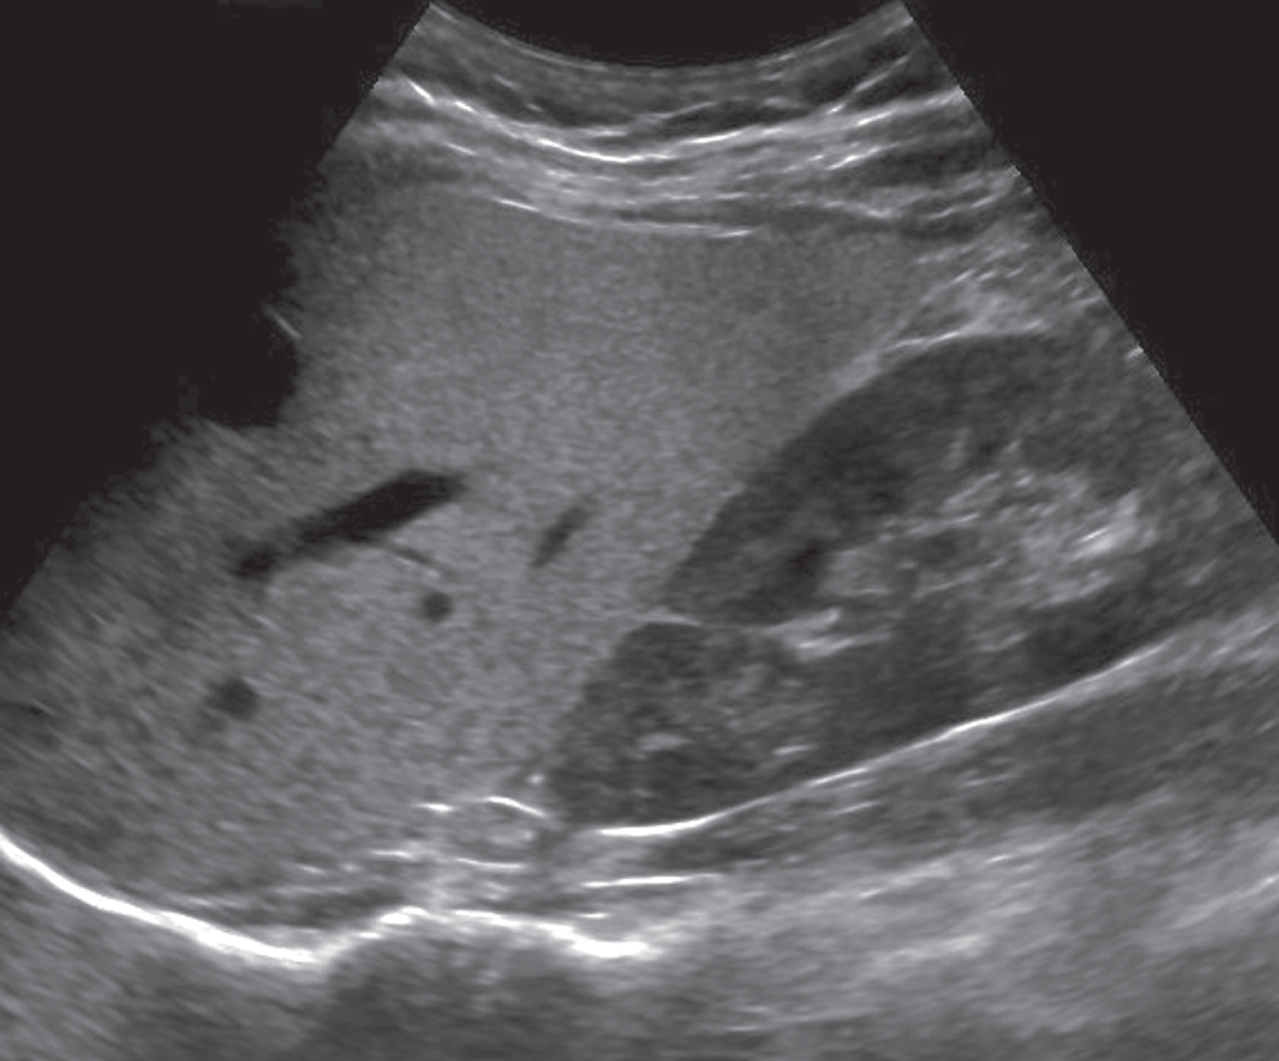
The B-Mode image shows the presence of fatty liver as the hyperechogenicity of the liver parenchyma compared with the kidney.
For flow evaluation, the waveforms were classified into triphasic flow and biphasic flow.
Continuous data were summarized as median and IQR, or mean and standard deviation. Intra-class correlation coefficients (ICCs) with 95% confidence intervals (CIs) were calculated based on two-way random model to estimate the agreement of three UDFF values. The following definitions were used to interpret the ICC values for absolute agreement: 0 –0.39, poor; 0.40 –0.59, fair; 0.60 –0.74, good; and 0.75 –1.0, excellent [29]. The Kruskal-Wallis tests were performed to compare UDFF values between the presence and grade of fatty liver. The Mann-Whitney U test was used to compare continuous data between UDFF values measured from V hepatic segment and VIII hepatic segment. Bland-Altman plot [30] was performed to assess mean bias and 95% limits of agreement (LOA) between V segment and VIII segment. To evaluate the correlation between UDFF values and depths, Spearman’s correlation test [31] was performed for UDFF values measured from different depths. The Spearman correlation coefficient was classified as follows: A rs of 0–0.19 was considered “very weak,” 0.20–0.39 “weak”, 0.40–0.59 “moderate”, 0.60–0.79 “strong”, and 0.80–10.0 “very strong”. All statistical analyses were performed with SPSS software, version 26 (IBM Corp, USA). A P value of less than.05 was considered statistically significant.
Results
Baseline characteristics
A total of 41 participants were enrolled. As no valid values were acquired in 3 participants as a respiratory movement, 38 participants were finally included in this study, including 21 men with a median age of 40 years (IQR: 23.0 –58.5) and 17 women with a median age of 60.0 years (IQR: 29.5 –67.0). The baseline characteristics of participants and ultrasound examinations are shown in Table 1. There were no cases with tumor lesions of the liver or thrombosis of the portal vein. The PSV of the portal vein was normal between 20-40 cm/s in all cases, and the median PSV of the portal vein was 31.8 cm/s (IQR: 28.6 –35.1). The resistance index (RI) of the hepatic artery was normal between 0.5-07 in all cases, and the median RI of the hepatic artery was 0.65 (IQR: 0.58 –0.70). Changes in the PSV of the hepatic vein were found in 7.9% (3/38) cases, with changes of the normal triphasic flow up to 25 cm/s to reduced biphasic flow at a maximum of 18 cm/s. The median PSV of the hepatic vein was 22.5 cm/s (IQR: 19.9 –24.0). The median SWV was 1.2 m/s (IQR: 1.0 –1.5), and the median Young’s modulus was 4.1 kPa (IQR: 3.1 –6.5). Evaluation using auto-pSWE showed 5.3% (2/38) of participants with SWV values up to 1.8 m/s and Young’s modulus up to 9.9 kPa. Fatty liver was detected by BMUS in 47.4% (18/38) participants, 8 participants were classified as Grade 1, and 10 participants were classified as Grade 2.
Baseline characteristics of participants and ultrasound examinations
Baseline characteristics of participants and ultrasound examinations
pSWE, point shear wave elastography; SWV, shear wave velocity; CCDS, color-coded Doppler sonography; PSV, peak systolic velocity; RI, resistance index. *Data are mean±standard deviation. #Data are participants, with percentages in parentheses. †Data are median, and data in parentheses are the interquartile range.
The success rate of the UDFF measurement in detecting fatty liver was 92.7% (38/41). The median UDFF value of all the participants was 7.0% (IQR: 4.0 –15.6). Participants with fatty liver had a median UDFF value of 15.8% (IQR: 9.6 –17.5), while participants without fatty liver had a median UDFF value of 4.0% (IQR: 3.6 –4.9). A significant difference in UDFF values was found between participants with fatty liver and without fatty liver (U = 7.0, P < 0.001), and UDFF values elevated as the grade of the fatty liver increased (P < 0.001) (Fig. 3).
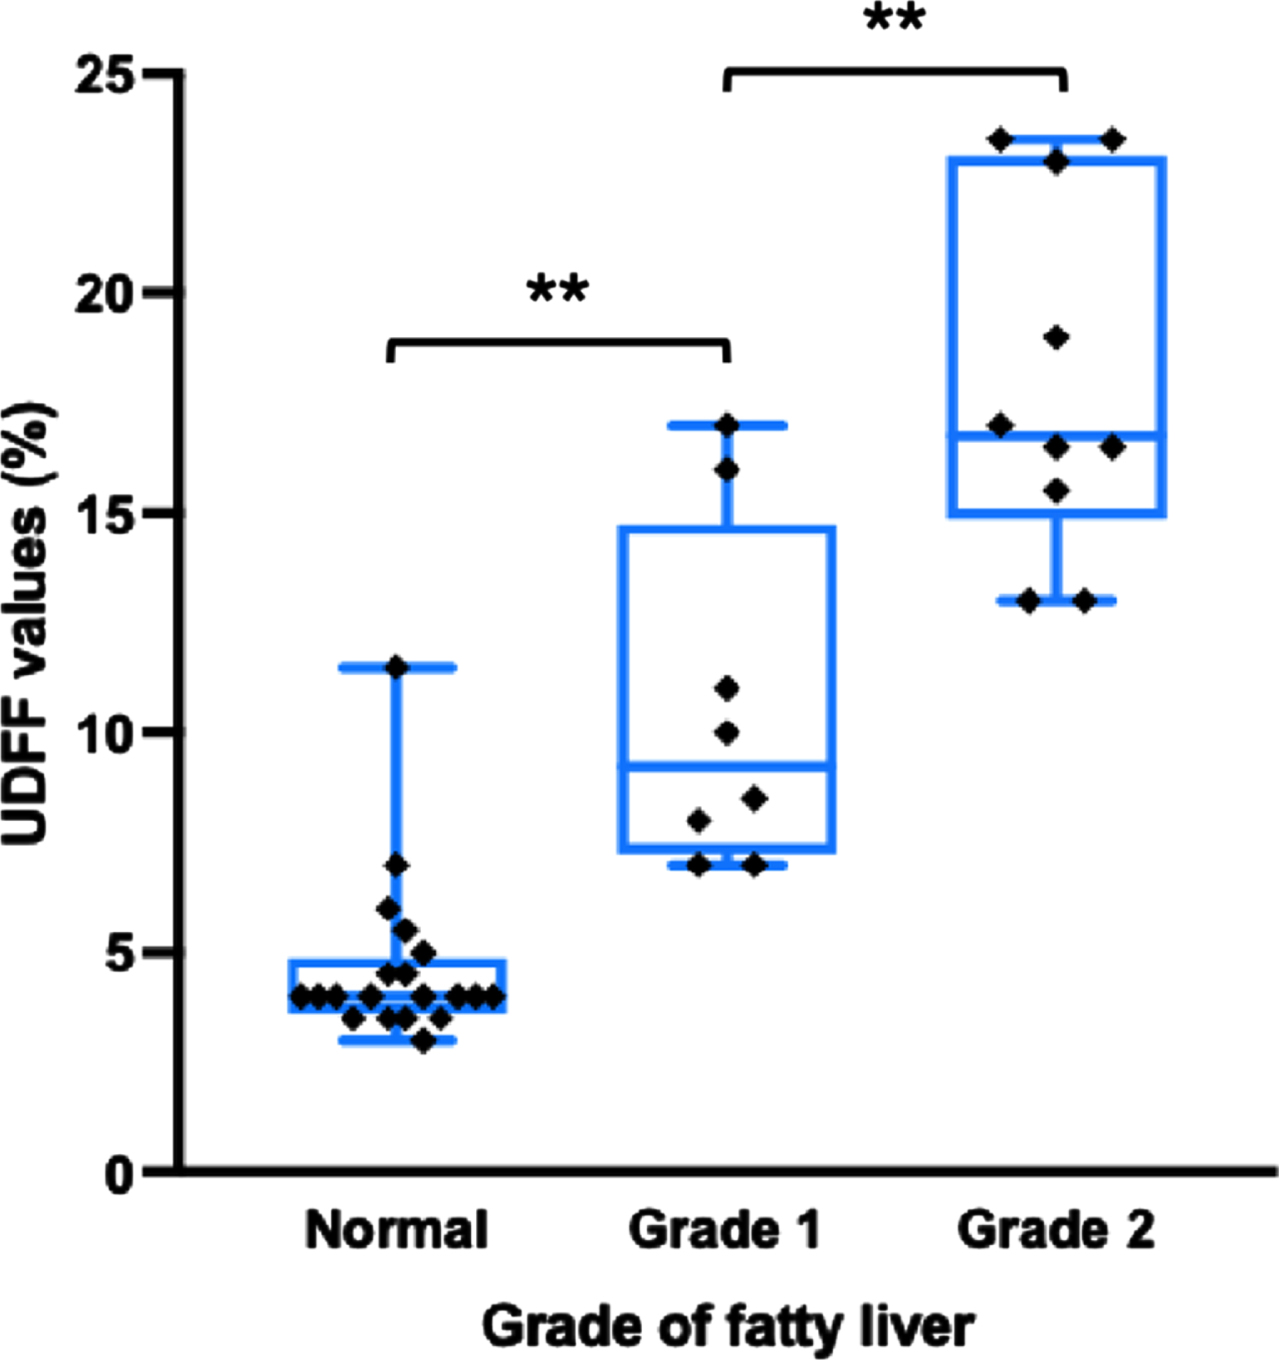
The distribution of ultrasound-derived fat fraction (UDFF) values according to the presence and grade of fatty liver on B mode ultrasound. The UDFF values were plotted as median (solid lines), 25th to 75th percentiles (box), and maximum and minimum values (whiskers). Horizontal brackets above plots indicate statistical significance as determined by the Kruskal-Wallis test. **P<0.001.
The median UDFF values from the three times UDFF acquisitions obtained during each ultrasound examination showed excellent agreement (ICC = 0.882 [95% CI: 0.833 –0.919]). During UDFF measurements in V hepatic segment, the ICC value was 0.847 (95% CI: 0.757 –0.911). While the ICC value was 0.915 (95% CI: 0.860 –0.952) during the UDFF measurements in VIII hepatic segment.
UDFF values in different depths
Spearman correlation of UDFF values in different depths was moderate, with a rs value of 0.546 (P < 0.001) (Fig. 4). Spearman correlation of UDFF values measured from V hepatic segment and VIII hepatic segment between different depths were also moderate (rs = 0.573, P < 0.001, and rs = 0.551, P < 0.001, respectively).
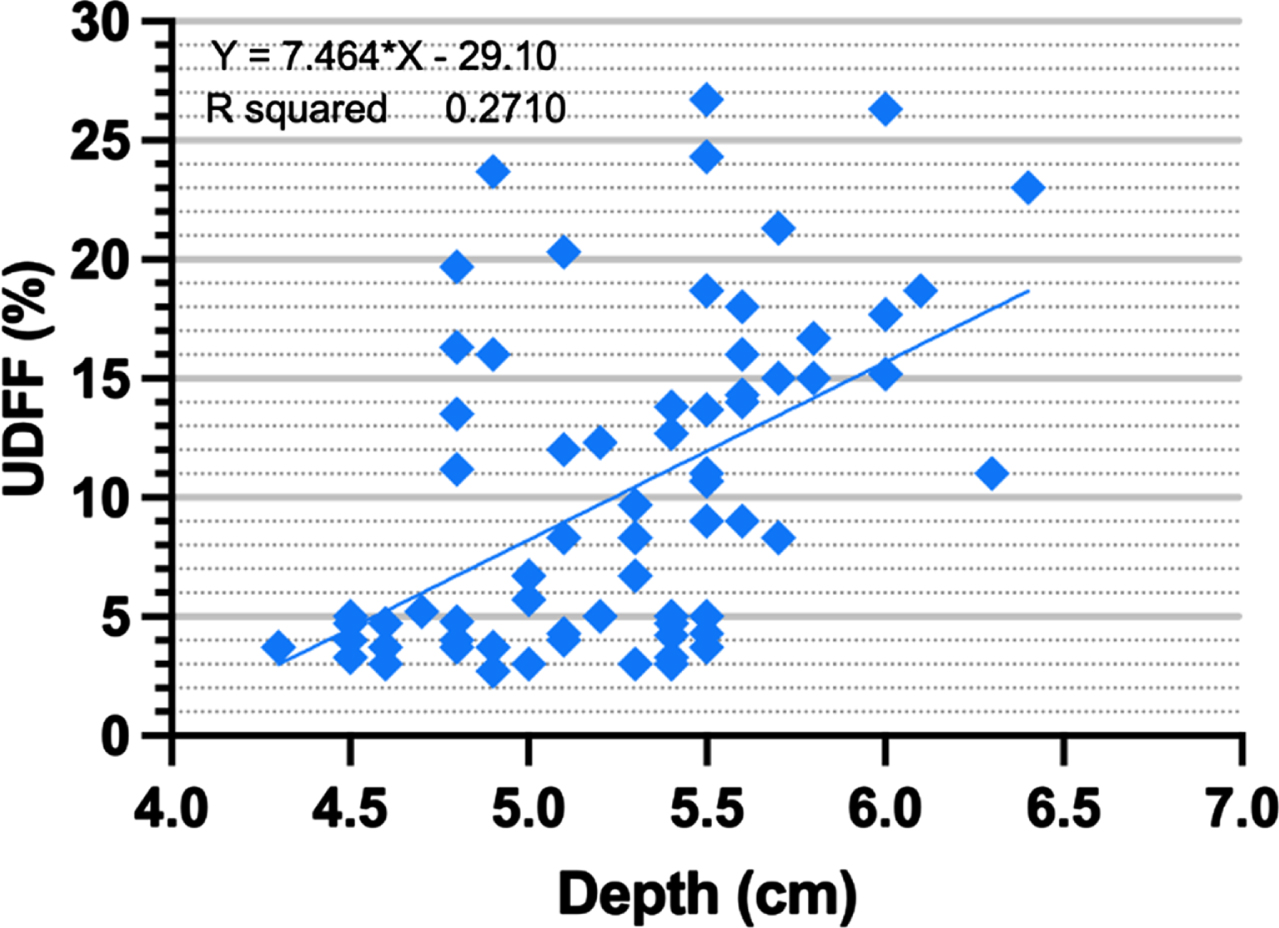
Scatter plot shows the relationship between ultrasound-derived fat fraction (UDFF) values measured from different depths (rs = 0.546, P < 0.001).
The median UDFF values of V hepatic segment and VIII hepatic segment were 8.7% (IQR: 4.0 –14.7) and 5.9% (IQR: 3.9 –15.1), respectively. No significant differences in UDFF values were found between V hepatic segment and VIII hepatic segment (U = 684.5, P = 0.697). The Bland-Altman analysis showed a bias across UDFF values between V hepatic segment and VIII hepatic segment, with a mean difference of 0.26%. The 95% LOA of the mean UDFF values ranged from -7.50% to 8.03% (Fig. 5).
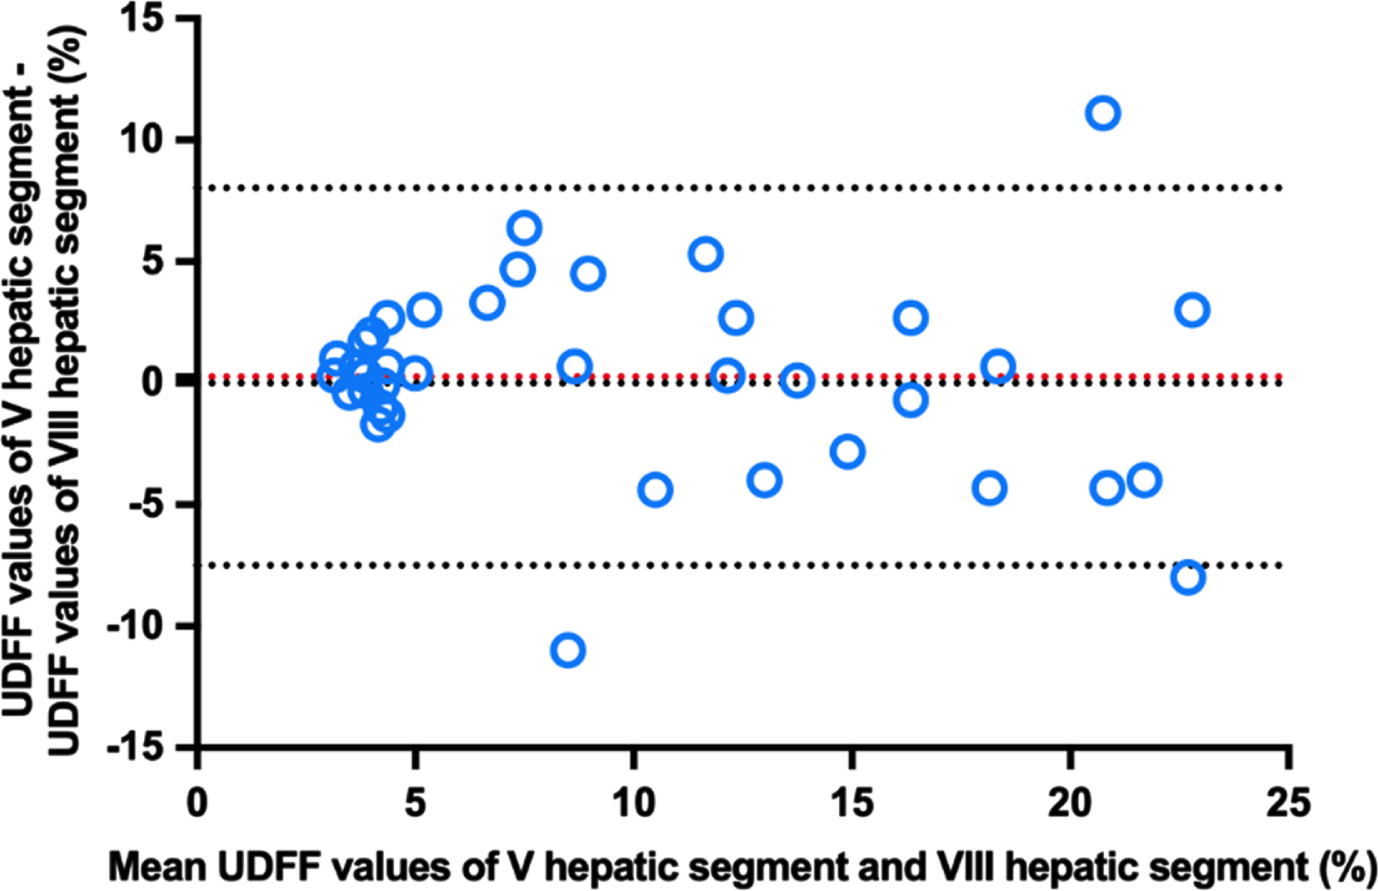
The Bland-Altman plot shows agreement between ultrasound-derived fat fraction (UDFF) values measured from V hepatic segment and VIII hepatic segment.
Hepatic steatosis is characterized by poor microcirculation and disorders in hepatic microcirculation play a potentially critical role in the progression of NAFLD, and the grade of steatosis is inversely associated with hepatic microcirculatory blood flow [32]. Fatty liver was detected by BMUS in 47.4% (18/38) participants in the present study, and changes in the flow velocity of hepatic vein were found in 7.9% (3/38) cases. A compressive effect of fat deposition in the hepatocytes on hepatic veins leads to a trend for an abnormal waveform to be seen in patients with fatty liver [33]. Fat content pathologically elevated in the liver was defined as hepatic steatosis, leading to serious consequences, such as cirrhosis, hepatic function failure, and hepatocellular carcinoma. Although a reduction in the liver fat content is associated with improvement of the disease, in case of progressive disease, liver fibrosis increases while liver fat content decreases. Repeated quantitative assessment of fat content plays an essential role as a monitor of follow-up in patients with NAFLD.
Non-invasive imaging approaches were recommended to assess hepatic steatosis by the American Association for the Study of Liver Diseases [34]. Computerized tomography (CT) and magnetic resonance imaging (MRI) are increasingly used to assess hepatic steatosis, providing an objective measurement method for liver fat content [23, 35]. Moreover, MRI is currently recognized as the reference standard for detecting and grading hepatic steatosis [23]. It is reported that a positive correlation between MRI-PDFF and liver biopsy for assessing hepatic steatosis, and MRI-PDFF can reduce diagnostic errors caused by puncture sampling limitations [13]. However, several challenges existed for CT and MRI technique [36], including high cost, inconvenience, and lack of consensus on diagnostic standards. In addition, CT and MRI usually are used for preoperative staging. Fortunately, ultrasound is a promising tool in routine examinations, and even intraoperative scene [37, 38].
The CAP measurement, using FibroScan to estimate AC of the liver, is recommended as a screening tool for NAFLD by the guideline of the Asia-Pacific Working Party on Non-Alcoholic Fatty Liver Disease [39]. The CAP measurement is typically performed blindly (without ultrasound-guided) ten times to obtain a valid value and has a failure rate of 7.7% –14.0% [40–43]. Especially in patients with high obesity, CAP was slightly unsatisfactory [44]. Compared with CAP, UDFF measurement is guided by BMUS. Operators can easily assess UDFF, and measurement quality control indicators help operators to obtain higher-quality UDFF images.
USAT is another type of ultrasound imaging that restitutes the real sound speed and AC from the ultrasound beam under the guidance of BMUS images improving the reproducibility and accuracy of measurements [45]. However, the UDFF technique is a quadratic fit based on ultrasound using AC and BSC parameters of the radiofrequency echoes in tissues [13, 20]. AC is a measure of the spatial rate of ultrasound energy loss in tissue, while BSC is a measure of the ultrasound energy returned from tissue, which is related to tissue microstructure [46]. Recent studies have shown promising results using both AC and BSC to detect hepatic steatosis. Han et al [20] investigated adults with known or suspected NAFLD using a multivariable quantitative ultrasound approach (AC and BSC) to detect hepatic steatosis and quantified hepatic fat. They found that the multivariable quantitative ultrasound approach had an area under the receiver operating curve of 0.89 for the diagnosis of NAFLD. The author showed a promising model using AC and BSC for detected hepatic steatosis assessment in NAFLD.
In addition, the UDFF model has the same scale (%) and is correlated with MRI-PDFF [13, 22]. A study [22] of 101 patients who underwent both ultrasound scans and MRI-PDFF assessment showed a 0.87 correlation coefficient between UDFF and MRI-PDFF. As sufficient consistency with MRI-PDFF, UDFF with cost-effectiveness can be more widely applied.
The present research was carried out to provide a methodologic basis for the further study of the liver in pathologic conditions. Participants with fatty liver had higher UDFF values than participants without fatty liver, demonstrating the potential value of UDFF measurement to assess the presence of fatty liver based on BMUS. Moreover, UDFF values elevated as the grade of the fatty liver increased.
The repeatability of UDFF measurement precision was evaluated in this study with the same position in replicate measurements and demonstrated excellent absolute agreement (ICC values was 0.882) of three times UDFF acquisitions. In addition, UDFF values measured from V hepatic segment through the right intercostal view and VIII hepatic segment through the right subcostal view also showed excellent agreement (ICC values were 0.847 and 0.915, respectively). These results revealed that the repeatability of UDFF measurement was not associated with positions of ultrasound scanning. Furthermore, the reproducibility of UDFF measurement precision was also evaluated in this study with conditions that vary in replicate measurements. The results of this study demonstrated that the repeatability of UDFF measurements was not affected by the depths and segments. These results support the clinical applicability of UDFF for the assessment of hepatic steatosis. Some considerable factors may be the explanation for the good performance of UDFF measurement. The UDFF reference phantom data are built into the ultrasound scanner, eliminating the need to scan phantoms in a clinical setting, and allowing the use of highly averaged calibration data [22]. In addition, the breath-holding maneuver was applied to all participants to minimize artifacts caused by excessive motion during the UDFF measurement.
The limitations of the study are that no participants with nonclinical steatosis were confirmed by biopsy or MRI measurements. The repeatability and reproducibility were assessed on the UDFF values, and not on the clinical outcomes (e.g., predicted NFALD diagnosis).
In conclusion, UDFF provides a novel non-invasive imaging tool for hepatic steatosis assessment with excellent feasibility.
Funding
Supported by The Sino-German Mobility Program of NSFC and DFG (Grant No. M-0504), National Natural Science Foundation of China (Grant No. 82071942, 82272013), Shanghai Pujiang Program (Grant No. 2020PJD008).