Abstract
BACKGROUND:
Recent studies illustrated the effects of granzymes (GZMs) gene alterations on immunotherapy response of cancer patients. Thus, we aimed to systematically analyze the expression and prognostic value of GZMs for immunotherapy in different cancers, and identified heterogeneity of the GZMs expression-based CD8
METHODS:
First, we analyzed GZMs expression and prognostic value at pan-cancer level. Meanwhile, we established a GZMs score by using the single-sample gene set enrichment analysis (ssGSEA) algorithm to calculate the enrichment scores (ES) based on a gene set of five GZMs. The potential value of GZMs score for predicting survival and immunotherapy response was evaluated using the tumor immune dysfunction and exclusion (TIDE) and immunophenoscore (IPS) algorithm, and we validated it in immunotherapy cohorts. CellChat, scMetabolism, and SCENIC R packages were used for intercellular communication networks, quantifying metabolism activity, and regulatory network reconstruction, respectively.
RESULTS:
The GZMs score was significantly associated with IPS, TIDE score. Patients with high GZMs score tended to have higher objective response rates of immunotherapy in melanoma and urothelial carcinoma. GZMs expression-based CD8
CONCLUSIONS:
The higher GZMs score may indicate better response and overall survival (OS) outcome for immunotherapy in melanoma and urothelial carcinoma but worse OS in renal cell carcinoma (RCC). The GZMs score is a potential prognostic biomarker of diverse cancers. RUNX3 and ETS1 may be the potential targets to regulate the infiltration of GZMs expression-based CD8
Introduction
Cancer has ranked as a leading cause of death worldwide, and immunotherapy rapidly emerged with effectiveness in treating various cancers by influencing the interaction between the human immune system and cancer [1, 2]. Despite immunotherapy being widely applied in several cancers, only a minority of patients experience durable survival [3]. There is a general recognition of the urgent need for excavating predictive biomarkers to assess the response to immunotherapy.
Human Granzymes (GZMs) comprise a family of five (granzyme A/GZMA, granzyme B/GZMB, granzyme H/GZMH, granzyme K/GZMK, granzyme M/GZMM) secreted serine proteases, which were mainly found in the cytotoxic granules of cytotoxic T lymphocytes (CTLs) and natural killer (NK) cells. CTLs and NK cells used the granule exocytosis pathway to target cell death by delivering the contents of cytotoxic granules to the surface of target cells [4]. The perforin, one of the granule proteins, was thought to facilitate GZMs entry into target cells by physically forming holes in the cell membrane [5, 6]. Previous studies of GZMs mainly focused on the two most abundant members (GZMA and GZMB) and their role in killing cancer cells [7]. GZMB was believed to induce target cell apoptosis by cleaving caspase-3 or caspase-3 substrates [7, 8, 9]. Recently, Zhou et al. [10] reported that GZMA from cytotoxic lymphocytes cleaves gasdermin B (GSDMB) to trigger pyroptosis in GSDMB-positive cells. Kontani et al. [11] reported that GZMB might play a role in suppressing nodal metastasis of cancer cells in breast and lung cancers.
The high expression of the GZMs in cytotoxic cells and the well-established role of these cells in cancer immune surveillance lead to a general belief that GZMs are mainly protective cytotoxic proteases that block cancer development. However, GZMs may also be crucial regulators of biological processes involved in cancer development and progression, such as immune homeostasis, inflammation, angiogenesis, and invasiveness [12]. Findings accumulated over the past several years on functions of GZMs other than cell death. Metkar et al. [13] have shown that extracellular granzyme A can promote the release of pro-inflammatory cytokines from human monocytes and murine peritoneal macrophages. The identification of GZMs expression in cells other than CTLs and NK cells, for example, certain GZMs are expressed and secreted by B cells, mast cells, keratinocytes, basophils, macrophages, dendritic cells, and regulatory T-cells, in the absence of detectable perforin, indicating that GZMs may have hitherto unsuspected roles in immunity [14, 15, 16, 17, 18, 19, 20, 21].
Furthermore, a comprehensive understanding of GZMs in pan-cancer is still lacking. The effects of GZMs have not been illustrated clearly. The heterogeneity of different cancer types may cause the different cellular components of tumor tissue and make GZMs perform different functions. We integrated the expression of GZMs as a score and explored its associations with immune infiltration, biological processes, immunotherapy response, and prognostic value in pan-cancer. Furthermore, we identified the subsets of CD8
Materials and methods
Data sources
This study was performed mainly based on the Cancer Genome Atlas (TCGA) and Gene Expression Omnibus (GEO) databases. The TCGA data, including Transcripts Per Kilobase Million (TPM) expression and clinical information (survival status, survival time, grades, stages, etc.) and Copy number variation (CNV) data, were downloaded from UCSC XENA (
GZMs score
The ssGSEA algorithm [22] was used to calculate the ES. The ES calculated based on a gene set of five granzymes by ssGSEA was defined as GZMs score. The GZMs scores represented the integrated level of the expression of five GZM genes in each sample.
Gene expression and clinical analysis
We used packages edgeR [23] for differential gene expression analysis and calculated the log
Survival analysis
Before Kaplan-Meier curve analysis, the continuous variables were divided into binary variables by the optimal values calculated by package survminer. Log-rank tests were used to test the different survival rates between the two groups. For immunotherapy datasets from the same cancer type, the meta-analysis assay was used to calculate the hazard ratio (HR) and describe the pooled effects of the GZMs score as a continuous variable.
Gene set enrichment analysis
We calculated the correlation coefficients between the GZMs scores and every gene of the whole transcript, respectively, in each cancer type. The gene list was then re-ranked by the correlation coefficients and inputted into gene set enrichment analysis (GSEA) based on the package ClusterProfiler [25]. The signaling pathways information in the Molecular Signatures Database (MSigDB) (
Estimation of immune-cell type fractions
Cell-type identification is a deconvolution algorithm that calculates the putative proportion of immune cell fraction based on gene expression profiles by estimating relative subsets of RNA transcripts (CIBERSORT algorithm) [26]. We used the reference set with 22 sorted immune cell subtypes to analyze the abundance of tumor-infiltrating immune cells in TCGA data. Normalized gene expression data were analyzed using the CIBERSORT algorithm. In the scRNA-seq analysis, we used Bayesian cell proportion reconstruction inferred using statistical marginalization (BayesPrism) [27], to predict the cellular composition and gene expression in individual cell types from bulk RNA-seq, using patient-derived, scRNA-seq as prior information.
Methylation profiles and mutation profiles
GSCALite platform (
The copy number alteration (CNA) and mutation landscape of GZMs in pan-cancer were gained from cBioPortal (
Estimation of response to immunotherapy and drug sensitivity
The predictive response to immune checkpoint blockade (ICB) therapy was estimated by using the TIDE and IPS algorithms. Peng Jiang et al. [30] developed TIDE, a computational method to model two primary mechanisms of tumor immune evasion: the induction of T cell dysfunction in tumors with high infiltration of CTL and the prevention of T cell infiltration in tumors with low CTL levels. Then the correlation between the expression of GZMs and the predictive immune response was explored. The IPS could be calculated by analyzing gene expression profiles in the tumor samples comprising four major categories of genes that determine immunogenicity effector cells, immunosuppressive cells, MHC molecules, and immunomodulators [31]. Then the IPS was calculated with a range of 0–10 based on the z-score for gene expression of representative cell types. A prophetic algorithm [32] was used to establish a ridge regression model to predict the potential sensitivity of 33 drugs based on the expression profile in the TCGA database.
Analysis of single-cell RNA sequencing data
One scRNA-seq dataset was analyzed to investigate the expression of the GZMs and the potential intercellular communication in single-cell resolution. Unsupervised clustering was based on the gene expression profiles using the R package Seurat [33] and passed to t-Distributed Stochastic Neighbor Embedding (t-SNE) or Uniform Manifold Approximation and Projection (UMPA) for clustering visualization. The clusters were annotated manually or referenced to the inferred results from the package SCINA [34], an automatic cell type detection and assignment algorithm for scRNA-seq. The reference data were downloaded from the supplementary data of a study developed by J Javier Diaz-Mejia [35]. The malignant cells were recognized by the package infercnv [36].
CD8
We conducted the enrichment analysis based on the differential genes between different CD8
Statistical analysis
All statistical analyses were conducted by R version 4.1.0 (R package: pheatmap, ggplot2, rms, glmnet, forest plot, limma, GSVA, survminer, survival ROC, beeswarm, clusterProfile, Seurate, SingleR, etc.). Unless otherwise stated, a two-tailed
Results
The methylation analysis of GZMs in human cancers
DNA methylation is related to changes in gene expression in cancers. Thus, the DNA methylation differences of GZMs in various cancers between tumors and adjacent normal tissues were evaluated by the GSCALite platform. The results indicated that all five GZMs methylation was significantly down-regulated in liver hepatocellular carcinoma (LIHC), Kidney Clear Cell Carcinoma (KIRC), Lung Squamous Cell Carcinoma (LUSC), breast carcinoma (BRCA), Head and Neck Squamous Cell Carcinoma (HNSC) (Fig. 1A). Next, we evaluated the correlation between the DNA methylation and mRNA expression of GZMs in pan-cancer. The results exhibited that the GZMs mRNA expression was mainly negatively correlated with its DNA methylation in most tumors, especially in Kidney Papillary Cell Carcinoma (KIRP), Thyroid Carcinoma (THCA), KIRC, LUAD, BRCA, and Testicular Germ Cell Tumors (TGCT) (Fig. 1B).
The methylation analysis and mutation landscape of GZMs in human cancers. (A) DNA methylation differences of GZMs between tumors and normal tissues in various cancers with GSCALite platform. (B) Correlation between the DNA methylation and mRNA expression of GZMs in 33 cancer types. (C) Landscape of genomic aberrations in the GZMs genes in cancer. Each column represents a patient. The frequency of alterations in five genes of GZMs are presented. Only patients with genomic alterations in the indicated genes are shown. Alteration rates per gene are displayed in the left labels. (D) SNV percentage of GZMs in different cancers. (E) GZMs alteration (mutation and CNAs) frequency in 32 TCGA cancer types. (F) Single Nuclear Tide Polymorphisms of GZMs in pan-cancer. The right panel presents the counts of mutation of each gene respectively. (G) CNV profiles of GZMs in 33 cancer types with the GSCALite platform. Hete Amp, heterozygous amplification; Hete Del, heterozygous deletion; Homo Amp, homozygous amplification; Homo Del, homozygous deletion. (H) Correlation between the CNV and mRNA expression of GZMs in different cancers.
Expression and clinical analysis of GZMs in pan-cancer. (A) Bubble map of the differential expression of GZMs between tumor and normal samples. Blue and red dots represented down-regulated and up-regulated expression in tumors, respectively, the darker the color, the greater the difference. The size of the dots represented statistical significance. The black outline border indicates the FDR 
Systematically analysis of GZMs scores in pan-cancer. (A) Box plot presents the differential GZMs scores between the tumor and normal tissues. (B) The forest plot showed survival analysis of the high GZMs score compared with the low GZMs score. The heat map of clinical features showed the correlations between GZMs score and clinical features. Color-blocks indicated that clinical features are associated with GZMs score (Kruskal-Wallis test, 
Analysis of GZMs genetic alterations in pan-cancers was explored with the cBioPortal website and GSCALite platform. The results showed that genetic alterations of GZMs occurred in 1.2%–1.8% of patients (Fig. 1C). It seemed that GZMA and GZMK have the same state of CNV, and so do the GZMB and GZMH (Fig. 1C). Figure 1D provided the percentage of single nucleotide variants (SNV) of GZMs in the pan-cancers, indicating that SNV of GZMs mainly appeared in skin cutaneous melanoma (SKCM) and Uterine Corpus Endometrial Carcinoma (UCEC). The genetic alteration profiling of GZMs showed that its mutation was one of the most important factors for alteration in SKCM and UCEC, while the amplification was the main factor in Sarcoma (SARC) and Adrenocortical Carcinoma (ACC), so do the deep deletion in ovarian serous cystadenocarcinoma (OV) (Fig. 1E). The oncoplot showed that the GZMs mutations were mainly consistent with missense mutations (Fig. 1F).
GSCALite platform provided heterozygous and homozygous CNV profiles in pan-cancers. The pie chart exhibited that the heterozygous CNVs of GZMs were more frequent in various cancers (Fig. 1G). The frequency of amplification and deletion was differing from cancers. Furthermore, the correlation between CNV and gene expression was investigated (Fig. 1H). The result showed that GZMA and GZMK expression was positively correlated with CNV in Stomach Adenocarcinoma (STAD), LUSC, and HNSC. The GZMB and GZMH expression were negatively correlated with CNV in Prostate Adenocarcinoma (PRAD) and THCA.
Expression and clinical analysis of GZMs in pan-cancer
We performed differential gene expression analysis of GZMs in different types of cancers (Fig. 2A). Differential expression between tumor tissues and adjacent normal tissues was identified (FDR
A comprehensive expression-clinical features analysis of GZMs in 33 types of TCGA cancer (Fig. 2C) was carried out. Except for immune classification, it did not show significant relevance between clinical features and the expression of each granzyme in most cancer types. The subtype C2 (IFN-gamma Dominant), C3 (Inflammatory), and C6 (TGF-beta Dominant) had a higher expression of GZMs, while the C5 (Immunologically Quiet) had a lower expression (Fig. 2D), indicating GZMs expression might be associated with the immune microenvironment. Besides, the expression of GZMs at the protein level also shows the differential expression between the tumor and normal tissue and between different cancers (Fig. 2F).
Systematically analysis of GZMs score in pan-cancer
We calculated the GZMs score for each sample in pan-cancer as described in the methods. The heatmap of correlation coefficients among GZMs expression and GZMs score presented a significantly strong positive correlation (Fig. 2E). GZMs scores in different types of cancers also showed distinction (Fig. 3A). We explored the prognostic prediction value of the GZMs score and evaluated the associations between the GZMs score and clinical features, immune classifications, estimated components of immune cells, and the propensity of response to immunotherapy. High GZMs scores were associated with significantly better OS in BRCA, head and Neck squamous cell carcinoma (HNSC), LIHC, OV, and SKCM, but worse OS in brain lower grade glioma (LGG) and uveal melanoma (UVM) (Fig. 3B).
Furthermore, we explored the correlations between immune-related features and GZMs scores. We applied the CIBERSORT algorithm to assess the components of the tumor-infiltrating immune cells. In most cancers, each GZM gene expression (Fig. S1A) and GZMs score (Fig. 3B) positively correlated with CD8
To determine patients’ responses to anti-cancer drugs, we also inferred the predictive drug sensitivity of the 33 drugs in TCGA data. High GZMs scores were usually associated with lower predictive value in most cancer types, which meant that tumor tissues with high levels of GZMs might be more sensitive to certain drugs (Fig. S2E). In LUAD, the results presented that patients with higher GZMs scores may be more sensitive to Cisplatin, Docetaxel, Etoposide, Paclitaxel, and Erlotinib (Fig. S2F–K).
Gene set enrichment analysis based on GZMs score
Gene set enrichment analysis based on the rank of the correlation coefficients. (A) Heatmap of pathways that were positively associated with GZMs score. The colors represented the normalized enrich score (NES) of this pathway in certain cancer types. (B) Heatmap of pathways that were negatively associated with GZMs score. The colors represented the NES of this pathway in certain cancer types. (C) GSEA on certain gene sets in BRCA and UVM, including 4 positively associated pathways and 2 negatively associated pathways. (D) The bar plot showed the pathways behaved inversely in BRCA and UVM. The NES was plotted on the X-axis.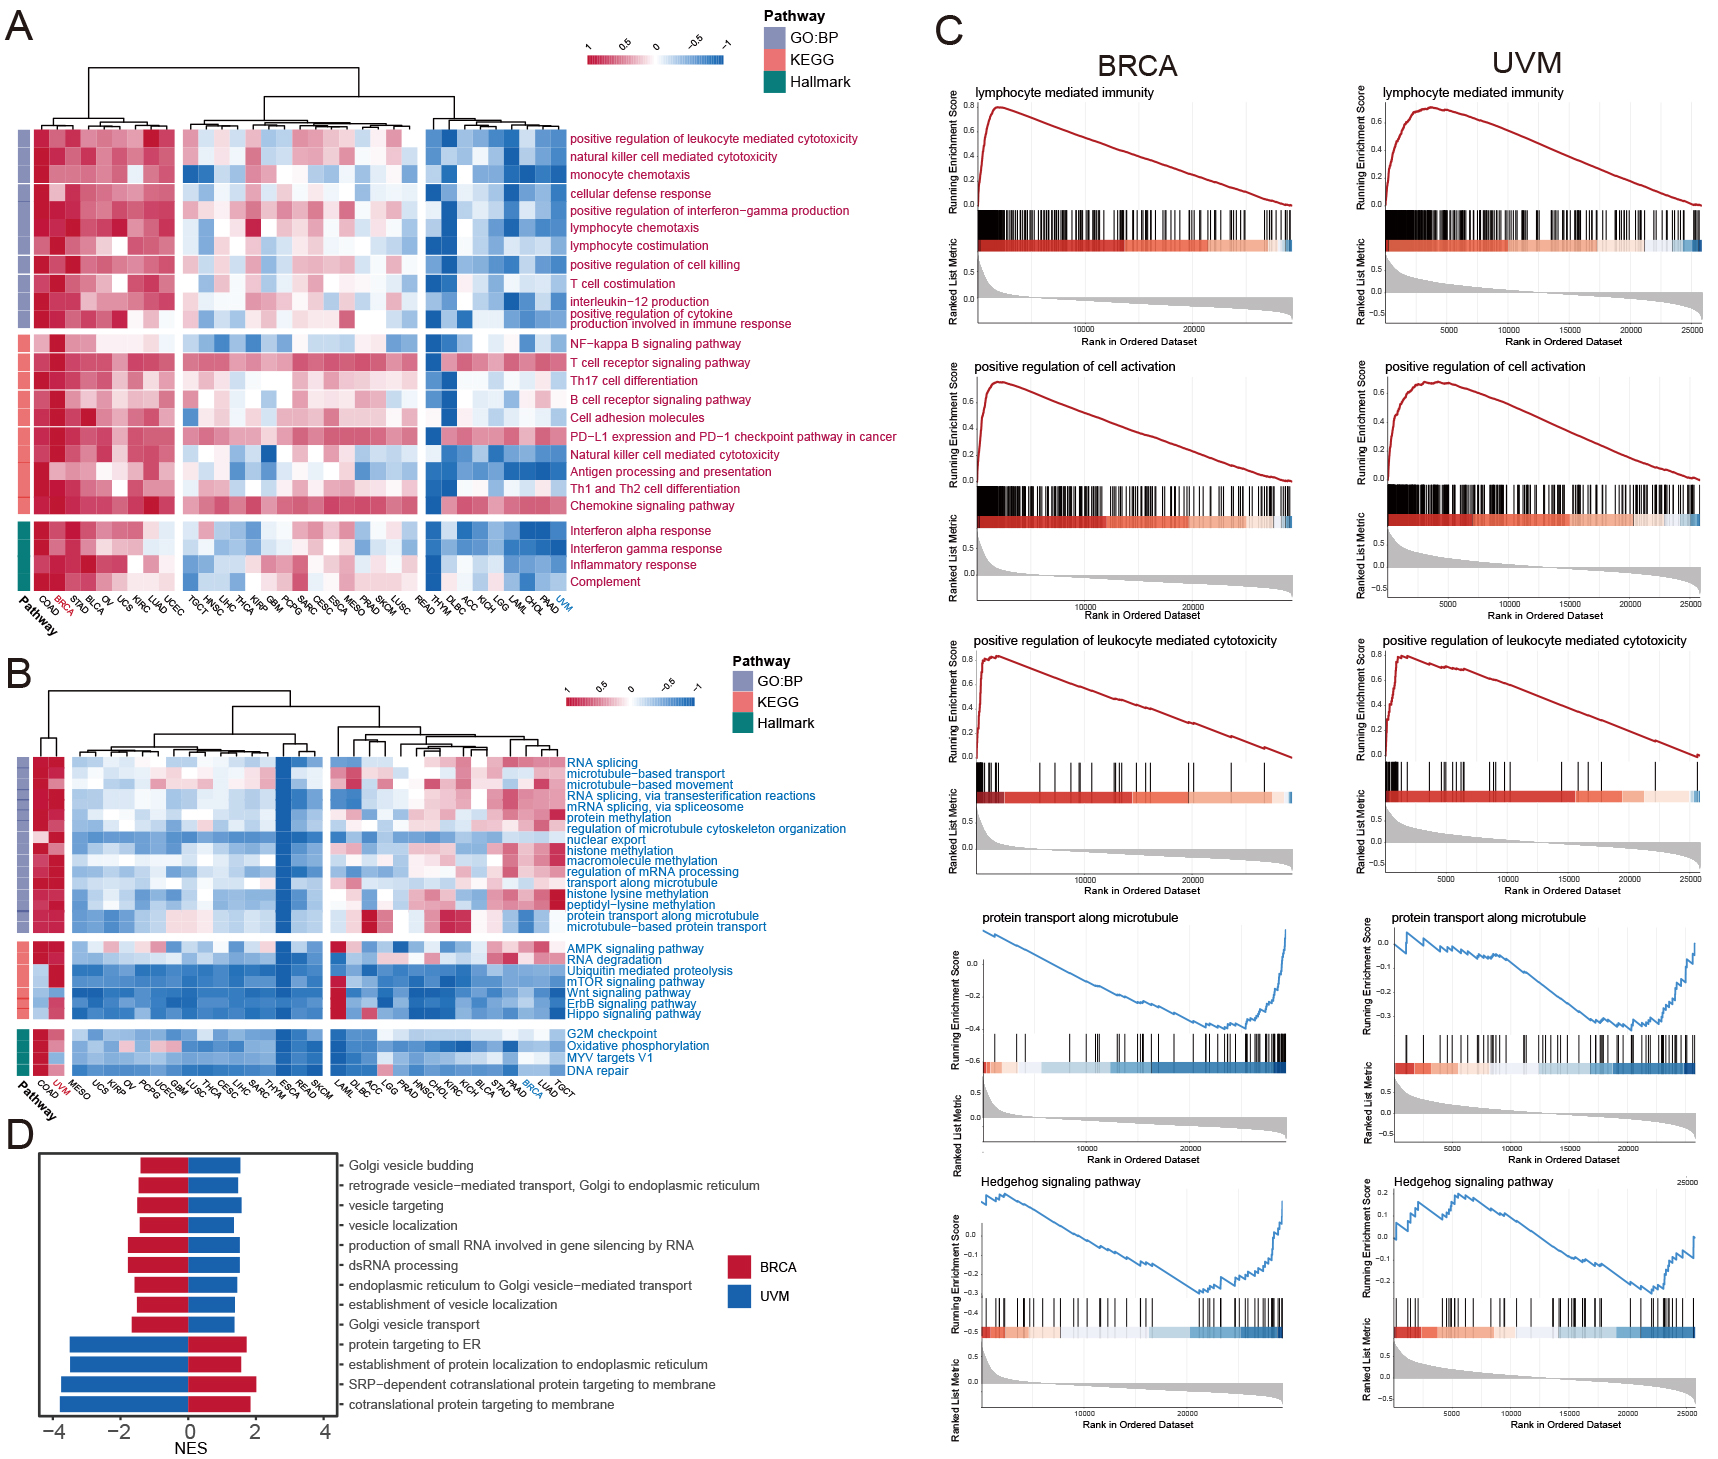
Survival analysis of GZMs score in immunotherapy datasets. (A) Kaplan-Meier curves estimated the OS between the high and the low GZMs score group (divided by the cut-off value based on the lowest 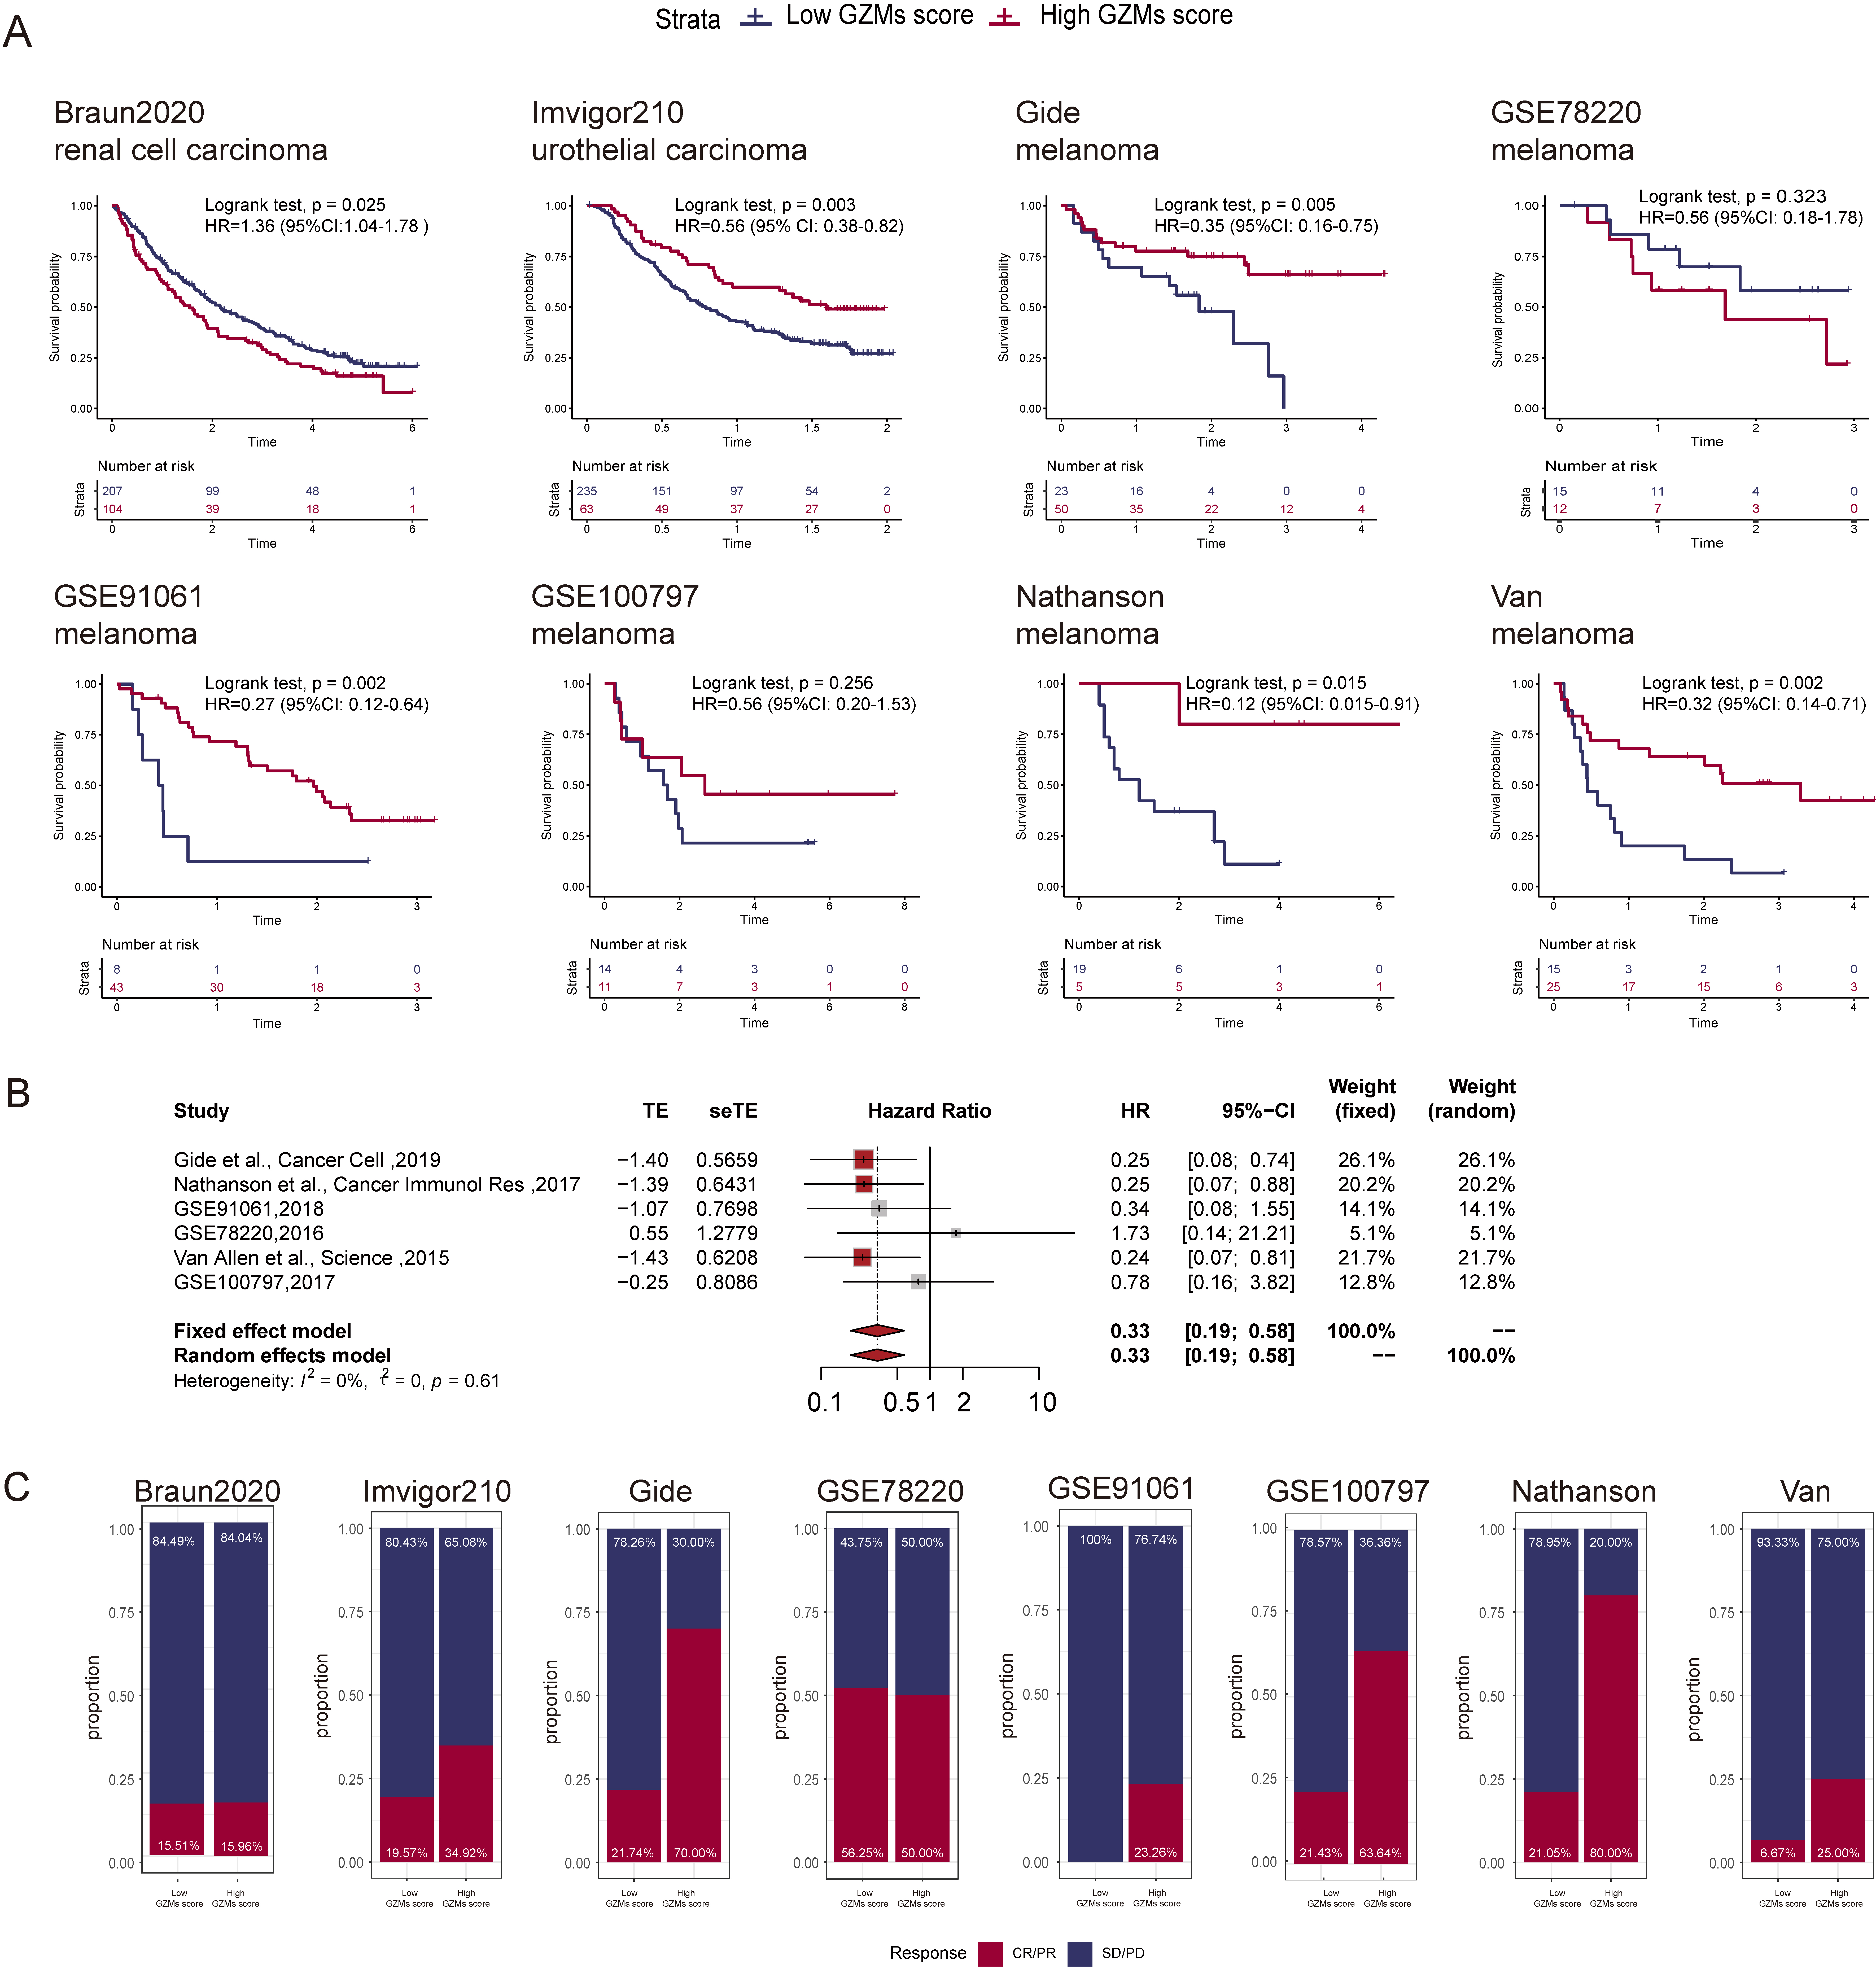
Characters of GZMs expression in the single-cell resolution. (A) scRNA-Seq data from 15 LUAD samples were projected onto the t-SNE and then annotated (left part), the immune cells and the CD8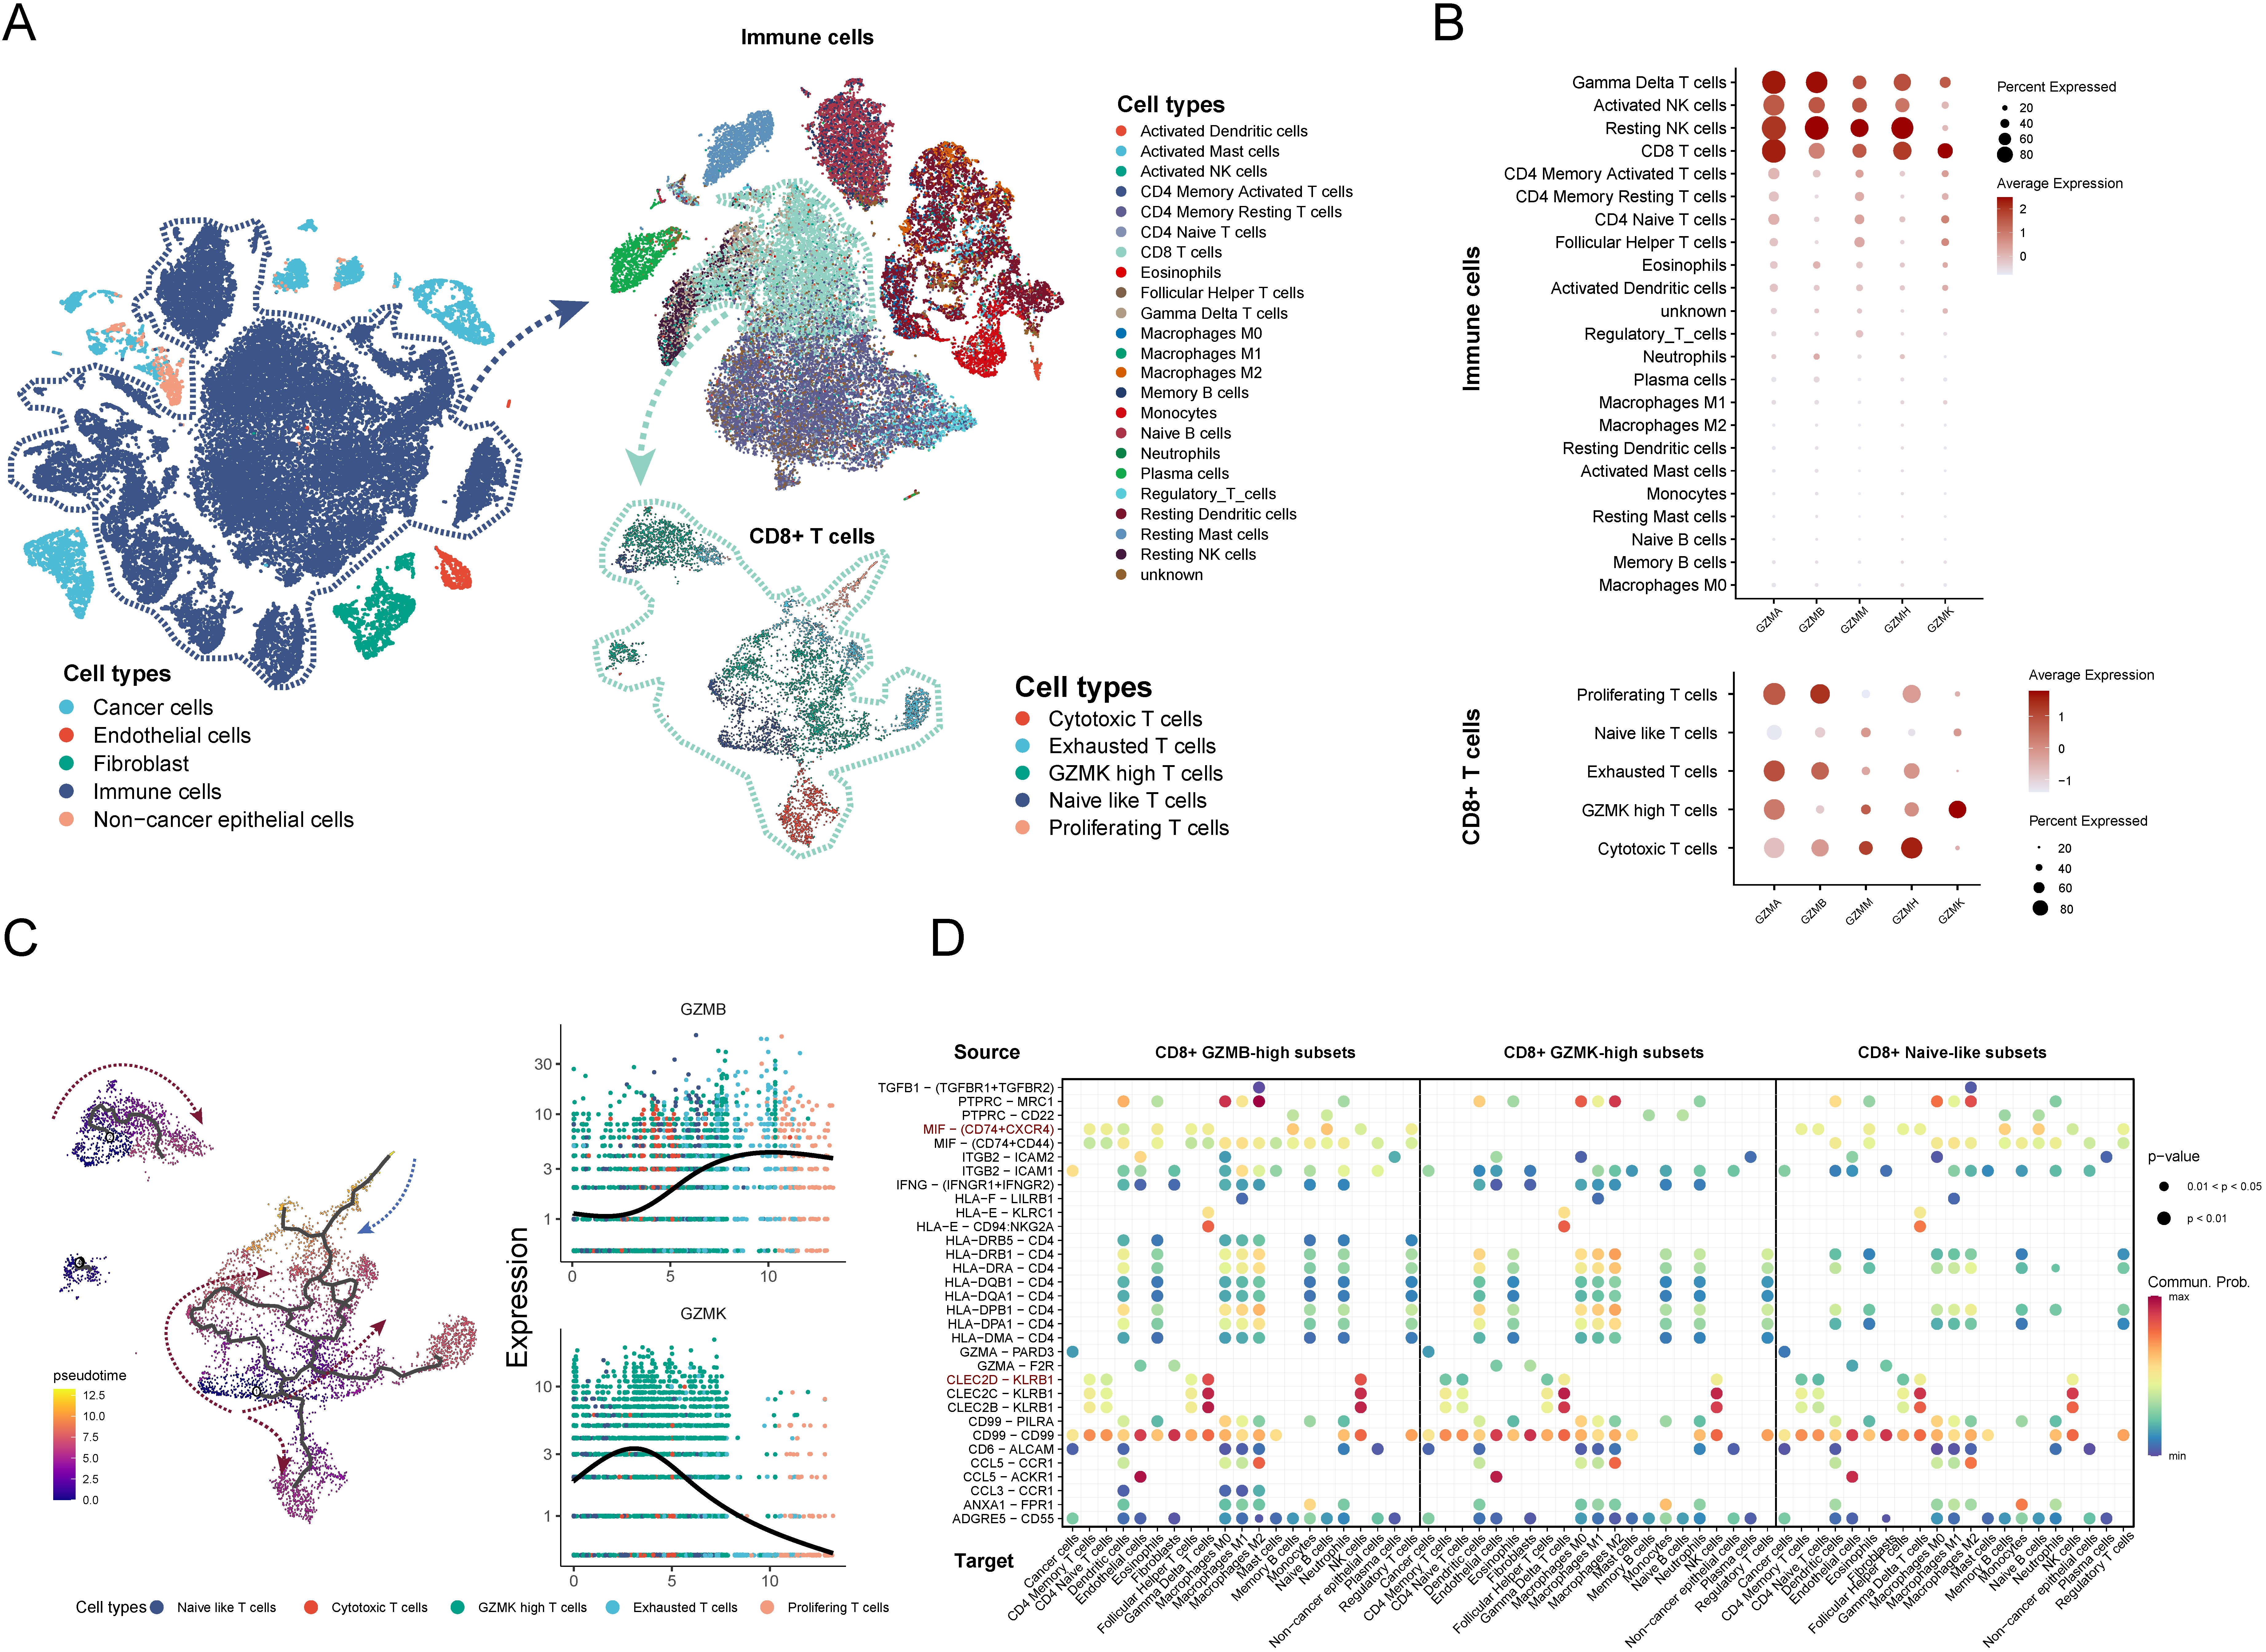
Heterogeneities of CD8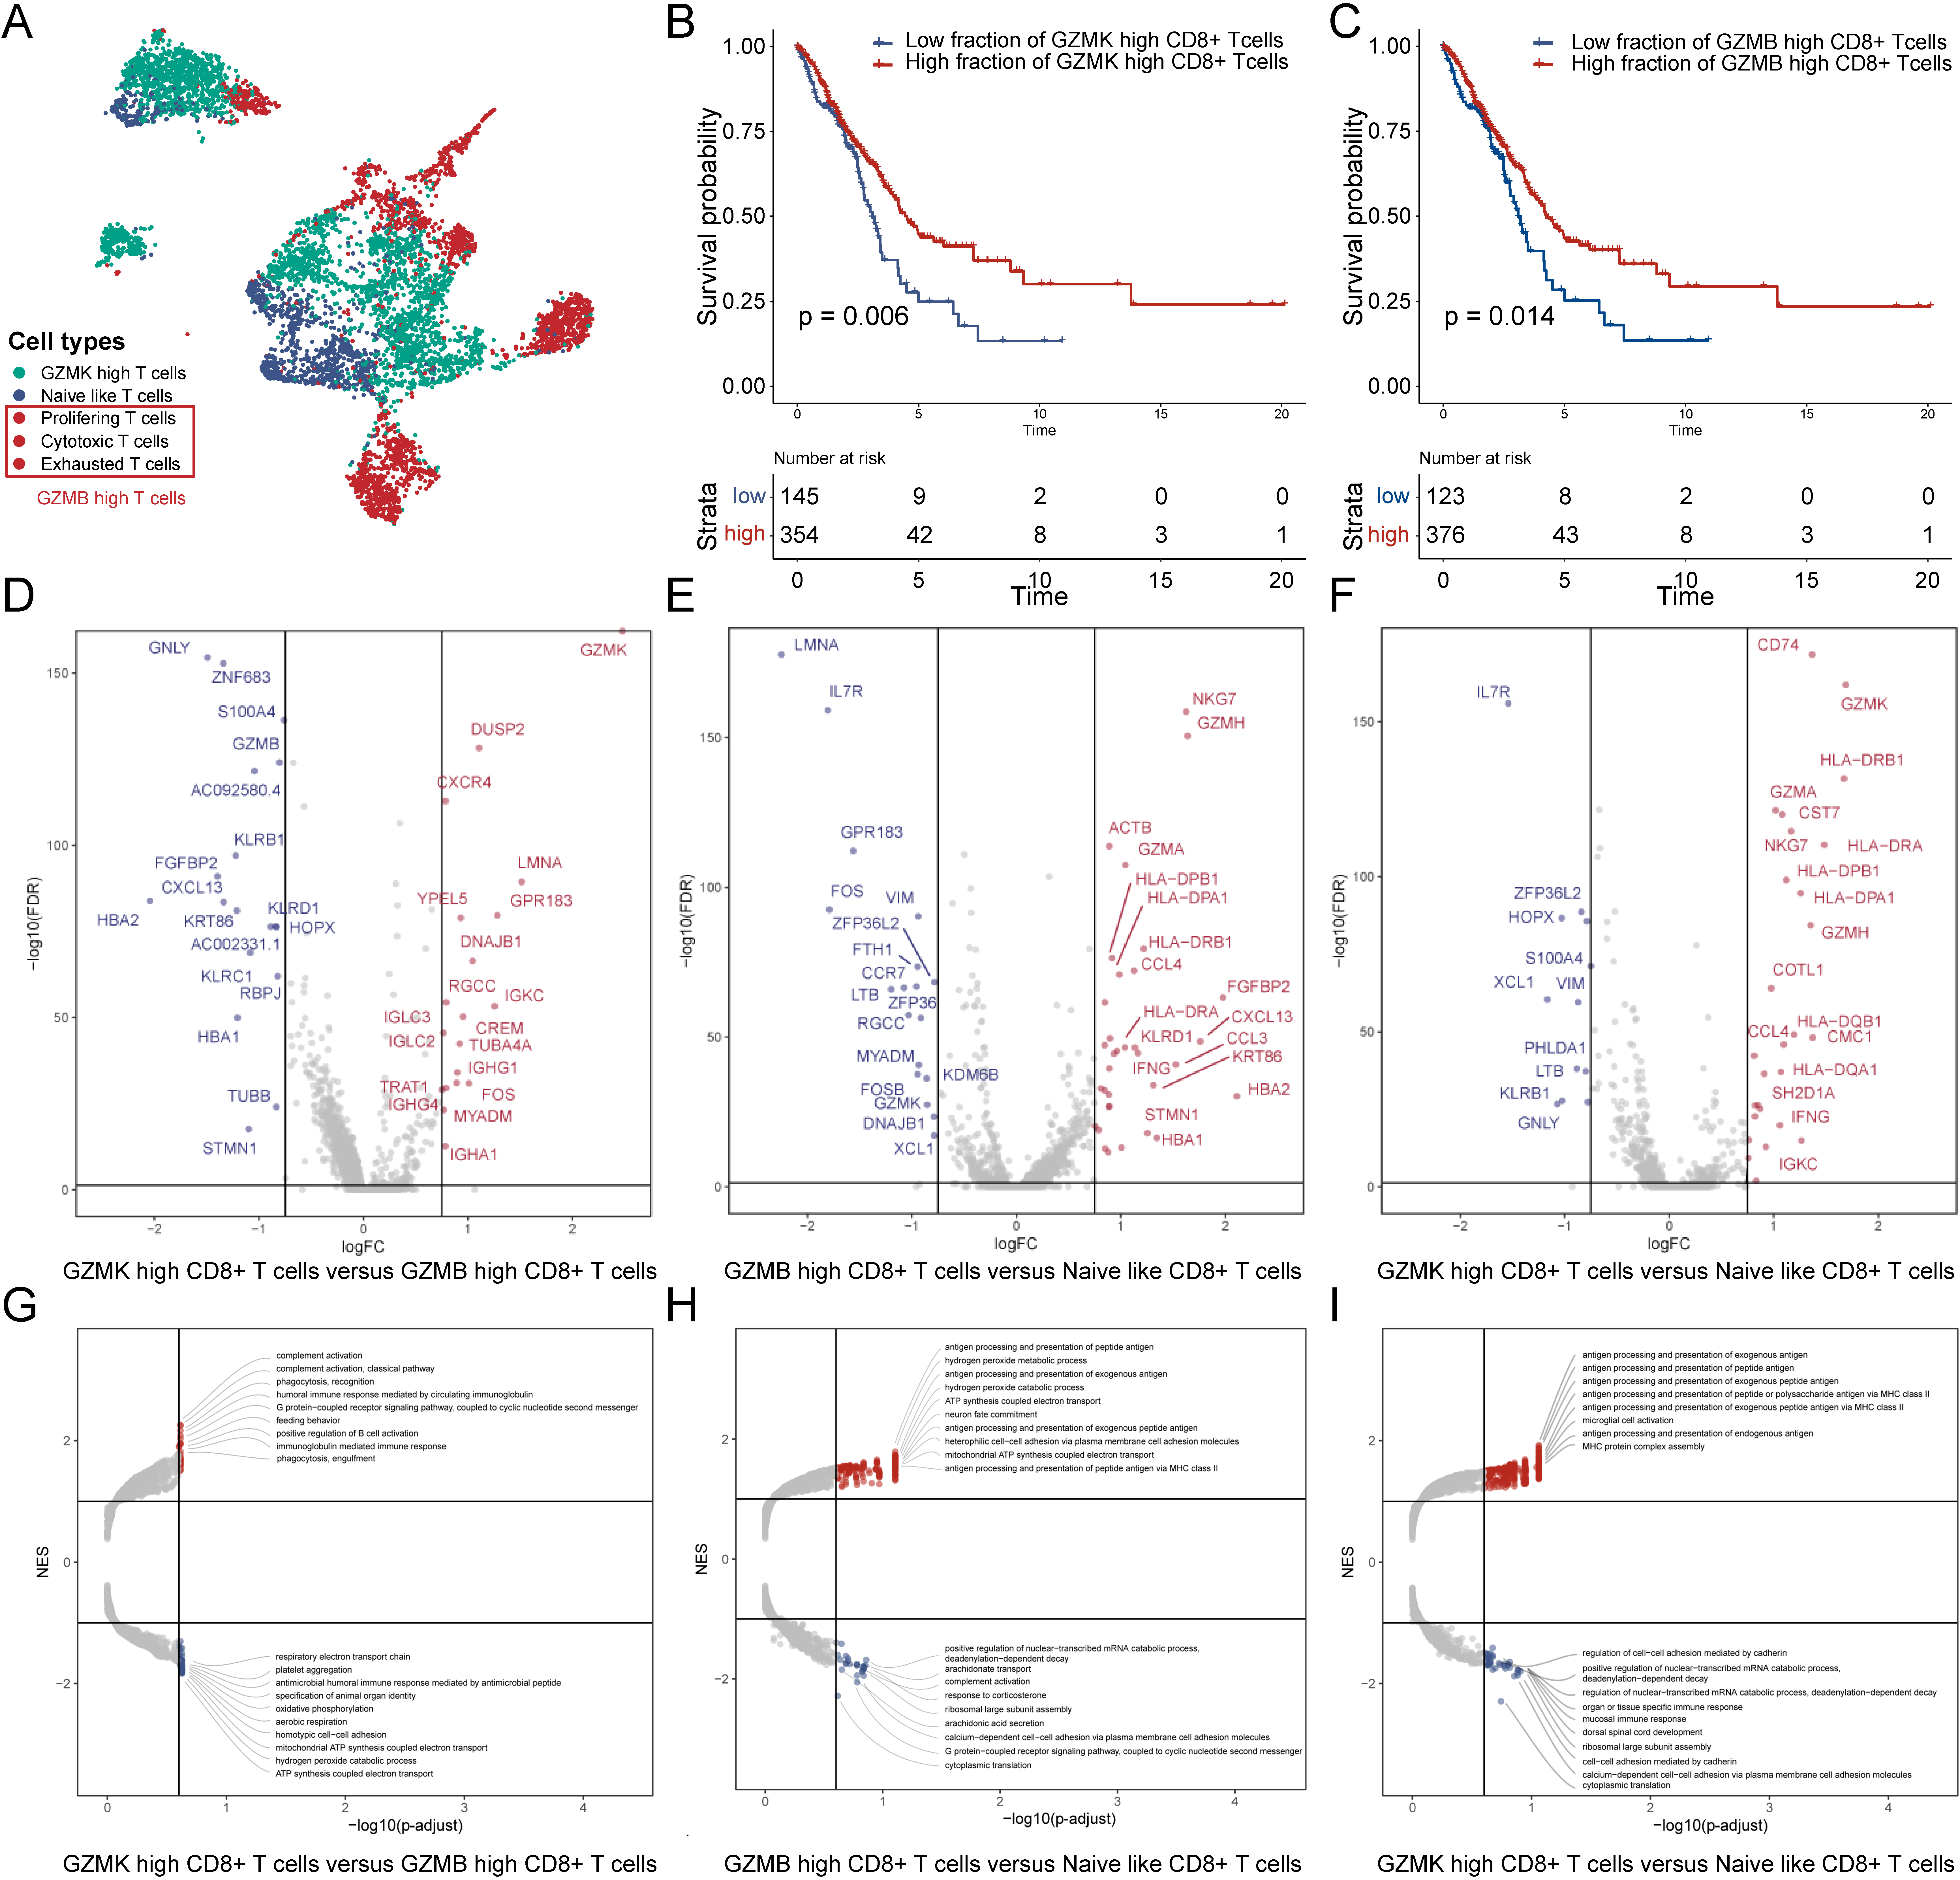
We performed the GSEA analysis to explore the pathways associated with the GZMs score (Fig. 4A), positively related pathways were mainly associated with cytotoxicity (positive regulation of leukocyte mediated cytotoxicity, natural killer cell-mediated cytotoxicity, etc.), immune response (cellular defense response, interferon-alpha response, interferon-gamma response, Inflammatory response), activation, and the chemotaxis of immune cells (monocyte chemotaxis, lymphocyte chemotaxis, chemokine signaling pathway). The high GZMs score was associated with the activation of immune-related pathways involved in anti-tumor in most cancers. It was noted that these positively related pathways generally had lower Normalized Enrichment Scores (NES) in thymoma (THYM), UVM, and acute myeloid leukemia (LAML). In these cancers, the high GZMs score was associated with worse survival. As for universally negatively related pathways (Fig. 4B), the higher GZMs score was associated with the inhibition of the AMPK signaling pathway, mTOR signaling pathway, Wnt signaling pathway, and Hippo signaling pathway. The UVM showed apparent differences compared to other cancer types (for example, BRCA), so we further identified differential pathways between UVM and BRCA (Fig. 4C and D). Differential pathways mainly focused on the vesicle-related pathways and co-translational proteins targeting to membrane, which might be related to prognosis.
We validated the prediction ability of GZMs score for immunotherapy response in eight immunotherapy datasets. High GZMs scores group was associated with better OS in urothelial carcinoma (Invigor210, HR
Characters of GZMs expression in the single-cell resolution
In this part, we analyzed characters of GZMs gene expressions in a scRNA-seq dataset (GSE131907), which included deep scRNA-seq from 15 samples of lung adenocarcinoma (LUAD). 11 early-stage and 4 advanced-stage tumor samples were included in our analyzes. After quality control, we applied principal component analysis on variably expressed genes across all cells to explore the cellular composition. In the first step, we divided these cells into 31 clusters and annotated these clusters manually (Fig. S3A and C). The malignant cells were identified by the inferCNV method (Fig. S3B). In the second step, we clustered and annotated immune cells by the SCINA method (Fig. 6A). Then we clustered the CD8
Pseudo-time analysis of CD8
T cells
To investigate the developmental progression of CD8
Heterogeneity analysis of GZMs-based CD8
T cell subsets
According to the distribution of GZMs in CD8
The information of regulon RUNX3/ETS1 and part of their targets
The information of regulon RUNX3/ETS1 and part of their targets
The table presents the number of motifs, the best motif, and the spearman correlation coefficients between the transcription factor and target genes.
The analysis of regulons and the correlations between the RUNX3 and the CD8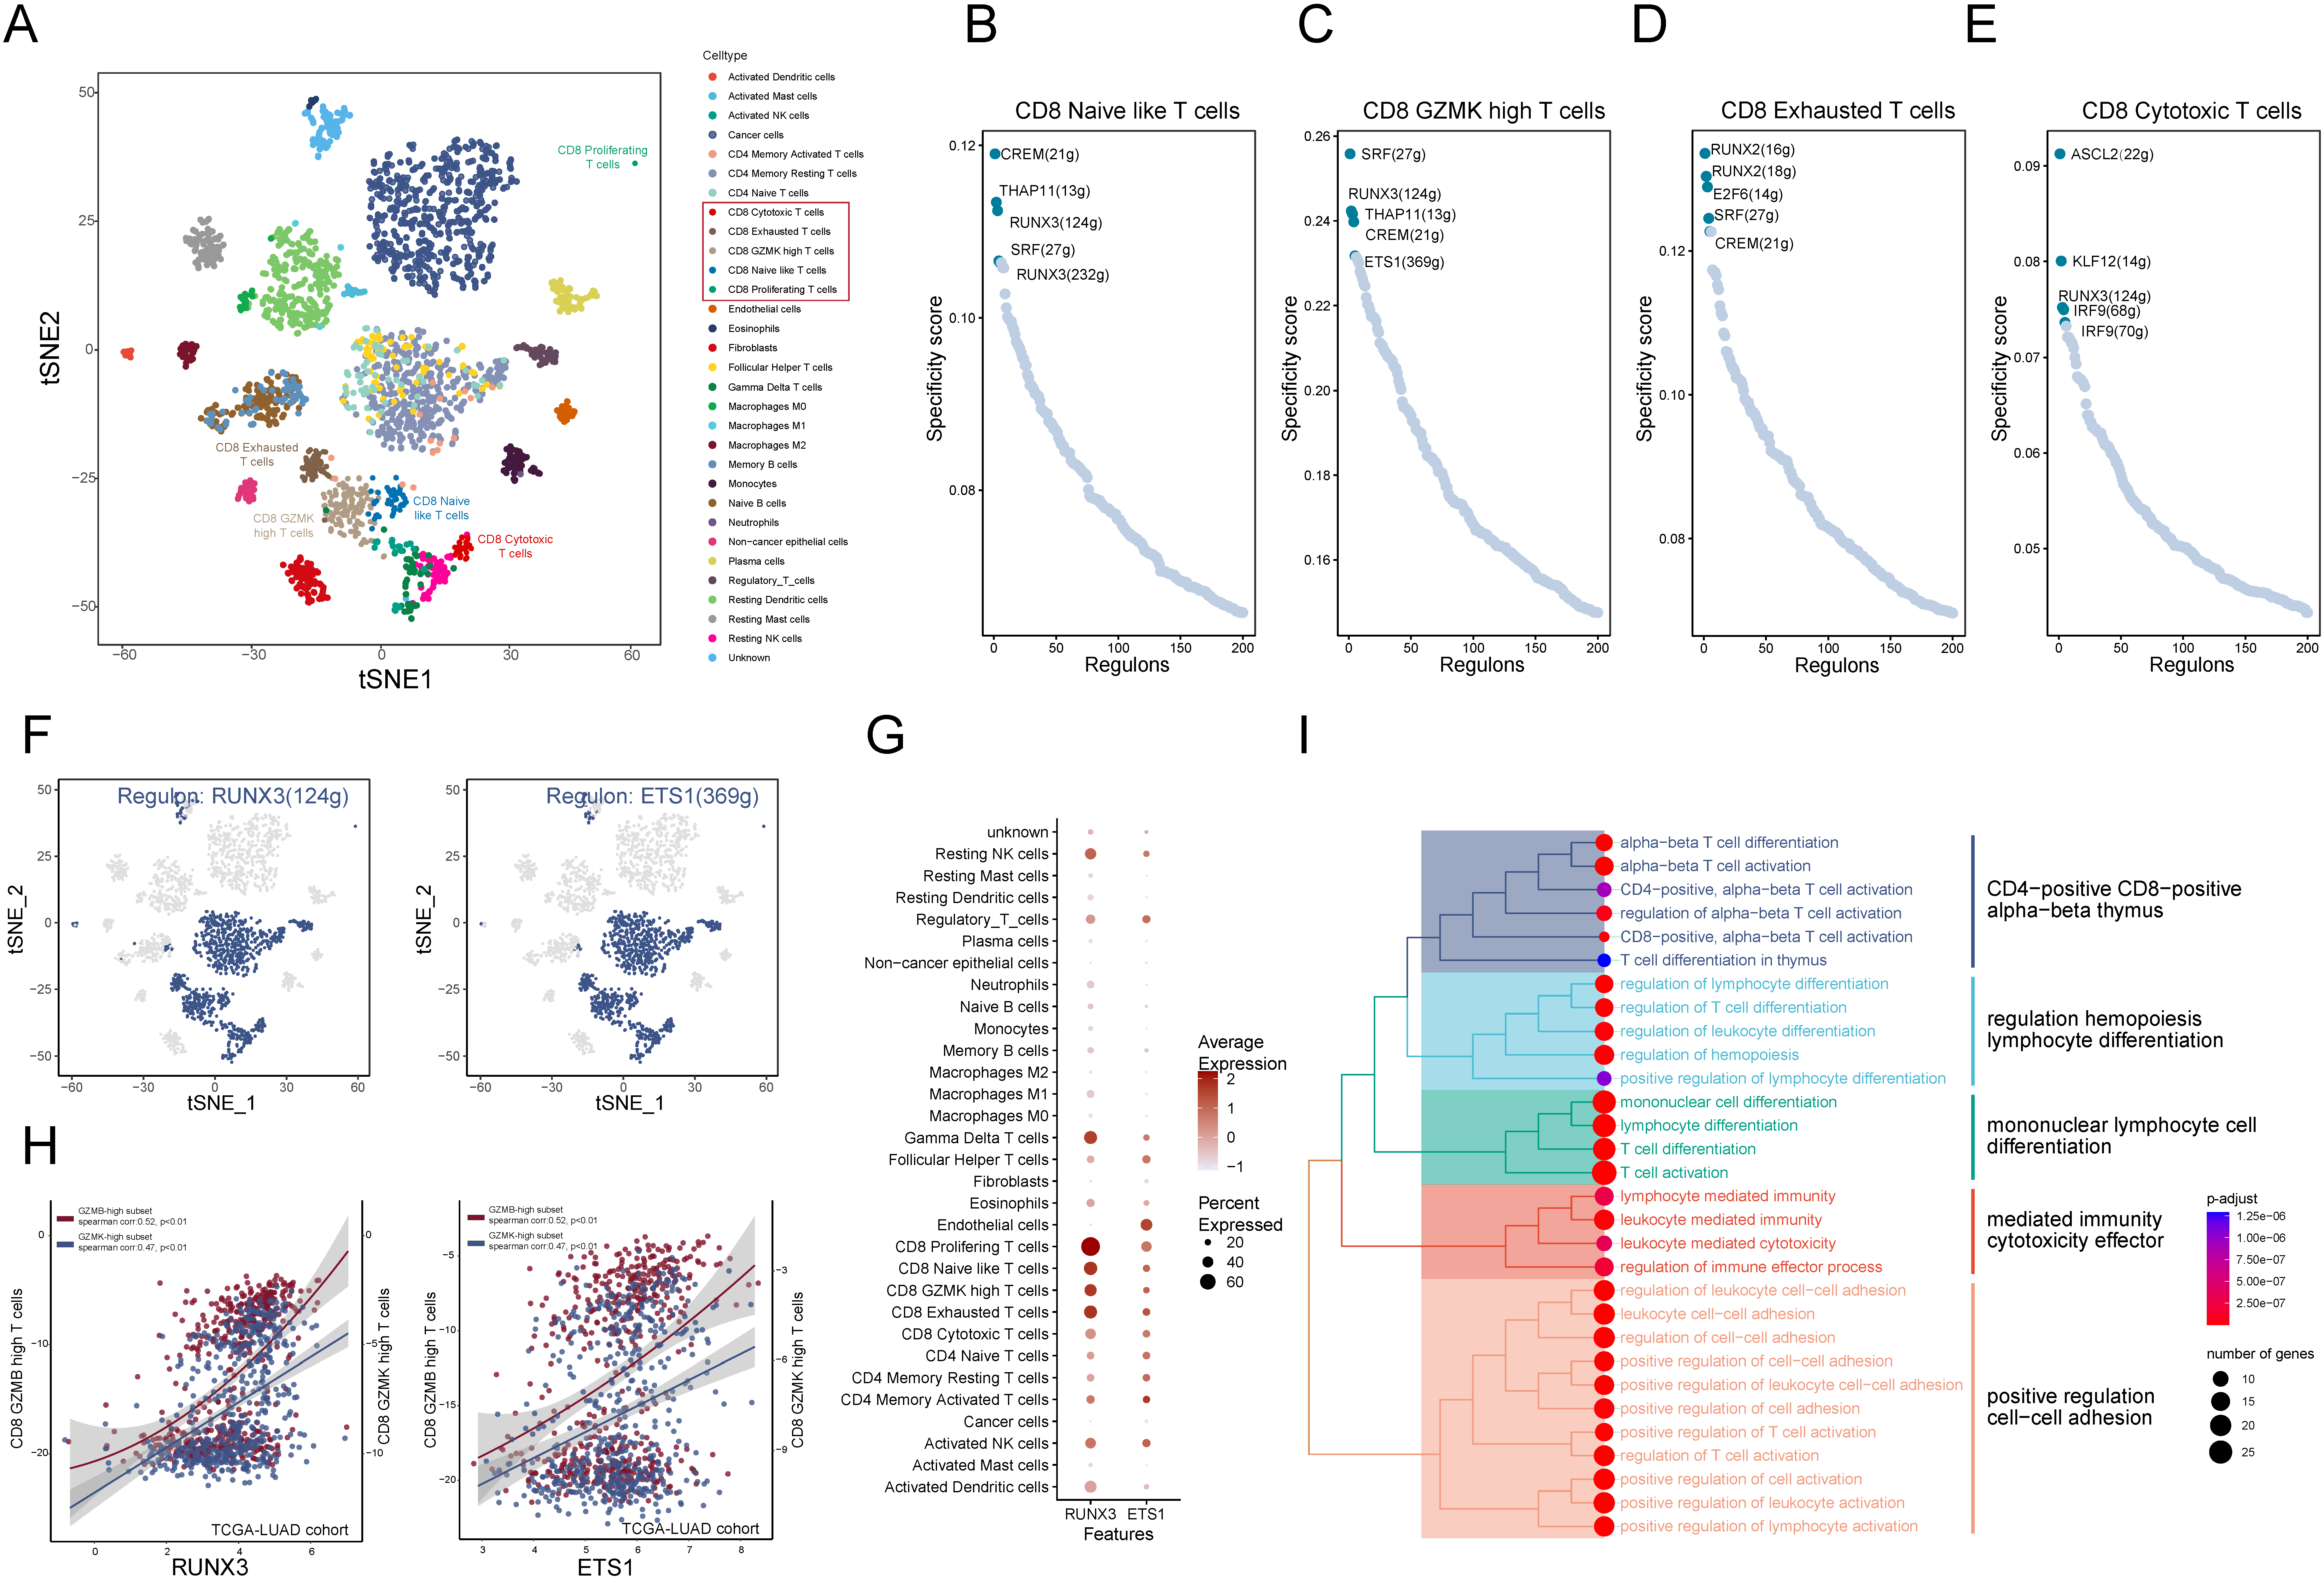
We further performed the scMetabolism method to identify the heterogeneity of CD8
We utilized the package CellChat to estimate the communications between GZMs-based CD8
Cell-type-specific regulon activity analysis
We conducted the gene regulatory network and identified the cell state in all cells by SCENIC. We systematically identified critical transcription factors for cell identity and defined a regulon specificity score (RSS) based on Jensen-Shannon divergence [42] (Fig. 8B–E). The results of t-SNE dimensional reduction based on the regulons were presented in Fig. 8A, displaying the distinctness of CD8
We then searched for the transcription factors that regulate the expression of GZMs, which might furtherly affect the fractions of GZMK-high and GZMB-high subsets. Thronging the SCENIC method, we identified the regulon RUNX3 consisted of GZMA/B/M/H while the regulon ETS1 included the GZMA/B/H/K and both of them included the key T
Discussion
Pan-cancer analysis can reveal the similarities and heterogeneities of different cancers, which may provide theoretical support for cancer therapeutic, target design, and potential therapeutic drug screening. In the present study, we performed a comprehensive bioinformatics analysis of the GZMs and their associations with immune infiltration, biological processes, immunotherapy response, and prognostic value, which vary significantly among different cancers.
Both genetic mutation and epigenetic modification can induce abnormal gene expression during tumorigenesis. We found that gene methylation levels can lead to abnormally low GZMs expression. However, the correlations of CNV with GZMs expression vary from different cancers. Furthermore, we calculated the GZMs score based on granzymes gene expressions in pan-cancer and indicated its potentially predictive performance in cancer immunotherapy, which was validated in eight immunotherapy datasets. We further analyzed why the GZMs score was associated with different prognoses, such as tumor microenvironment (TME), differential pathways, and drug sensitivity. We also illustrated the heterogeneity of GZMs-based CD8
More and more studies have established the core position of immunotherapy in altering the therapeutic landscape for many cancers. Still, the variability of immunotherapy response highlights the need for identifying predictive biomarkers [43]. A recent study demonstrated that TMB, in concert with PD-L1 expression was a valuable biomarker for ICB selection across some cancer types [44]. The role of granzyme B as a predictive biomarker of immunotherapy was demonstrated before [45, 46]. Therefore, we further explored the predictive values of GZMs for immunotherapy efficacy. The IPS and TIDE scores showed possible predictive value of GZMs score to immunotherapy efficacy in pan-cancer, but it should be validated on a large scale because of the heterogeneity of different cancer types. Our analysis of immunotherapy datasets demonstrated that the GZMs score could predict immunotherapy response in RCC, urothelial carcinoma, and melanoma. However, RCC patients in the high GZMs score group had a worse prognosis. This may be because the GZMs score was strongly positively associated with the infiltration of CD8
Furthermore, we explored possible explanations that caused the different prognoses in different cancers. Firstly, the GZMs score could partly represent the infiltrating level of effector CD8
BASSEZ A [53] had reported PD1-expressing T cells clonally expanded upon anti-PD1 treatment in patients with hormone receptor-positive or triple-negative breast cancer. The expansion was mainly involved in CD8
Subsequently, we discovered the GZMB-high subset characterized by the higher activity of the TCA cycle, oxidative phosphorylation pathways (OXPHOS), and pentose phosphate pathway (PPP). Previous research demonstrated that upregulated TCA cycle metabolism and OXPHOS are critical aspects of CD8
In the CellChat analysis, the three subsets also showed discrepancies in MIF- (CD74
Moreover, we established a network of regulons that could be postulated as likely candidates for identifying or regulating states of CD8
In conclusion, we conducted a comprehensive assessment of GZMs, unveiling complicated and comprehensive roles of granzyme family members in cancer progression and clinical outcome. We also revealed that the higher GZMs score may indicate better response and OS outcome for immunotherapy in melanoma and urothelial carcinoma but worse OS in RCC, indicating that the GZMs score is a potential prognostic biomarker of diverse cancers. RUNX3 and ETS1 may be the potential targets to regulate the infiltration of GZMs-based CD8
Footnotes
Author contributions
Conception: Qibin Song, Bin Xu.
Interpretation or analysis of data: Jing Li, Huibo Zhang, Jie Wu.
Preparation of the manuscript: Jing Li, Huibo Zhang, Jie Wu, Lan Li.
Revision for important intellectual content: Lan Li, Bin Xu.
Supervision: Bin Xu, Qibin Song.
Appendix
Supplementary data
Correlations of GZMs gene expression in the infiltration of immune cells, estimated IPS/TIDE values, and genomic alterations. (A) Heatmap of correlations between expression of GZMs and infiltration level of immune cells. The colors represent the correlation coefficients, with the darker the color, the greater the correlation. The right box presented scatter diagrams of correlations between GZMA/GZMM and immune cells in SKCM. The red and blue dots presented the patients with higher and lower GZMs expressions, respectively. (B) Bubble map of the correlation coefficient between GZMs expression and IPS values. (C) Bubble map of the correlation coefficient between GZMs expression and TIDE values.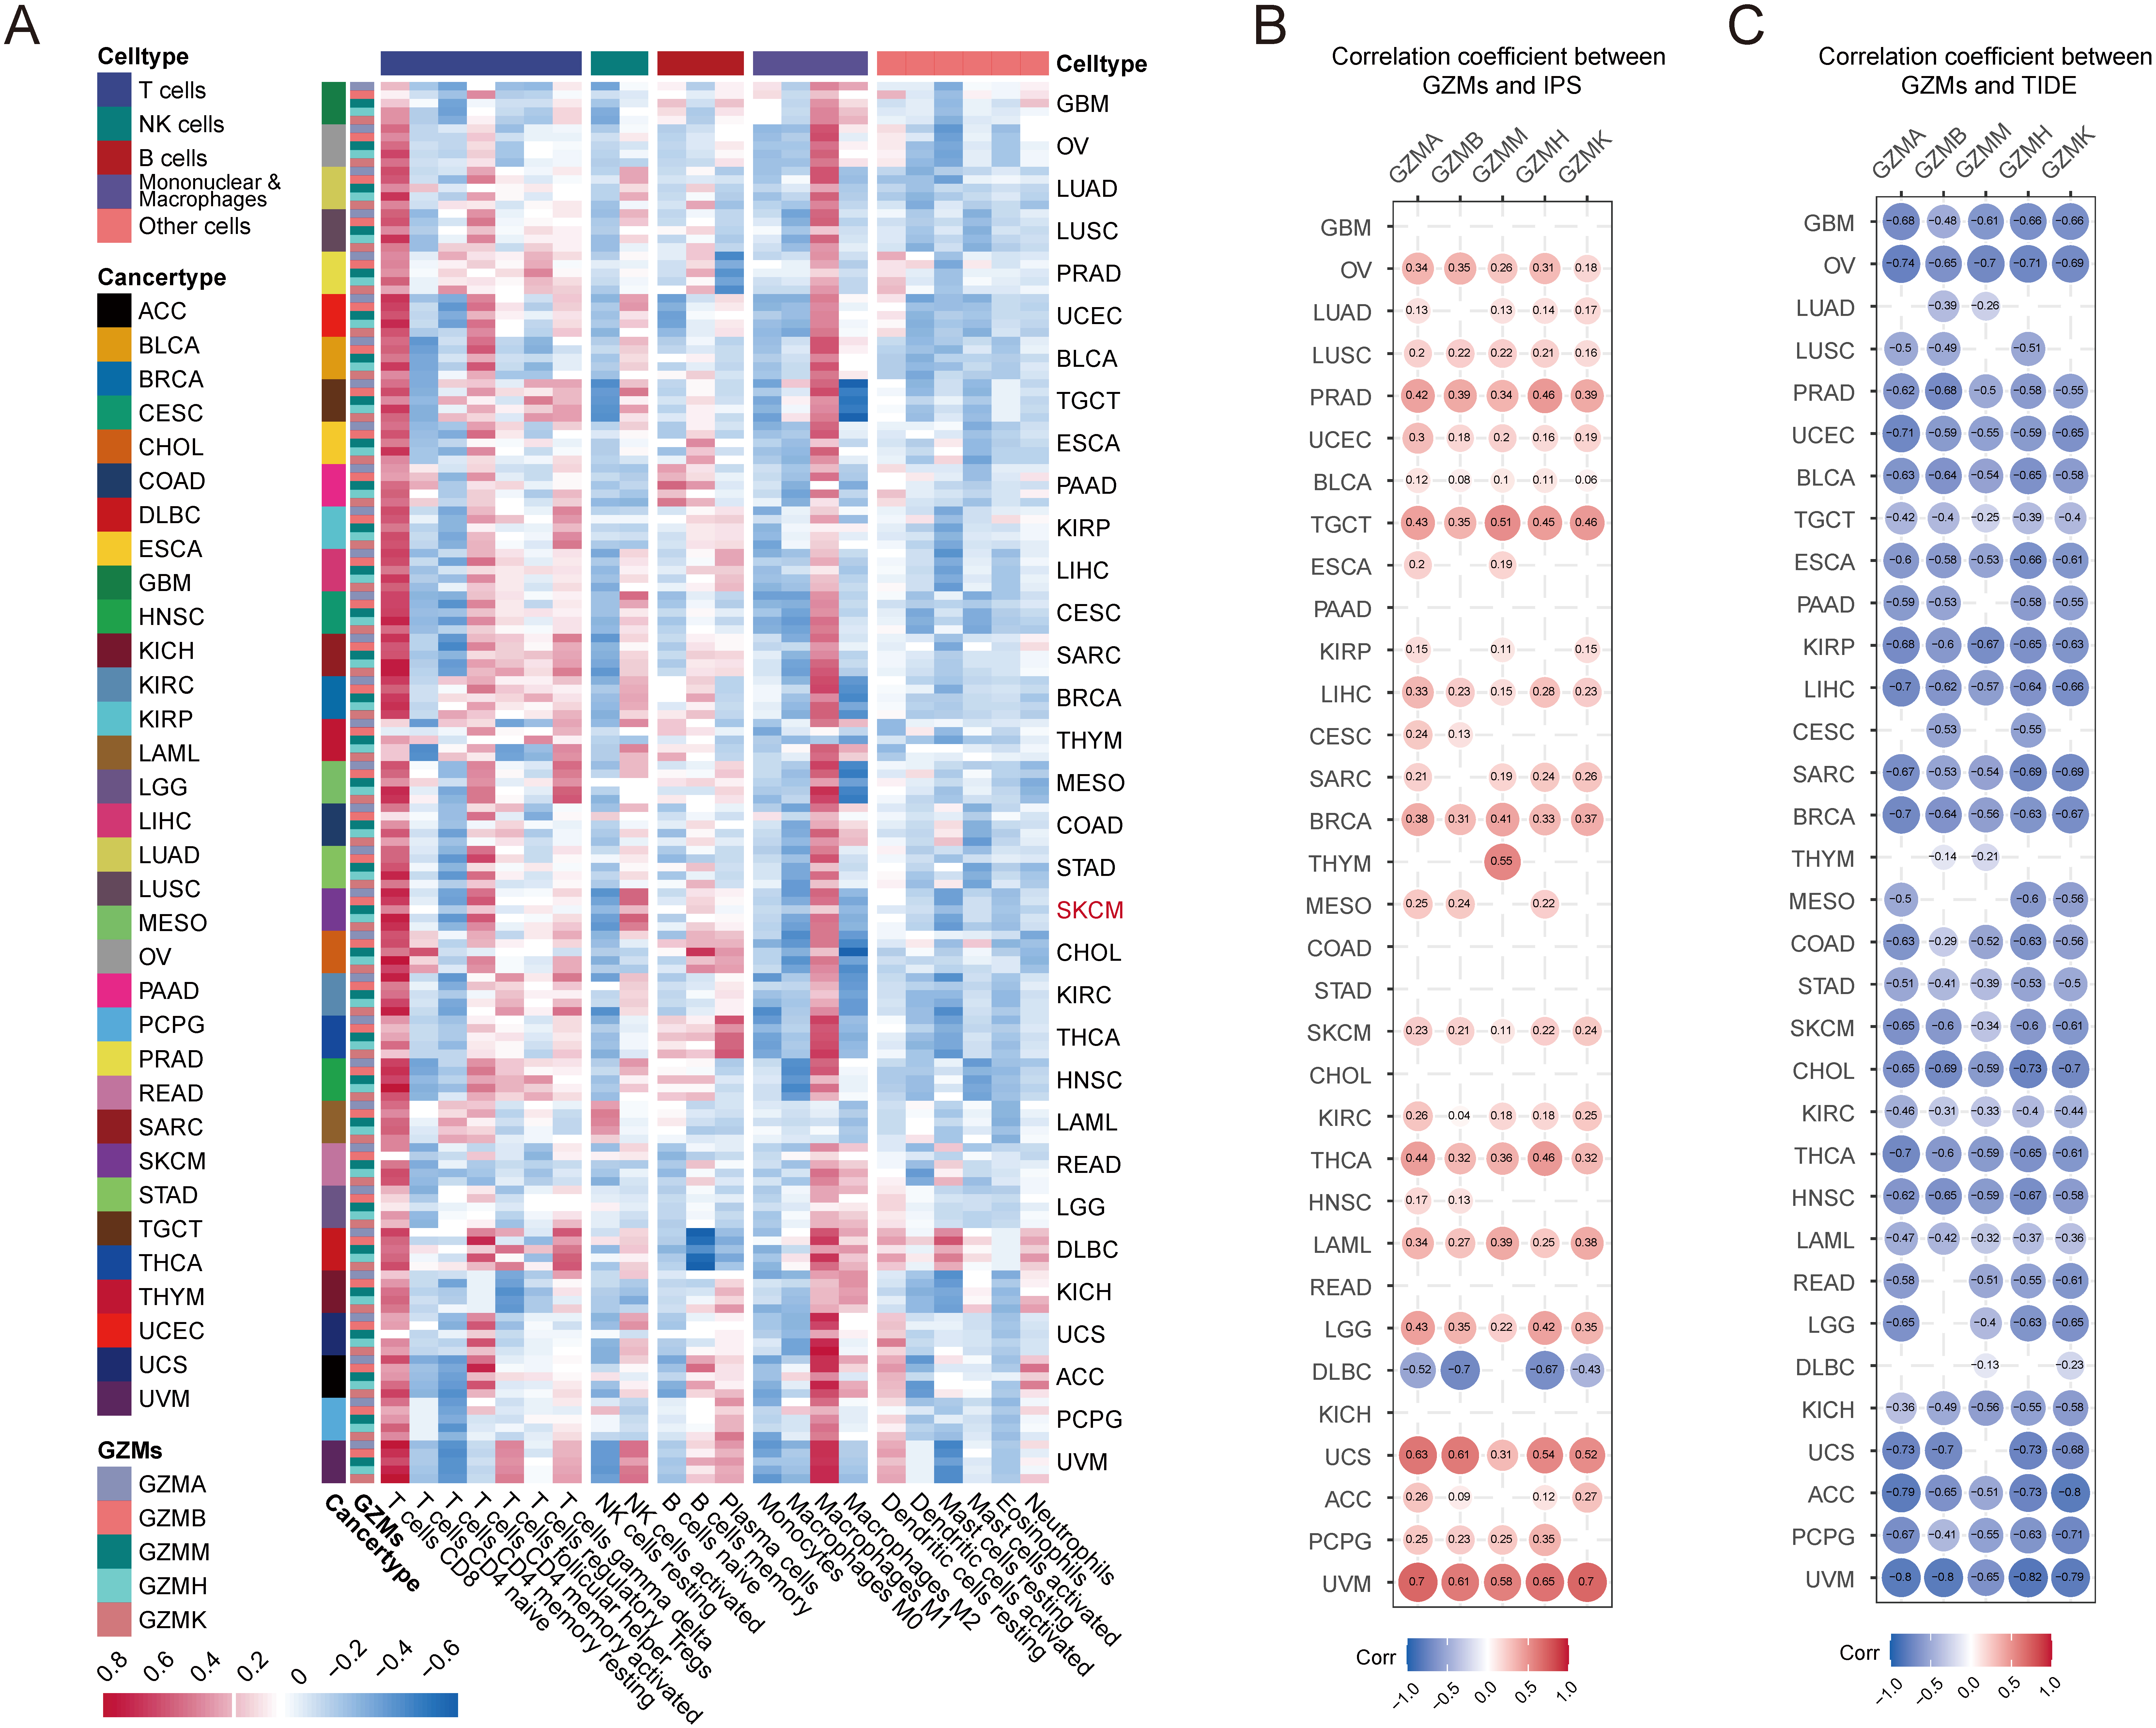
Response to anti-cancer drugs. (A) Raincloud plot of IPS values in high and low GZMs score group. (B) Violin plot of TIDE values in high and low GZMs score group. (C) Scatter diagram of correlation coefficient and –log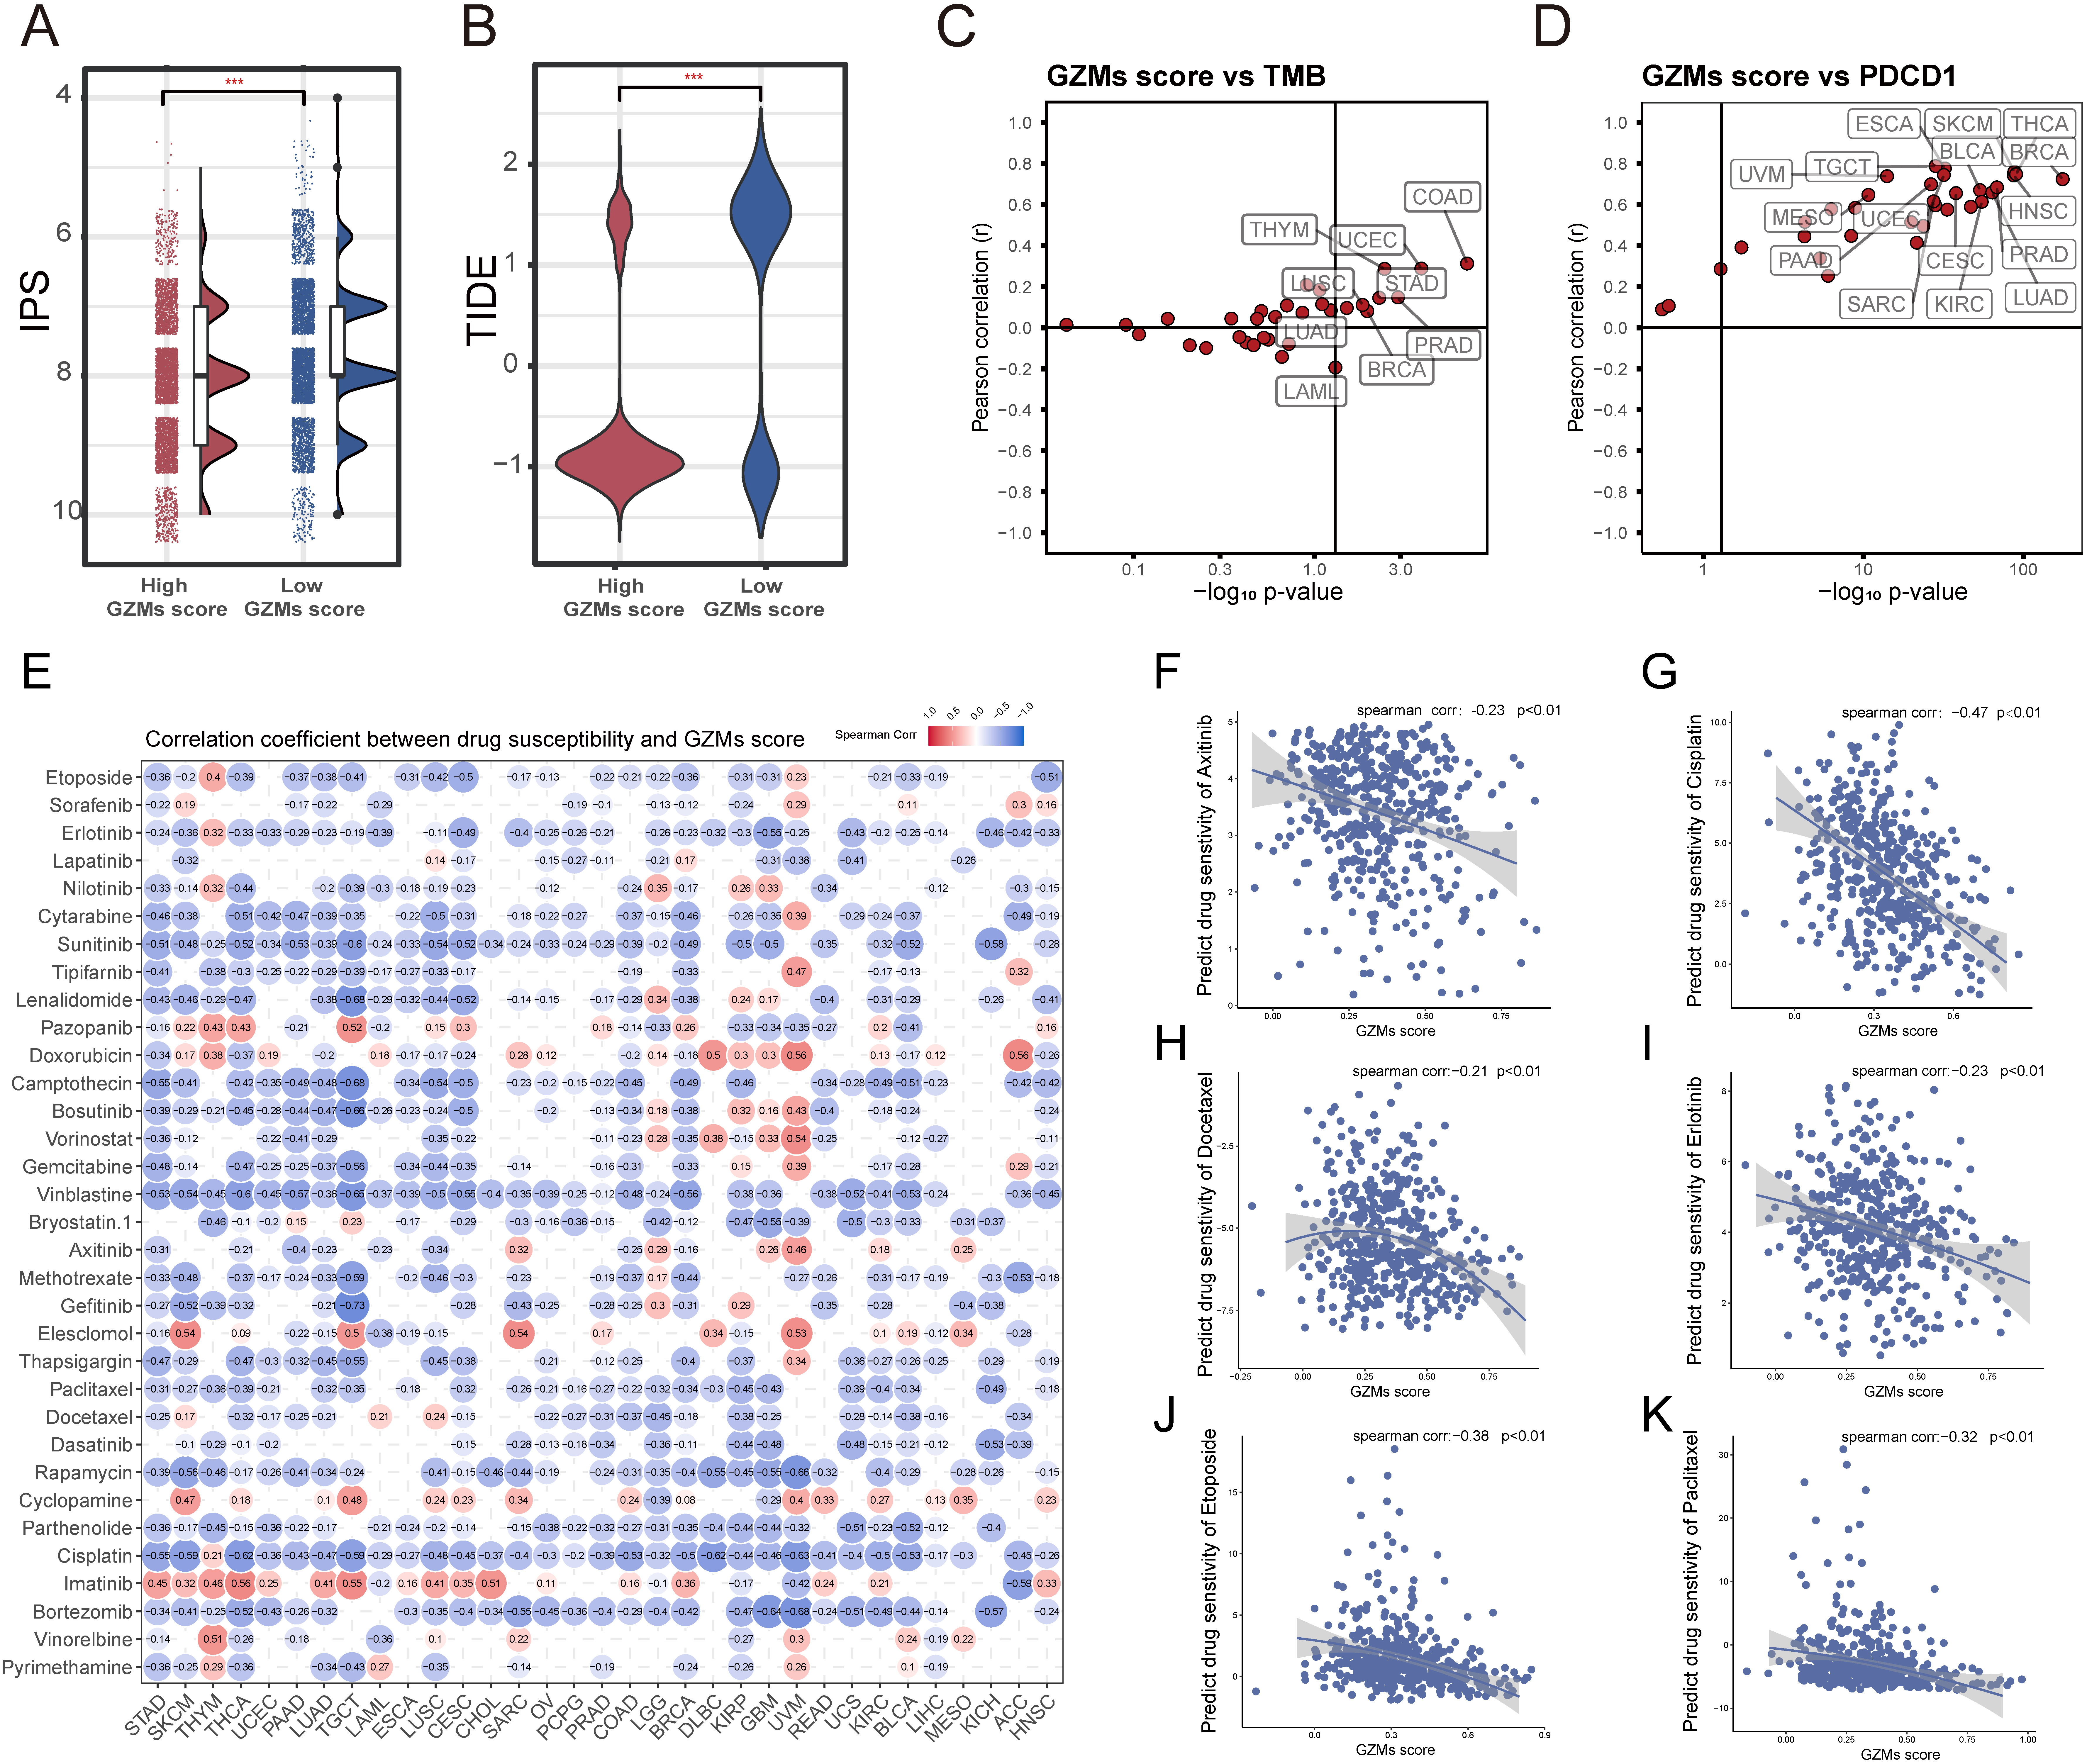
Cell typing analysis of scRNA-seq data and the supplementary results of the pseudo-time analysis. (A) The t-SNE representation of all cells and the cells were annotated by marker genes in Fig. S7C before inferCNV. (B) Inferred CNV based on epithelium cells identified in scRNA-seq data. Red meant amplification and blue indicated deletion. Parts of endothelial cells, fibroblasts, and immune cells were used as a reference of normal cells. (C) Bubble map of the differential expression of marker genes among different types of all cells (top) and CD8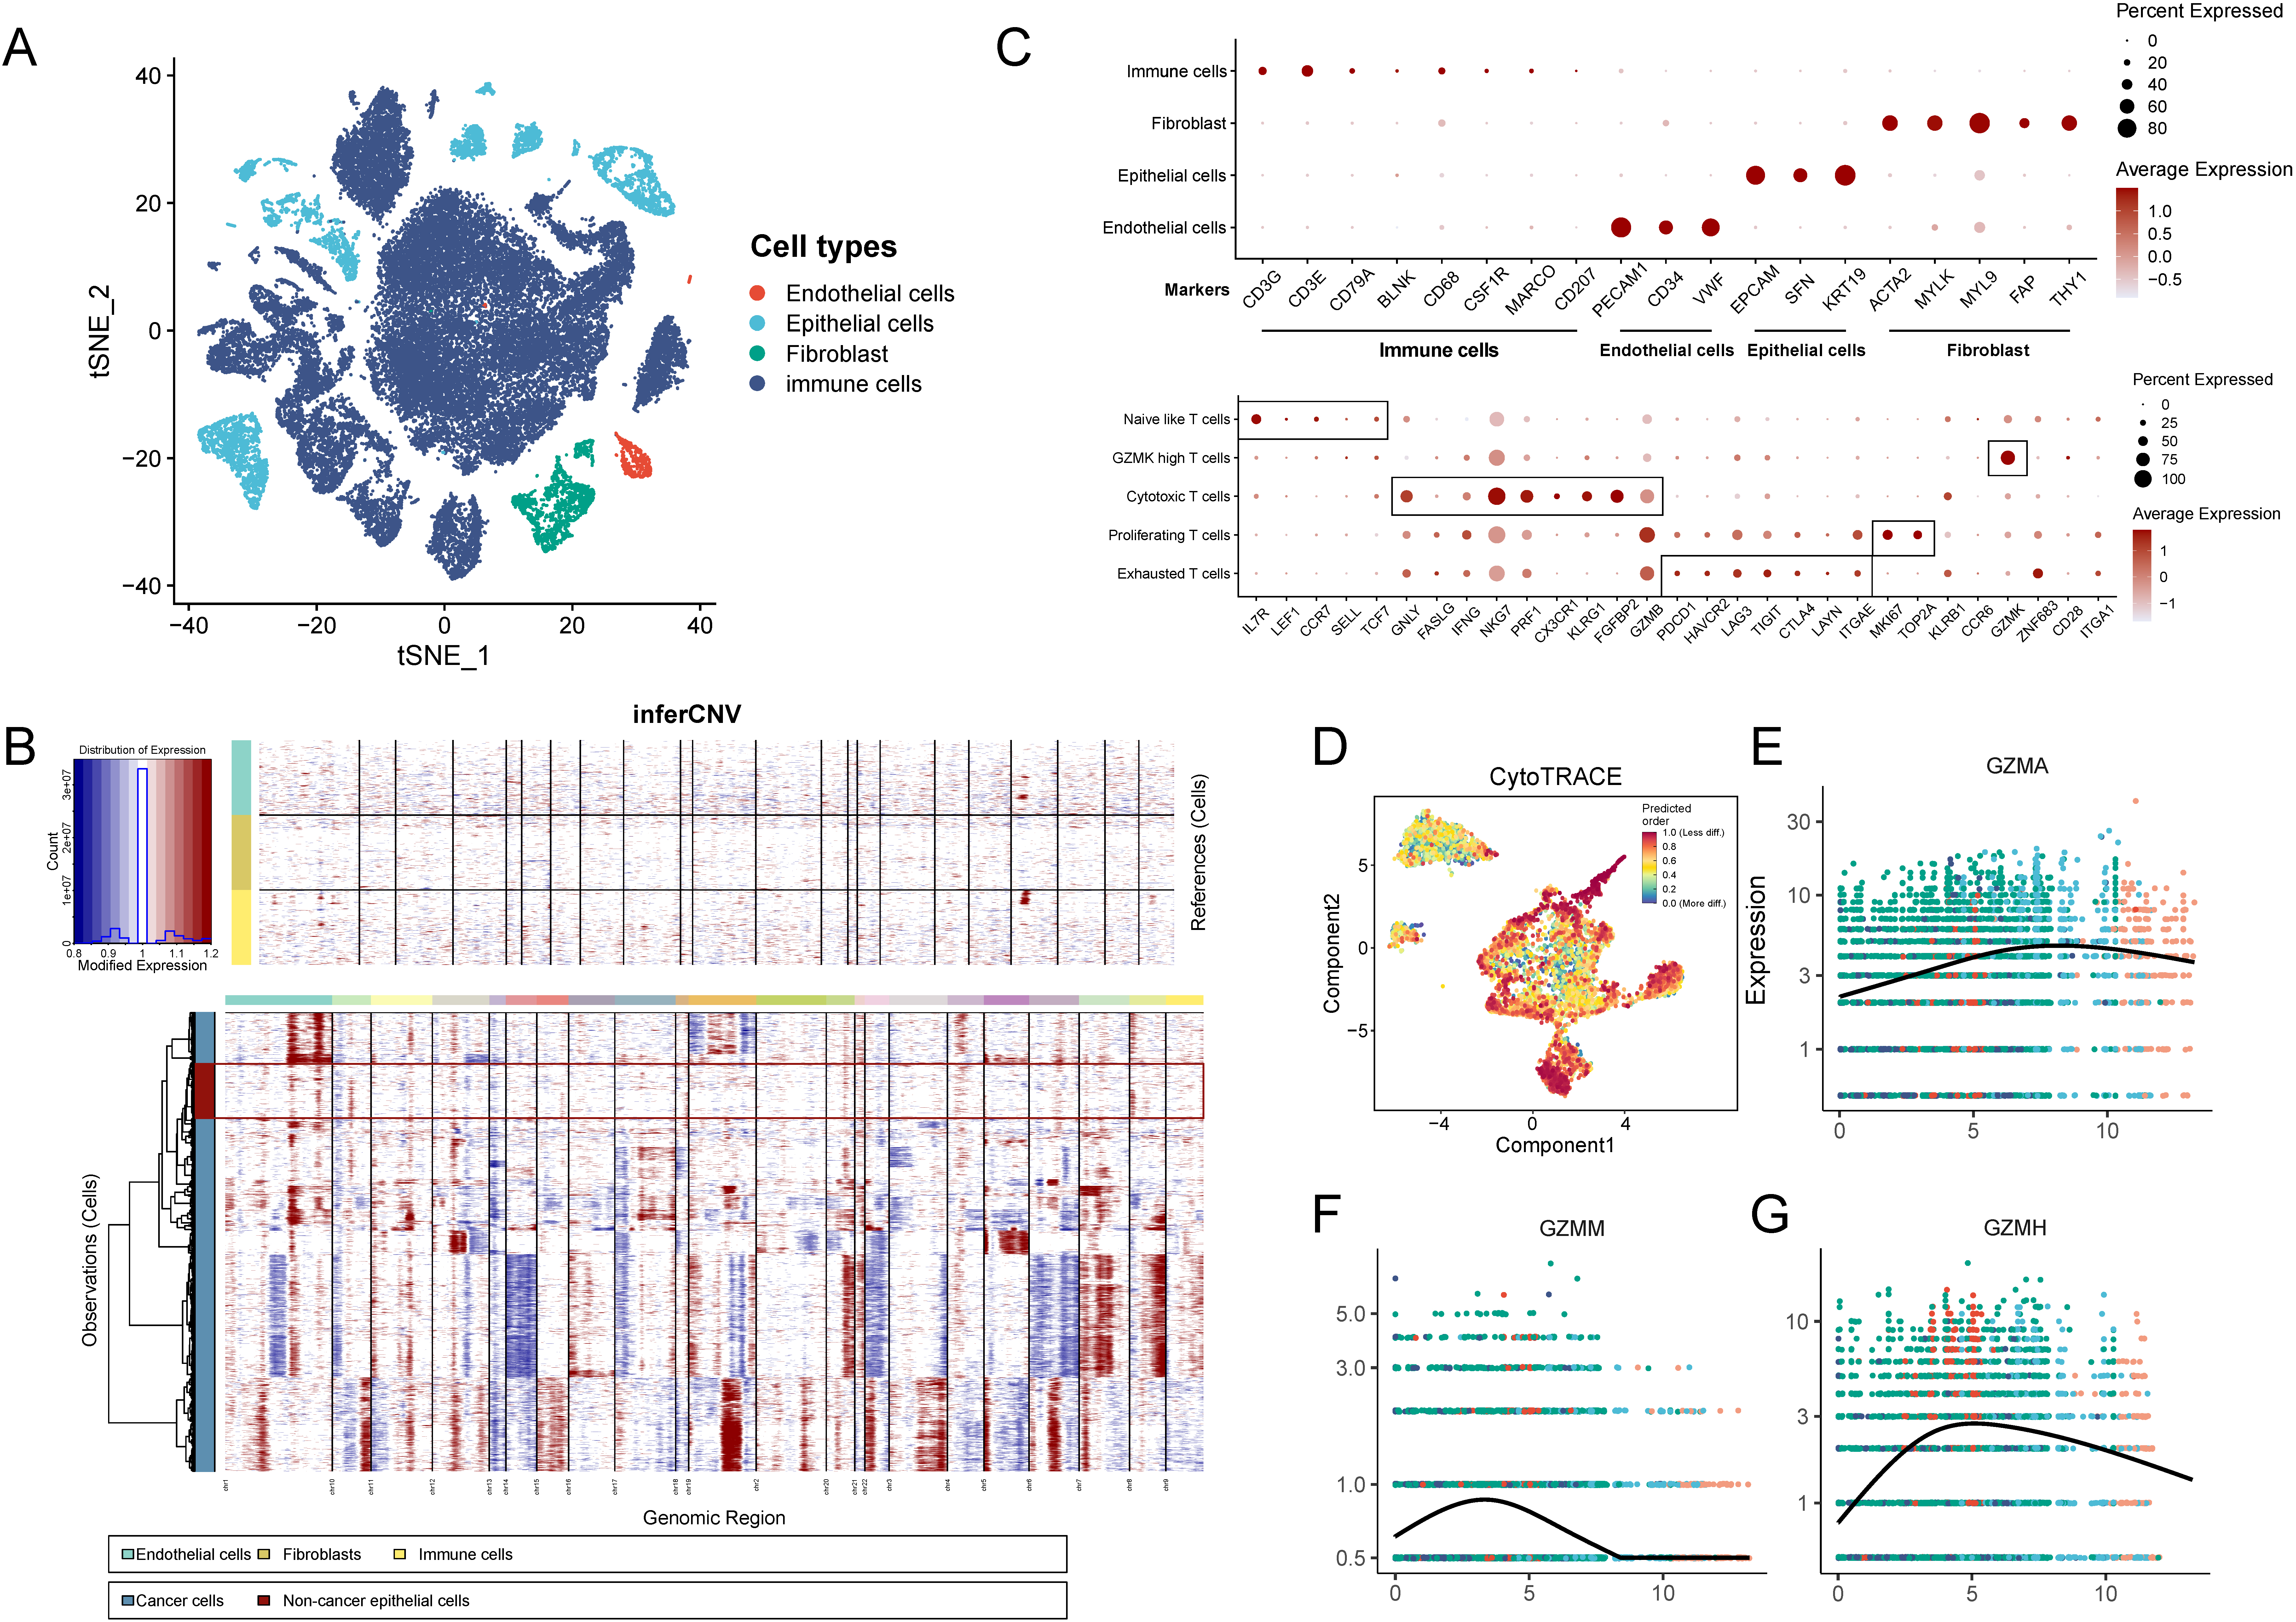
Discrepancies of CD8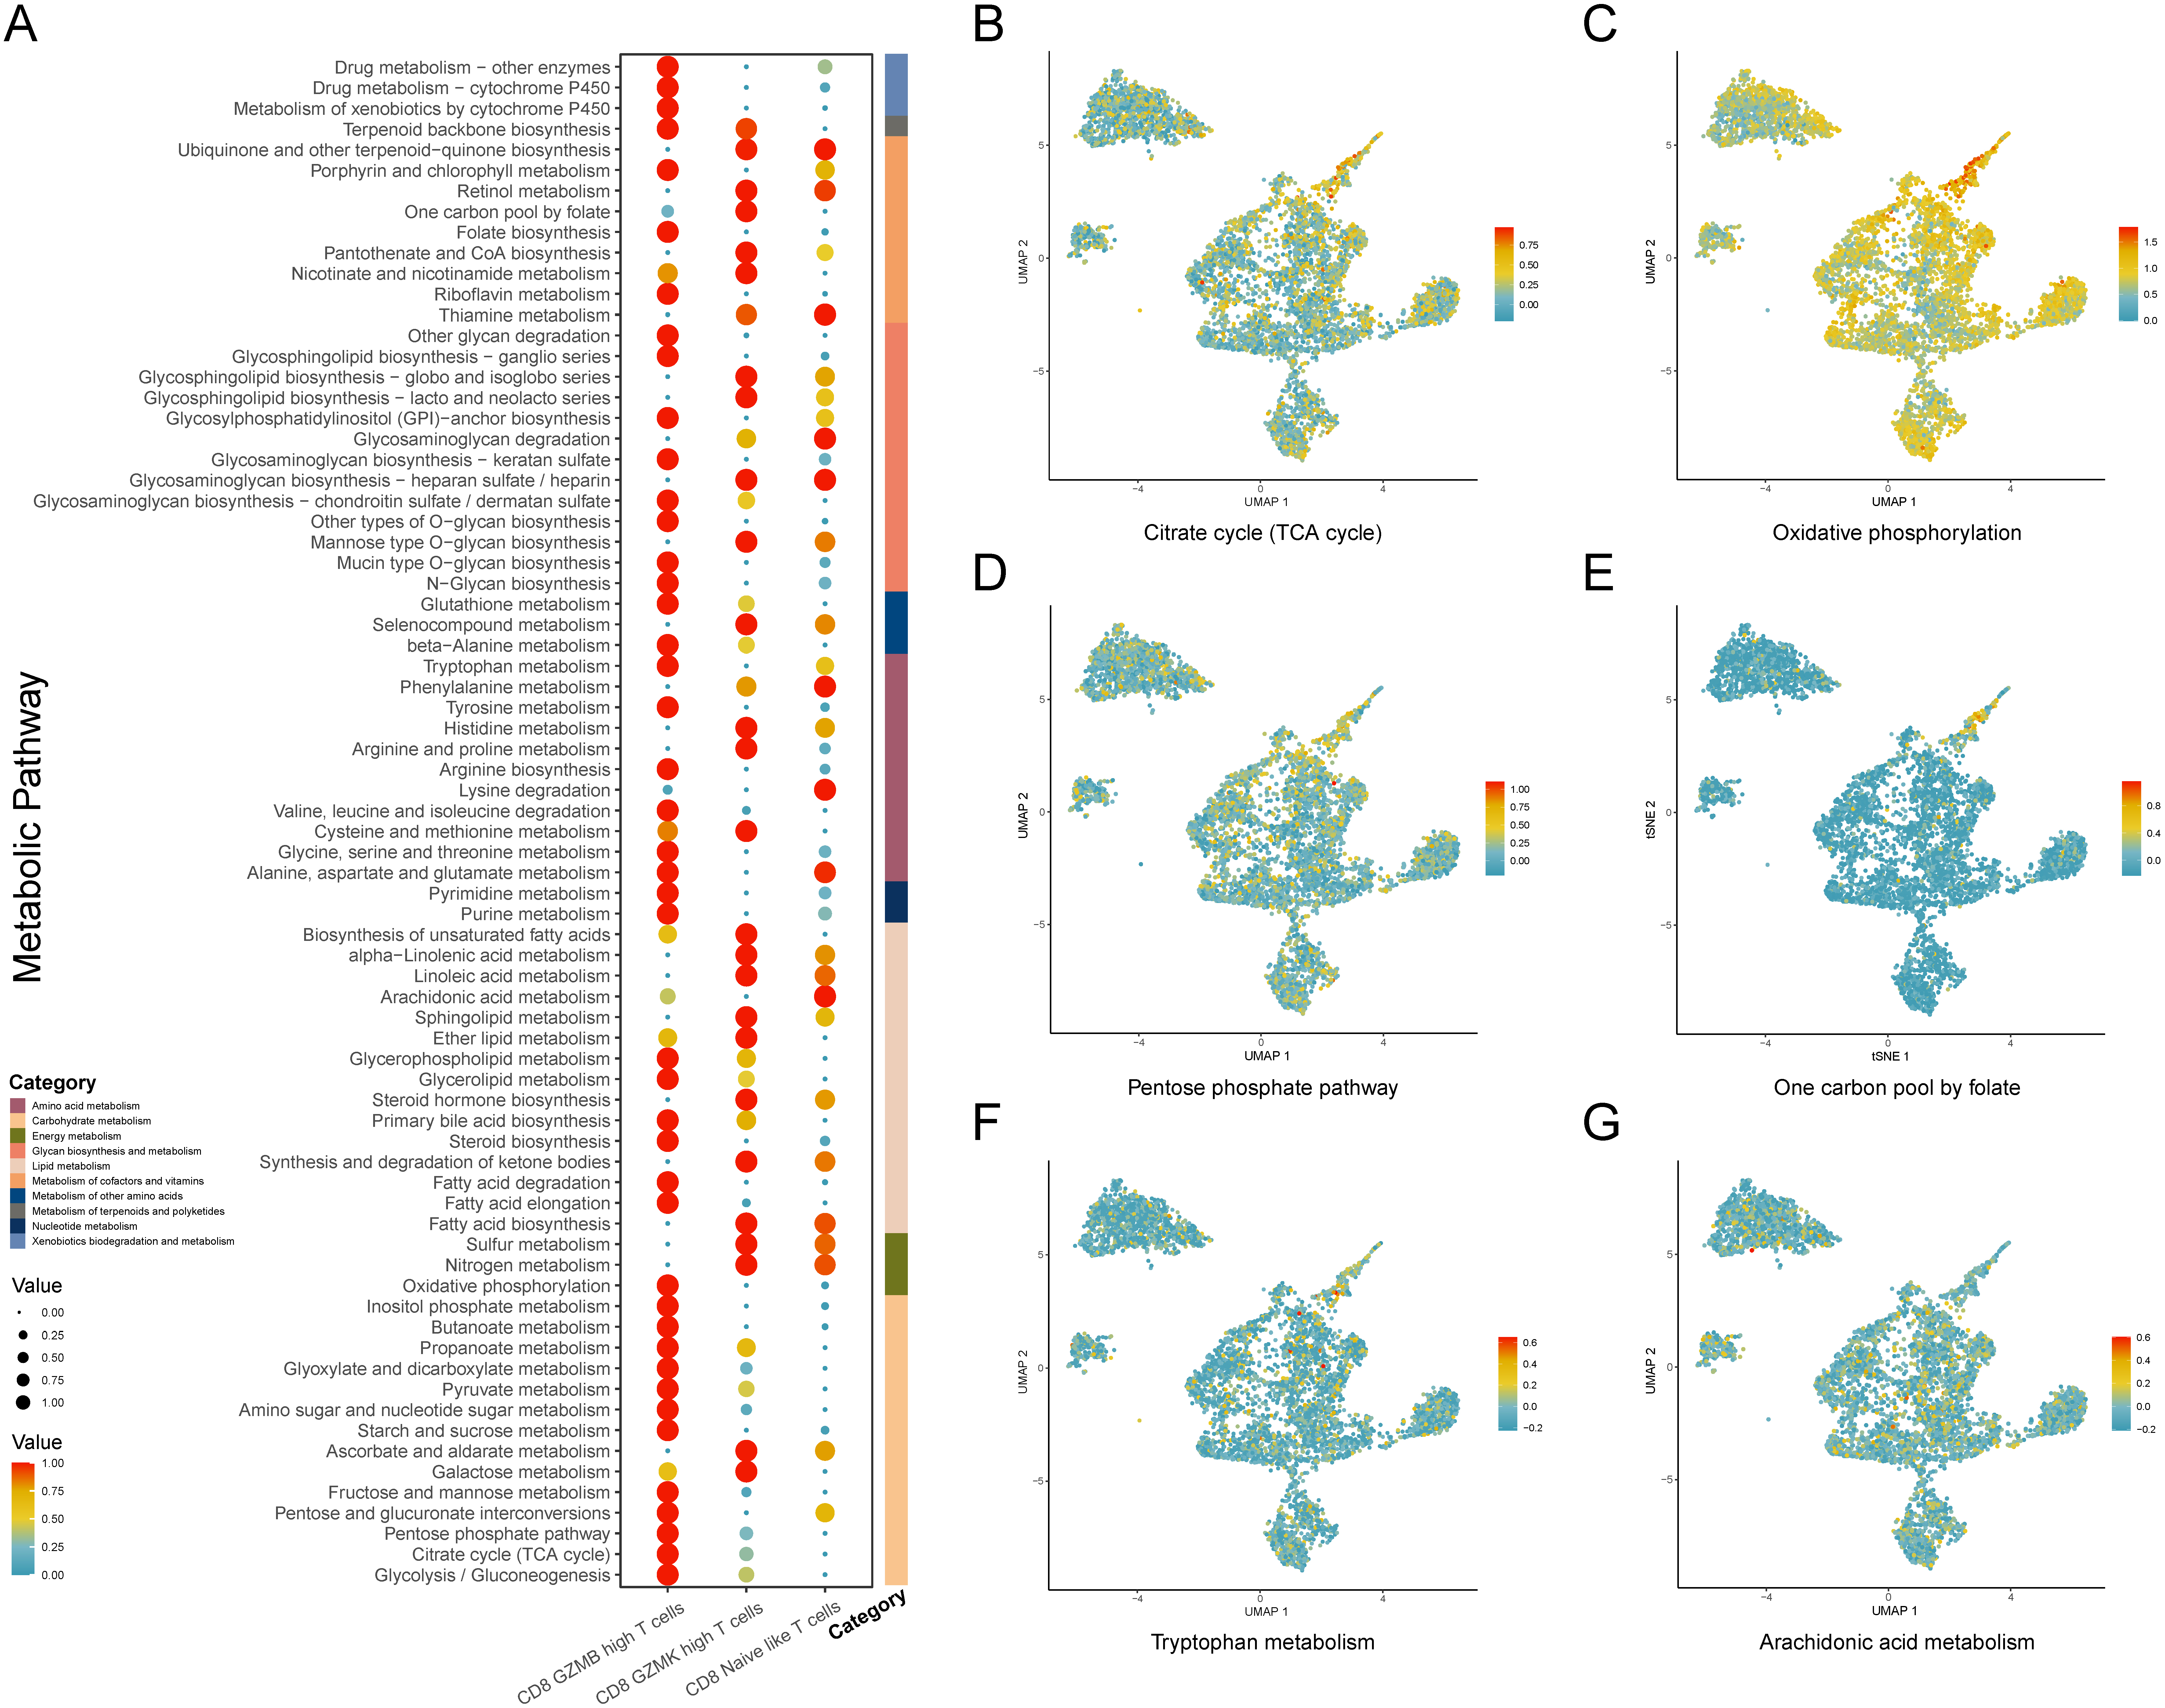
Supplementary results of the survival analysis and the enrichment analysis. (A) Kaplan-Meier curves estimated the OS between the high and the low fraction of the Naive-like subset group (divided by the cut-off value based on the lowest