
Abstract
Backgrounds:
Bladder cancer (BLCA) has a high degree of intratumor heterogeneity, which significantly affects patient prognosis. We performed single-cell analysis of BLCA tumors and organoids to elucidate the underlying mechanisms.
Methods:
Single-cell RNA sequencing (scRNA-seq) data of BLCA samples were analyzed using Seurat, harmony, and infercnv for quality control, batch correction, and identification of malignant epithelial cells. Gene set enrichment analysis (GSEA), cell trajectory analysis, cell cycle analysis, and single-cell regulatory network inference and clustering (SCENIC) analysis explored the functional heterogeneity between malignant epithelial cell subpopulations. Cellchat was used to infer intercellular communication patterns. Co-expression analysis identified co-expression modules of the anti-apoptotic subpopulation. A prognostic model was constructed using hub genes and Cox regression, and nomogram analysis was performed. The tumor immune dysfunction and exclusion (TIDE) algorithm was applied to predict immunotherapy response.
Results:
Organoids recapitulated the cellular and mutational landscape of the parent tumor. BLCA progression was characterized by mesenchymal features, epithelial-mesenchymal transition (EMT), immune microenvironment remodeling, and metabolic reprograming. An anti-apoptotic tumor subpopulation was identified, characterized by aberrant gene expression, transcriptional instability, and a high mutational burden. Key regulators of this subpopulation included CEBPB, EGR1, ELF3, and EZH2. This subpopulation interacted with immune and stromal cells through signaling pathways such as FGF, CXCL, and VEGF to promote tumor progression. Myofibroblast cancer-associated fibroblasts (mCAFs) and inflammatory cancer-associated fibroblasts (iCAFs) differentially contributed to metastasis. Protein-protein interaction (PPI) network analysis identified functional modules related to apoptosis, proliferation, and metabolism in the anti-apoptotic subpopulation. A 5-gene risk model was developed to predict patient prognosis, which was significantly associated with immune checkpoint gene expression, suggesting potential implications for immunotherapy.
Conclusions:
We identified a distinct anti-apoptotic tumor subpopulation as a key driver of tumor progression with prognostic significance, laying the foundation for the development of new therapeutic strategies to improve patient outcomes.
Keywords
Introduction
Bladder cancer (BLCA) is a common malignant tumor that arises from the abnormal proliferation of urothelial cells on the inner surface of the bladder. 1 As one of the top 10 most common cancers in the world, BLCA poses a heavy burden on public health.2,3 According to whether the tumor invades the bladder wall muscle layer, BLCA patients are divided into non-muscle invasive bladder cancer (NMIBC) and muscle invasive bladder cancer (MIBC). NMIBC accounts for 70% to 80% of cases and has a favorable prognosis but has a high recurrence rate. MIBC accounts for 20% to 30% of cases and is associated with invasive tumor behavior, metastatic potential, and poor overall survival (OS).4,5
BLCA is characterized by substantial intra-tumoral and inter-tumoral heterogeneity at the genomic, transcriptional, protein, and cellular levels. 6 This heterogeneity arises from subclonal evolution during tumor progression, metastasis, and treatment, leading to diverse molecular profiles and cellular phenotypes. 7 Single-cell analysis reveals a dynamic landscape where tumor cells exhibit both epithelial and mesenchymal-like transcriptional states, with bidirectional plasticity between these states occurring within and among tumor subclones. For example, a dominant transcriptional state characterized by low PPARG expression has been associated with an aggressive tumor phenotype. 8
Single-cell sequencing has emerged as a powerful tool to unravel the complexity of tumor heterogeneity by profiling individual cells. 9 In combination with organoid models, this technology enables comprehensive characterization of cellular communications and signaling networks. 10 Tumor cells exhibit substantial heterogeneity, with distinct subpopulations characterized by diverse mutational profiles, gene expression patterns, and functional capabilities.11 -13 These intra-tumoral disparities contribute to differential treatment responses and clinical outcomes. 14 For instance, invasive tumor subpopulations often display elevated expression of cancer stem cell markers, such as SOX9 and SOX2, associated with increased aggressiveness and treatment resistance. 15 The tumor microenvironment (TME) is a complex and dynamic ecosystem that profoundly influences tumor behavior. 16 Comprised of a heterogeneous mixture of immune cells, stromal cells, and extracellular matrix (ECM) components, the TME fosters a complex interplay with tumor cells, promoting growth, invasion, metastasis, and immune evasion. 17 Tumor cells actively shape the TME through the secretion of growth factors (such as vascular endothelial growth factor VEGF) and ECM modifying enzymes, while the TME reciprocally influences tumor cell phenotype and behavior. 18 These pro-cancer modifications include the expression of antiapoptotic molecules that prevent tumor cell death. The TME is often characterized by an immunosuppressive milieu, with immune checkpoint molecules, such as PD-L1, and immunosuppressive factors, including transforming growth factor-β (TGF-β) and interleukin (IL)-10, contributing to immune evasion.19,20 Additionally, the TME is frequently hypoxic due to aberrant angiogenesis, characterized by leaky and dysfunctional microvessels. These microenvironmental factors collectively contribute to tumor progression and therapeutic resistance. 21 Cancer-associated fibroblasts (CAFs) are pivotal components of TME, exhibiting heterogeneity in their origin, phenotype, and function. 22 A specific CAF subpopulation, characterized by PDGFRα + ITGA11 + expression, has been implicated in promoting lymphangiogenesis through the interaction of ITGA11 with the SELE receptor on lymphatic endothelial cells, subsequently activating the SRC-p-VEGFR3-MAPK pathway in BLCA. 23 CAFs can contribute to tumor progression by secreting growth factors, cytokines, and ECM components, remodeling the ECM, and supporting tumor angiogenesis and immune suppression. 24 A comprehensive understanding of the intricate communications between tumor cells, immune cells, and the TME is essential for the development of effective immunotherapies.
We conducted a comprehensive single-cell RNA sequencing (scRNA-seq) analysis of BLCA tumor tissues and organoids to unravel the underlying mechanisms driving tumor progression. By profiling cellular heterogeneity, we identified novel subpopulations and their interactions within the TME. Furthermore, we discovered a prognostic signature associated with patient survival and immune response. These findings offer insights into the molecular complexity of BLCA and provide a rational basis for developing targeted therapies.
Methods
Sample collection
This study was approved by the Ethics Committee for Clinical Research of Zhongda Hospital Affiliated to Southeast University and conducted in accordance with recognized ethical guidelines. A BLCA tissue was collected from 1 patient who underwent radical cystectomy at Zhongda Hospital Affiliated to Southeast University. The diagnosis of BLCA was independently confirmed by 3 pathologists. Written informed consent was obtained from the patient prior to tissue collection for subsequent scRNA-seq.
Tissue dissociation and preparation
The fresh tumor tissue was stored in the GEXSCOPE® Tissue Preservation Solution (Singleron) and transported to the Singleron lab on ice as soon as possible. The specimens were washed with Hanks Balanced Salt Solution (HBSS) for 3 times and minced into 1 to 2 mm pieces. Then the tissue pieces were digested with 2 ml GEXSCOPE® Tissue Dissociation Solution (Singleron) at 37°C for 15 minutes in 15 ml centrifuge tube with sustained agitation. After digestion, using 40-micron sterile strainers to filter the samples and centrifuging the samples at 1000 rpm for 5 minutes. Then the supernatant was discarded, and the sediment was resuspended in 1 ml PBS (HyClone). To remove the red blood cells, 2 ml GEXSCOPE® red blood cell lysis buffer (Singleron) was added at 25°C for 10 minutes. The solution was then centrifuged at 500g for 5 minutes and suspended in PBS. The sample was stained with trypan blue (Sigma) and microscopically evaluated.
Single cell RNA sequencing
Single-cell suspensions were converted to barcoded scRNA-seq libraries by using the Chromium Single Cell Library, Gel Bead & Multiplex Kit (10× Genomics), and following the manufacturer’s instructions. Briefly, cells were partitioned into Gel Beads in Emulsion in the ChromiumTM Controller instrument where cell lysis and barcoded reverse transcription of RNA occurred. Libraries were prepared using 10× Genomics Library Kits and sequenced on Illumina Nova6000 with 150 bp paired end reads.
Data sources and preprocessing
The scRNA-seq datasets GSE217956 and GSE222315 were downloaded from the GEO database (https://www.ncbi.nlm.nih.gov/). GSE217956 contains samples from 2 MIBC patients and 1 NMIBC patient, including organoids and corresponding primary tumors. 25 Raw sequencing data in SRA format were downloaded using prefetch (version 3.0.2) and converted to FASTQ files using fastq-dump (version 3.0.2). Subsequently, the FASTQ files were quantitatively analyzed using CellRanger (version 7.1.0) developed by 10× Genomics to obtain the expression profile matrix of each cell. 26 BLCA clinical information, TPM, FPKM and count transcriptome profiling and single nucleotide variation (SNV) data were obtained via the TCGAbiolinks (version 2.28.4) package from the TCGA (https://portal.gdc.cancer.gov/). A total of 412 BLCA samples and 19 normal control tissues were included. Survival information was available for 404 BLCA samples. GSE13507 and GSE32894 were used to validate the risk model.
ScRNA-seq data analysis
Downstream analysis of scRNA-seq data was conducted using the R package Seurat (version 4.3.0.1). 27 Seurat offers a comprehensive suite of tools for quality control, normalization, dimensionality reduction, unsupervised cell clustering, and cell annotation. 28 The raw count matrix was first converted to a Seurat object. High-quality cells were selected based on the following criteria: (i) the number of detected RNA features (nFeature_RNA) was between 200 and 6000 and (ii) the percentage of mitochondrial genes per cell (percent.mt) was below 5%. The filtered data was normalized using the NormalizeData function. Highly variable genes within each dataset were identified using the FindVariableFeatures function.29,30 Using dimensionality reduction techniques such as principal component analysis (PCA) to identify the most informative components explaining cellular variability. This enables visualization and clustering of cells in a lower-dimensional space. The FindNeighbors and FindClusters functions were employed to identify discrete cell clusters based on their gene expression profiles. The FindAllMarkers function was used to pinpoint differentially expressed genes (DEGs) that characterize each cluster. 31 We characterized the identities of cell types of these clusters based on expression of known markers: EPCAM, KRT8, KRT18, KRT19, and CD24 (Epithelial cell), CLDN5, CDH5, PECAM1, CD34, and VWF (Endothelial cell), COL14A1, FGF7, DCN, MYLK, MYH11, ACTA2, and TAGLN (fibroblast), 32 CD79A and CD79B (B cell), 27 LYZ, CD68, CD163, CD14 and FCER1G (Monocyte/Macrophage), CD3D, CD3E, CD3G, CD2, and IL7R (T cell),33,34 GNLY, and KLRD1 (NK cell), CDH1, CDH3, CLDN4, EPCAM, ST14, and MAL2 (Epithelial markers), VIM, SNAI1, SNAI2, ZEB2, FN1, MMP2, MMP3, MMP9, AGER, TWIST1, ZEB1, FOXC1, FOXC2, TWIST2, and CDH2 (Mesenchymal markers). 35
Infer-copy number variation (CNV) analysis
InferCNV method was utilized to infer chromosomal copy number variations (CNVs) from scRNA-seq data, providing insights into the genomic landscape of epithelial cells. The genes were annotated with chromosomal positions using the AnnoProbe R package (version 0.1.7), which facilitated the mapping of genes to their respective genomic locations. Subsequently, the infercnv R package (version 1.14.2) was employed to analyze the expression profiles, comparing tumor cells to a reference panel of fibroblasts, endothelial cells, T/NK cells, monocytes/macrophages, and B cells. This approach effectively highlights the CNV heterogeneity and genomic instability in tumor cells. 36
Identification of malignant epithelial cells
To identify malignant epithelial cells, we extracted the CNV matrix from InferCNV analysis. We calculated the mean and standard deviation of CNV values for each gene in normal reference cells. Subsequently, we computed the overall mean and standard deviation by averaging the means and standard deviations across all genes. The normal range of CNV values was defined as 2 overall standard deviations above or below the overall mean. CNV values within this range were assigned a score of 0. For values outside this range, a scoring system was applied: 2 to 6 overall standard deviations above or below the overall mean were assigned a score of 1, 6 to 10 were assigned a score of 2, 10 to 14 were assigned a score of 3, and greater than 14 were assigned a score of 4. The resulting CNV score matrix was subjected to hierarchical clustering to identify cell clusters with similar CNV profiles. Clusters primarily composed of normal reference cells were classified as non-malignant, while clusters exhibiting extensive chromosomal aberrations (high CNV scores) were classified as malignant epithelial cells. 37
Pathway analysis
DEGs were identified in cell subpopulations using Seurat’s FindMarkers function with an adjusted P-value cutoff of .05. Gene Ontology (GO) and Kyoto Encyclopedia of Genes and Genomes (KEGG) pathway enrichment analysis were conducted on these DEGs using the clusterProfiler R package (version 4.8.3). Additionally, gene set enrichment analysis (GSEA) was performed using GSEABase R package (version 1.62.0), ranking all genes by average log2 fold change and employing the Molecular Signature Database (MSigDB; https://www.gsea-msigdb.org/gsea/msigdb/index.jsp). 38
Malignant epithelial cell pseudotime trajectory analysis
Monocle2 R package (version 2.30.1) was employed to investigate the dynamic cellular states and progression within the malignant epithelial cells. 39 Highly variable genes identified by Monocle were used to order cells in pseudotime. State2 was designated as the root state, and the DDRTree algorithm was applied for dimensionality reduction. Visualization of the minimum spanning tree facilitated the identification of cellular trajectories. DEGs along the pseudotime were determined using the differential GeneTest function, with a q-value cutoff of 0.05. The BEAM function was employed to analyze gene expression changes across different trajectory branches.
SCENIC analysis
To investigate the motifs enriched in subpopulations, the regulons analysis was conducted via pyscenic package (version 0.9.19) 40 and the hg19-refseq_r45-v9 databases for GENIE3, RcisTatget, and AUCell. Leveraging the normalized expression matrix generated by Seurat, we constructed gene regulatory networks and identified key motifs driving cellular heterogeneity.
Cell cycle analysis
We employed the CellCycleScoring function within the Seurat package. This method leverages predefined gene sets (s.genes and g2m.genes) to assign S and G2/M phase scores to individual cells. 41 Based on these scores, cells were categorized into 4 cell cycle phases: G1, S, G2, and M. This approach enabled the identification of cell cycle progression patterns within different cell subpopulations and provided a foundation for further exploration of cell cycle regulatory mechanisms.
Cell-cell communications analysis
CellChat R package (version 1.6.1) was used to investigate intercellular communication among identified cell subpopulations. 42 This tool enabled the inference of ligand-receptor interactions and the construction of cell-cell communication networks based on scRNA-seq data.
Protein–protein interaction (PPI) network analysis
The PPI network was constructed using the STRING database 43 with a minimum required interaction score of 0.4 in S2 DEGs. This network was subsequently visualized using Cytoscape software (version 3.9.1). To identify highly interconnected genes potentially driving subpopulation-specific functions, the Clustering Coefficient plugin within Cytoscape was employed. The top 100 genes from the network analysis were then used to define functional modules, while 5 hub genes most interconnected genes were prioritized for further investigation and potential prognostic model development.
Risk model construction and survival analysis
To develop a risk model for predicting survival outcomes in BLCA patients based on hub genes, we constructed a risk model through multivariate Cox regression analysis, assigning a risk score to each sample. Risk score = coefficient1 × gene1 expression + . . . + coefficientN × geneN expression. In the independent validation set, we used the coefficients obtained from the previously established multivariate Cox regression model to perform a weighted summation of the expression levels of each gene to calculate the individual risk score. Samples were further stratified into high-risk and low-risk groups based on the median risk score. 44 Kaplan-Meier curves and receiver operating characteristic curves (ROC) were utilized to compare survival rates and predictive accuracy between the 2 risk groups.
Nomogram and prognostic model construction
To construct a prognostic model for predicting OS in BLCA patients, multivariate Cox regression analysis was utilized to identify independent prognostic factors. Utilizing these identified factors, a nomogram model was developed using the rms package (version 6.7.0). This nomogram visually represents the impact of each factor on OS and enables the prediction of patient survival probabilities at 1, 3, and 5 years based on their clinical characteristics.
Results
Comparative analysis of single-cell expression landscape between BLCA tumors and organoids
To explore BLCA cellular diversity and assess organoid model fidelity, we analyzed the publicly available GSE217956 dataset (Supplemental File 2: Table S1). After quality control, we identified 10 029 cells for downstream analysis. Batch effect correction significantly mitigated technical variability, resulting in reduced sample dispersion within the UMAP embedding (Figure 1A). After dimensionality reduction and unsupervised cell clustering, using markers, we annotated the cells into different clusters (Figure S1A, S1B), including epithelial, stromal, and immune cell clusters (Figure 1B and C). Organoid models recapitulate the cellular diversity of primary tumors to a certain extent, especially the heterogeneity of epithelial cells, but the proportions of immune cells and stromal cells are different from those of primary tumors (Figure 1D). We evaluated the expression of epithelial and mesenchymal markers in the samples (Figure 1E). We observed a progressive decrease in the cumulative expression of epithelial gene sets and a concomitant increase in the cumulative expression of mesenchymal gene sets as tumor stage advanced. This was further supported by the increased proportion of fibroblasts and endothelial cells in higher-stage tumors. These findings suggest that EMT is a hallmark of tumor progression, as evidenced by the decreased epithelial gene expression and increased mesenchymal gene expression, as well as the enhanced infiltration of stromal cells in advanced tumors. 45

Single-cell expression atlas and cell typing in BLCA tumors and organoids: (A) uniform manifold approximation and projection (UMAP) dimensionality reduction of single cells. Left: UMAP plot before batch correction, highlighting batch effects. Right: UMAP plot after batch effect correction, demonstrating removal of batch effect, (B) UMAP plot of single cells colored by assigned cell type, (C) dot plot illustrating marker expression across different cell types, (D) comparison of cell type proportions between tumor and organoid samples, and (E) violin plots comparing expression of epithelial and mesenchymal markers in different samples. Top panel: epithelial marker expression. Bottom panel: mesenchymal marker expression.
Molecular characterization and functional profiling of malignant and non-malignant epithelial cells in BLCA
To analyze the molecular landscape of BLCA epithelial cells, we performed inferCNV analysis on all epithelial cells, using non-epithelial cells as a reference. Obviously, Organoid1 recapitulated specific CNVs observed in Tumor1, including amplifications and deletions on chromosomes 5 and 11 (Figure 2A). Hierarchical clustering identified 8 epithelial cell clusters based on their CNV profiles (Figure S2A, Supplemental File 2: Table S2). Clusters 5 and 7 exhibited low CNV scores and high proportions of non-epithelial cells, suggesting their normal epithelial cells (Figure 2B). Meanwhile, they did not show large-scale chromosome segment deletion or amplification. Conversely, other clusters displayed substantial CNV heterogeneity. Cluster 4 had a low overall CNV score but had significant amplifications and deletions on chromosomes 2 and 19 (Figure 2C). GSEA and functional enrichment analysis revealed distinct biological processes associated with malignant and non-malignant epithelial cells (Figures 2D and S2B). Malignant cells showed enrichment of metabolic pathways, particularly those related to fatty acid metabolism, as evidenced by the upregulation of genes such as EPCAM, ERBB3, FGF4, DHRS2, and QSOX1. Notably, ERBB3, frequently mutated in BLCA (Figure S2C), is a potential therapeutic target. 46 At the same time, fatty acid metabolism was found to mediate tumor metastasis and immunosuppression in breast cancer. 47 In contrast, non-malignant epithelial cells were enriched in inflammation-related pathways and express CXCL1, IL1A, S100A2, KRT5, and KRT17, which are in the tumorigenesis stage (Figures 2E and S2D). Our findings reveal substantial CNV heterogeneity among BLCA epithelial cells, identifying distinct markers differentiating malignant and non-malignant cells. The acquisition of a malignant phenotype is associated with metabolic rewiring, oncogenic pathway dysregulation, and immune microenvironment alterations.

InferCNV analysis and functional enrichment analysis of BLCA epithelial cells: (A) heatmap of epithelial CNVs inferred using the InferCNV algorithm, (B) CNV score distribution and cellular composition of epithelial clusters. Box plots illustrating the distribution of CNV scores within each cluster, while bar plots depicting the proportion of epithelial and non-epithelial cells, (C) the InferCNV result heatmap verifies that clusters 5 and 7 are classified as normal epithelium, while the remaining clusters are classified as malignant, (D) GSEA analysis of malignant and non-malignant epithelial cells, and (E) violin plots depicting the expression levels of markers in malignant and non-malignant epithelial cells.
Gene expression patterns and functional characteristics of malignant progression
To elucidate the molecular underpinnings of malignant progression, we constructed the pseudotime trajectory for tumor cells (Supplemental File 2: Table S3). The trajectory was validated by the expression dynamics of key genes, including CD44, MYC, and S100A9, 48 which exhibited distinct expression patterns along the differentiation continuum (Figure 3A). Notably, NMIBC cells predominantly clustered at the trajectory’s initiation, suggesting an early-stage tumor phenotype (Figure S3A). Comparative analysis of tumor and organoid cells revealed distinct pseudotime distributions, with organoids primarily located at the trajectory’s terminus with a higher degree of differentiation (Figure 3B). We identified distinct clusters of DEGs that exhibited dynamic changes along the pseudotime trajectory. Early differentiation stages were characterized by the upregulation of pro-inflammatory and proliferative pathways, including MAPK, TNF, and IL-17, and suppression of apoptosis due to p53 dysfunction (Figures 3C and S3B). These findings suggest that the early stages of malignant progression are characterized by enhanced inflammation, increased proliferation, and an impaired apoptotic response. 49 Subsequent trajectory bifurcation identified 2 distinct cell fates with divergent molecular programs (Figure 3D). One branch exhibited continued activation of oncogenic signaling pathways, resembling the early differentiation state. The other branch displayed an enrichment of metabolic and cytoskeletal remodeling pathways, suggesting a more aggressive phenotype 50 (Figure 3E). Key driver genes associated with these distinct cell fates were identified, including MCL1, ATF4, RELA, TNF, NFKBIA, and CASP9 in the first branch, and EPCAM, EGFR, UPK3B, ERBB3, KRAS, and IGF1R in the second branch (Figures 3F, S3D, and S3E). Notably, high expression of EGFR, MCL1, and JUN correlated with poor patient prognosis (Figure S3C). These findings collectively demonstrate the complex heterogeneity of tumor cells and their dynamic evolution along a differentiation trajectory. The identified molecular signatures and key driver genes provide insights into the mechanisms underlying tumor progression and potential therapeutic targets.
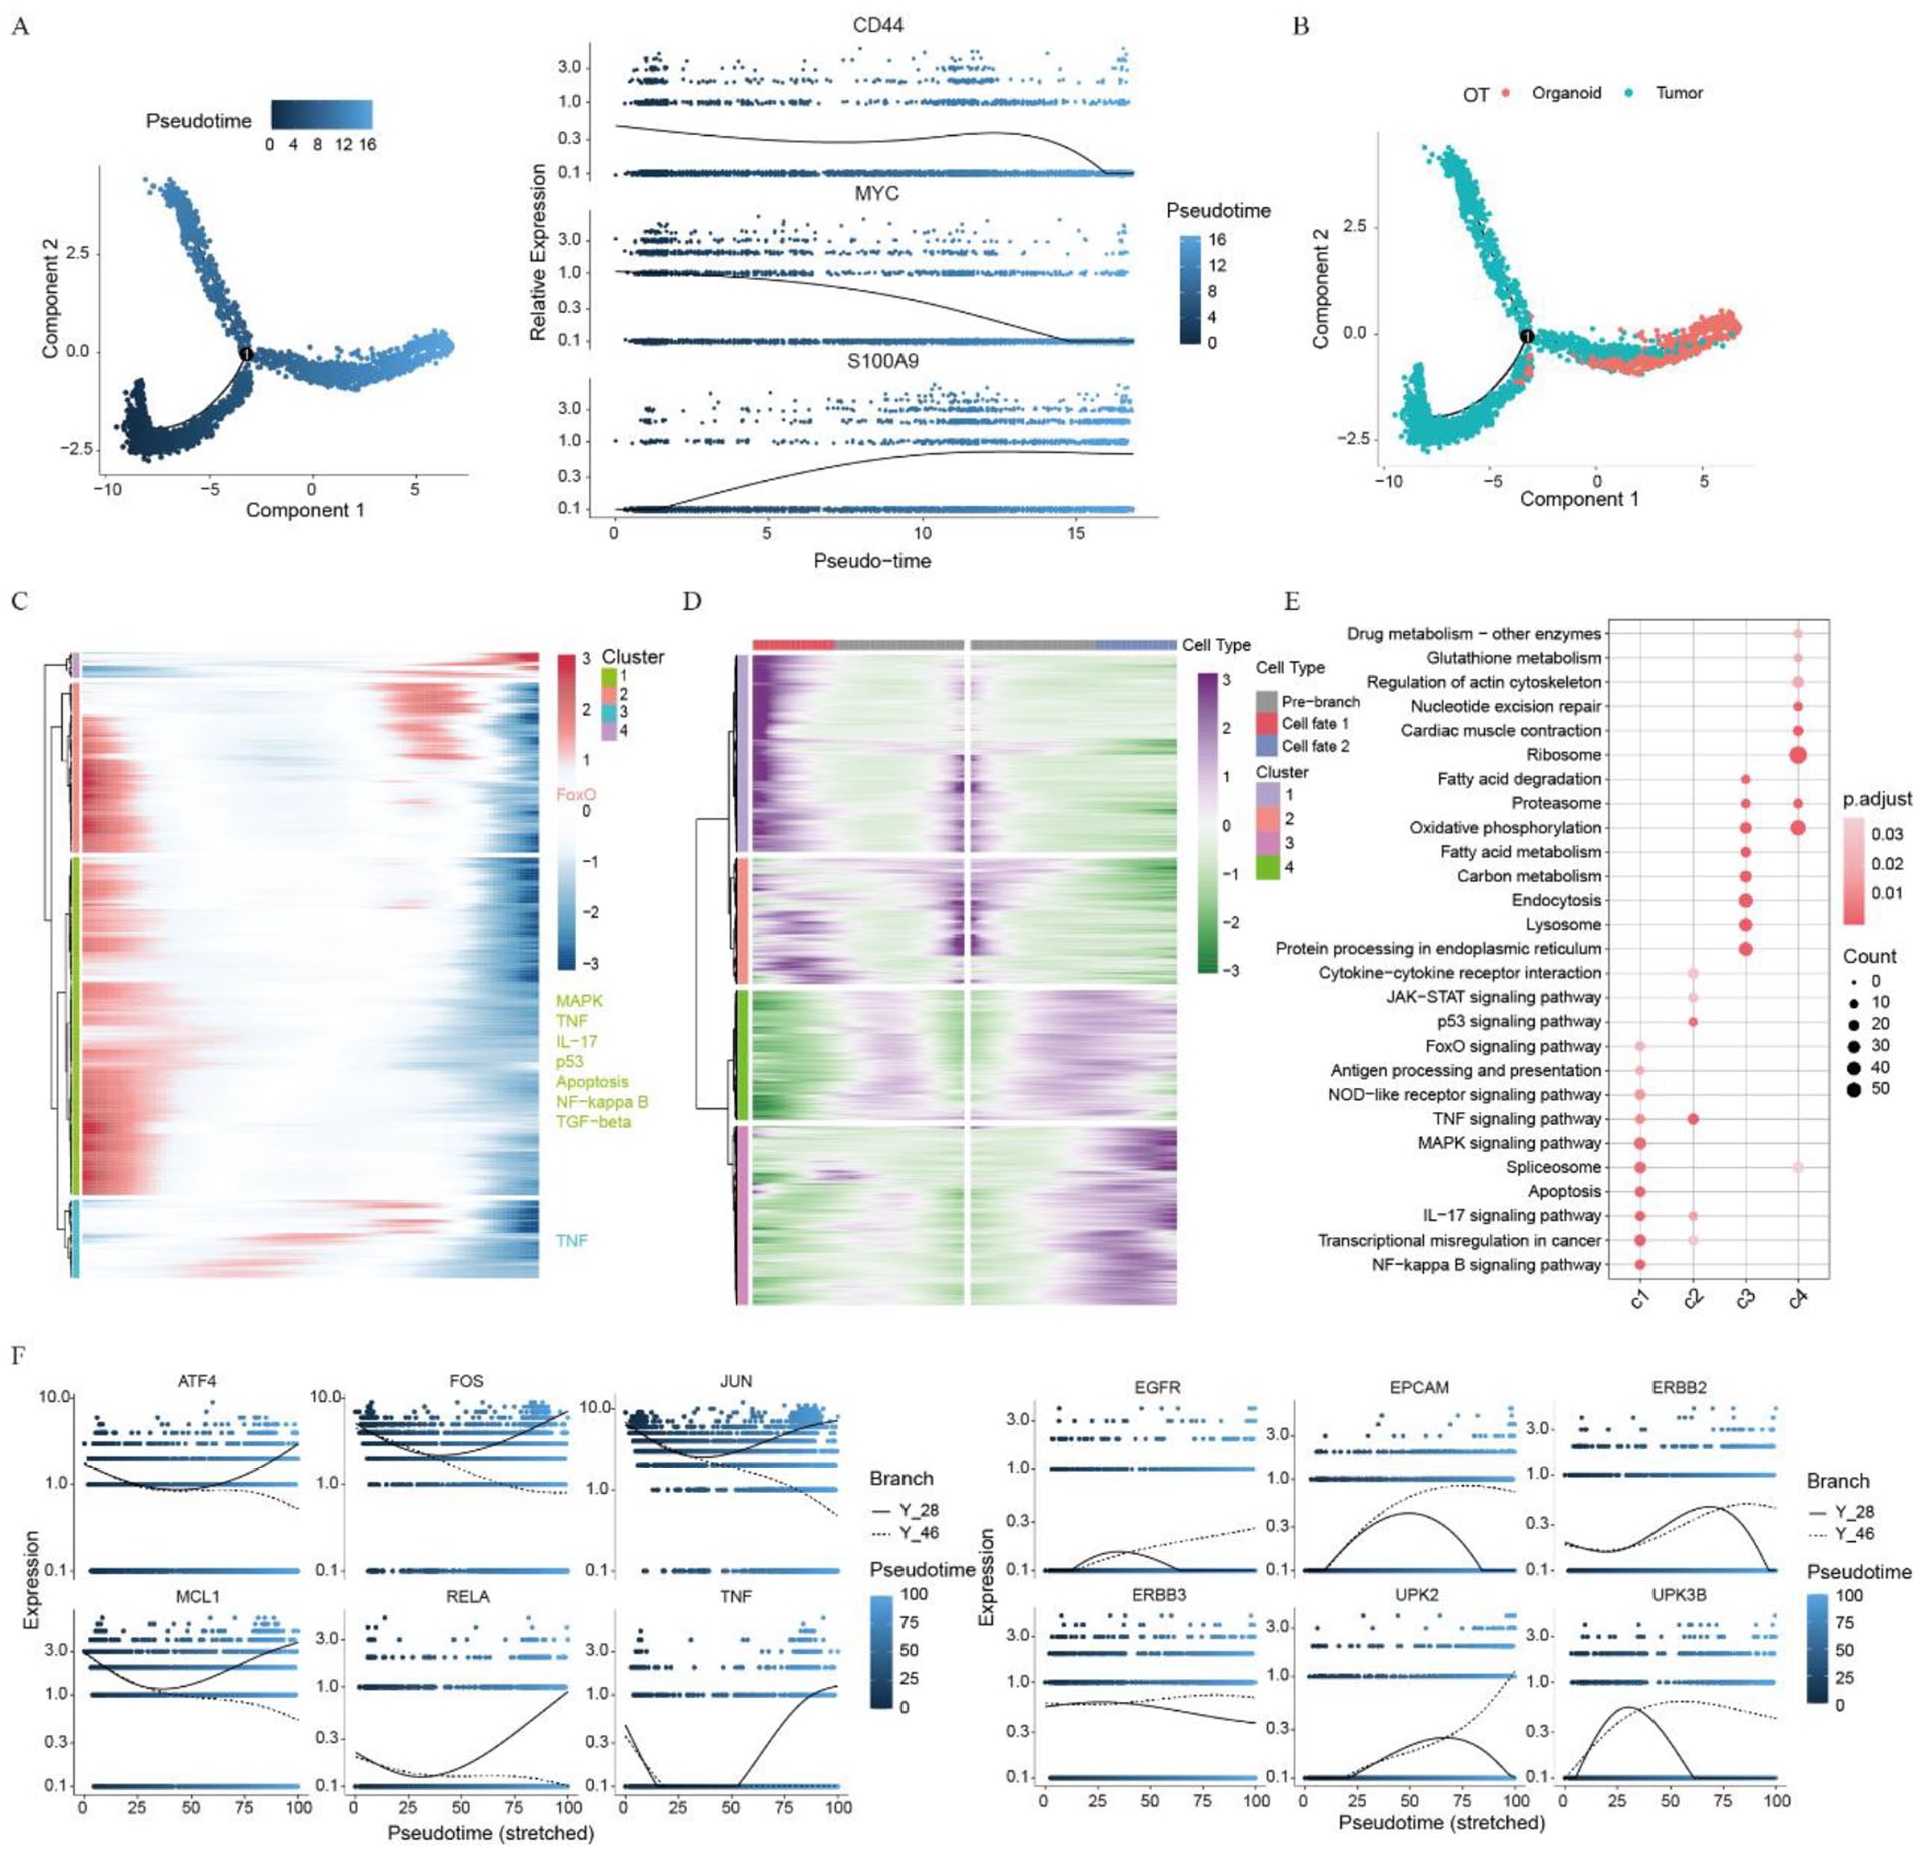
Tumor cell differentiation trajectory and functional characterization: (A) unsupervised transcriptional trajectory of tumor cells predicted by Monocle2, (B) distribution of organoid and tumor cells on the trajectory, (C) heatmap illustrating the expression of identified genes associated with tumor cell progression, (D) heatmap showing the expression of identified genes associated with tumor cell states, (E) functional enrichment analysis of gene sets in distinct cell states, and (F) gene expression dynamics along the trajectory branches.
Distinct subpopulations in tumor cells
Hierarchical clustering identified 4 subpopulations within tumor cells (Figures 4A and S4A). Subpopulation1 (S1) and subpopulation3 (S3) were enriched in organoids, while subpopulation2 (S2) and subpopulation4 (S4) were more prevalent in tumors. Organoid models recapitulated the presence of S1 and S4, emphasizing their utility in capturing tumor heterogeneity (Figure S4B). S1 and S3 exhibited transcriptional similarity (Figure 4D), characterized by elevated expression of markers (SPNS2, CEACAM6; Figures 4B and S4E) and shared regulatory motifs (ZNF91, NR2F6, NR1H2, SMARCA4, USF2, and TFF3; Figure 4E and F). However, S3 displayed higher gene expression and occupied a more advanced differentiation state compared to S1 (Figure S4C). Meanwhile, S3 was enriched in tight junction and cytoskeleton, which may be related to invasion and metastasis (Figure 4I). 51 S2 was mainly found in early tumors (Figure S4B) and had high genomic instability (Figure S4D) and a proliferative phenotype (Figure S4C). It exhibited anti-apoptotic and proliferative phenotype marked by the expression of BTG1, NFKBIA, EGR1, VEGFA, and FGF4 (Figure 4B). Additionally, S2 showed activation of multiple oncogenic signaling pathways, including p53, apoptosis, MAPK, IL-17, TNF and HIF-1 (Figure 4I). S2 was regulated by multiple transcription factors including EGR1, CEBPB, ELF3, EZH2, and MAFF motifs (Supplemental File 2: Table S4, Figures 4G and S4G). S4, enriched in later-stage tumors, displayed increased proliferation (Figure 4H), ribosomal biogenesis, and expression of PLPP2 and TCEA3 (Figures 4C and S4F). The S2 geneset score for each cell in the validation set was scored using the AddModuleScore and AUCell. In NMIBC, subpopulation 0 was identified as anti-apoptotic subpopulation with high expression of apoptosis and early-related genes (DDIT4, RACK1, JUNB). Results showed that the anti-apoptotic subpopulation was more abundant in the sample without lymphovascular invasion and least abundant in MIBC, indicating that the anti-apoptotic subpopulation is more prevalent in early-stage disease and may be associated with BLCA progression (Figures 4J, S4H, and S4I). The results revealed 4 tumor cell subpopulations with different biological characteristics. These subpopulations exhibited different molecular features, cell behaviors, and associations with tumor progression, providing new insights into BLCA heterogeneity and potential therapeutic targets.

Identification of tumor cell subpopulations: (A) UMAP plot showing the distribution of 4 tumor cell subpopulations, (B and C) violin plots illustrating the markers in S1, S3 (B) and S4 (C), (D) heatmap visualizing DEGs between 4 tumor subpopulations, (E) dot plot illustrating differentially expressed motifs in each subpopulation, (F and G) UMAP plots of the expression levels of motifs NR2F6 (F) and EGR1 (G), (H) bar plot depicting the proportion of cells in different cell cycle phases in each subpopulation, (I) dot plot illustrating the enrichment of biological processes and pathways in each subpopulation, and (J) violin plot showing the S2 geneset score of each subpopulation in the validation set. Sankey plot comparing the proportion of S2 in patients without lymphovascular invasion, with lymphovascular invasion and T3b high stage in the validation set.
Identification and functional characteristics of fibroblast subpopulations
We performed unsupervised clustering and identified 2 fibroblast subpopulations (Figure 5A). Subpopulation 0 was enriched in myofibroblastic cancer-associated fibroblasts (mCAFs) markers, such as RGS5, ACTA2, and MYLK, and was classified as mCAFs. Subpopulation 1, which expressed the inflammatory cancer-associated fibroblast (iCAF) marker PDGFRA, was named iCAFs (Figure 5B). 52 Notably, high expression of ACTA2, MYLK, and PDGFRA correlated with poor OS (Figure 5C). mCAFs uniquely expressed NOTCH3 and PPP1R14A, while iCAFs primarily expressed IL33 and FAP (Figures 5D and S5A). NOTCH3 is expressed in vascular smooth muscle cells (VSMCs) and plays a key role in vascular development and differentiation. 53 PPP1R14A regulates the phosphorylation status of PPP1CA substrates and smooth muscle contraction. 54 In breast cancer, IL33 drives lung metastasis and suppresses immunity. 55 FAP, which can contribute to immunosuppression and promote tumor metastasis, is also expressed in tumor-associated macrophages. 56 Similarly, elevated expression of NOTCH3, PPP1R14A, IL33, and FAP predicted poor clinical outcomes and may serve as potential markers for tumor progression and prognosis (Figure S5B). 57 SCENIC analysis (Supplemental File 2: Table S5) revealed enrichment of NFIX, CREB3L1, FOSL1, MEF2C, and MAFF motifs in mCAFs, suggesting their potential roles in regulating myocytes and extracellular matrix, thereby contributing to metastasis.58 -61 FOXP2, WISP2, and HOXB13 motifs were expressed in iCAFs, suggesting their potential roles in tumor progression and immune regulation (Figure 5E). GSEA indicated that mCAFs have potential roles in maintaining muscle structure and regulating vascular smooth muscle contraction, and iCAF is likely involved in regulating inflammatory responses through cytokine signaling (Figures 5F and S5C). These findings demonstrate distinct fibroblast subpopulations with divergent roles in the TME, suggesting potential therapeutic targets.
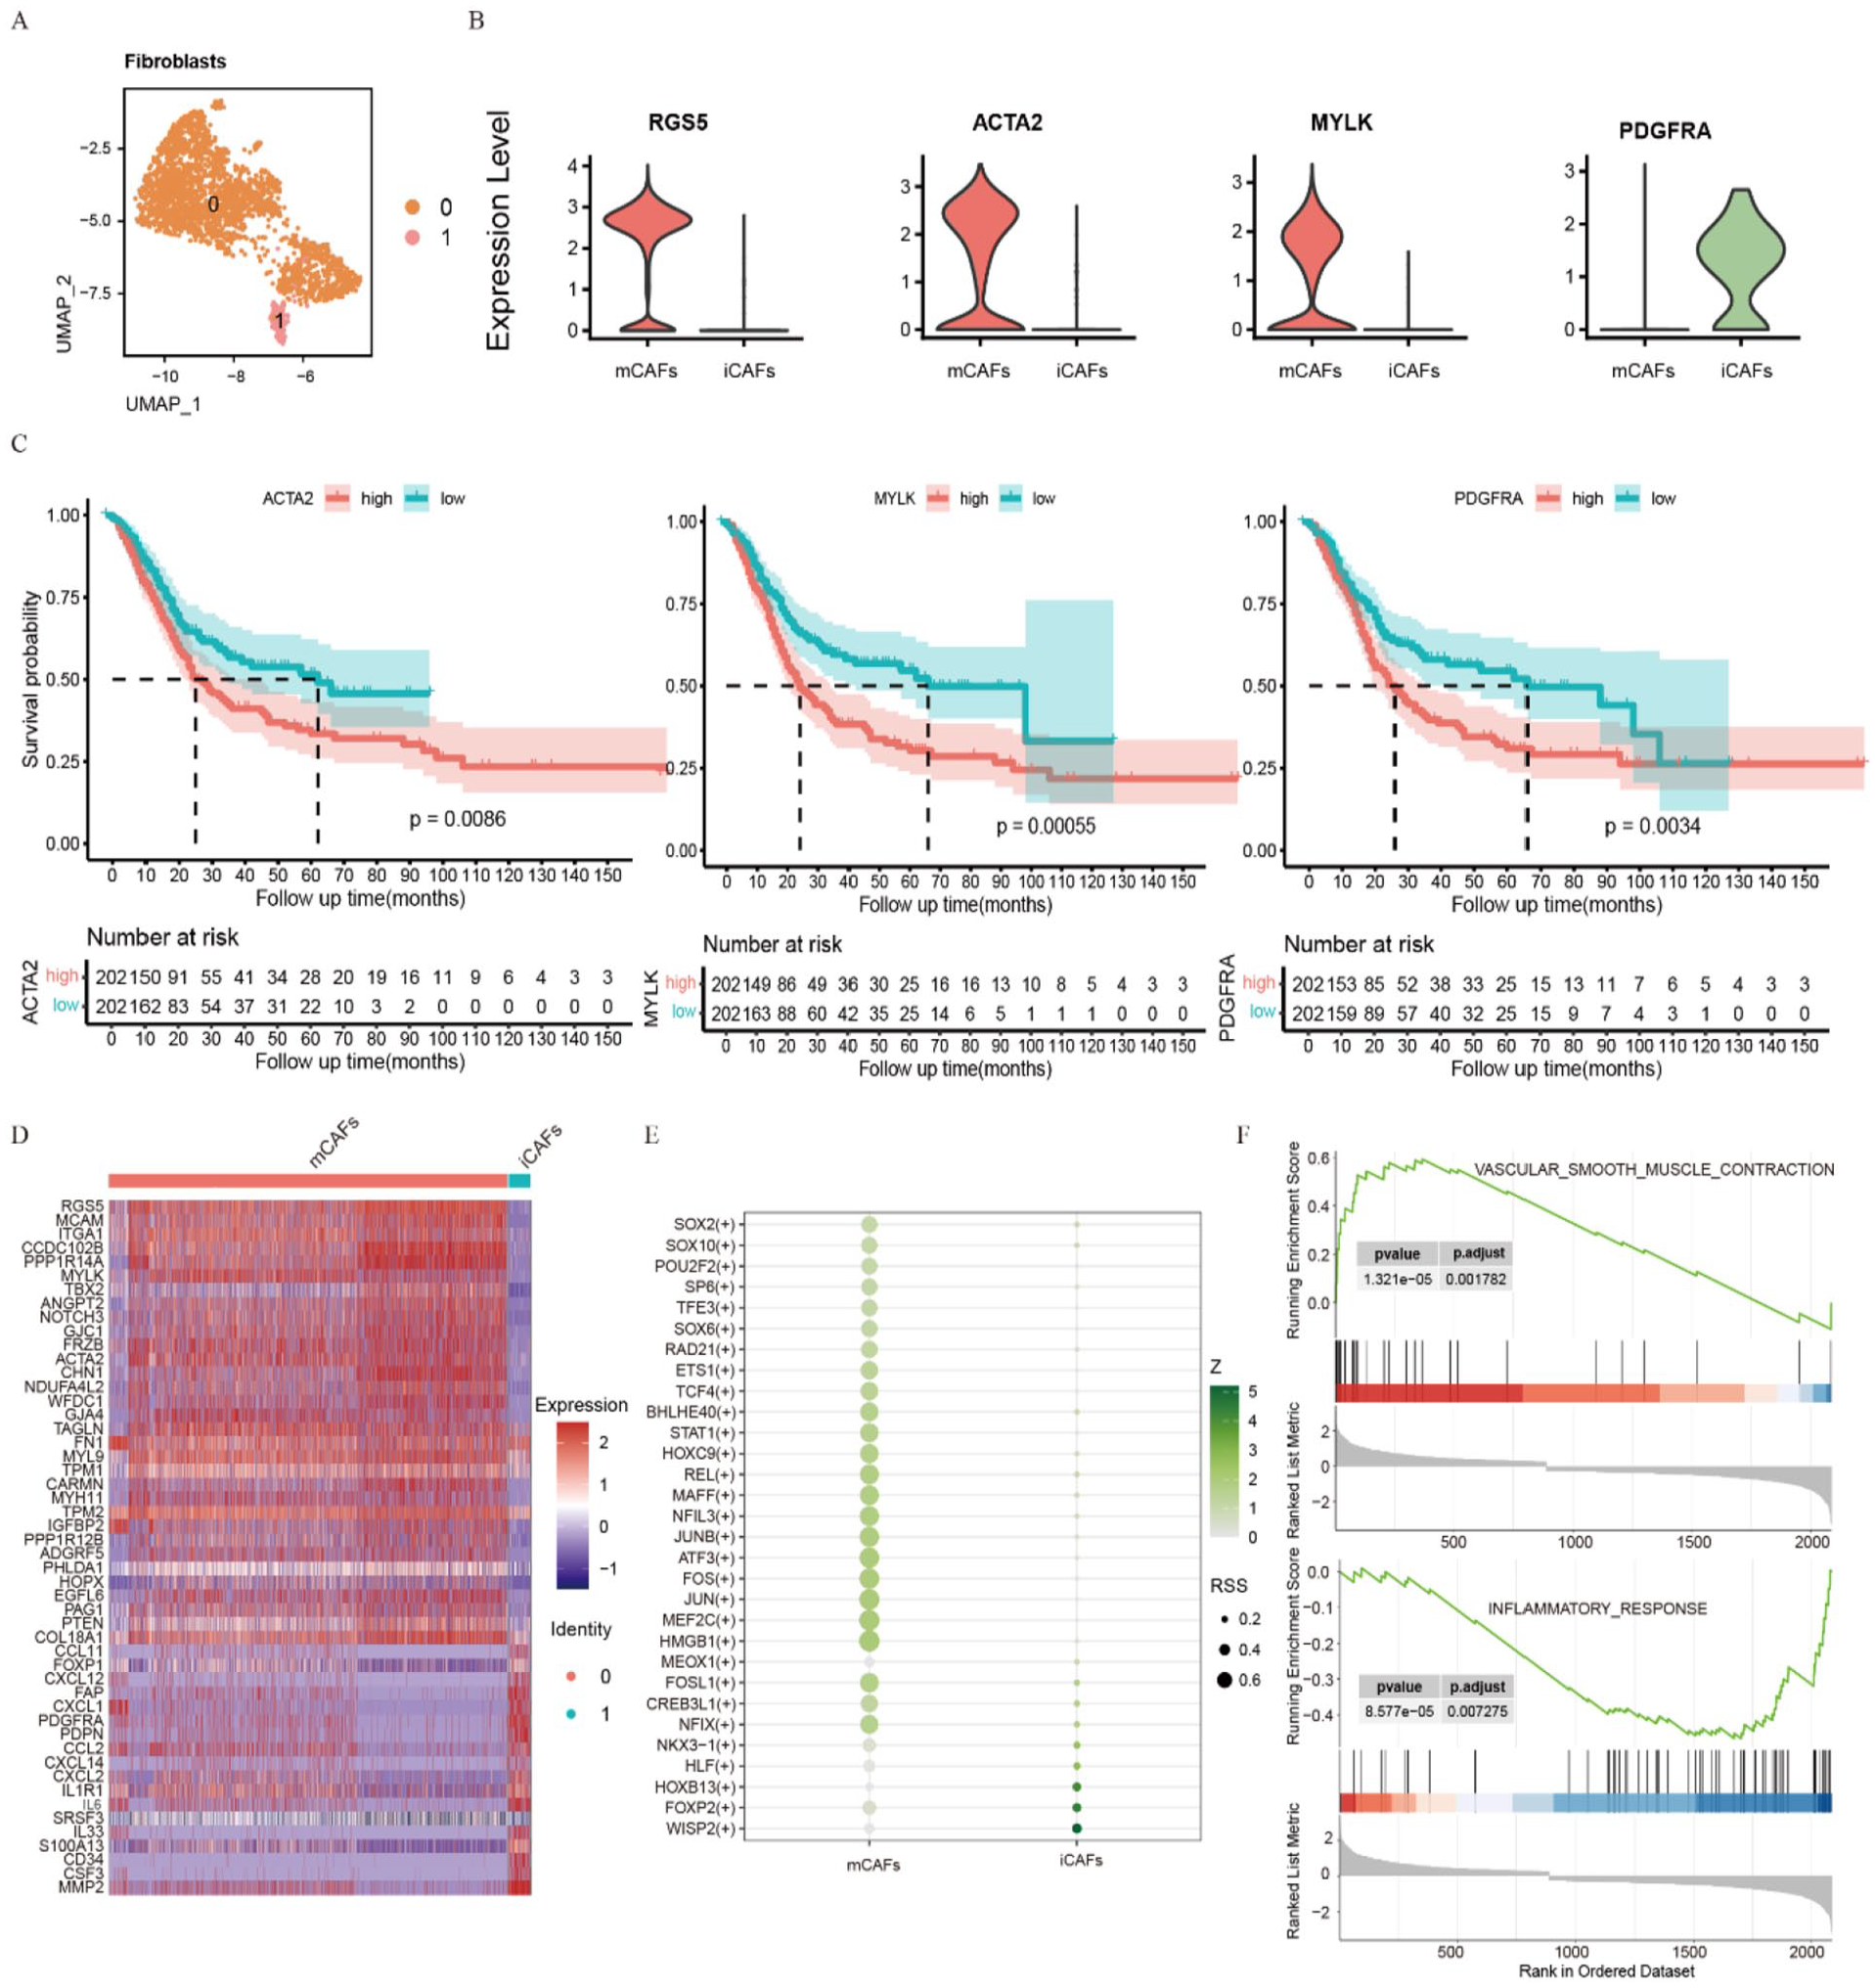
Identification and functional characterization of fibroblast subpopulations: (A) UMAP plot showing the distribution of 2 fibroblast subpopulations, (B) violin plots illustrating the markers (RGS5, ACTA2, MYLK, and PDGFRA) between the 2 fibroblast subpopulations, (C) Kaplan-Meier curves demonstrating the association between the expression levels of ACTA2, MYLK, PDGFRA and OS, (D) heatmap showing DEGs in fibroblast subpopulations, (E) dot plot illustrating differentially expressed motifs in fibroblast subpopulations, and (F) GSEA of fibroblast subpopulations.
Cell-cell communication drives tumor progression
This study constructed a cell-cell communication network (Supplemental File 2: Table S6). This network includes tumor cells, fibroblasts, immune cells (T/NK, B, macrophages), and endothelial cells (Figure 6A). Tumor subpopulation S2 may promote tumor progression by expressing FGF4 and activating FGFR1 on CAFs. 62 Notably, Kaplan-Meier curve analysis indicated that FGF4 deregulation affected the OS rate of patients, leading to prognostic significance (Figure 6B and D). Additionally, stromal cells promoted S2 metastasis through growth factor secretion (Figure S6A). iCAFs express chemokines such as CXCL1 and CXCL2, which act on CXCR4 of immune cells and ACKR3 of stromal cells to promote metastasis,63,64 whereas mCAFs interact with endothelial cells through NOTCH signaling pathway (Figure 6C and E). CAFs are found in breast cancer to promote tumor metastasis through NOTCH signaling pathway. 65 Endothelial cells also influence CAFs through NOTCH signaling (Figure S6B). Tumor cells and immune cells secrete VEGFA, which activates VEGF receptors on endothelial cells, thereby regulating angiogenesis and providing nutrients and oxygen for tumor growth (Figure S6C). 66 Tumor cells further modulated the TME through factors like GDF, impacting stromal cells (Figure S6D). We revealed a multifaceted cellular communication network driving tumor progression. Tumor cells, fibroblasts, and endothelial cells play pivotal roles in shaping the TME. The intricate interplay of these cells, mediated by signaling pathways like FGF, CXCL, NOTCH, and VEGF, underscores the need for multi-targeted therapeutic approaches.

Cell-cell communication network and key signaling pathway analysis in the TME: (A) cell-cell communication network. The nodes represent different cell subpopulations, and the thickness of the edges reflects the strength of the communication between different cell subpopulations, (B) dot plot illustrating ligand-receptor pairs involved in communications between S2 and other cell types, (C) dot plot depicting ligand-receptor pairs mediating communications between mCAFs and iCAFs with other cell types, (D) violin plots showing the expression levels of key FGF pathway genes in different cell subpopulations. Kaplan-Meier curve analysis demonstrating the association between FGF4 expression and OS, and (E) dot plot illustrating the expression levels of key genes in the CXCL and NOTCH pathways across different cell subpopulations.
Molecular mechanisms of tumor subpopulation S2 driving tumor progression
To explore the molecular mechanisms underlying S2 driving tumor progression, we performed a comprehensive analysis of DEGs. The PPI network revealed complex interactions among DEGs, implicated in metabolism, apoptosis, differentiation, and migration (Supplemental File 2: Table S7 and Figure 7A). Modular analysis of the top 100 genes (Clustering Coefficient) identified functional modules related to cell apoptosis, metabolism, proliferation, and migration (Supplemental File 2: Table S8 and Figure 7B), suggesting their multifaceted roles in tumor progression. To identify potential oncogenic drivers, we examined the mutational landscape of key PPI network genes using TCGA data. Genes involved in apoptosis and proliferation, such as DUSP2 and BCL2L11, exhibited high mutation rates (Figure 7C). Among the top 5 genes (Figure 7D), SAT1, TIFA, and IL20RA were frequently mutated in BLCA (Figure S7A). Survival analysis revealed that high expression of RNASEK was associated with significant improvement in OS, while elevated IL20RA and SAT1 were associated with poorer patient prognosis (Figures 7E and S7B). SAT1 is involved in p53-mediated ferroptosis and the regulation of polyamine metabolism in breast cancer. 67 TIFA modulates lung cancer cell survival and proliferation through regulating the synthesis of apoptosis-associated proteins. 68 Furthermore, IL20RA showed negative correlations with immune checkpoint molecules, suggesting potential implications for immune evasion. 69 RNASEK may play a role in regulating the balance between cell survival and death by regulating autophagosome degradation. 70 Meanwhile, CDC42EP3 plays a tumor-promoting role in glioma progression by targeting CCND1. 71 Our findings underscore the complex molecular mechanisms driving S2-mediated tumor progression. The identification of key genes and their functional interactions provides valuable insights into potential therapeutic targets.

PPI network and mutation analysis of highly expressed genes in tumor subpopulation S2: (A) bar graph illustrating the results of functional enrichment analysis of the PPI network of highly expressed genes in S2 constructed using the STRING database, (B) PPI network consisted of the top 100 genes divided into 4 functional modules, (C) box plot depicting gene mutation frequency and a waterfall plot visualizing gene mutation types and distribution for selected key genes from the PPI network, (D) 5 hub genes identified from the PPI network, (E) Kaplan-Meier survival curve comparing patient survival based on RNASEK expression levels, and (F) dot plot illustrating the correlation between the expression levels of 5 hub genes and immune checkpoint genes.
Development and validation of a prognostic risk model to predict survival and guide immunotherapy in BLCA
Multivariate Cox regression analysis identified RNASEK and TIFA as independent prognostic factors associated with OS (Figure 8A). The risk score was calculated based on the expression levels of 5 hub genes. Patients were stratified into high-risk and low-risk groups based on their risk scores. Kaplan-Meier survival analysis demonstrated significantly better OS in the low-risk group (Figure 8B and C). External validation in the GSE13507 and GSE32894 datasets confirmed the model’s clinical applicability and robustness (Figure S8A), with area under the curve (AUC) values exceeding 0.7 for 1-, 3-, and 5-year OS (Figure 8D). Cox regression analysis further confirmed the prognostic importance of risk score, age and clinical stage (Figure 8E). A nomogram incorporating these factors was developed to facilitate patient-specific risk assessment (Figure 8F). In addition, the relationship between the risk score and immunotherapy response was investigated. Low-risk patients exhibited lower TIDE scores, decreased dysfunction and exclusion scores, and increased MSI scores, suggesting a more favorable immune microenvironment and potential better response to immunotherapy (Figures 8G and S8B). 72 Meanwhile, the risk score positively correlated with immune checkpoint molecule expression (Figures 8H and S8C), suggesting potential resistance to immunotherapy in high-risk group patients. We established a robust prognostic risk model for BLCA patients. The model’s association with the tumor immune microenvironment highlights its potential as a predictive biomarker for immunotherapy response.

Risk model construction and prognostic evaluation: (A) multivariate Cox regression analysis delineating the prognostic impact of molecular factors on OS, (B) Kaplan-Meier curve demonstrating the distinct survival outcomes between risk score groups, (C) survival status plot contrasting the OS of risk score groups, (D) predicted AUC for 1-, 3-, and 5-year survival in BLCA, (E) multivariate Cox regression analysis delineating the prognostic impact of age, gender, pathological stage, and risk score on OS, (F) nomogram model construction integrating prognostic factors for a comprehensive risk assessment in BLCA patients. (G) Violin plot comparing TIDE scores between risk score groups, and (H) scatter plots illustrating the correlation between the risk score and the expression levels of CD276, PDCD1LG2, and PVR.
Discussion
BLCA heterogeneity poses a significant challenge in clinical management. 73 Despite extensive research, translating findings into effective treatments remains elusive. 6 This study explored the molecular characteristics of tumor progression and established a regulatory network depending on TME. Meanwhile, we developed a prognostic model with clinical predictive value. These findings advance our understanding of BLCA pathogenesis and hold promise for improved patient outcomes through targeted therapeutic strategies.
Previous studies have shown that organoids recapitulate cellular diversity, gene expression, and mutational profiles of their corresponding parental tumors, 74 which is also demonstrated by our findings. Notably, while organoids effectively represented epithelial cell components, they exhibited limited representation of immune and stromal cell populations. This disparity arose from the differential proliferative and survival capacities of these cell types. The inherent self-renewal capacity of cancer stem cells enriched the epithelial lineage within organoid cultures, 75 while immune and stromal cells underwent depletion due to their shorter in vitro lifespan. Meanwhile, organoids often displayed increased differentiation compared to parental tumors.
Increased stromal content and mesenchymal gene expression at higher tumor stages strongly support a key role for EMT in driving BLCA progression. This finding is consistent with previous studies showing that EMT is associated with increased invasiveness. 76 During tumorigenesis, we found that malignant epithelial cells exhibited metabolic reprograming and upregulation of malignancy-associated genes (eg, EPCAM, ERBB3, and FGF4). 77 In contrast, normal epithelial cells demonstrated a distinct profile characterized by chemokine expression (eg, CXCL1, CXCL2, and CXCL8) and immune-inflammatory pathway activation. 78
Tumor cells exhibit heterogeneity during progression, which contributes to drug resistance and poor prognosis. Analysis of malignant epithelial cell pseudotime trajectory revealed different behaviors of cells at different differentiation stages. We found that the early stages were characterized by enhanced proliferation and inflammation, while the later stages showed increased metabolic activity. We also identified potential key genes for cell fate determination (eg, EGFR, UPK2, ATF4, and RELA). We also identified distinct subpopulations in malignant epithelial cells. Tumor subpopulation S1 and S3 showed high expression of SPNS2 and CEACAM6, which have been previously associated with colorectal cancer malignancy and tumor progression.79,80 S1 and S3 have strong metabolic capabilities and cytoskeletal regulation, indicating that they belong to highly invasive and metastatic malignant subpopulations. S4 showed high expression of PLPP2 and TCEA3, a high proportion of S phase and enrichment in drug metabolism pathways. PLPP2 has been associated with lipid raft-mediated proliferation in lung adenocarcinoma, 81 while TCEA3 is involved in vascular differentiation in embryonic stem cells. 82 These findings suggest that S4 represents a proliferative subpopulation with potential drug resistance. Notably, we identified an anti-apoptotic subpopulation predominantly present in early-stage tumors. This subpopulation exhibited high mutation rates and transcriptional dysregulation, enriched in apoptosis and p53 pathways. Concurrently, activation of oncogenic signaling pathways (MAPK, TNF, HIF-1, and PI3K-Akt) and regulation by motifs (EGR1, CEBPB, ELF3, EZH2, and MAFF) were observed. Further analysis of the communication regulation mechanism of this subpopulation revealed that it can promote tumor growth and metastasis through the interaction of FGF4, VEGF, and GDF signals with stromal cells. We also found that fibroblast heterogeneity affects the TME, with iCAFs and mCAFs promoting tumor metastasis in different ways.83,84 However, this study only analyzed tumor tissues and organoids, and further functional experiments are needed to verify the tumorigenicity and mechanisms driving progression of malignant epithelial cells.
PPI network analysis revealed that the anti-apoptotic subpopulation contained functional modules of apoptosis, proliferation, differentiation and metabolism, highlighting the complex regulatory landscape within this subpopulation. Translating these findings into clinical practice, a prognostic risk model was developed using the hub genes (SAT1, CDC42EP3, IL20RA, RNASEK, and TIFA). This model effectively stratified patients into high- and low-risk groups with significantly different OS. Meanwhile, a nomogram was constructed to facilitate clinical application. Notably, the risk score positively correlated with immune checkpoint gene expression, suggesting potential differences in immunotherapy response. Patients in the low-risk group exhibited lower TIDE scores, indicating a potential for improved response to immunotherapy. 85 These findings underscore the clinical utility of this prognostic model in patient stratification and treatment decision-making. Further exploration of the model’s predictive capabilities in larger cohorts is warranted.
Conclusions
This study comprehensively characterized BLCA heterogeneity by integrating single-cell analysis, organoid models, and multi-omics approaches. We identified tumor subpopulations with distinct biological behaviors and revealed key molecular and cellular drivers of tumor progression. A prognostic risk model was developed to stratify patients and guide treatment decisions. Understanding the intricate communications between tumor cells, stroma, and the immune microenvironment is critical for developing effective therapeutics.
Supplemental Material
sj-docx-1-cix-10.1177_11769351251323569 – Supplemental material for Single-cell Analysis Highlights Anti-apoptotic Subpopulation Promoting Malignant Progression and Predicting Prognosis in Bladder Cancer
Supplemental material, sj-docx-1-cix-10.1177_11769351251323569 for Single-cell Analysis Highlights Anti-apoptotic Subpopulation Promoting Malignant Progression and Predicting Prognosis in Bladder Cancer by Linhuan Chen, Yangyang Hao, Tianzhang Zhai, Fan Yang, Shuqiu Chen, Xue Lin and Jian Li in Cancer Informatics
Supplemental Material
sj-xlsx-1-cix-10.1177_11769351251323569 – Supplemental material for Single-cell Analysis Highlights Anti-apoptotic Subpopulation Promoting Malignant Progression and Predicting Prognosis in Bladder Cancer
Supplemental material, sj-xlsx-1-cix-10.1177_11769351251323569 for Single-cell Analysis Highlights Anti-apoptotic Subpopulation Promoting Malignant Progression and Predicting Prognosis in Bladder Cancer by Linhuan Chen, Yangyang Hao, Tianzhang Zhai, Fan Yang, Shuqiu Chen, Xue Lin and Jian Li in Cancer Informatics
Footnotes
Acknowledgements
We thank the Gene Expression Omnibus (GEO) and The Cancer Genome Atlas (TCGA) Database for sharing a large amount of data.
Author Contributions
Conceptualization, project administration and supervision by XL and JL. QSC contributed to ethical approval acquisition, sample collection, data uploading, and manuscript revision. Investigation by LHC (data analysis and interpretation and drafting manuscript). LHC and YYH designed the study and revised the manuscript. TZZ and FY participated the data analysis. All the authors have read and approved this manuscript for publication.
Declaration Of Conflicting Interests:
The author(s) declared no potential conflicts of interest with respect to the research, authorship, and/or publication of this article.
Funding:
The author(s) disclosed receipt of the following financial support for the research, authorship, and/or publication of this article: This study was supported by the General Project of the National Natural Science Foundation of China (Project No. 32270607), the Major Project of Basic Research on Frontier Leading Technologies in Jiangsu Province (Project No. BK20222008), Social Development Foundation of Jiangsu Province (BE2021739, BE2023601), and Scientific research project of Jiangsu health commission (DX202301).
Availability of Data and Materials
The datasets used and analyzed in this study are available from the corresponding author upon reasonable request. The data that support the results of the current study are available on TCGA and GEO websites. The scRNA-seq data of the BLCA tumor analyzed in this study have been deposited in the GSA-Human database (![]() ) under the accession number HRA009648.
) under the accession number HRA009648.
Ethics Approval and Consent to Participate
This study was approved by the Ethics Committee for Clinical Research of Zhongda Hospital Affiliated to Southeast University (2024ZDSYLL453-P01).
Consent for Publication
Written informed consent was obtained from the patient prior to tissue collection for subsequent scRNA-seq.
Supplemental Material
Supplemental material for this article is available online.
References
Supplementary Material
Please find the following supplemental material available below.
For Open Access articles published under a Creative Commons License, all supplemental material carries the same license as the article it is associated with.
For non-Open Access articles published, all supplemental material carries a non-exclusive license, and permission requests for re-use of supplemental material or any part of supplemental material shall be sent directly to the copyright owner as specified in the copyright notice associated with the article.