
Abstract
Background
Homeobox C6 (HOXC6) shows abnormal expression in various tumors, but its pattern in lung squamous cell carcinoma (LUSC) remains unclear.
Objective
To investigate HOXC6's expression and function in LUSC.
Methods
HOXC6 expression was analyzed using single-cell RNA sequencing (scRNA-seq) in LUSC, cervical squamous cell carcinoma (CESC), esophageal squamous cell carcinoma (ESCC), laryngeal squamous cell carcinoma (LSCC), and oral squamous cell carcinoma (OSCC), verified by RNA-seq and immunohistochemistry (IHC). CRISPR knockdown assessed proliferation impact. Immune infiltration analysis, single-sample Gene Set Enrichment Analysis (ssGSEA), Estimation of STromal and Immune cells in MAlignant Tumor tissues using Expression data (ESTIMATE), Gene Ontology (GO), and Kyoto Encyclopedia of Genes and Genomes (KEGG) analyses explored immune microenvironment relationships.
Results
HOXC6 was highly expressed in LUSC (standard mean difference (SMD) = 1.17, confidence interval (CI) = 0.75–1.59, area under the curve (AUC) = 0.88), confirmed by IHC (P = 1.6e-10, AUC = 0.99). HOXC6 silencing inhibited proliferation. High expression negatively correlated with immune infiltration and decreased StromalScore, ImmuneScore, and ESTIMATEScore. HOXC6 was elevated in other squamous carcinomas.
Conclusion
High HOXC6 expression may promote LUSC and pan-squamous carcinoma development through mitosis regulation.
Introduction
LUSC is a subtype of non-small cell lung cancer, 1 characterized by significant heterogeneity and complex molecular mechanisms, which pose challenges for its diagnosis and treatment. With the deepening of cancer research, the heterogeneity of tumor cells and the role of their microenvironment have been considered to play a crucial role in tumor progression, metastasis, and the development of drug resistance.2,3 For a long time, the study of tumor-specific genes has been an important direction in cancer treatment.
As a member of the HOX gene family, HOXC6 4 exhibits aberrant expression in various tumor types and is closely associated with tumor proliferation, metastasis, and treatment resistance. In cancers such as pancreatic cancer 5 and cervical cancer, 6 HOXC6 has been shown to regulate cell cycle progression, particularly through mitosis-related pathways, and enhance tumor cell survival. However, its specific functions and molecular mechanisms in LUSC remain underexplored, representing a critical gap in understanding its therapeutic potential. This study aims to address this gap by investigating HOXC6 expression patterns and its role in LUSC proliferation and immune modulation, potentially unveiling novel therapeutic targets.The focus on pan-squamous cell carcinomas, including CESC, ESCC, LSCC, and OSCC, is motivated by their shared histopathological features and molecular similarities, such as dysregulated cell cycle control and immune evasion mechanisms.7,8 These cancers often exhibit overlapping oncogenic pathways, including those involving HOX genes, and face similar clinical challenges, such as resistance to conventional therapies, making them ideal candidates for comparative analysis to uncover common therapeutic vulnerabilities.
Additionally, pan-squamous cell carcinoma,3,5,6 as a type of squamous cell carcinoma widely found in multiple organs, exhibits molecular-level heterogeneity and complex molecular mechanisms similar to those of LUSC. The occurrence and development of pan-squamous cell carcinoma also involve cell cycle regulation, abnormal nuclear division, and changes in the tumor microenvironment, providing a new perspective for further exploring common pathogenic mechanisms in tumors.
Mitosis 7 is a critical step in the process of cell proliferation, and the precise regulation of the cell cycle is essential for normal cell division and the transmission of genetic information. Mitosis8,9 may be involved in the regulation of the cell cycle, particularly during mitosis, by modulating genes associated with cell division, thereby promoting the rapid proliferation of tumor cells. In this study, scRNA-seq technology was employed for an in-depth analysis of LUSC tumor tissues, aiming to reveal the expression pattern of HOXC6 in LUSC and its potential pathogenic role. In combination with large-scale RNA-seq data and immunohistochemical staining, the high expression of HOXC6 in LUSC tissues was validated. Using CRISPR analysis, we evaluated the impact of HOXC6 knockdown on the proliferation of LUSC cells, and investigated the relationship between HOXC6 and immune cell infiltration within the tumor microenvironment. This study provides experimental evidence supporting HOXC6 as a therapeutic target for LUSC and offers new insights for personalized tumor treatment.
Methods
scRNA-seq analysis method for HOXC6 in various squamous cell carcinomas
In this study, we employed multiple scRNA-seq datasets associated with squamous cell carcinoma, including the LUSC-related scRNA-seq dataset (GSM6047623, available from the GEO database); the CESC-related scRNA-seq datasets (GSM5917937, GSM5917938, GSM5917939 from GSE197461, available from the GEO database); the ESCC-related scRNA-seq datasets (GSM5900215, GSM5900217, GSM5900219 from GSE196756, available from the GEO database); the LSCC-related scRNA-seq datasets (GSM8002074, GSM8002075, GSM8002076 from GSE252490, available from the GEO database); and the OSCC-related scRNA-seq datasets (GSM5851565, GSM5851567, GSM5851569, GSM5851571 from GSE195832, available from the GEO database), to analyze HOXC6 at the single-cell level. First, the raw data were preprocessed and filtered using the Seurat package 10 ; genes expressed in fewer than three cells and cells with fewer than 50 expressed genes were removed. Subsequently, quality control was performed by retaining cells with more than 500 expressed genes and less than 25% mitochondrial content. After normalization, dimensionality reduction was carried out using principal component analysis (PCA), with the first 20 principal components selected for clustering analysis; thereafter, the t-distributed Stochastic Neighbor Embedding (t-SNE) algorithm was applied for secondary dimensionality reduction. Finally, different cell subpopulations in LUSC, CESC, ESCC, LSCC, and OSCC were annotated using cell type-specific marker genes. Cell annotations were validated by cross-referencing against established cell-type markers, including KRT5, KRT14, and TP63 for epithelial cells. Additionally, specific validation markers such as CD274 for LUSC, CDKN2A for CESC, CDH1 for ESCC, SOX2 for LSCC, and MKi67 for OSCC were used to confirm the identity of tumor-associated epithelial cells and ensure accuracy of the clustering results. The analysis focused on the expression patterns and distribution characteristics of HOXC6 in various squamous cell carcinoma types and their microenvironment cells, evaluating its expression differences and potential functional significance across different cell subpopulations.
Selection and collection of gene expression data from bulk high-throughput resources
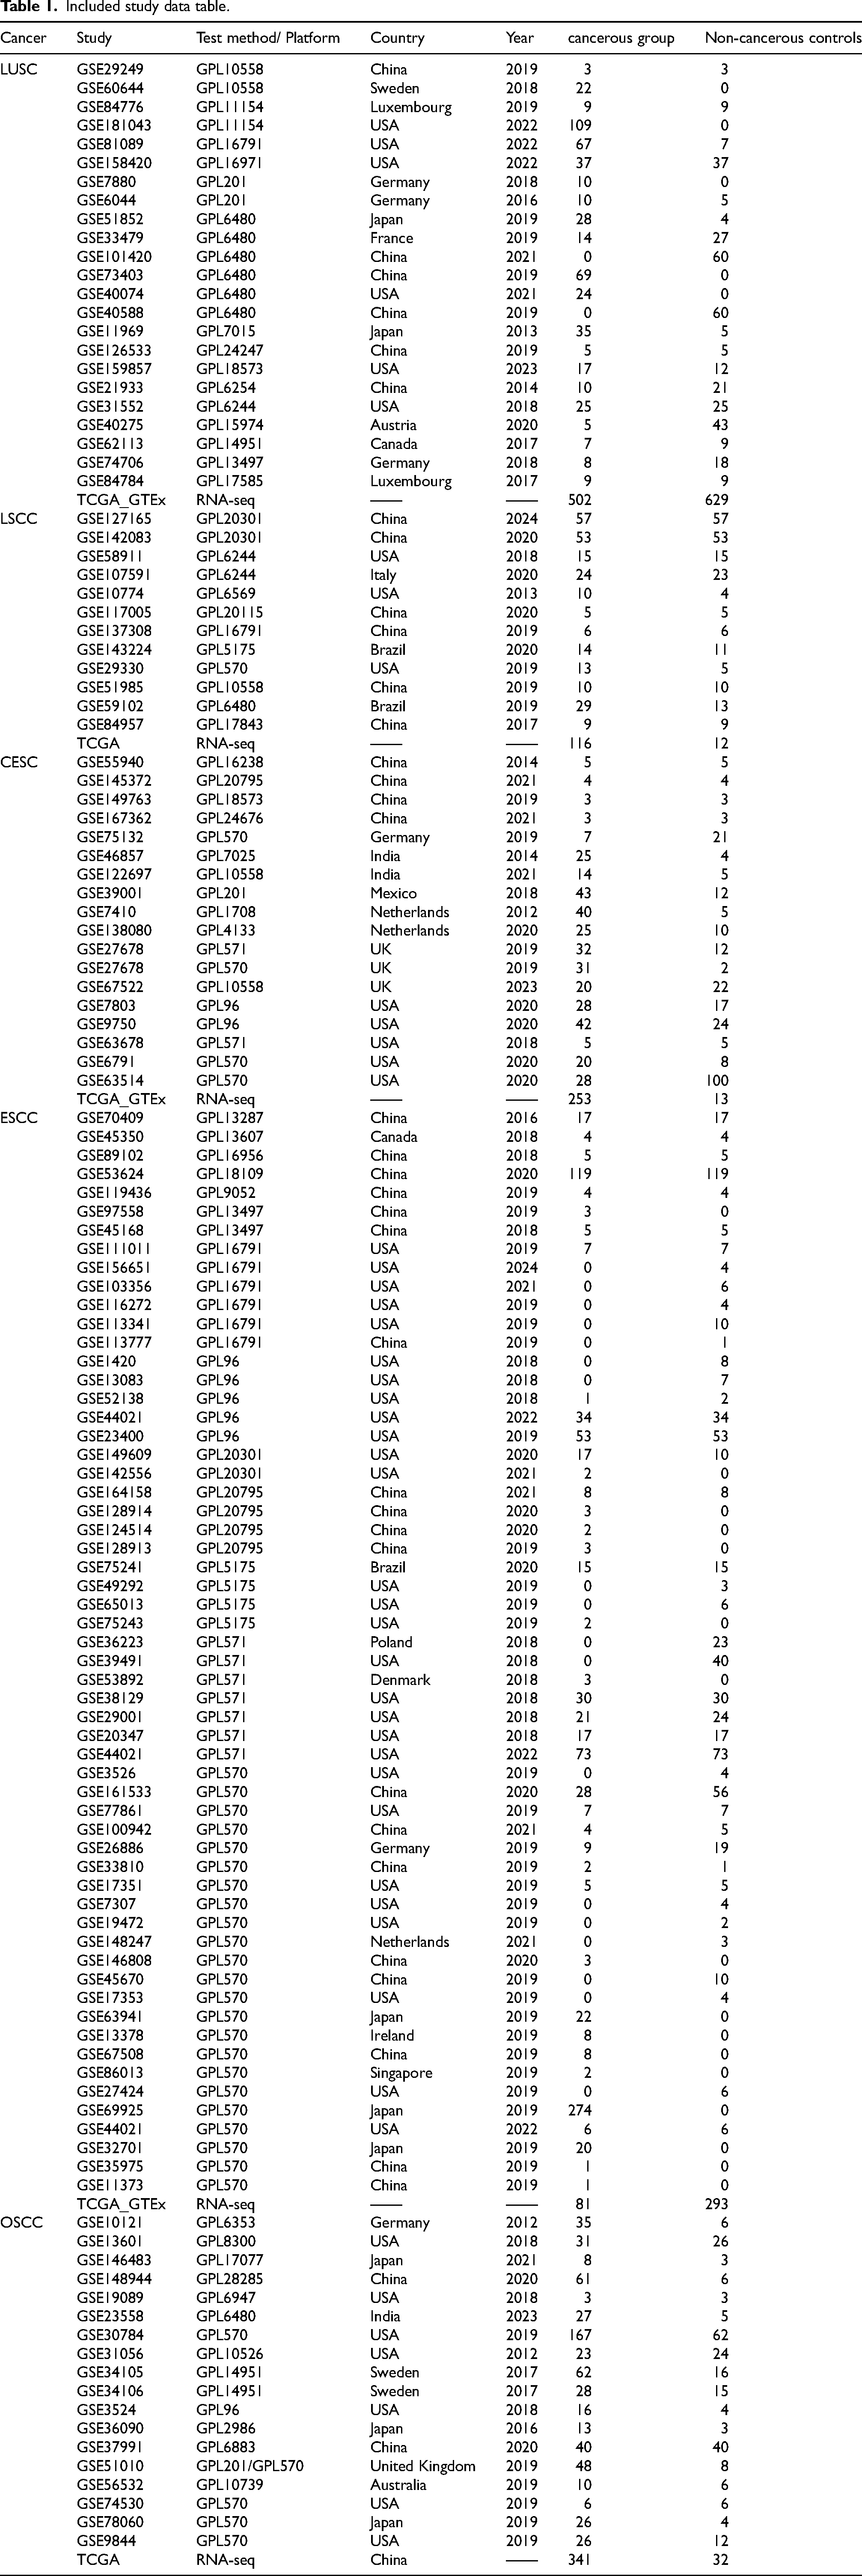
To investigate the differential expression of HOXC6 in LUSC, CESC, ESCC, LSCC, and OSCC, we systematically searched and downloaded RNA-seq and microarray datasets (see Table 1) containing tissue samples from LUSC, CESC, ESCC, LSCC, OSCC, and non-LUSC, CESC, ESCC, LSCC, OSCC. The inclusion criteria for cases were: (1) samples were primarily derived from human LUSC, CESC, ESCC, LSCC, and OSCC tissues; (2) the experimental group comprised tissues from LUSC, CESC, ESCC, LSCC, and OSCC, whereas the control group comprised tissues from non-LUSC, CESC, ESCC, LSCC, and OSCC; (3) each group contained no fewer than three samples. The exclusion criteria were: (1) insufficient sample numbers; (2) inability to extract HOXC6 expression data; and (3) samples derived from patients with metastatic or recurrent LUSC, CESC, ESCC, LSCC, and OSCC. All mRNA expression data were standardized and subjected to a log2(x + 1) transformation, and batch effects were removed after merging data from the same platform. Subsequently, we used the meta package (version 4.18-2) to calculate the SMD between genes to quantify the differences between LUSC, CESC, ESCC, LSCC, OSCC tissues and non-LUSC, CESC, ESCC, LSCC, OSCC tissues, thereby revealing the pathogenic molecular role of HOXC6 in these carcinomas. To identify overexpressed genes in LUSC, CESC, ESCC, LSCC, and OSCC samples, the criteria were set as follows: (1) the gene must appear in at least three independent studies; (2) the 95% confidence interval (CI) must not include zero. For genes co-expressed with HOXC6, Spearman correlation analysis was performed with the following criteria: (I) co-expression must be observed in at least six studies; (II) the absolute value of the Spearman correlation coefficient is ≥ 0.20; (III) the significance level (p-value) is < 0.05. Subsequently, an intersection analysis was performed between the set of overexpressed genes and the genes co-expressed with HOXC6 in LUSC, CESC, ESCC, LSCC, and OSCC. The clusterProfiler package was then used for functional annotation of the intersecting genes, and their biological functions were further explored through GO and KEGG pathway analyses. Finally, the String website was utilized for the analysis of co-expressed genes.
Included study data table.
Immunohistochemical staining of internal institutional samples
This study collected 142 tissue samples from the First Affiliated Hospital of Guangxi Medical University, including 127 LUSC tissues and 15 non-LUSC tissues. Immunohistochemical staining was performed according to strict standard protocols, using a HOXC6 polyclonal antibody (RRID: AB_2609572, Invitrogen™, dilution 1:150) to process the tissue samples. After staining, the tissue microarrays underwent re-incubation, staining, and dehydration processes, and were sealed at room temperature. The staining results of the slides were scored based on the percentage of positive cells as follows: a score of 0 indicates 0% positive cells; 1 indicates 1%–5%; 2 indicates 6%–10%; 3 indicates 11%–15%; 4 indicates 16%–20%; 5 indicates 21%–25%; 6 indicates 26%–30%; 7 indicates 31%–35%; 8 indicates 36%–40%; 9 indicates 41%–50%; 10 indicates 51%–75%; 11 indicates 76%–90%; and 12 indicates 91%–100%. The thresholds for positive cell percentages, as detailed in Table S1, were selected based on established histopathological scoring standards to ensure consistency with clinical diagnostic practices, with incremental ranges designed to reflect biologically meaningful differences in HOXC6 expression levels. Two pathologists independently evaluated the overall immunohistochemical scores based on the proportion of positive cells and staining intensity, and the Wilcoxon rank-sum test was used to compare the number of positive cells between LUSC and adjacent non-cancerous tissues. Inter-observer reliability was assessed statistically using Cohen's Kappa coefficient (κ = 0.89, p < 0.001), indicating strong agreement between the two pathologists in scoring. All patients provided written informed consent, and the study was approved by the Ethics Committee of the First Affiliated Hospital of Guangxi Medical University (approval number: Z-A20240533) through a written ethical approval document.
Expression levels of HOXC6 in different LUSC cell lines and CRISPR inhibition effects
Based on the DEPMap (Dependency Map) database, 11 this study evaluated the expression levels of HOXC6 in various LUSC cell lines as well as the effects of CRISPR-mediated inhibition. The DEPMap database provides abundant high-throughput data on gene expression, mutations, and CRISPR inhibition in tumor cell lines, supporting researchers in analyzing the functions of specific genes across different cell lines. In this study, differences in HOXC6 expression among various LUSC cell lines were illustrated using bar charts. The CERES algorithm was used to calculate dependency scores to determine the criticality of HOXC6 for various LUSC cell lines. Negative dependency scores indicated that HOXC6 knockout hindered the growth of the cell line, suggesting that HOXC6 is necessary for its proliferation. Conversely, positive dependency scores meant that HOXC6 knockout promoted growth rate, indicating that HOXC6 has a potential inhibitory role in these cell lines.
Analysis of the relationship between HOXC6 and immune cell enrichment
The relationship between HOXC6 and different immune cell types and subgroups was analyzed using the SSGSEA method. 12 SSGSEA assesses the enrichment scores of each immune cell subgroup in individual samples, thereby revealing the potential association between HOXC6 expression levels and immune cell subgroups. Gene expression data were downloaded from the TCGA database (https://portal.gdc.cancer.gov) and organized in transcripts per million (TPM) format for the TCGA-LUSC project using the STAR pipeline for RNA-seq data. Differences in immune cell enrichment scores between high and low HOXC6 expression groups were verified using Spearman correlation analysis. Additionally, the ESTIMATE method was employed to further analyze the association between HOXC6 and the immune and stromal scores (StromalScore, ImmuneScore, and the comprehensive ESTIMATEScore) within the tumor microenvironment, providing effective numerical indicators for assessing the tumor immune microenvironment.
Statistical analysis
To assess differences in HOXC6 protein expression levels in LUSC, we chose a more robust Wilcoxon rank sum test.Statistical significance was defined as p < 0.05. A fixed-effects model was used to calculate the SMD when heterogeneity was low (I² < 50%); otherwise, a random-effects model was employed. The “pROC” package was used to plot Receiver Operating Characteristic (ROC) curves, and STATA 18.0 was used to plot summary ROC (SROC) curves. The AUC served as an indicator of HOXC6 expression levels, with higher AUC values indicating higher expression levels. Additionally, Begg's test was used to evaluate publication bias, with p > 0.05 indicating no significant publication bias.
Results
The key part of the entire analysis process flow is shown in Figure 1.
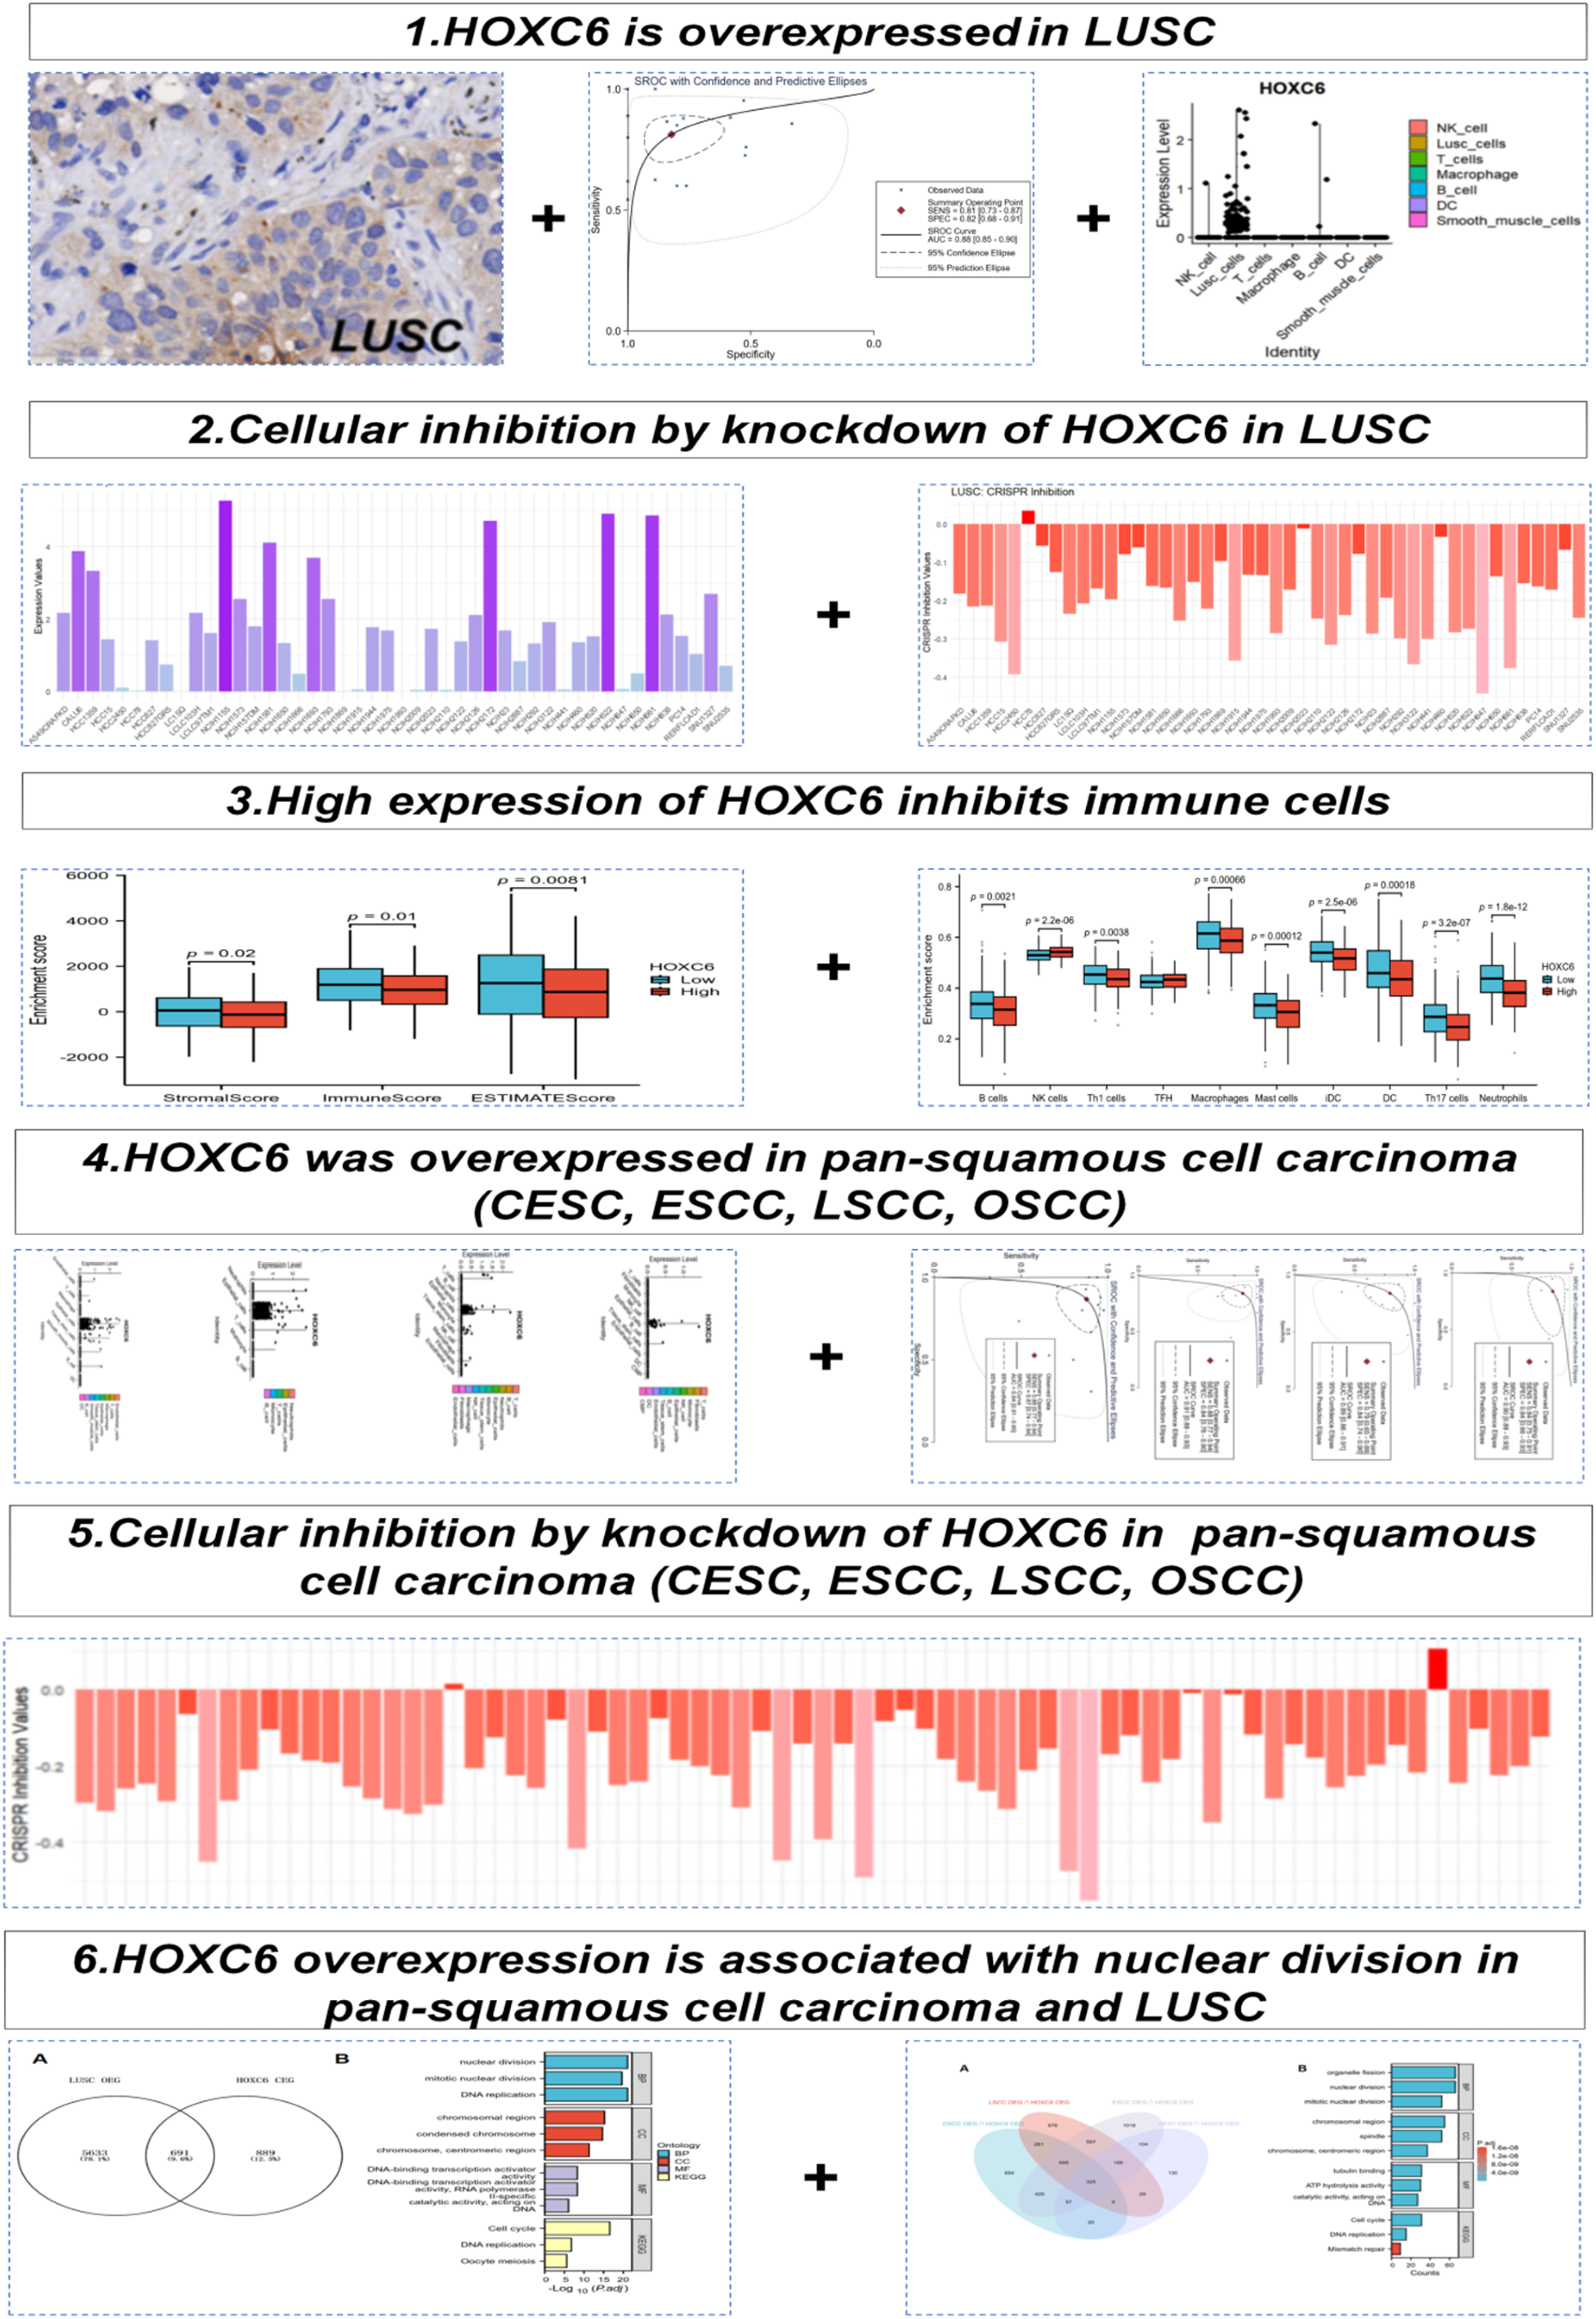
Flowchart o f HOXC6 expression.
High expression of HOXC6 in LUSC
The t-SNE plot demonstrated the clustering of various cell types, including NK cells (pink), squamous cells (Lusc_cells, brown), T cells (green), macrophages (olive), B cells (blue), dendritic cells (purple), and smooth muscle cells (light purple); here, Lusc_cells represent tumor cells with squamous epithelial characteristics (Figure 2A). We labeled the LUSC single-cell sequencing data using four genes—KRT5, KRT14, TP63, and CD274—and found that these genes were predominantly enriched in Lusc_cells (Figure 2B). Additionally, HOXC6 exhibited high expression in Lusc_cells (Figure 2C). Combining multicenter data incorporated from Bulk (Table 1) for mRNA-level analysis, we found that HOXC6 is highly expressed in LUSC (SMD = 1.17, 95% CI: 0.75–1.59, Figure 3A). Publication bias analysis using Begg's test showed P = 0.371, indicating no publication bias (Figure 3B). The AUC of the SROC curve was 0.88, demonstrating excellent predictive ability (Figures 3C and 3D). Furthermore, immunohistochemical staining performed on hospital specimens revealed no obvious staining of HOXC6 in non-LUSC tissues (Figure 4A), whereas significantly enriched cytoplasmic staining was observed in LUSC tissues (Figure 4B). Statistical analysis showed that the high expression of HOXC6 in LUSC tissues was significant (P = 1.6e-10, Figure 4C), with the ROC AUC reaching 0.99, further confirming its excellent predictive performance (Figure 4D).
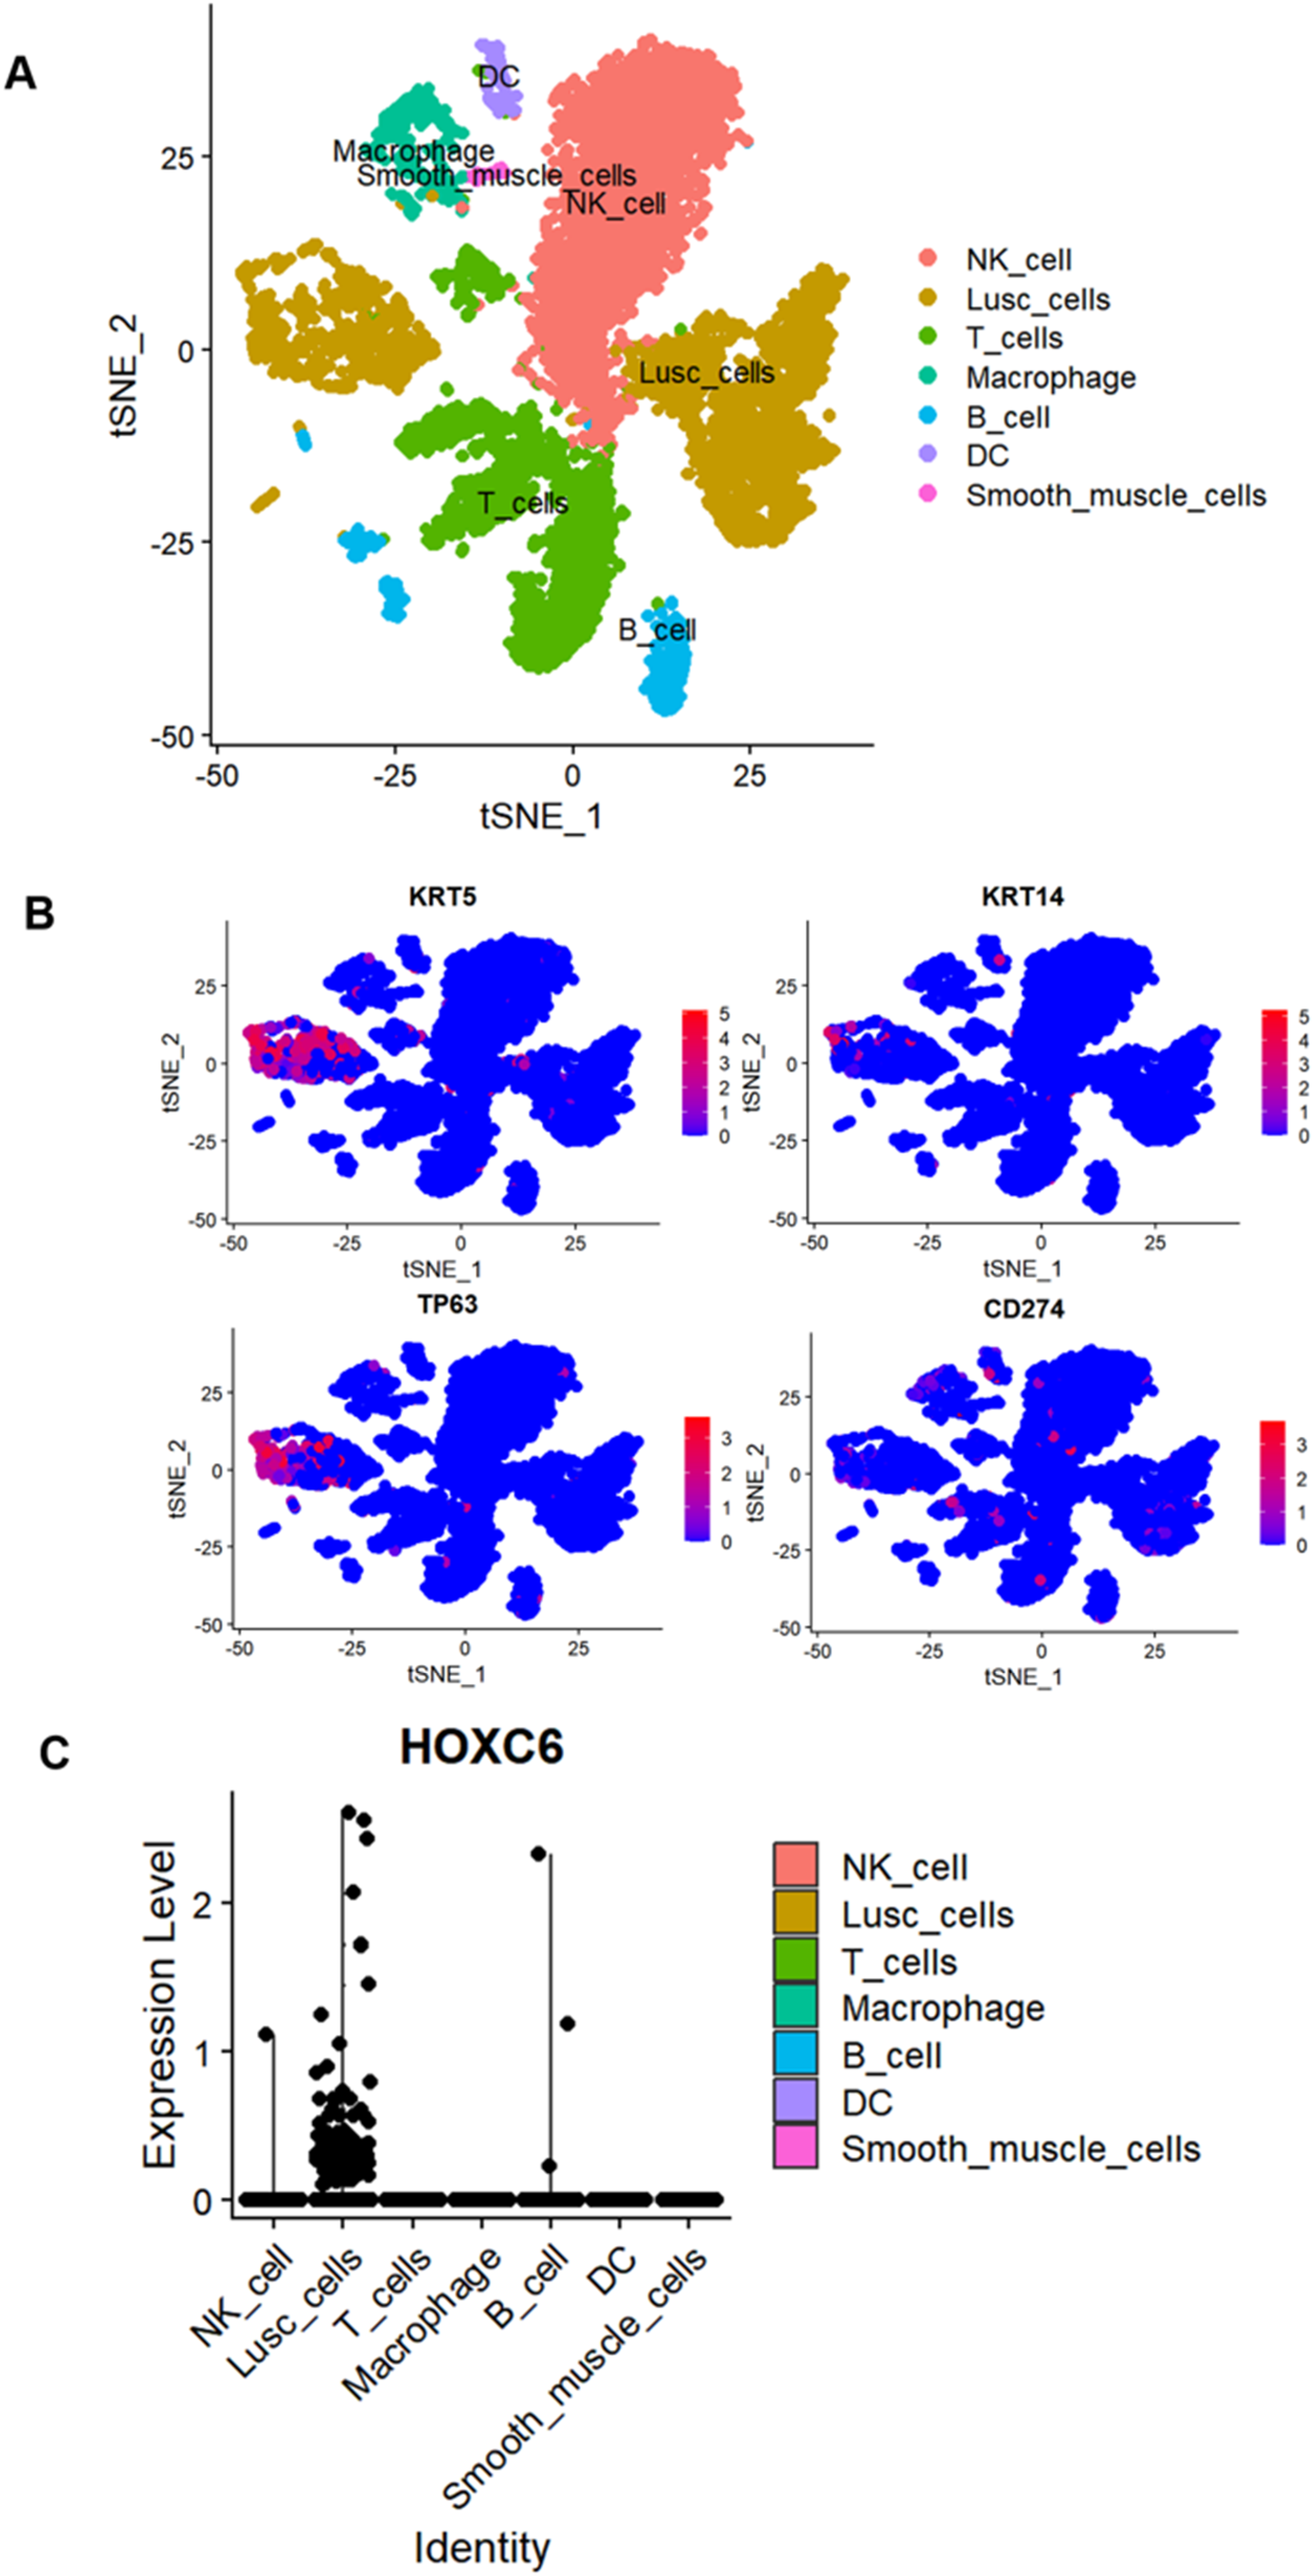
High expression of HOXC6 in LUSC cells. (A) Clustering plot of LUSC cells. (B) LUSC cells labeled with the genes KRT5, KRT14, TP63, and CD274. (C)Expression map of HOXC6 across individual cells.
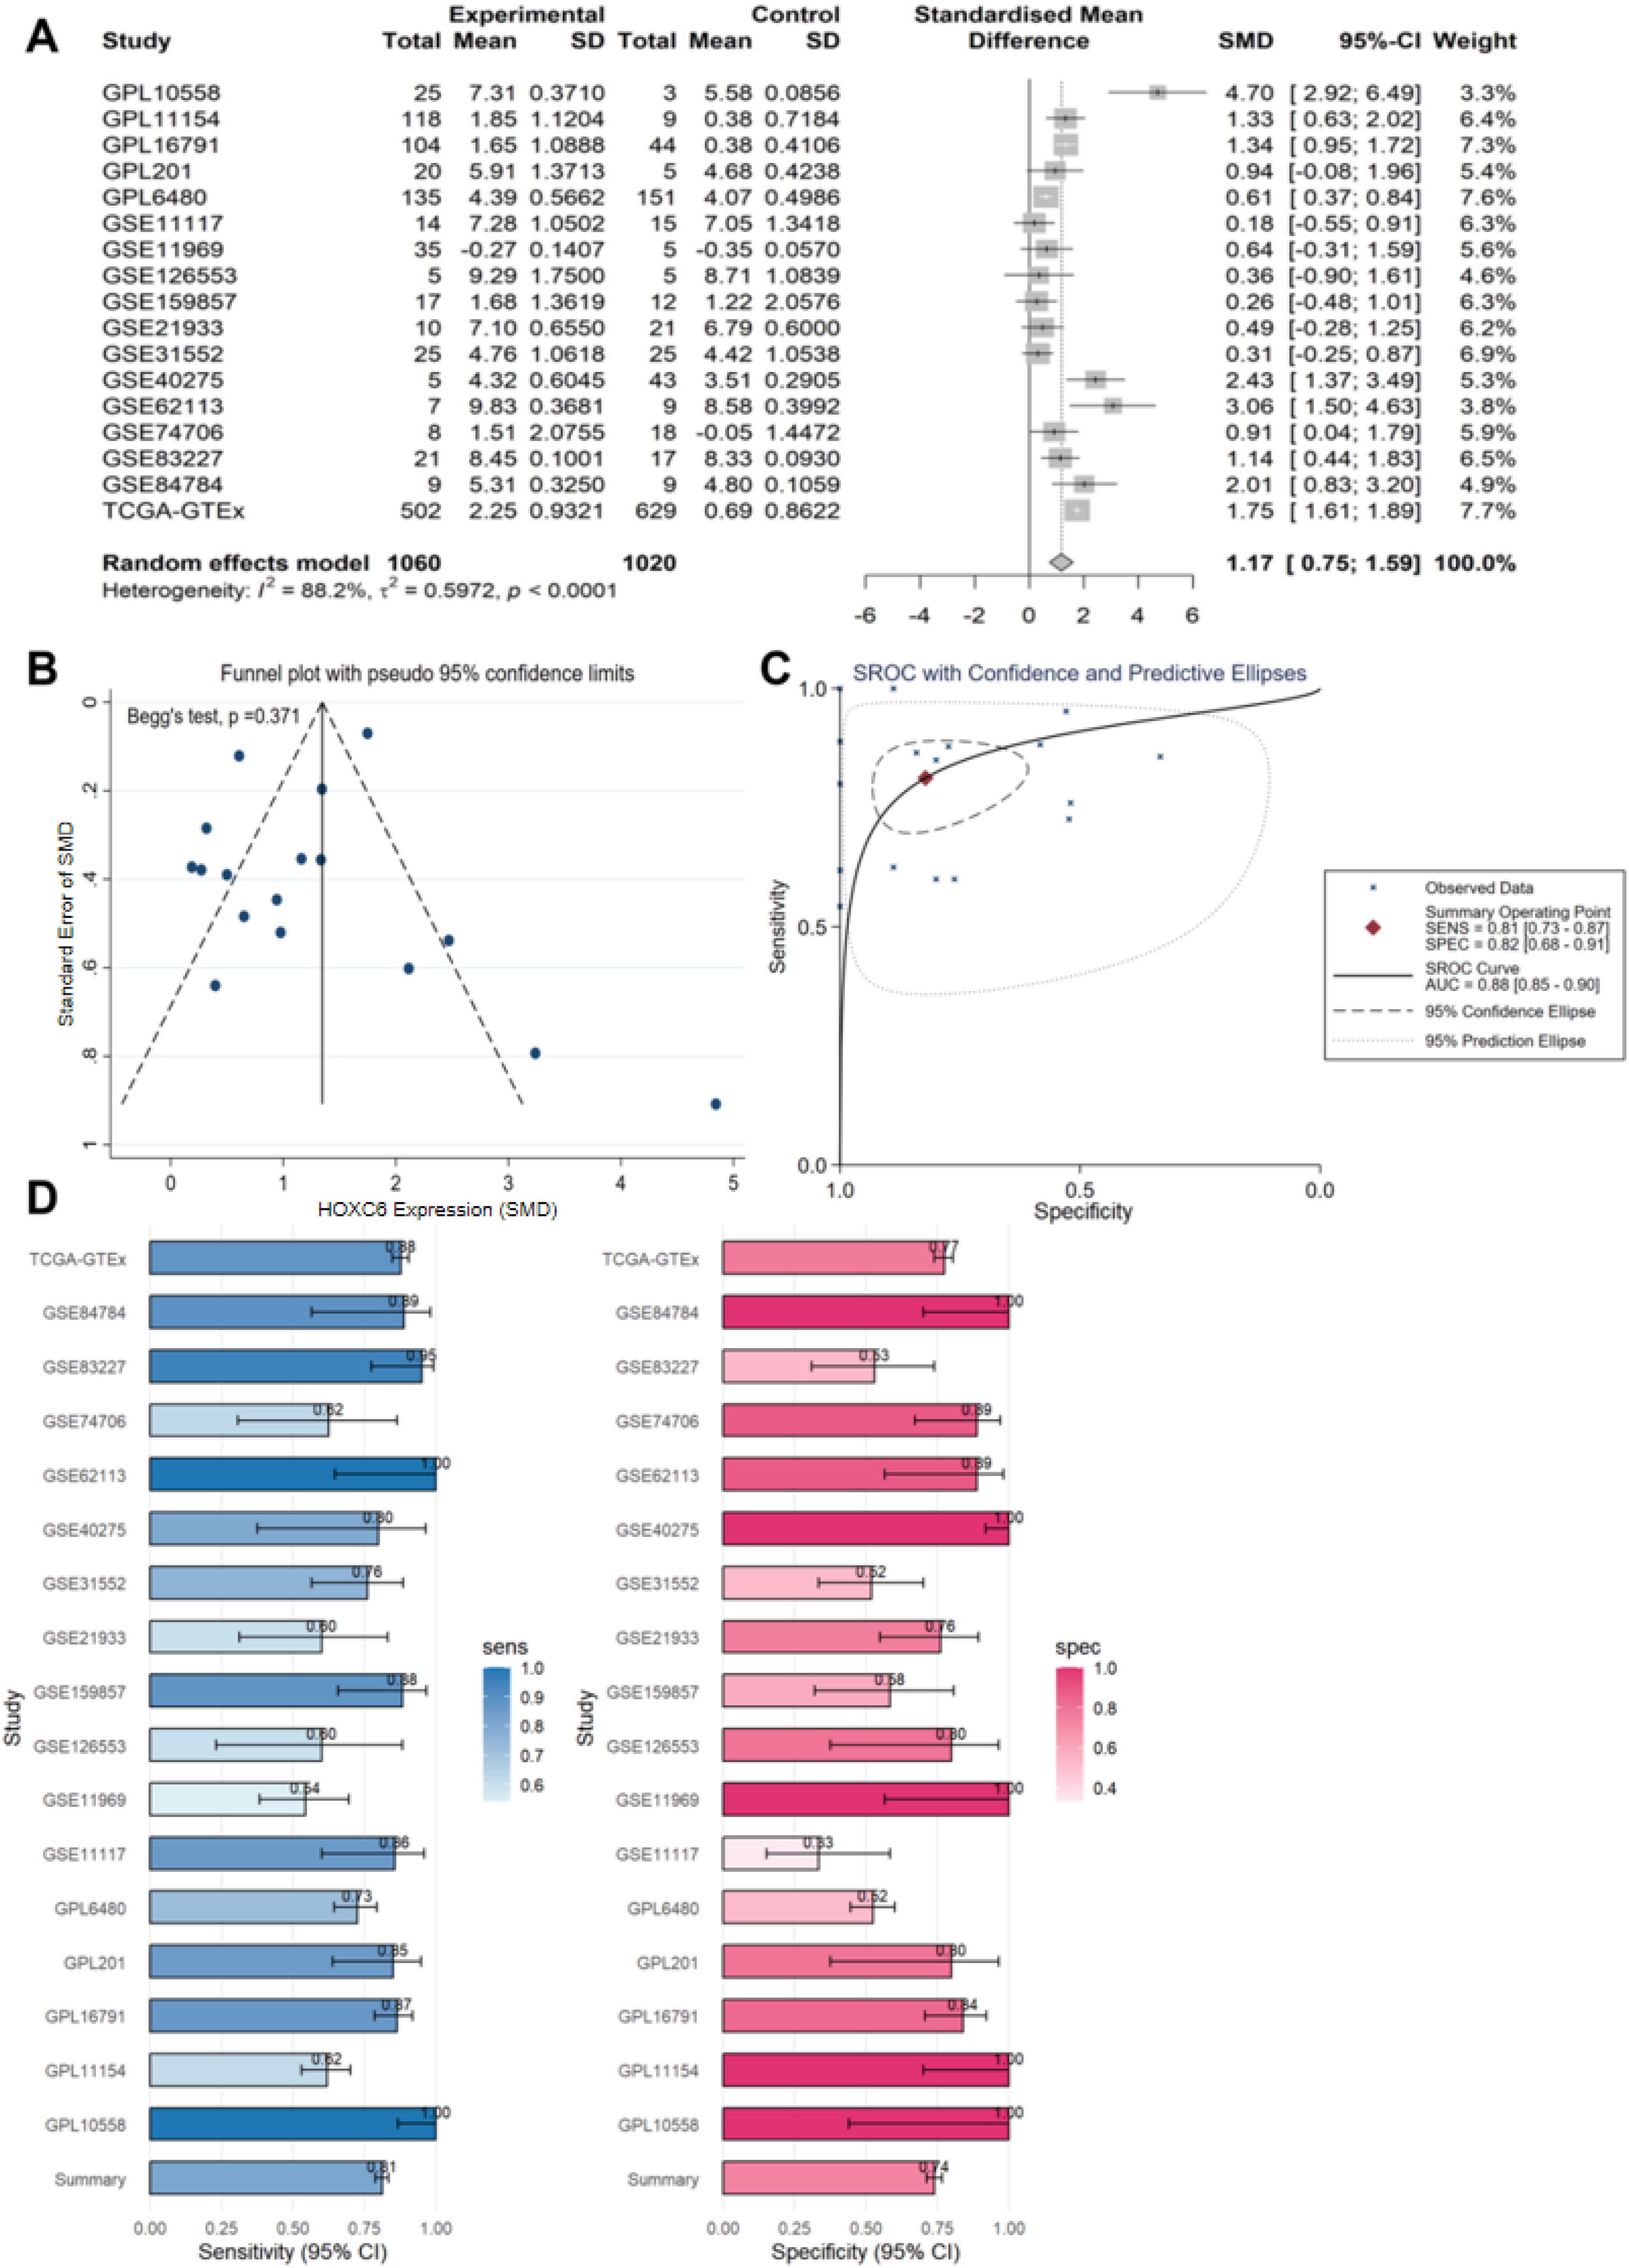
Elevated mRNA expression of HOXC6 in LUSC. (A) Data from experimental (1060 cancerous cases) and control (1020 non-cancerous controls) groups across studies, showing the SMD with its 95% confidence interval. (B) Funnel plot demonstrating data bias and precision. (C) SROC curve with confidence intervals and prediction ellipses. (D) 95% confidence intervals for sensitivity and specificity from each study.
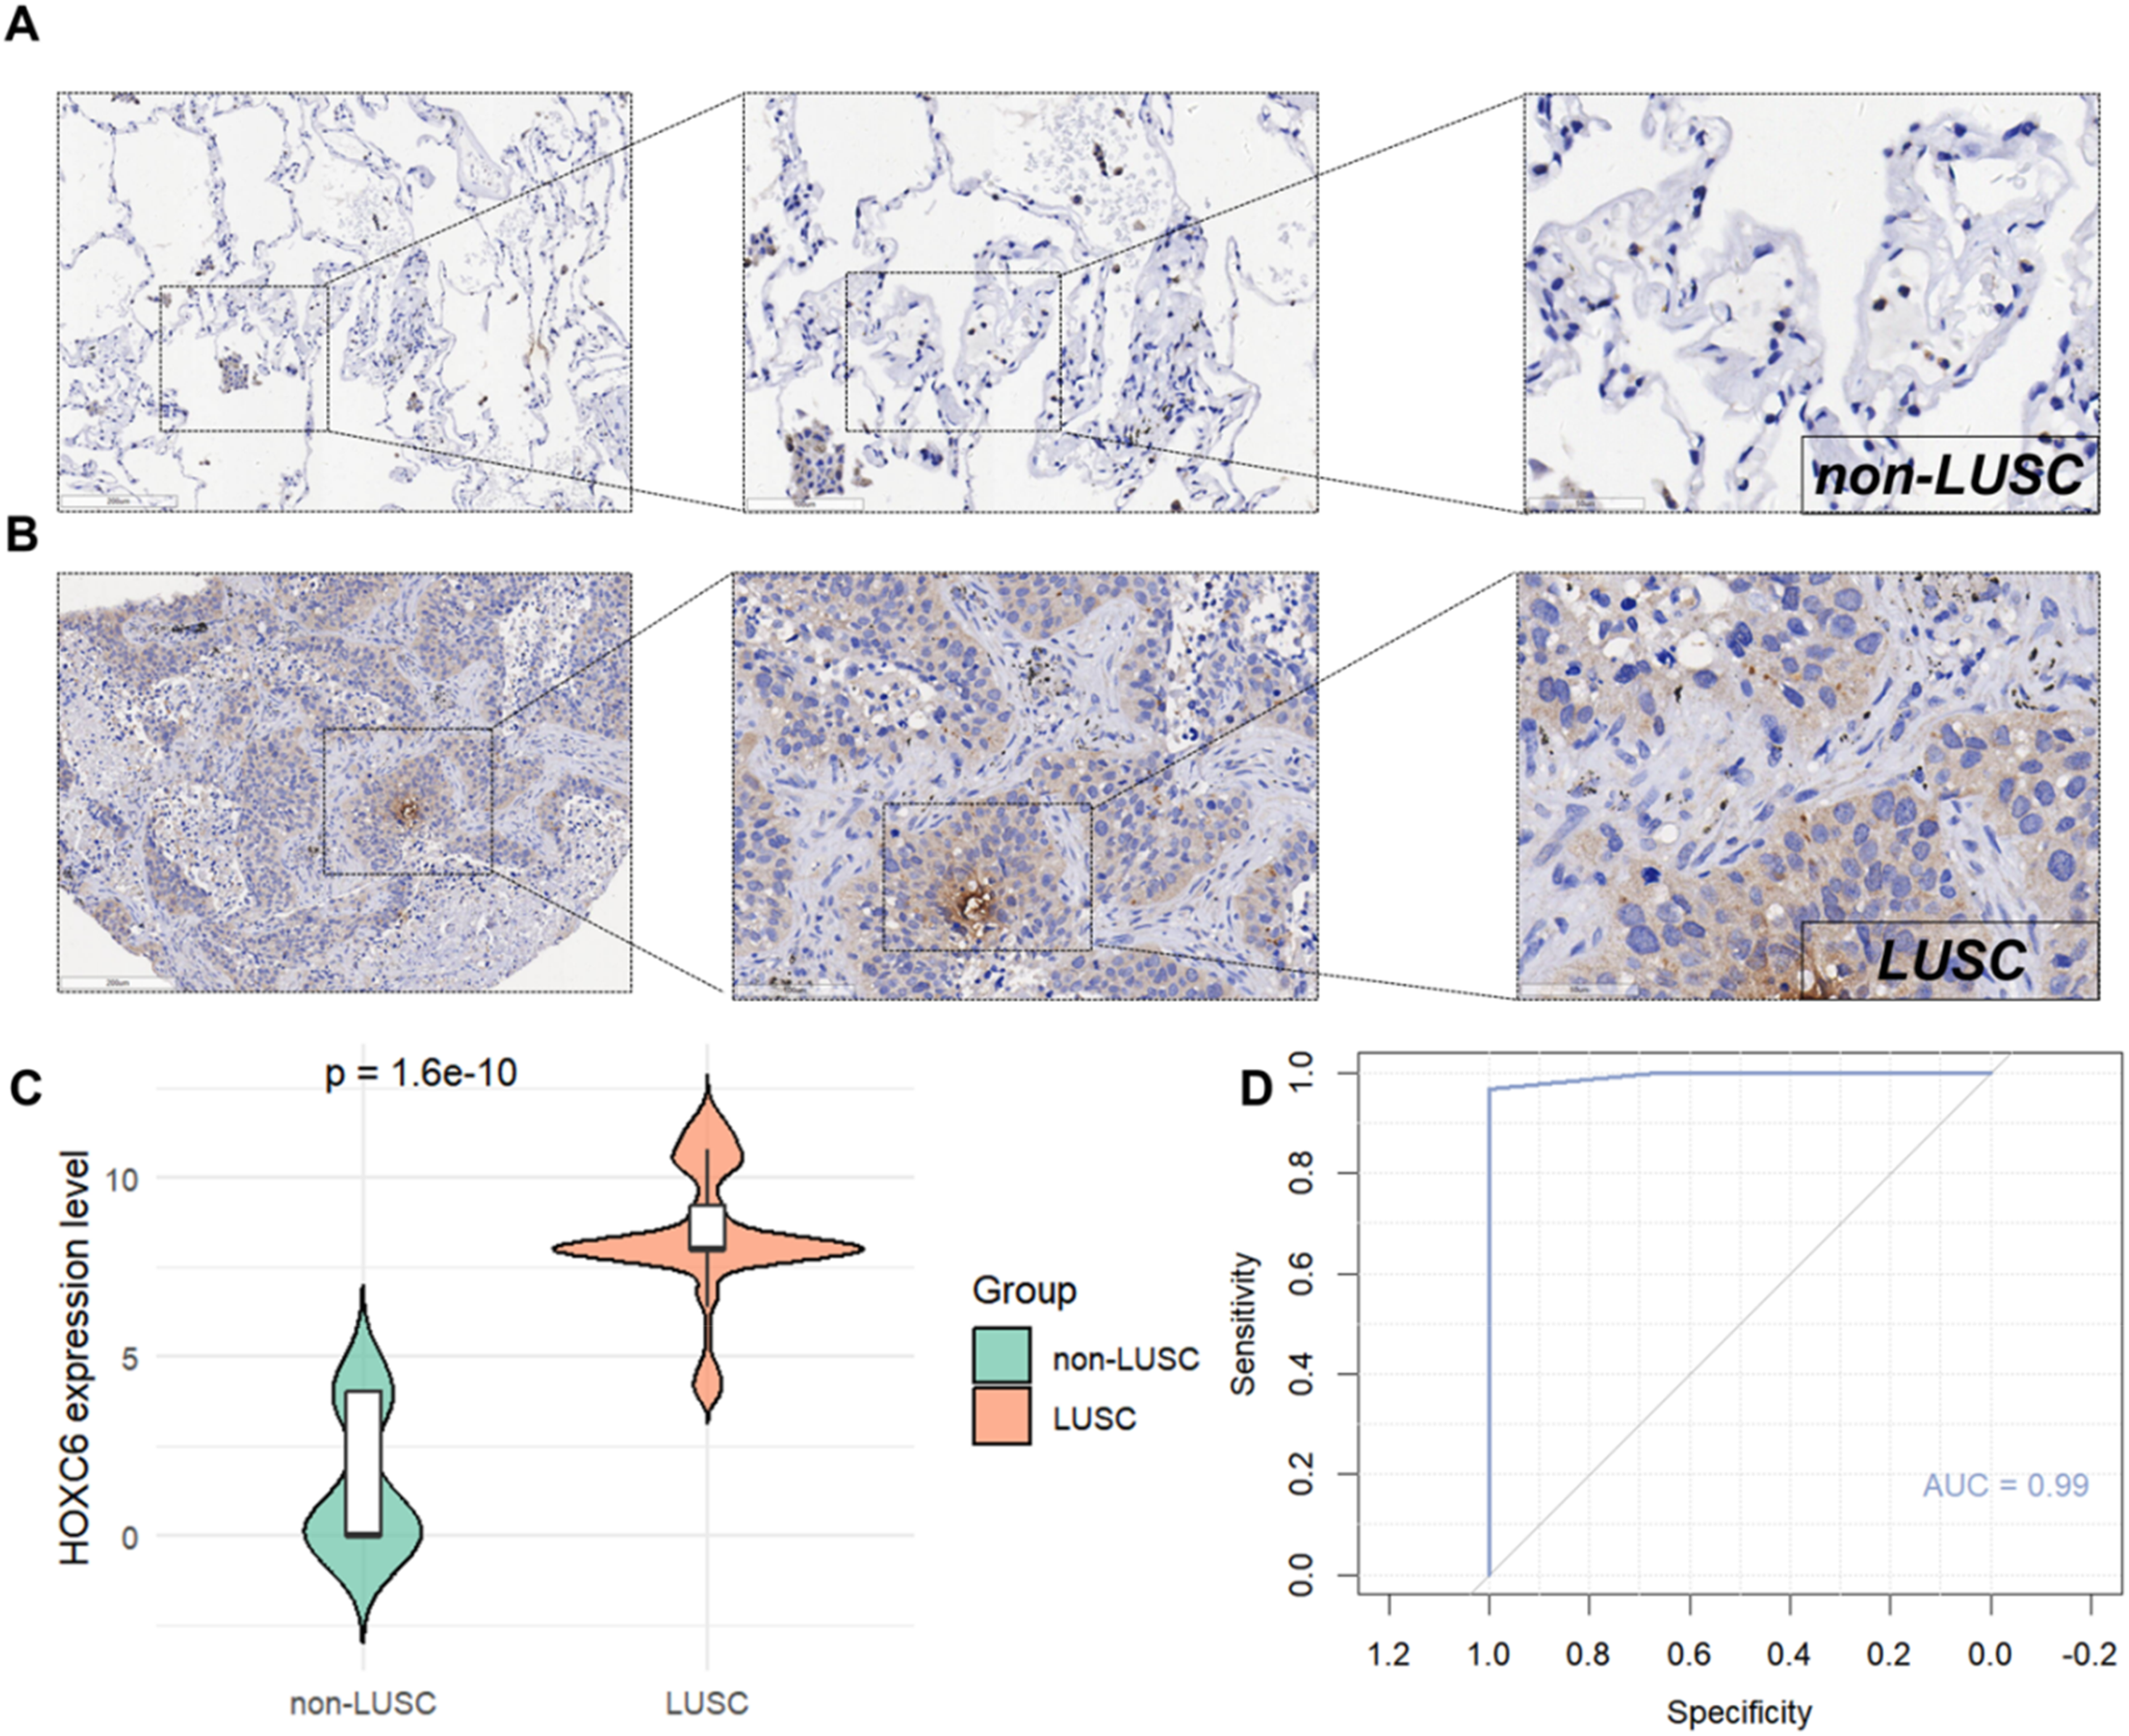
High expression of HOXC6 in LUSC as revealed by IHC experiments. (A) IHC staining of non-LUSC tissues (n = 15; left: 200 μm magnification; right: 50 μm magnification). (B) IHC staining of LUSC tissues (n = 127; left: 200 μm magnification; right: 50 μm magnification). (C) Comparison of HOXC6 expression levels between non-LUSC (n = 15) and LUSC (n = 127) groups, analyzed using the Wilcoxon rank-sum test. (D) ROC curve displaying the predictive potential of HOXC6 in LUSC, based on 127 LUSC tissues and 15 non-LUSC tissues.
Effect of HOXC6 knockdown on LUSC cell growth
In LUSC cell lines, HOXC6 exhibited relatively high expression levels, particularly in cell lines such as NCI-H157, NCI-H522, and NCI-H661, while its expression in some cell lines was low or nearly undetectable (Figure 5A). CRISPR analysis results demonstrated that knocking down HOXC6 significantly inhibited the growth of these high-expression cell lines (e.g., NCI-H157, NCI-H522, NCI-H661), suggesting that HOXC6 may play a key role in maintaining cell viability in these cells (Figure 5B).
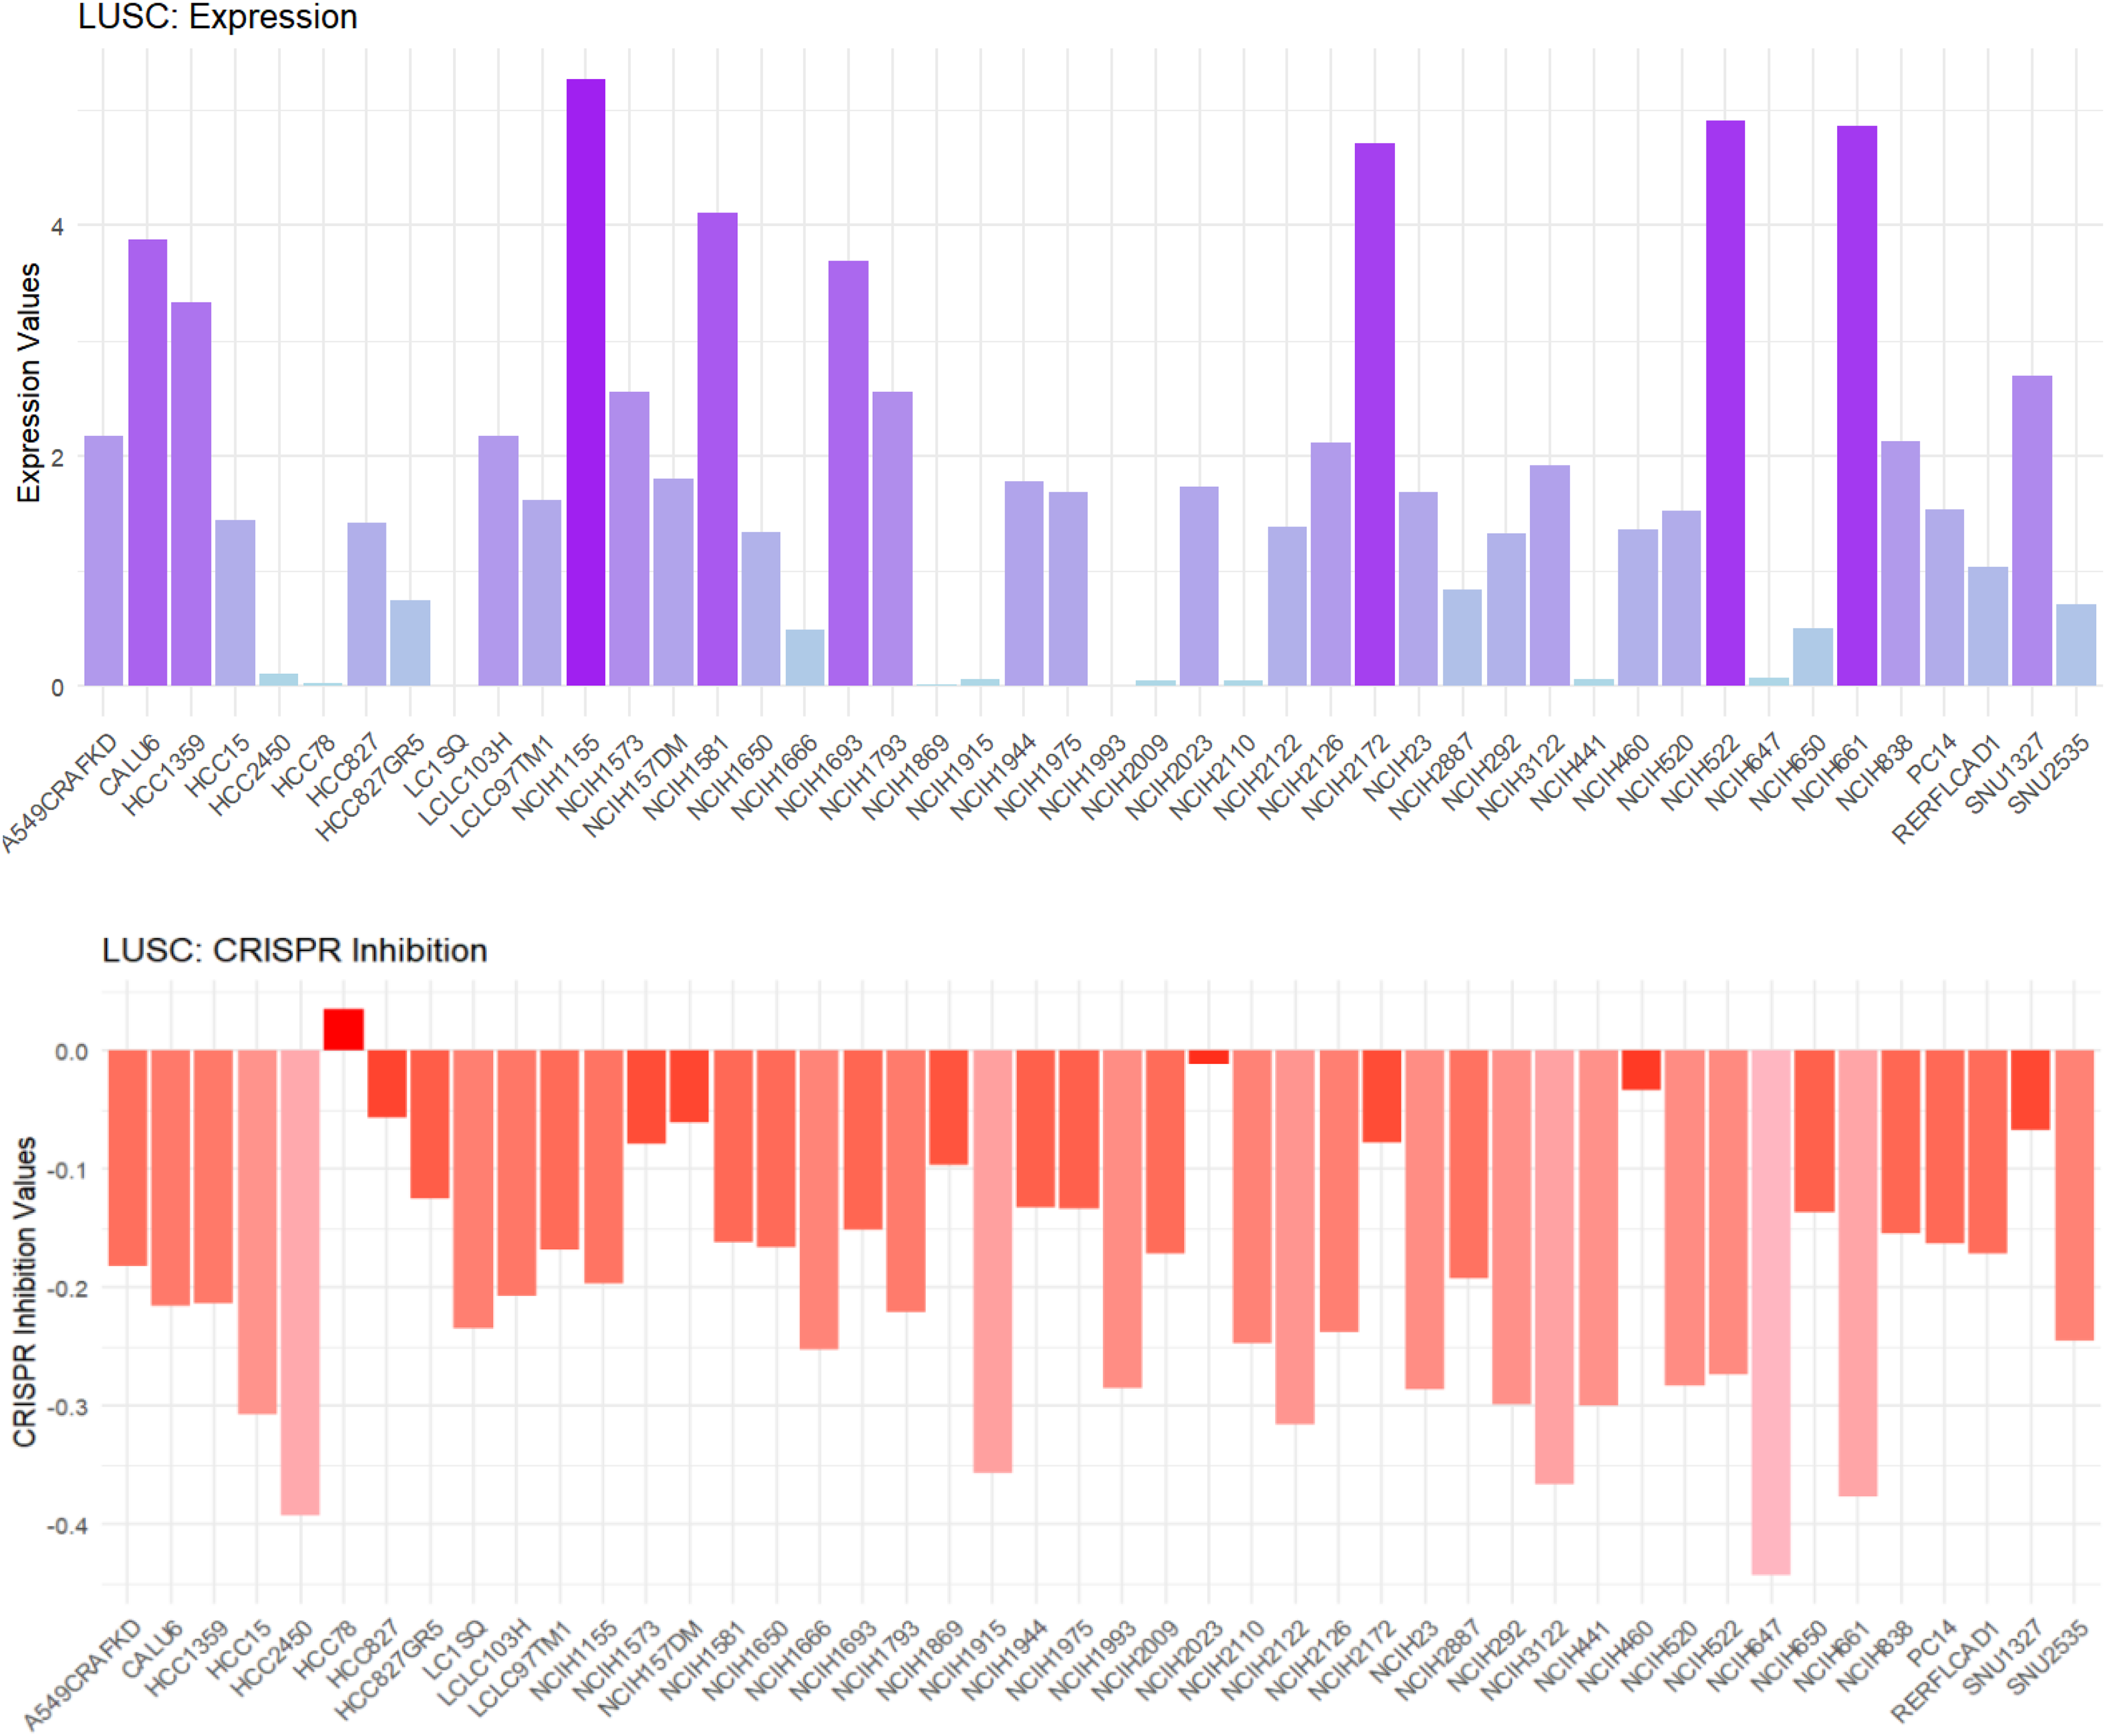
Silencing HOXC6 suppresses growth in LUSC-related cells. Upper section: Expression levels of HOXC6 in different cell lines (bar height indicates expression level). Lower section: Impact of CRISPR-mediated inhibition on HOXC6 (bar height indicates the strength of the inhibition effect).
Association between high HOXC6 expression and immune cell infiltration in LUSC
The ssGSEA method was used to assess the infiltration levels of various immune cells. Results indicated that high HOXC6 expression was significantly negatively correlated with the infiltration of B cells, Th1 cells, macrophages, mast cells, dendritic cells (DC), immature dendritic cells (iDC), Th17 cells, and neutrophils—that is, when HOXC6 expression was high, the enrichment scores for these immune cells were reduced (Figure 6A). Further analysis using the ESTIMATE method compared the StromalScore, ImmuneScore, and ESTIMATE score across different HOXC6 expression levels (Figure 6B). These scores were negatively correlated with HOXC6, with the high-expression group exhibiting significantly lower scores, suggesting that HOXC6 may exert its effects by inhibiting immune activity within the tumor microenvironment (Figure 6C).The Wilcoxon rank - sum test was used to analyze the enrichment scores of HOXC6 in different immune cell types, including B cells, NK cells, Th1 cells, TFH cells, macrophages, mast cells, iDC, DC, Th17 cells, and neutrophils. The results showed that there were significant statistical differences in the enrichment scores of these immune cells between the high HOXC6 expression group and the low HOXC6 expression group (for example, p = 0.0021 for B cells, p = 2.2e – 06 for NK cells, etc., and most of the p – values were less than 0.05) (Figure 6D).
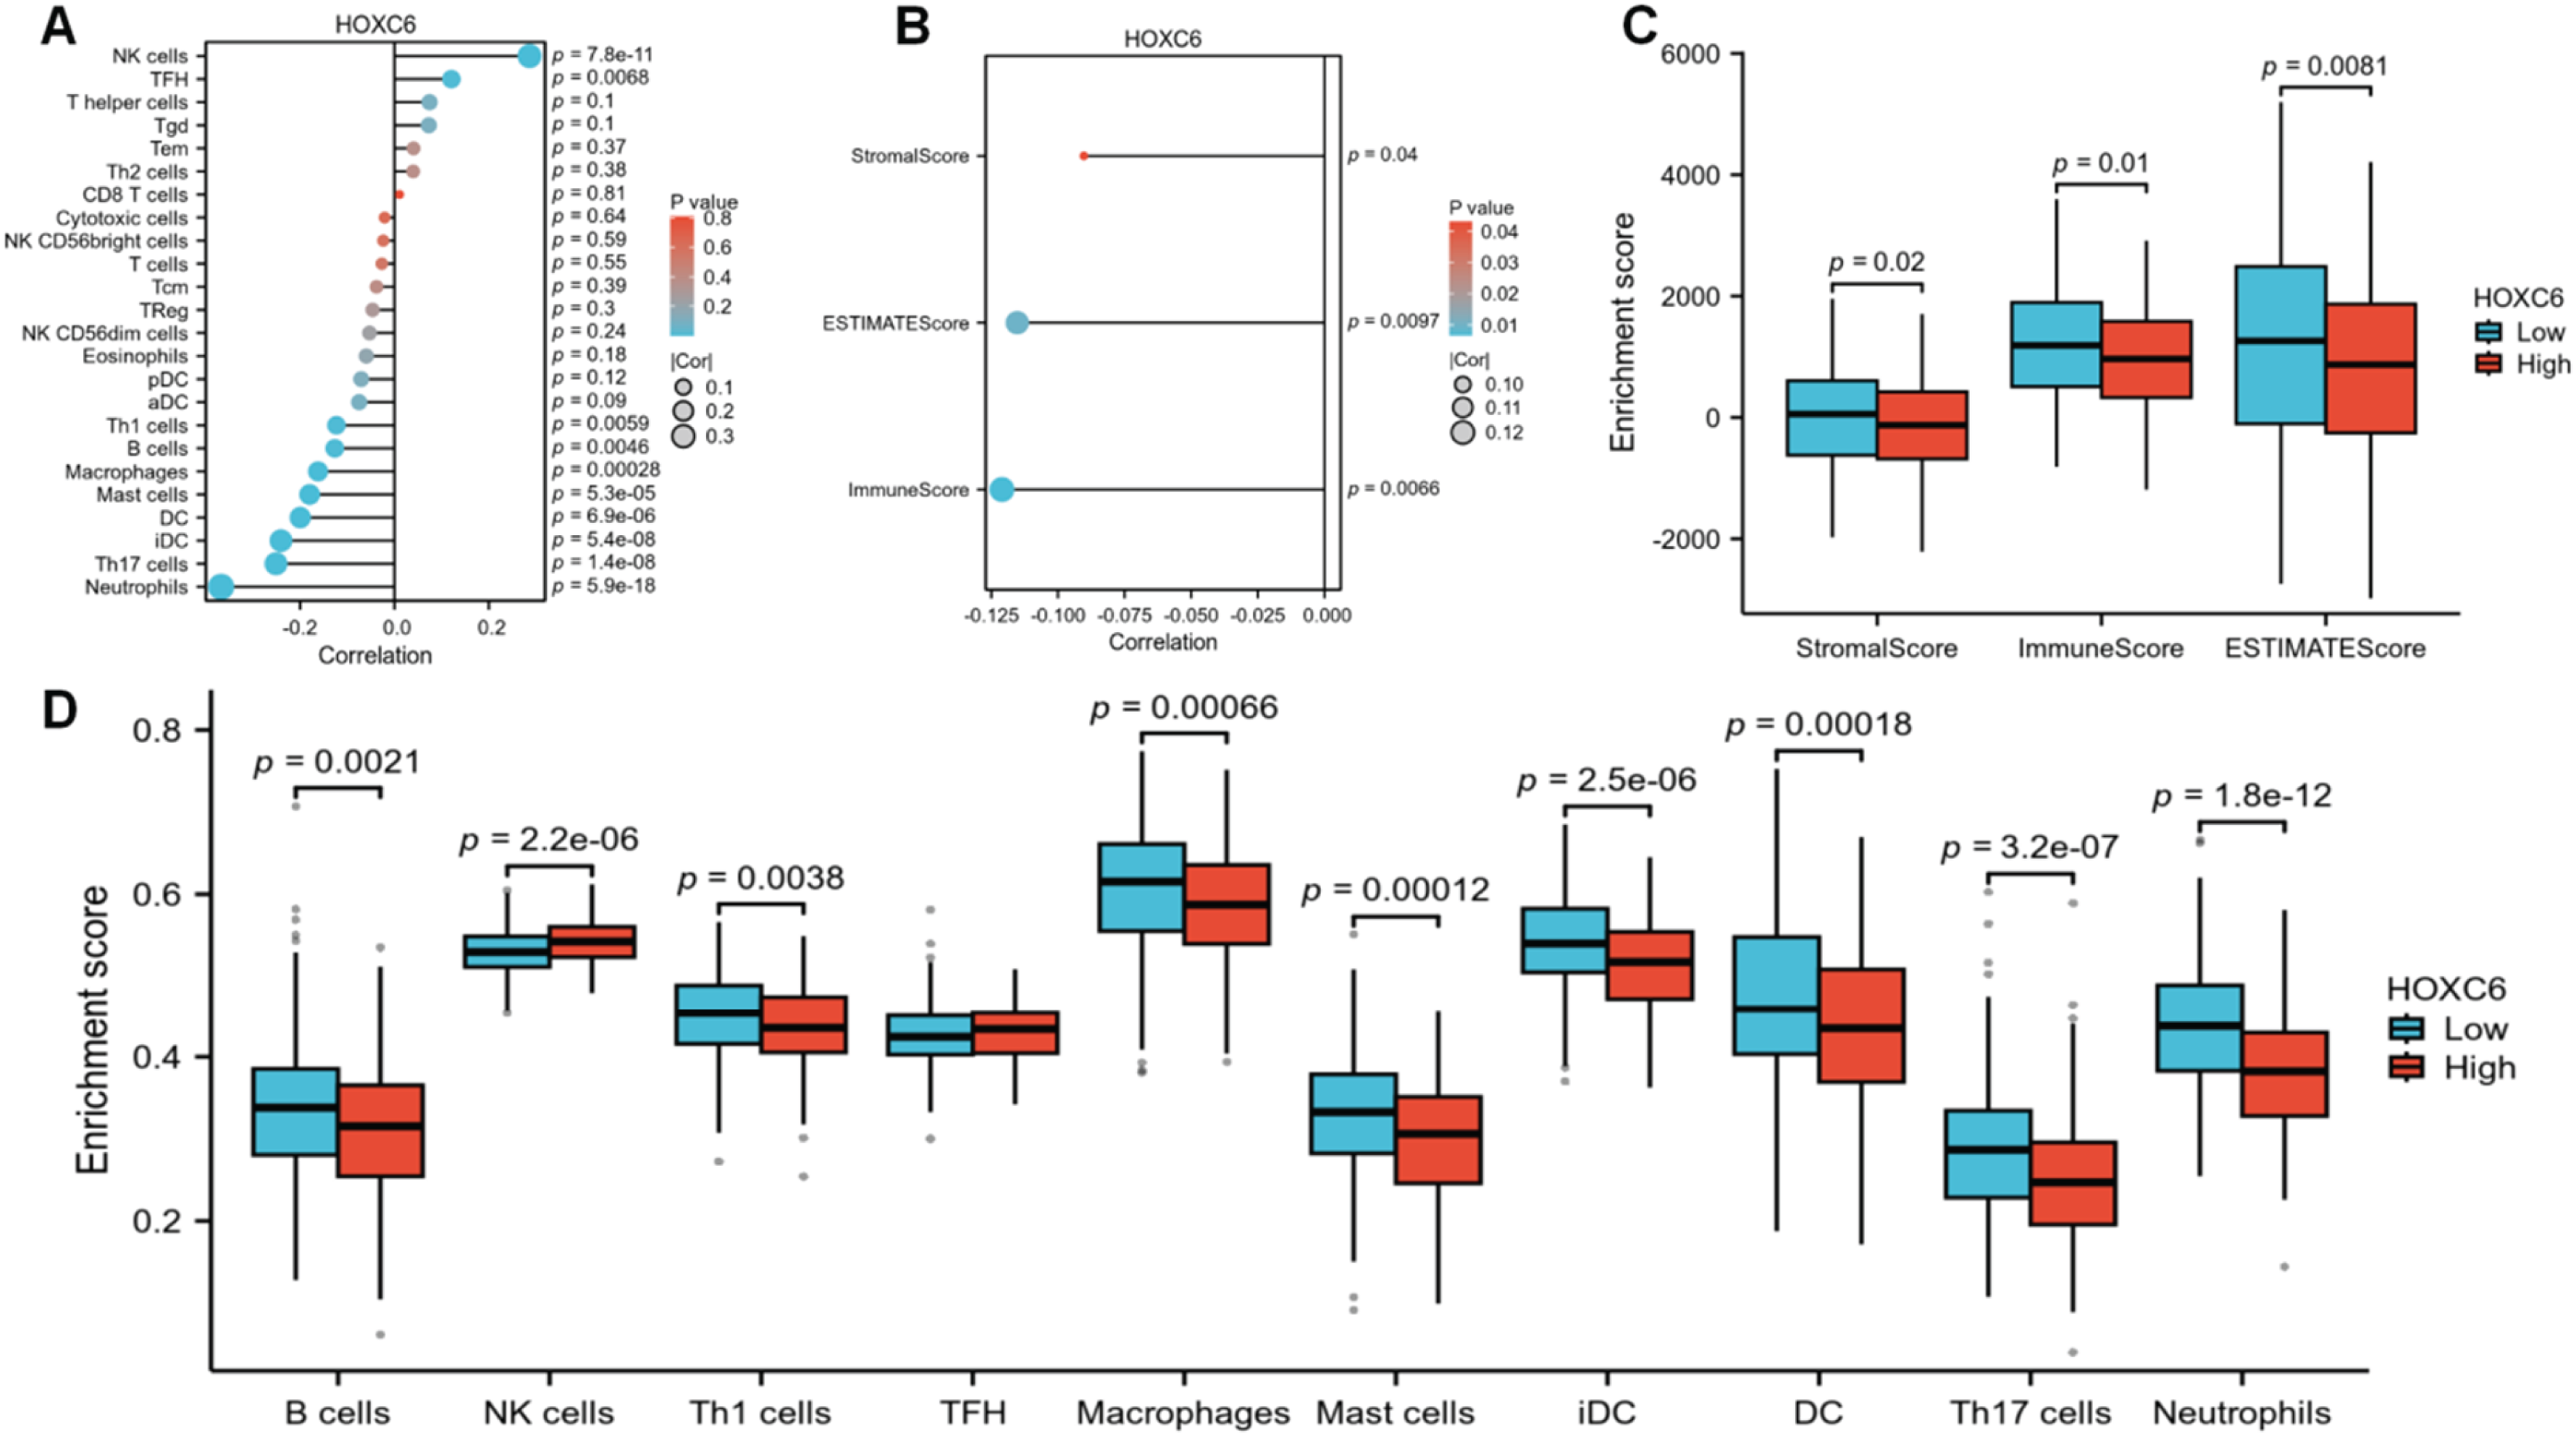
High HOXC6 expression suppresses immune cell enrichment scores. (A) Correlation between HOXC6 and various immune cell populations, assessed using Spearman correlation analysis. (B) Correlation between HOXC6 and stromal, immune, and ESTIMATE scores in the tumor microenvironment, assessed using Spearman correlation analysis. (C) Comparison of tumor microenvironment scores between high and low HOXC6 expression groups, analyzed using the Wilcoxon rank-sum test. (D) Enrichment scores of HOXC6 in different immune cell types, analyzed using the Wilcoxon rank-sum test.
High expression of HOXC6 in LUSC is associated with biological processes related to nuclear division
We further performed GO and KEGG analyses after intersecting the 6324 overexpressed genes in LUSC with the 1580 genes co-expressed with HOXC6. The results showed that these intersecting genes were significantly enriched in functions related to nuclear division (Figure 7A). HOXC6 may participate in biological processes such as DNA replication together with these genes; regarding cellular components, these genes are enriched in chromosomal regions, condensed chromosomes, and centromeric regions; in terms of molecular functions, they are associated with DNA-binding transcription activator activity and RNA polymerase II-related catalytic activity (Figure 7B). KEGG pathway analysis indicated that these genes are primarily enriched in pathways such as the cell cycle, DNA replication, and oocyte meiosis. Overall, HOXC6 and its associated genes may play important roles in cell proliferation and gene regulation (Figure 7B).
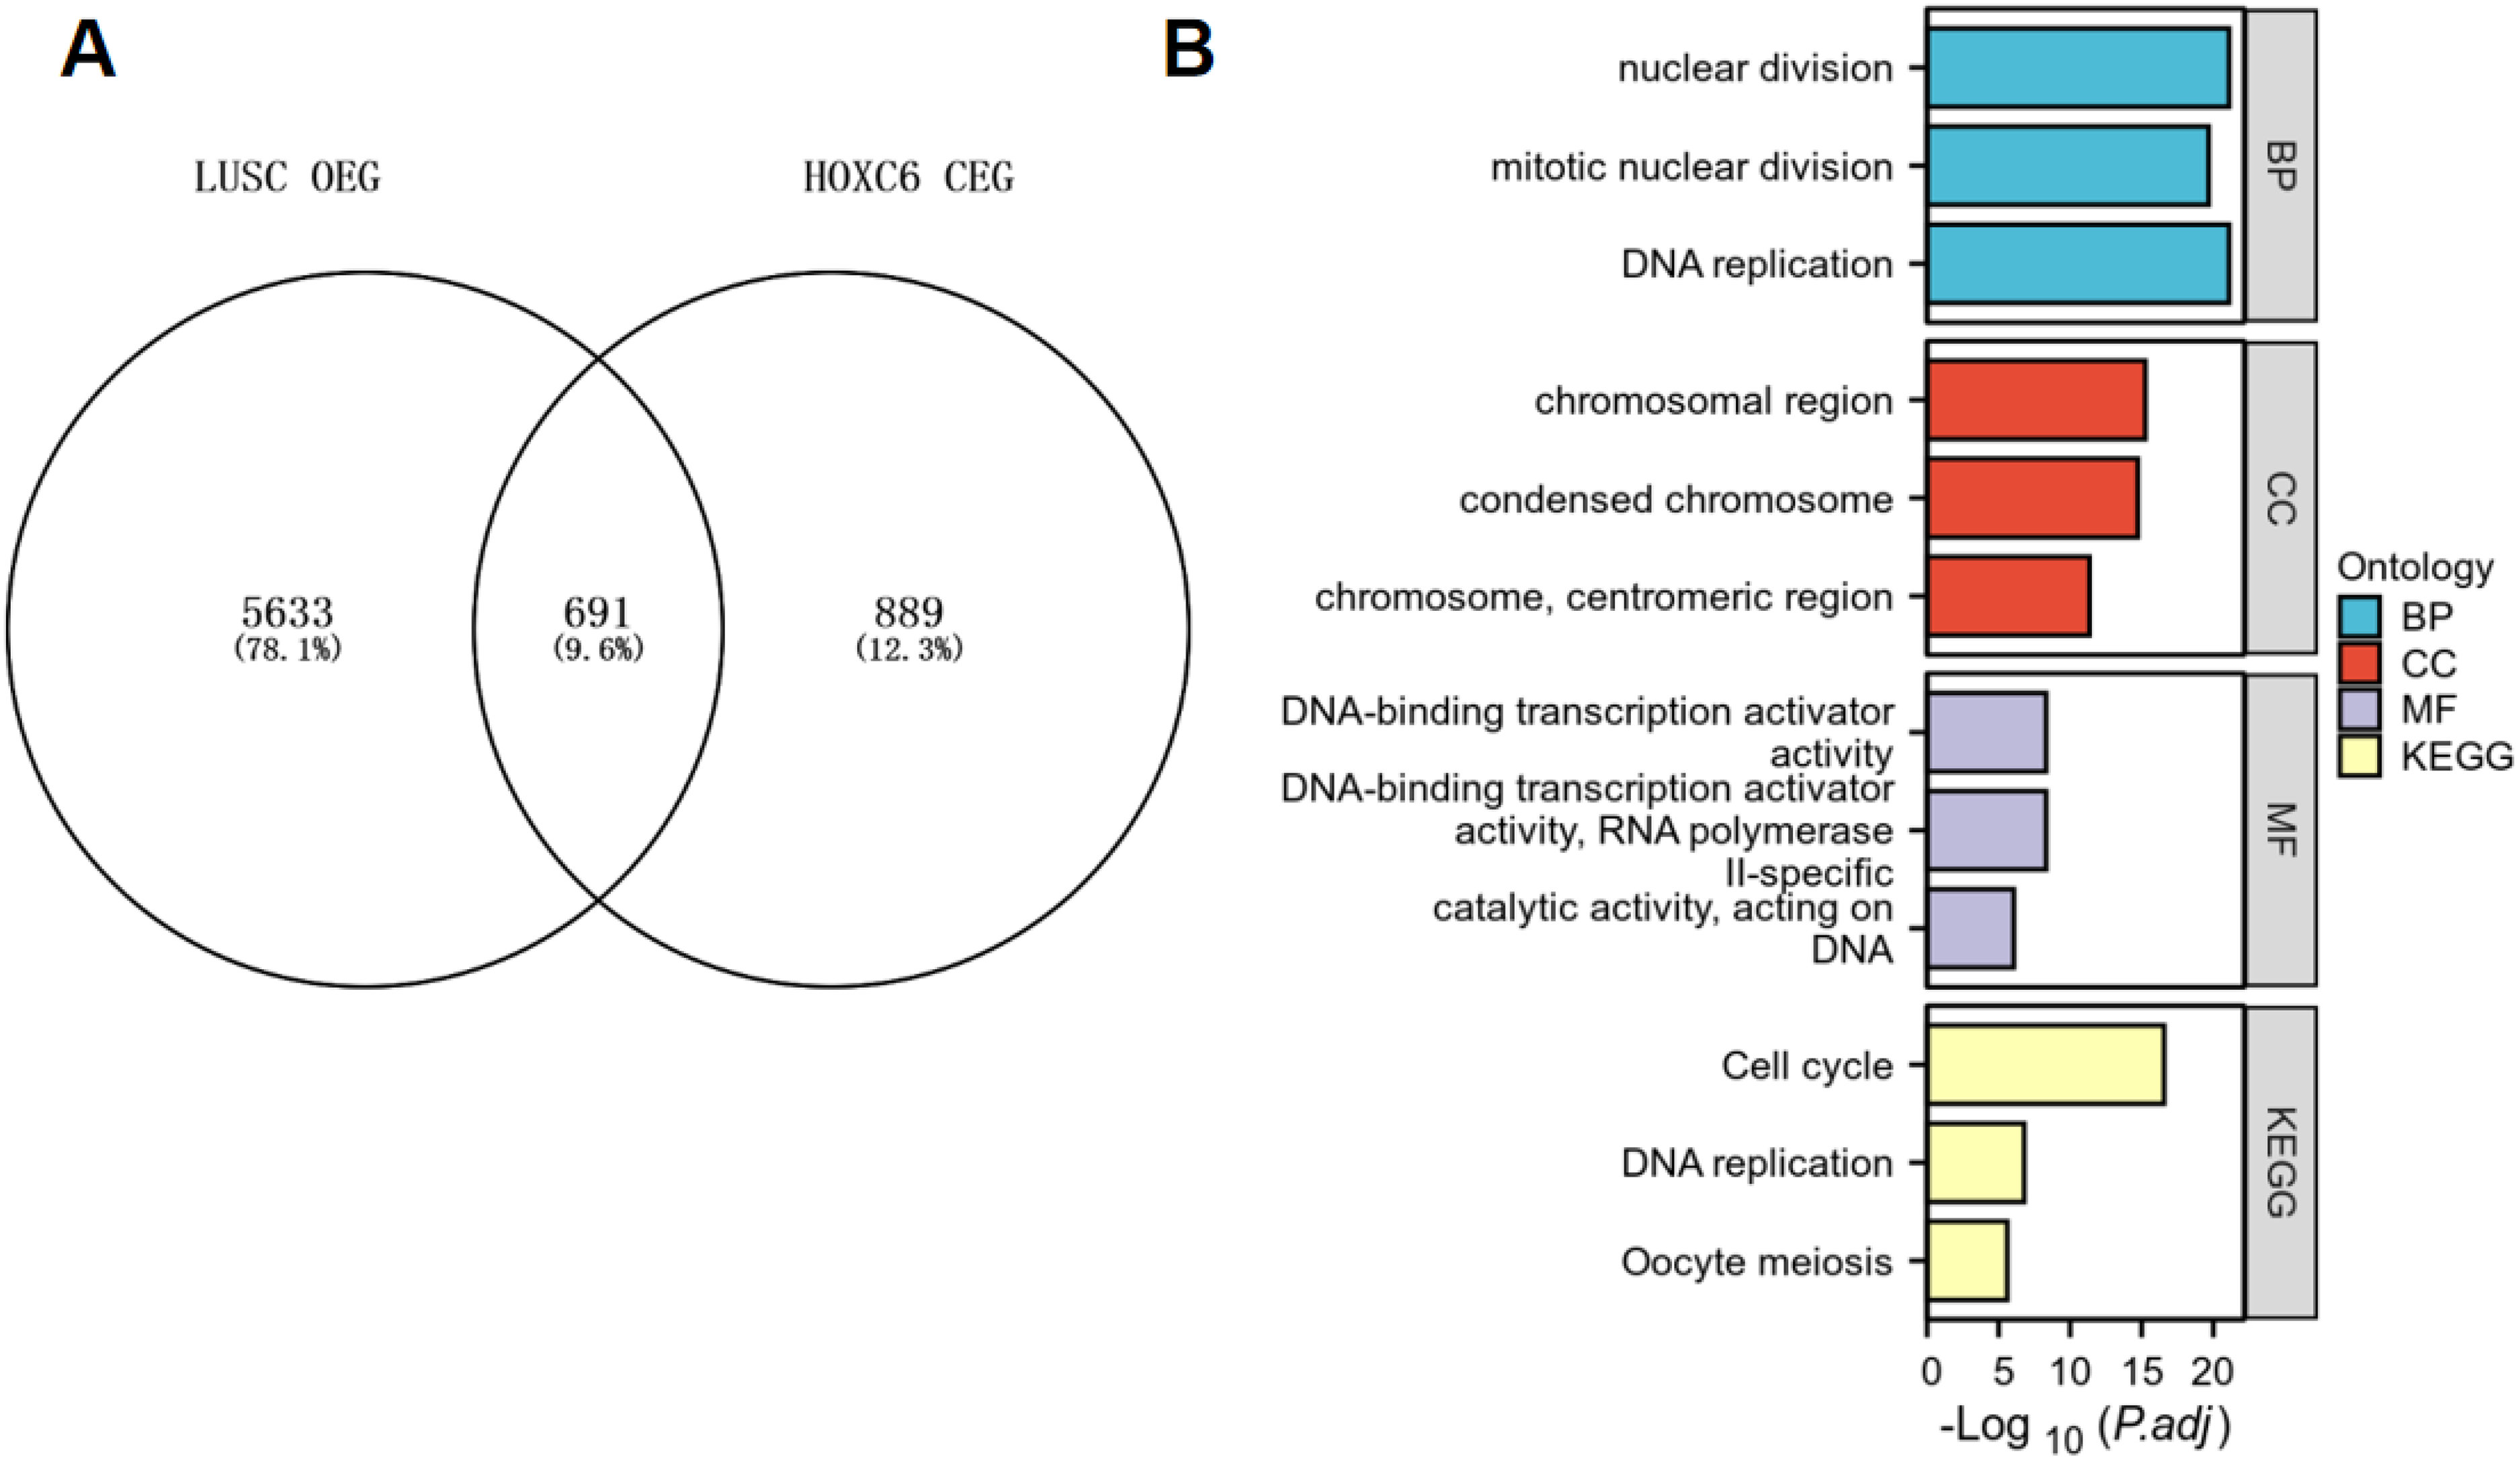
Relationship between overexpressed genes (OEG) in LUSC and HOXC6 Co-expressed genes (CEG). (A) Venn diagram showing the intersection between OEG and CEG. (B) Enrichment analysis of these intersecting genes.
High expression of HOXC6 in Pan-squamous cell carcinoma (CESC, ESCC, LSCC, OSCC)
Studies have shown that HOXC6 is highly expressed at the single-cell level in pan-squamous cell carcinoma (CESC, ESCC, LSCC, OSCC), with predominant localization in epithelial cells (Figure 8). Further analysis revealed that HOXC6 is also significantly overexpressed at the mRNA level in pan-squamous cell carcinoma (CESC, ESCC, LSCC, OSCC) (SMD > 0, SROC > 0.89) (Figure 9). Moreover, following HOXC6 knockout, the proliferation of cells associated with pan-squamous cell carcinoma (CESC, ESCC, LSCC, OSCC) was markedly inhibited (Figure 10). Additionally, the study found that the signal pathways enriched by the overexpressed genes and HOXC6 co-expressed genes in pan-squamous cell carcinoma (CESC, ESCC, LSCC, OSCC) are primarily related to nuclear division functions (Figure 11).
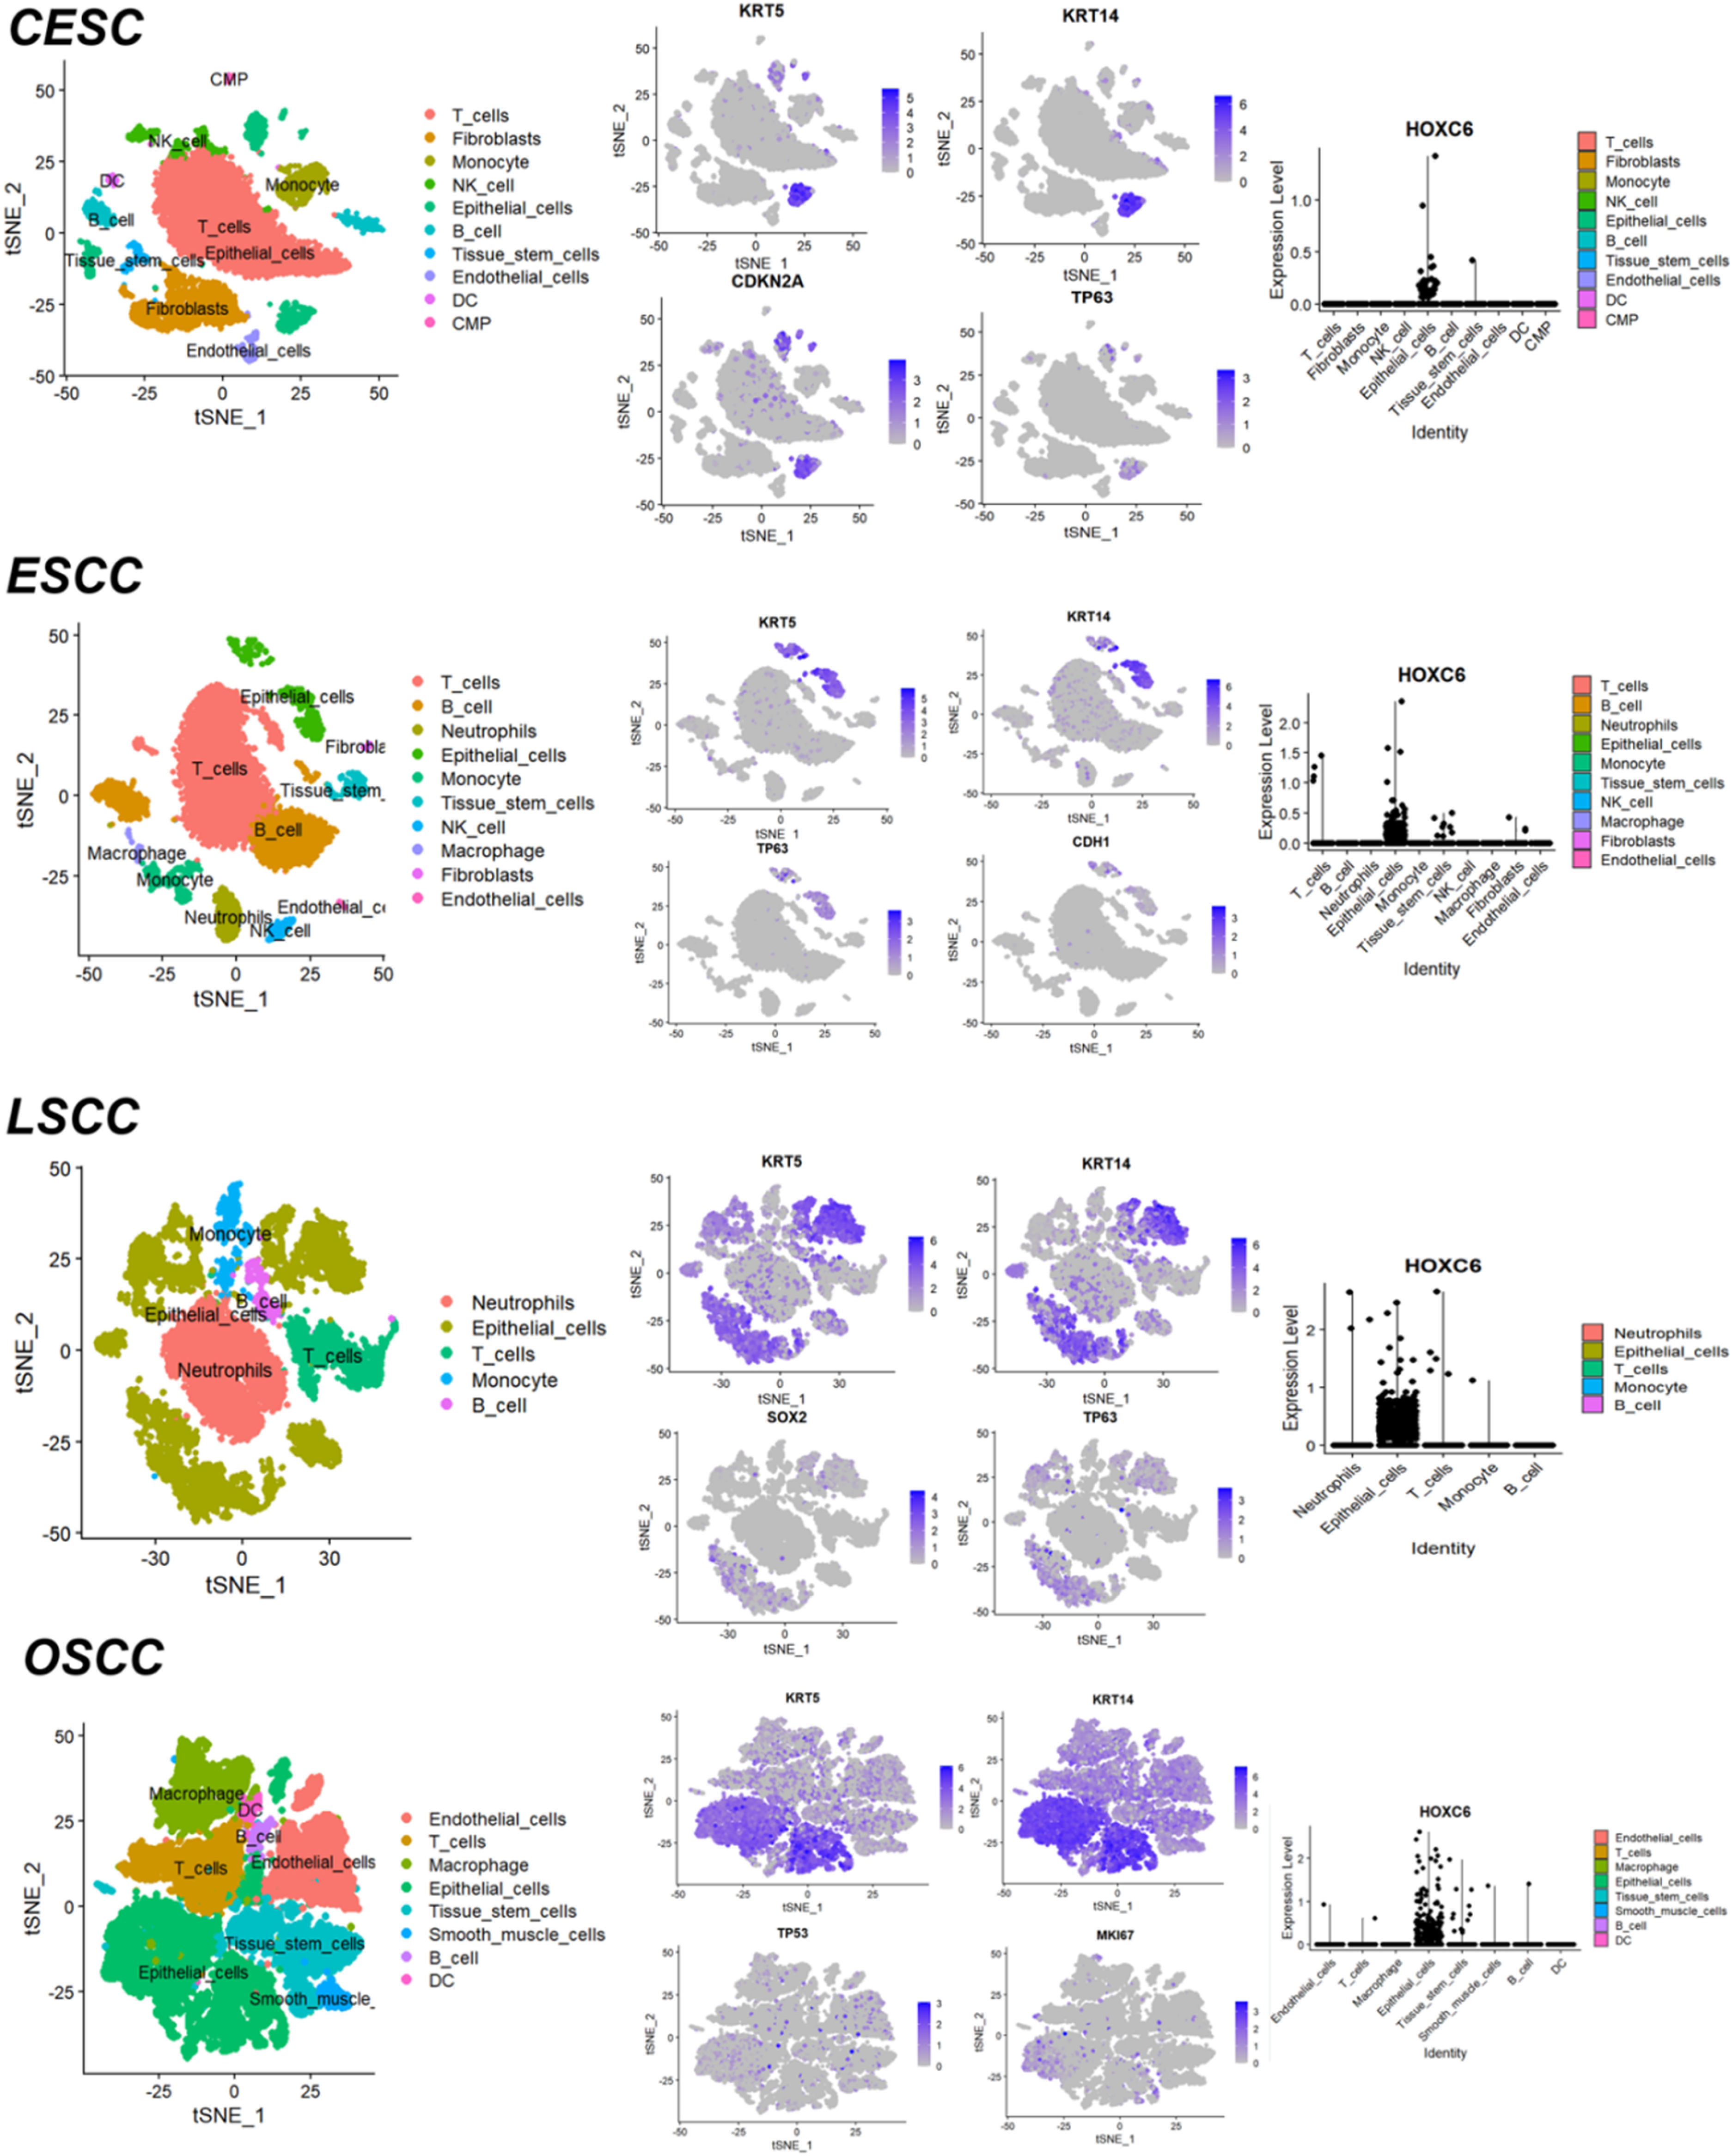
HOXC6 gene shows high expression in CESC, ESCC, LSCC, and OSCC cells. From left to right: cell clustering map, gene-marked cell map, and HOXC6 expression map across different cells.
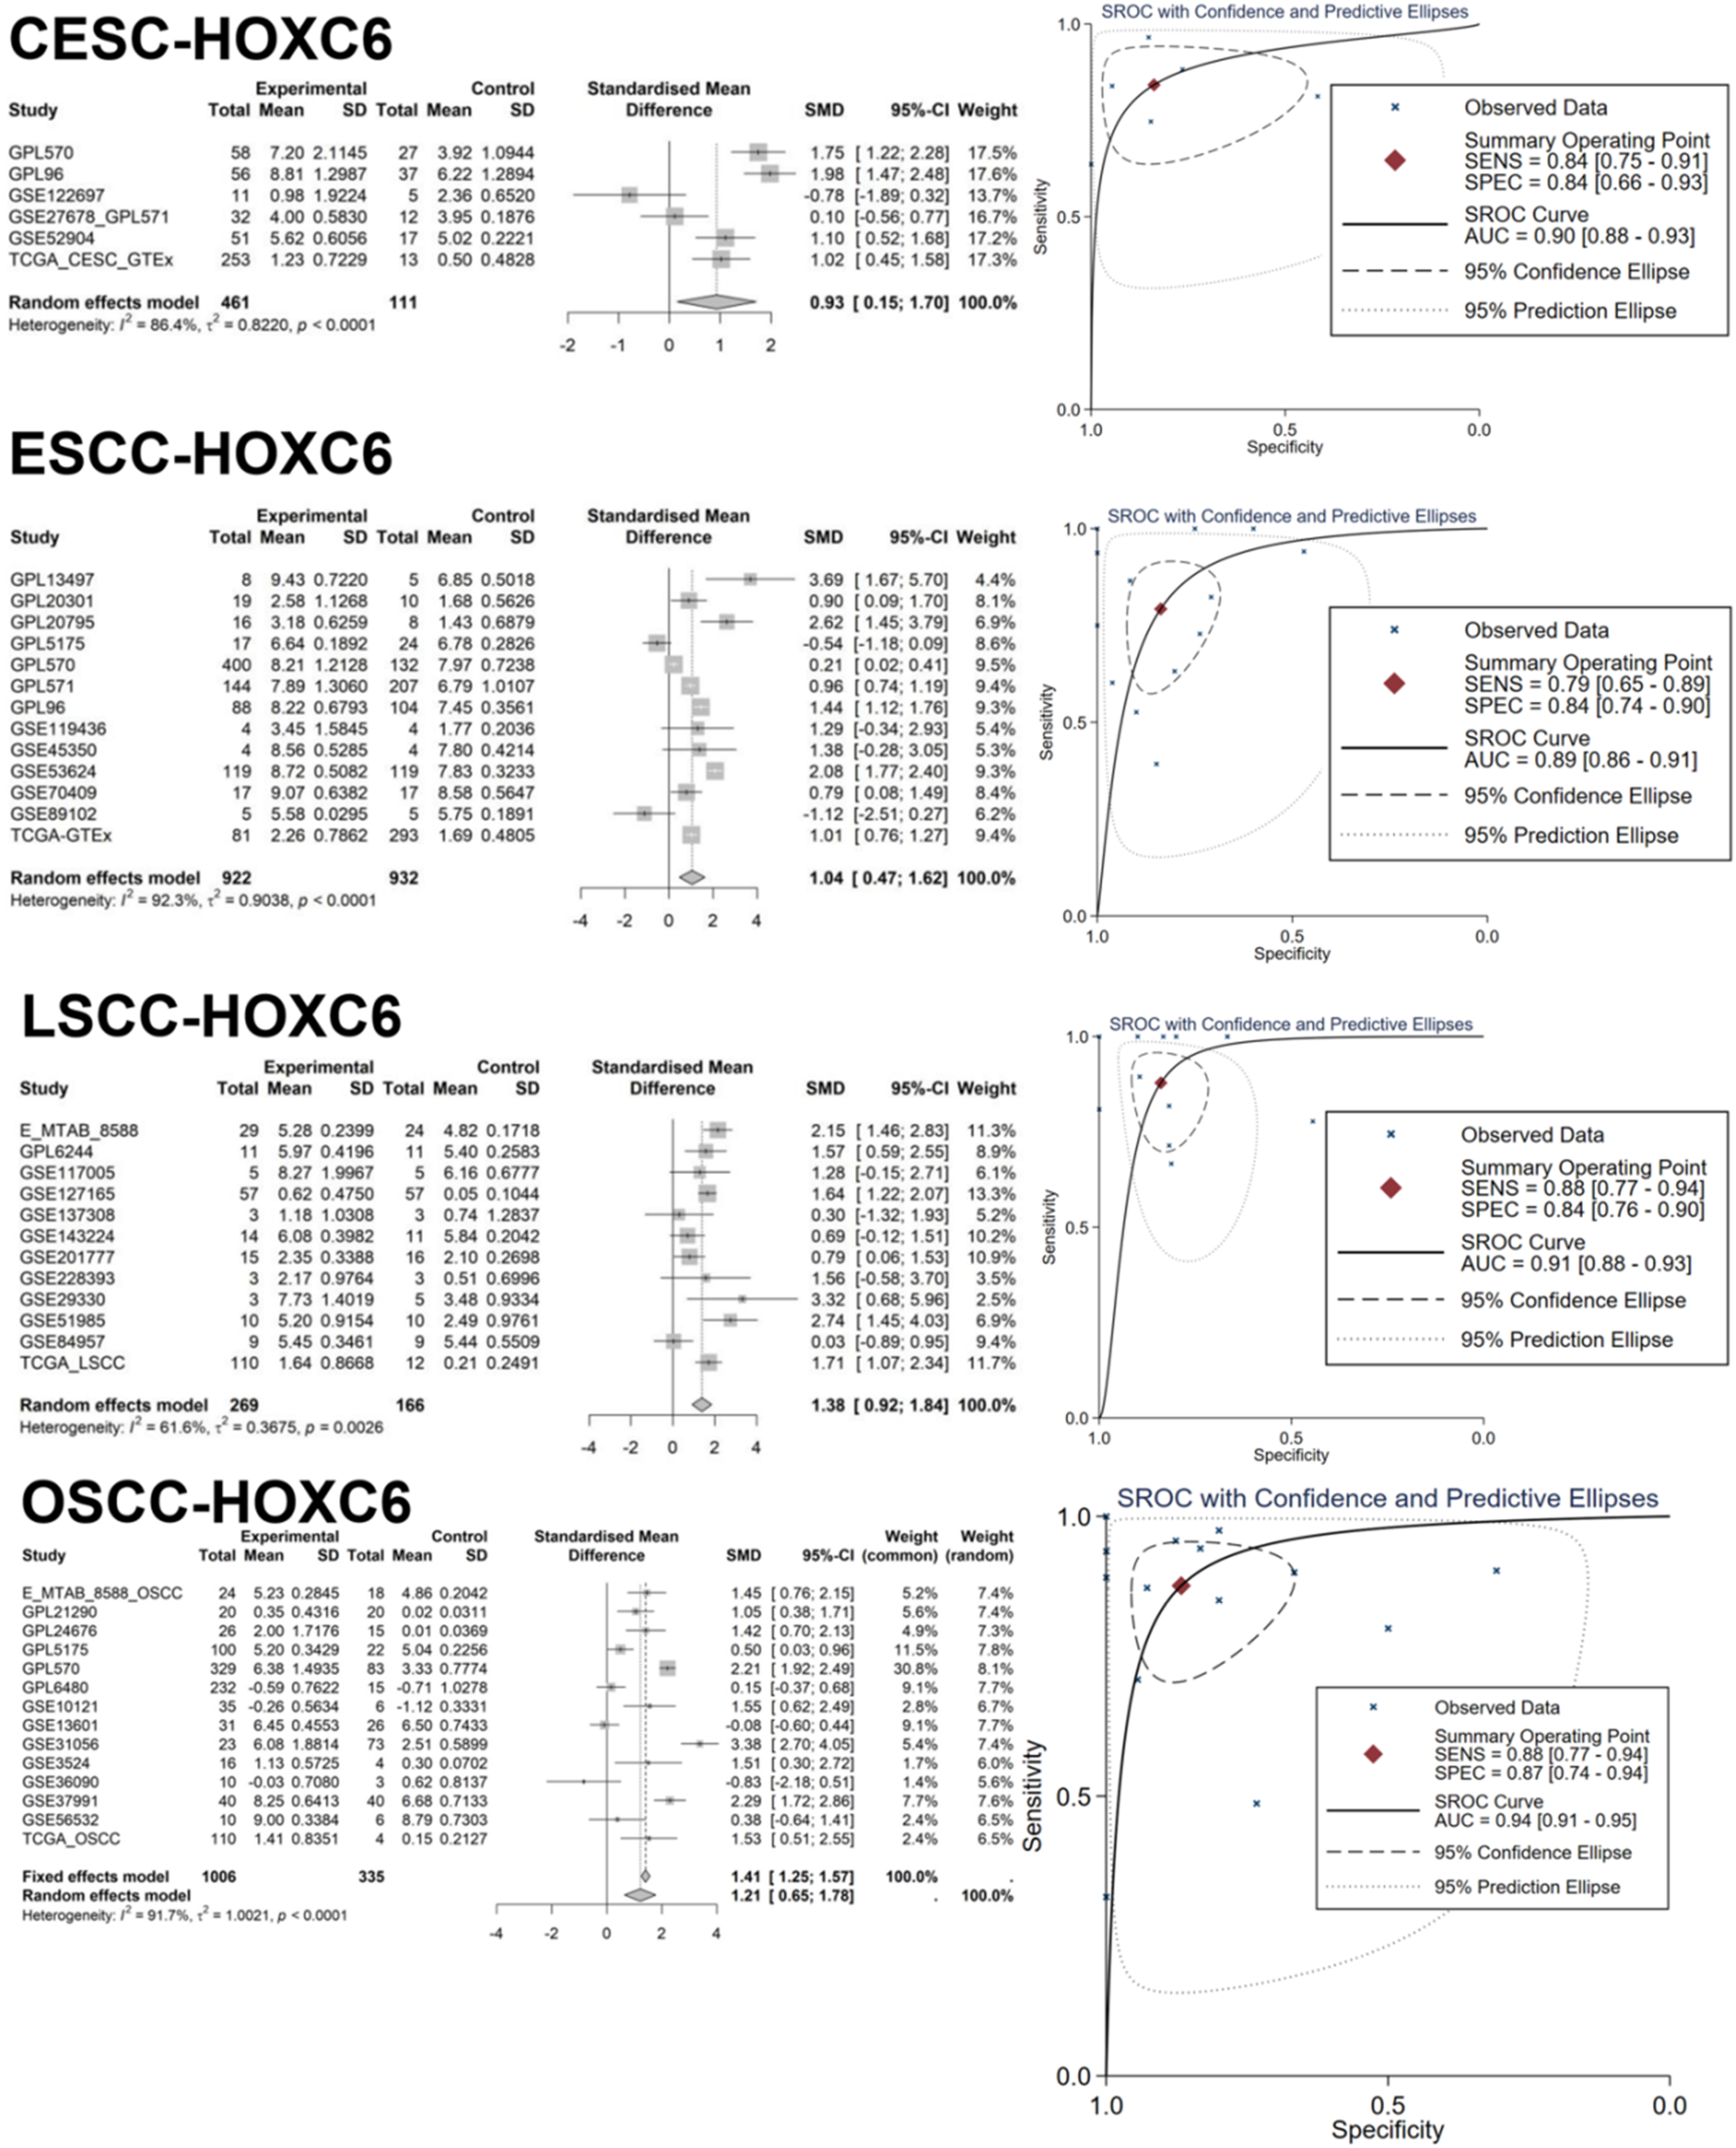
The mRNA level of HOXC6 gene shows high expression in CESC, ESCC, LSCC, and OSCC, data from experimental and control groups in various studies, displaying SMD with 95% confidence intervals and SROC plot with confidence intervals and prediction ellipse. Sample sizes: CESC (461 cancerous cases, 111 non-cancerous controls), ESCC (922 cancerous cases, 932 non-cancerous controls), LSCC (269 cancerous cases, 166 non-cancerous controls), OSCC (1006 cancerous cases, 335 non-cancerous controls).
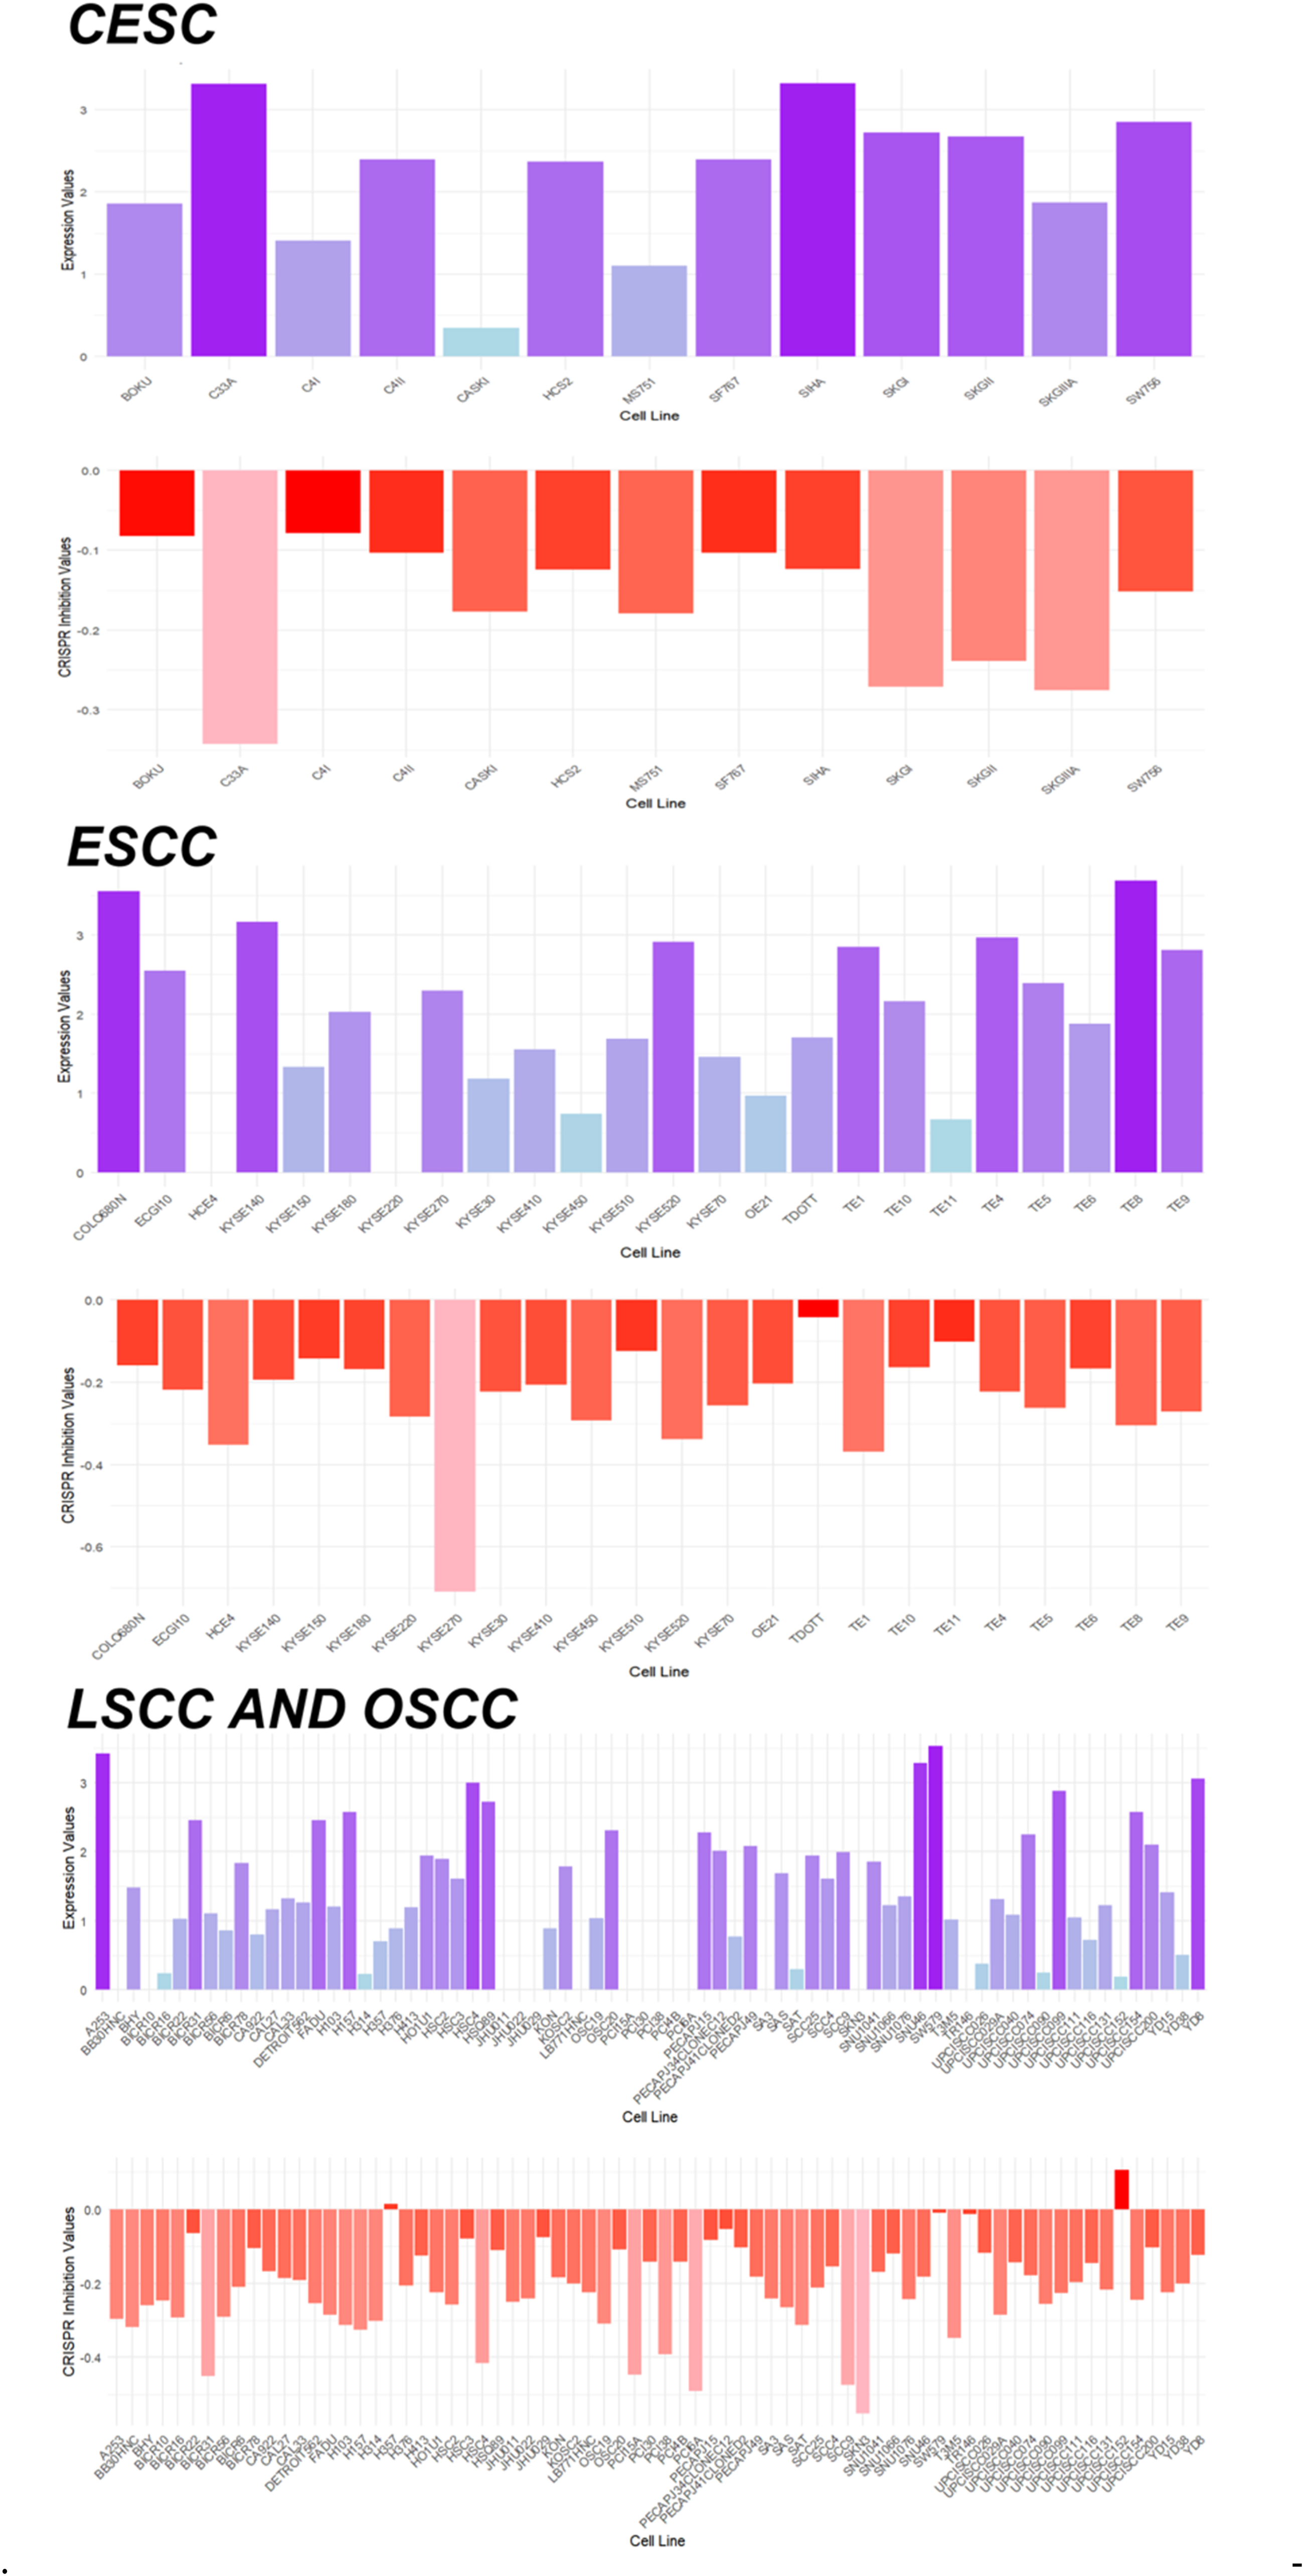
Silencing of HOXC6 inhibits CESC, ESCC, LSCC, and OSCC-related cells. The figure is divided into two parts: the upper part shows HOXC6 expression levels in different cell lines, where the height of the bar graphs indicates expression levels; the lower part shows the effect of CRISPR inhibition on the HOXC6 gene, where the height of the bar graphs indicates the strength of inhibitory effects.
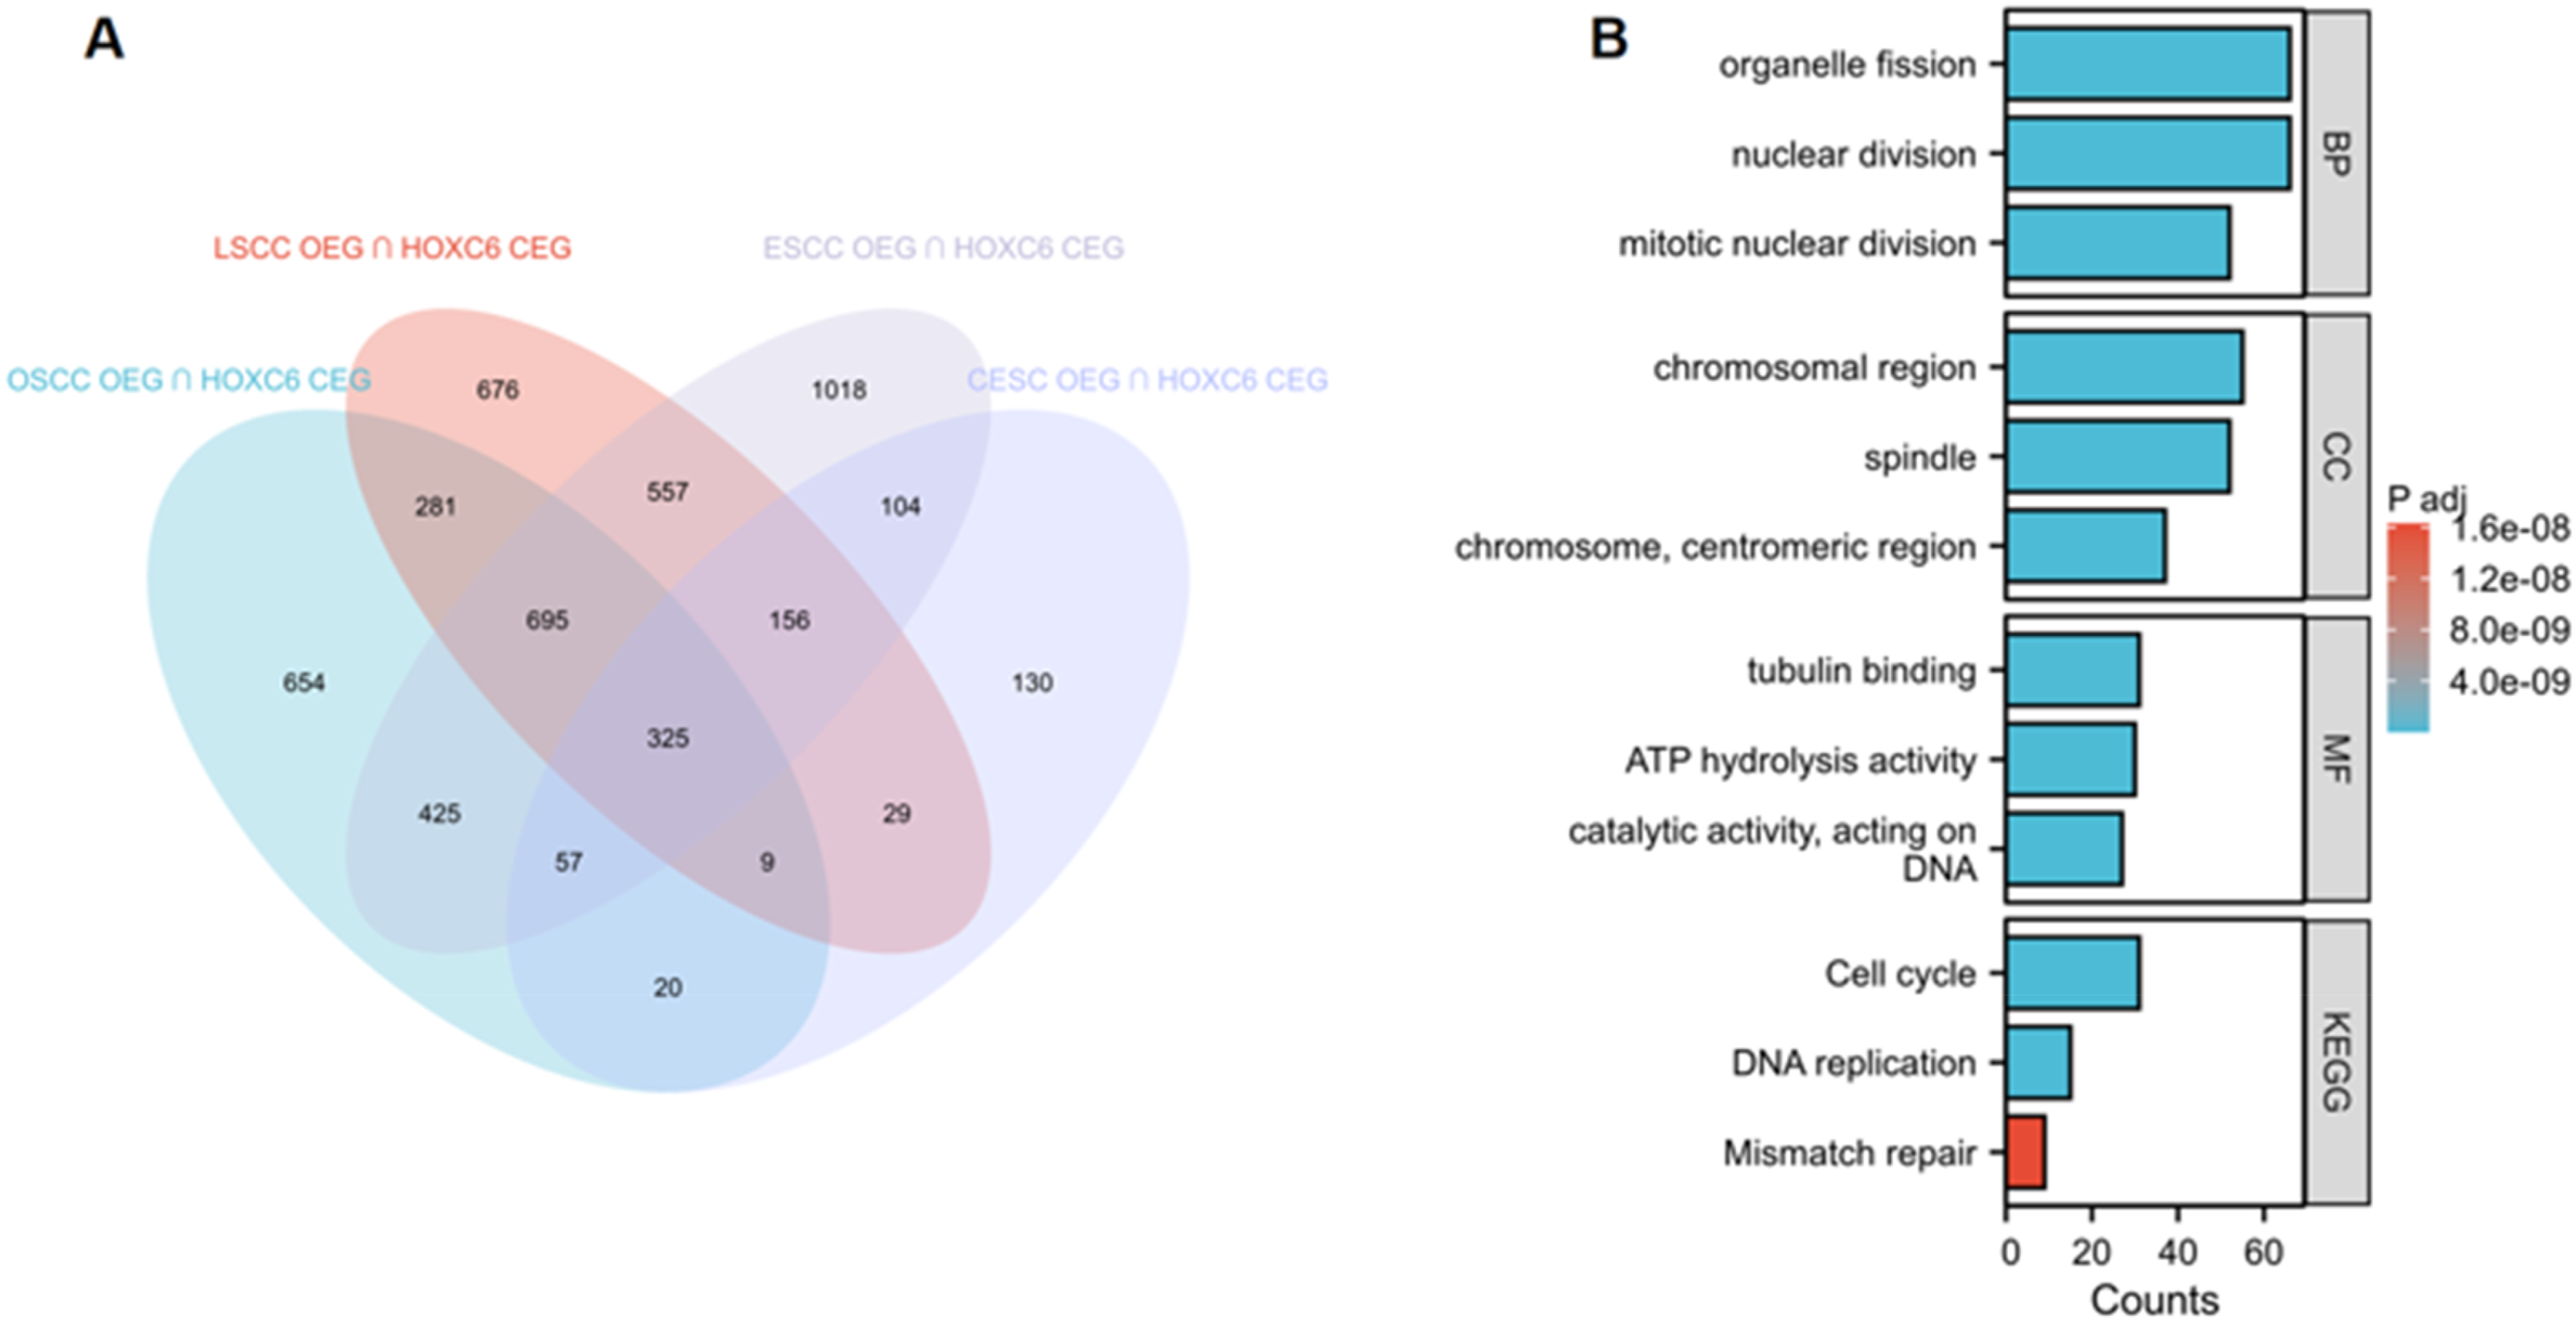
Illustrates the relationship between overexpressed genes (OEG) and HOXC6 co-expressed genes (CEG) in CESC, ESCC, LSCC, and OSCC. (A) Venn diagram showing the intersection between OEG and CEG. (B) Enrichment analysis of these intersecting genes.
Discussion
This study revealed that HOXC6 is highly expressed in LUSC and plays a significant role in tumor progression. Through a comprehensive analysis using immunohistochemical staining, single-cell sequencing, and multicenter data, we found that HOXC6 expression is markedly elevated in LUSC tissues and that its overexpression is closely associated with malignant tumor progression. The high expression of HOXC6 may promote LUSC progression through multiple mechanisms, including the inhibition of immune cell infiltration and the modulation of key signaling pathways within the tumor microenvironment. CRISPR knockdown analysis in LUSC cell lines with high HOXC6 expression demonstrated that reducing HOXC6 levels significantly inhibited tumor cell proliferation—especially in cell lines with high HOXC6 expression—suggesting that HOXC6 plays a critical role in the proliferation and survival of LUSC cells.
Mechanistically, HOXC6 likely influences nuclear division by regulating key mitotic proteins, such as those involved in spindle assembly and chromosome segregation, 13 which are critical for maintaining genomic stability. This regulation may enhance cell cycle progression, leading to uncontrolled proliferation, a common feature in squamous cell carcinomas.14,15 For immune suppression, HOXC6 could potentially interact with pathways that upregulate immune checkpoint molecules, such as Programmed cell death 1 ligand 1 (PD-L1), thereby dampening T-cell activity and promoting an immunosuppressive tumor microenvironment. Recent advances in cancer immunology suggest that transcription factors like HOXC6 may modulate cytokine signaling or immune cell recruitment, contributing to immune evasion, 16 though specific molecular interactions require further investigation.
In recent years, numerous studies have reported that HOXC6 is overexpressed in various malignant tumors and is closely associated with poor prognosis in some cancer patients, making it a potential biomarker for clinical outcome assessment and therapeutic decision-making. For instance, in solid tumors such as breast cancer, 17 prostate cancer, 18 and gastric cancer, 19 high levels of HOXC6 often indicate a higher risk of recurrence and metastasis. Its molecular mechanisms may be linked to enhancing tumor cell responsiveness to proliferative signals and inhibiting apoptosis. Additionally, the role of HOXC6 in tumor immune evasion is a key highlight in this field. By evaluating the relationship between HOXC6 and the infiltration of various immune cell types, we found that high HOXC6 expression is significantly negatively correlated with the infiltration of B cells, Th1 cells, macrophages, mast cells, and other immune cells, suggesting that HOXC6 may promote immune evasion by suppressing the accumulation of these cells in the tumor microenvironment. Immune evasion is one of the core mechanisms driving the progression of various tumors; indeed, in the tumor immune microenvironment, the extent and functionality of immune cell infiltration directly impact tumor growth and metastasis.20,21 Cancer cells can evade immune surveillance by modulating the expression of immune checkpoint molecules, altering immune cell functions, or directly suppressing immune cell activity. In LUSC, high HOXC6 expression may inhibit the infiltration of T cells and other immune cells, thereby reducing the intensity of the antitumor immune response and aiding tumor cells in evading immune surveillance. In this context, the high expression of PD-L1 in LUSC epithelial cells is a well-known immune evasion mechanism 22 ; PD-L123,24by binding to the immune checkpoint receptor programmed cell death protein 1(PD-1), suppresses T cell activation and effector functions, enabling tumor cells to escape T cell-mediated immune attacks. Thus, HOXC6 may further exacerbate tumor immune evasion by upregulating PD-L1 expression, thereby providing favorable conditions for tumor growth and metastasis. Additional immune scoring analyses also confirmed that high HOXC6 expression is negatively correlated with immune scores in the tumor microenvironment, indicating that HOXC6 may promote tumor progression by altering the immune microenvironment and inhibiting immune cell functions.
On the other hand, this study also explored the mechanisms by which HOXC6 is involved in cell division and proliferation. Through enrichment analysis of co-expressed genes, we found that HOXC6 may promote the proliferation of LUSC cells by regulating biological processes such as the cell cycle and DNA replication. Dysregulation of the cell cycle has long been a critical issue in medical research,25,26 and abnormalities in DNA replication are one of the core mechanisms driving tumor cell proliferation. In LUSC, the significant correlation between high HOXC6 expression and multiple mitosis-related genes (such as BUB1B, CCNB1, MAD2L1, and PLK1) indicates that HOXC6 may facilitate rapid cell division and proliferation through the regulation of these genes. Notably, the high expression of genes like BUB1B and CCNB1, which are closely related to the regulation of mitosis in tumor cells, is generally associated with tumor aggressiveness and resistance. Moreover, the overexpression of PLK127–29and MAD2L130,31is closely linked to dysregulated mitotic control, chromosomal instability, and enhanced proliferative capacity of tumor cells. Our findings further suggest that HOXC6 may accelerate the malignant transformation of LUSC by regulating these mitosis- and cell cycle-related genes, thereby promoting rapid proliferation of LUSC cells.
In addition, Research has found that HOXC6 shows high expression in CESC, ESCC, LSCC, and OSCC, with its expression levels closely related to key biological processes such as cell cycle, DNA replication, and mitosis. In each cancer type, HOXC6 co-expresses with genes that regulate chromosome separation and mitosis, suggesting that it may participate in these processes and drive rapid proliferation of tumor cells. However, while bioinformatics analyses support the extension of these findings across pan-squamous carcinomas, functional validation remains limited to LUSC cell lines. This represents a key limitation, and direct experimental validation in CESC, ESCC, LSCC, and OSCC contexts is needed to confirm the conserved role of HOXC6 across these cancer types. For example, in CESC, HOXC6 may exacerbate chromosomal instability and increase the risk of invasion and metastasis by affecting chromosome separation and mitosis20,32; in ESCC, high expression of HOXC6 may promote cell proliferation through mechanisms such as regulating chromosome assembly, thereby explaining chromosomal instability and drug resistance phenomena3,26; in LSCC, it plays a key role in cell division regulation and drives malignant transformation of tumors 30 ; in OSCC, HOXC6 may accelerate cell proliferation by promoting mitosis mechanisms. 23 Overall, these studies indicate that HOXC6 drives rapid proliferation of tumor cells in various types of squamous cell carcinomas by regulating cell cycle and mitosis-related processes, providing an important theoretical basis for future exploration of its specific mechanisms of action and the development of precision treatment strategies.
Conclusion
HOXC6 shows high expression in LUSC, a finding that has been verified through IHC, scRNA-seq, and Bulk RNA-seq analysis. After HOXC6 knockdown, the growth of LUSC cells was significantly inhibited, and its high expression was also closely associated with immune cell suppression, while HOXC6 in LUSC was closely related to the mitosis process. Meanwhile, in pan-squamous carcinomas (including CESC, ESCC, LSCC, and OSCC), scRNA-seq and Bulk RNA-seq data similarly showed high HOXC6 expression; after HOXC6 knockdown, the proliferation of these cancer-related cells was also significantly inhibited, and functional analysis further suggested that HOXC6 may participate in the occurrence and progression of pan-squamous carcinomas by regulating key biological processes such as mitosis.
Supplemental Material
sj-docx-1-cbm-10.1177_18758592251390255 - Supplemental material for The overexpression of HOXC6 in LUSC and pan-squamous cell carcinomas indicates the coexistence of nuclear division regulatory mechanisms
Supplemental material, sj-docx-1-cbm-10.1177_18758592251390255 for The overexpression of HOXC6 in LUSC and pan-squamous cell carcinomas indicates the coexistence of nuclear division regulatory mechanisms by Shu-Jia He, Ke-Jun Wu, Yi-Yang Chen, Yan-Ting Zhan, Yu-Xing Tang, Xiao-Song Chen, Zhi-Guang Huang, Qi Li, Bin Li, Yong-Yao Gu, Gang Chen, Jin-Liang Kong and Feng Chen in Cancer Biomarkers
Footnotes
Acknowledgements
This research was supported by the Traditional Chinese Medicine Project (GXZYA20240303), the China Undergraduate Innovation and Entrepreneurship Training Program (202410598002X, S202410598179), and the Future Academic Star Program of Guangxi Medical University (WLXSZX24104).
Authors’ contributions
All authors have made important contributions to data analysis, drafting the article or revising the article.
Funding
Research project on traditional Chinese medicine(GXZYA20240303); China Undergraduate Innovation and Entrepreneurship Training Program (202410598002X, S202410598179); Future Academic Star of Guangxi Medical University(WLXSZX24104).
This research was supported by the Traditional Chinese Medicine Project, the Future Academic Star Program of Guangxi Medical University, the China Undergraduate Innovation and Entrepreneurship Training Program, (grant number GXZYA20240303, WLXSZX24104, 202410598002X, S202410598179).
Declaration of conflicting interests
The authors declared no potential conflicts of interest with respect to the research, authorship, and/or publication of this article.
Availability of data and materials
The datasets analyzed in the current study are available from the GEO, TCGA, and DepMap databases. Persistent web links for accessing these databases are as follows: GEO(https://www.ncbi.nlm.nih.gov/geo/), TCGA (https://www.cancer.gov/ccg/research/genome-sequencing/tcga), and DepMap (![]() ).
).
Supplemental material
Supplemental material for this article is available online.
References
Supplementary Material
Please find the following supplemental material available below.
For Open Access articles published under a Creative Commons License, all supplemental material carries the same license as the article it is associated with.
For non-Open Access articles published, all supplemental material carries a non-exclusive license, and permission requests for re-use of supplemental material or any part of supplemental material shall be sent directly to the copyright owner as specified in the copyright notice associated with the article.