
Abstract
BACKGROUND:
DNA methylation plays a vital role in modulating genomic function and warrants evaluation as a biomarker for the diagnosis and treatment of lung squamous cell carcinoma (LUSC).
OBJECTIVE:
In this study, we aimed to identify effective potential biomarkers for predicting prognosis and drug sensitivity in LUSC.
METHODS:
A univariate Cox proportional hazards regression analysis, a random survival forests-variable hunting (RSFVH) algorithm, and a multivariate Cox regression analysis were adopted to analyze the methylation profile of patients with LUSC included in public databases: The Cancer Genome Atlas (TCGA), and the Gene Expression Omnibus (GEO).
RESULTS:
A methylated region consisting of 3 sites (cg06675147, cg07064331, cg20429172) was selected. Patients were divided into a high-risk group and a low-risk group in the training dataset. High-risk patients had shorter overall survival (OS) (hazard ratio [HR]: 2.72, 95% confidence interval [CI]: 1.82–4.07,
CONCLUSION:
We report novel methylation sites that could be used as powerful tools for predicting risk factors for poorer survival in patients with LUSC.
Introduction
Lung cancer is one of the most frequently diagnosed malignant tumors and a leading cause of cancer related mortality worldwide [1]. In most cases, lung cancer is diagnosed at an advanced stage, and the 5-year survival rate remains below 20% [2]. According to histological types, lung cancers are classified into small cell lung cancer (SCLC), or non-small cell lung cancer (NSCLC). The latter includes lung adenocarcinoma (LUAD) and lung squamous cell carcinoma (LUSC). NSCLC represents 87% of all lung cancers, and approximately one-third of NSCLC are reported as LUSC [3]. Data from several recent studies confirm that the current treatment strategies (e.g. epidermal growth factor receptor tyrosine kinase inhibitors and immune checkpoint inhibitors) are effective in improving overall survival (OS) rates in patients with LUAD [4, 5, 6, 7]. In contrast, the lack of early diagnostic biomarkers and of effective treatment protocols has resulted in sustained poor OS rates in patients with LUSC [8]. Therefore, it is essential to identify prognostic biomarkers and therapeutic targets to improve OS rates in patients with LUSC.
Aberrant DNA methylation may result in silencing of tumor-suppressor genes and can potentially lead to the development of cancer. DNA methylation has been reported as a promising target for the development of robust predictive, prognostic, and diagnostic biomarkers [9]. In addition, a previous study uncovered the differences between DNA methylation and expression patterns in LUAD and LUSC, and evaluated their biological characteristics [10]. The methylation profiles of GALR1, ZMYND10, NTSR1, AGTR1, and SLC5A8 may be useful for NSCLC diagnosis [11]. Moreover, the DNA methylation pattern for TP63, TBX5, TCF21, HNF1B, CLDN1, TBX5, and ADHFE1 was reported as a potential diagnostic biomarker for LUSC [12]. VAX1, IRX1, AdCyAP1, and CH25H were also suggested as prognostic biomarkers for LUSC [13]. However, more biomarkers are urgently needed to improve the treatment of LUSC according to patient’s prognosis.
In this study, we identified and validated potential methylation sites as a biomarker to predict LUSC prognosis by utilizing the Gene Expression Omnibus (GEO) and The Cancer Genome Atlas (TCGA) databases. Identification of the methylation signature of patients’ tumor DNA will allow stratification of patients into a high-risk and a low-risk group. we observed that patients in the high-risk group were more sensitive to gemcitabine and docetaxel than the low-risk group. These results may have important implications for target therapy, which may result in improved OS in patients with LUSC.
Materials and methods
Clinical cohorts, RNA-Sequencing, and DNA methylation
RNA-sequencing and DNA methylation data as well as clinical features were obtained from TCGA database (
Schematic showing the selection of a DNA methylation signature to predict prognostic markers. 1. Different screen, fold change 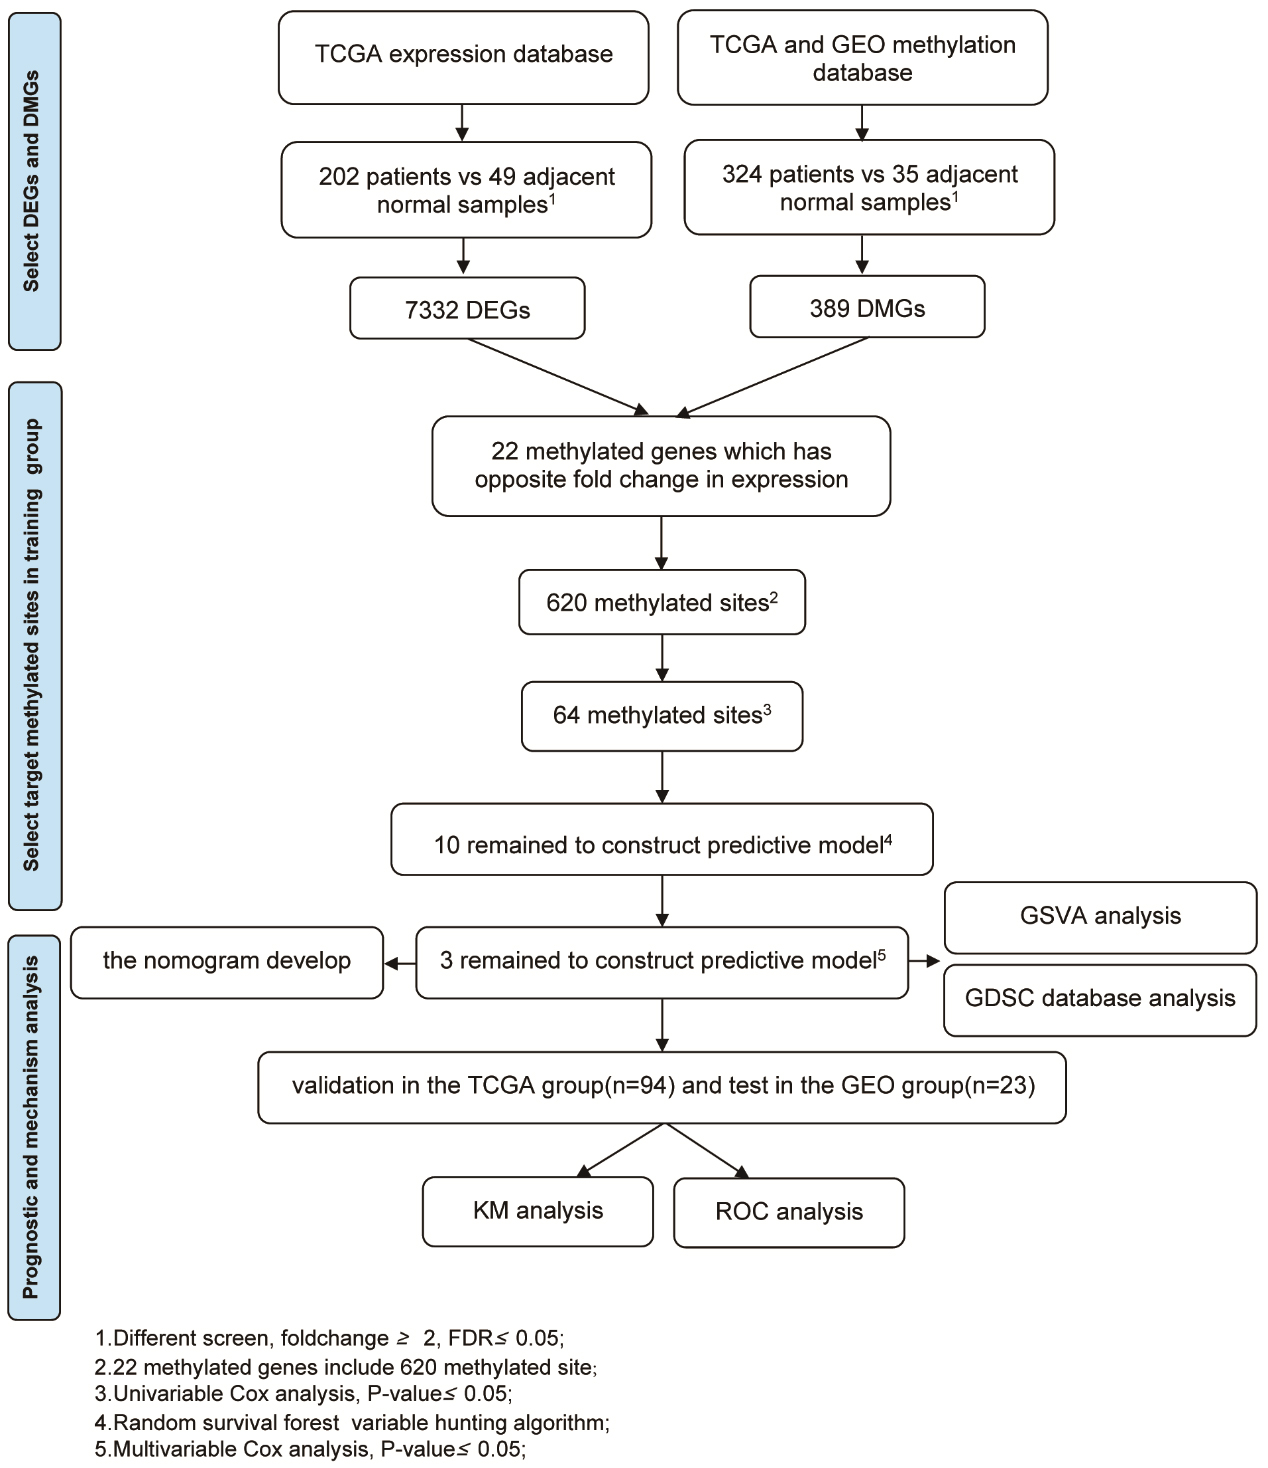
edgeR software is a bioconductor package for differential expression analysis of gene expression data [15]. edgeR software was used to screen for differentially expressed genes (DEGs) and differentially methylated genes (DMGs) between patients and adjacent normal tissue.
Statistical analysis
A machine learning approach was used to build the predictive model as described previously [16]. Firstly, a univariate Cox proportional hazard regression analysis was adopted based on a previously published report to assess the correlation between survival time and the methylation of each gene site in the training cohorts [17]. We then used the random survival forests-variable hunting (RSFVH) algorithm to screen for methylated genes, of which 10 were screened out [18, 19]. Finally, in order to identify the reliable and powerful predictive prognostic methylated sites, multivariate Cox regression analysis was adopted to build a prognostic model. Based on the model, the prognosis risk was accessed according to the following methylation equation, where N is the number of methylated sites of signature,
Univariate Cox proportional hazard regression analysis of differentially methylated genes in the training group and multivariate Cox regression analysis of the 65 methylated sites in the training group that were considered statistically significant in both groups (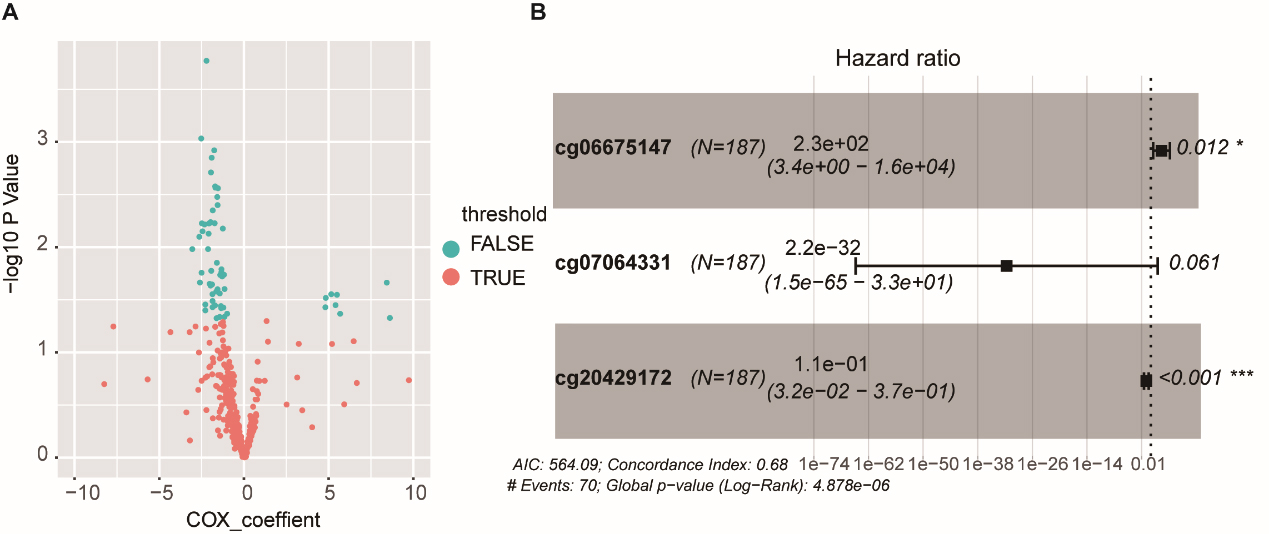
Risk Score (RS) was calculated based on the multi-node weighted sum of risk scores and the coefficient of the signature for each patient as described previously [20]. The median RS was calculated as the cut-off value enabling division of the training cohorts, the test cohorts, and the validation cohorts into a high-risk and low-risk group, respectively. Kaplan-Meier survival analysis was used to compare the prognoses of the two groups using the log-rank test. Receiver operating characteristic (ROC) curve analysis was plotted to confirm the ability of the model to predict the 5-year survival. Multivariable Cox regression analysis was used to analyze the independent survival prediction of the methylation signatures. Student’s t-test was used to screen for the differential expression and methylation genes between tumor and adjacent tissues. All statistical analyses were conducted using R 3.5.1 (
To develop a more sensitive prediction tool for clinical practice, we generated a nomogram integrating the methylation signature and two different clinical risk factors (age and stage) to predict 1-year, 3-year, and 5-year survival. The nomogram score for each variable based on the point scale was calculated. After calculating the total nomogram score, we obtained the predicted probability of 1-year, 3-year, and 5-year survival for each patient, as described previously [21].
Gene set variation analysis (GSVA) of different pathways between the high and low-risk groups
GSVA was designed to assess the concerted behavior group of functionally related genes, between the high-risk group and the low-risk group. The GSVA package implemented a non-parametric unsupervised method, and a
Analysis of drug sensitivity in the high-and low-risk group, using GDSC
The GDCS database contains pharmacogenomics data including drug screening results for thousands of cancer cell lines and over 200 anti-cancer drugs, genomic variants and methylation data. Inhibitory concentration 50% (IC50) is the concentration of the drug that kills half of tumor cells in vitro [22, 23]. Data are available for more than 1000 cell lines including 15 LUSC cell lines. Chemotherapy is recommended as the first-line treatment for patients with advanced or metastatic NSCLC [24, 25]. Using the training model, methylation data from LUSC cells were processed, and drug sensitivity was calculated for both the high-risk and low-risk groups. A scatter plot was developed to show the IC50 of commonly used chemotherapy drugs for both the high-risk and low-risk groups.
Results
Summary of patient demographics and characteristics
Summary of patient demographics and characteristics
Methylated site signature predicts survival rate of patients with LUSC. (A–B) Kaplan-Meier survival curves divided LUSC patients into high-risk and low-risk groups using the methylated gene site signature in the training and test groups. Log-rank test was used to calculated 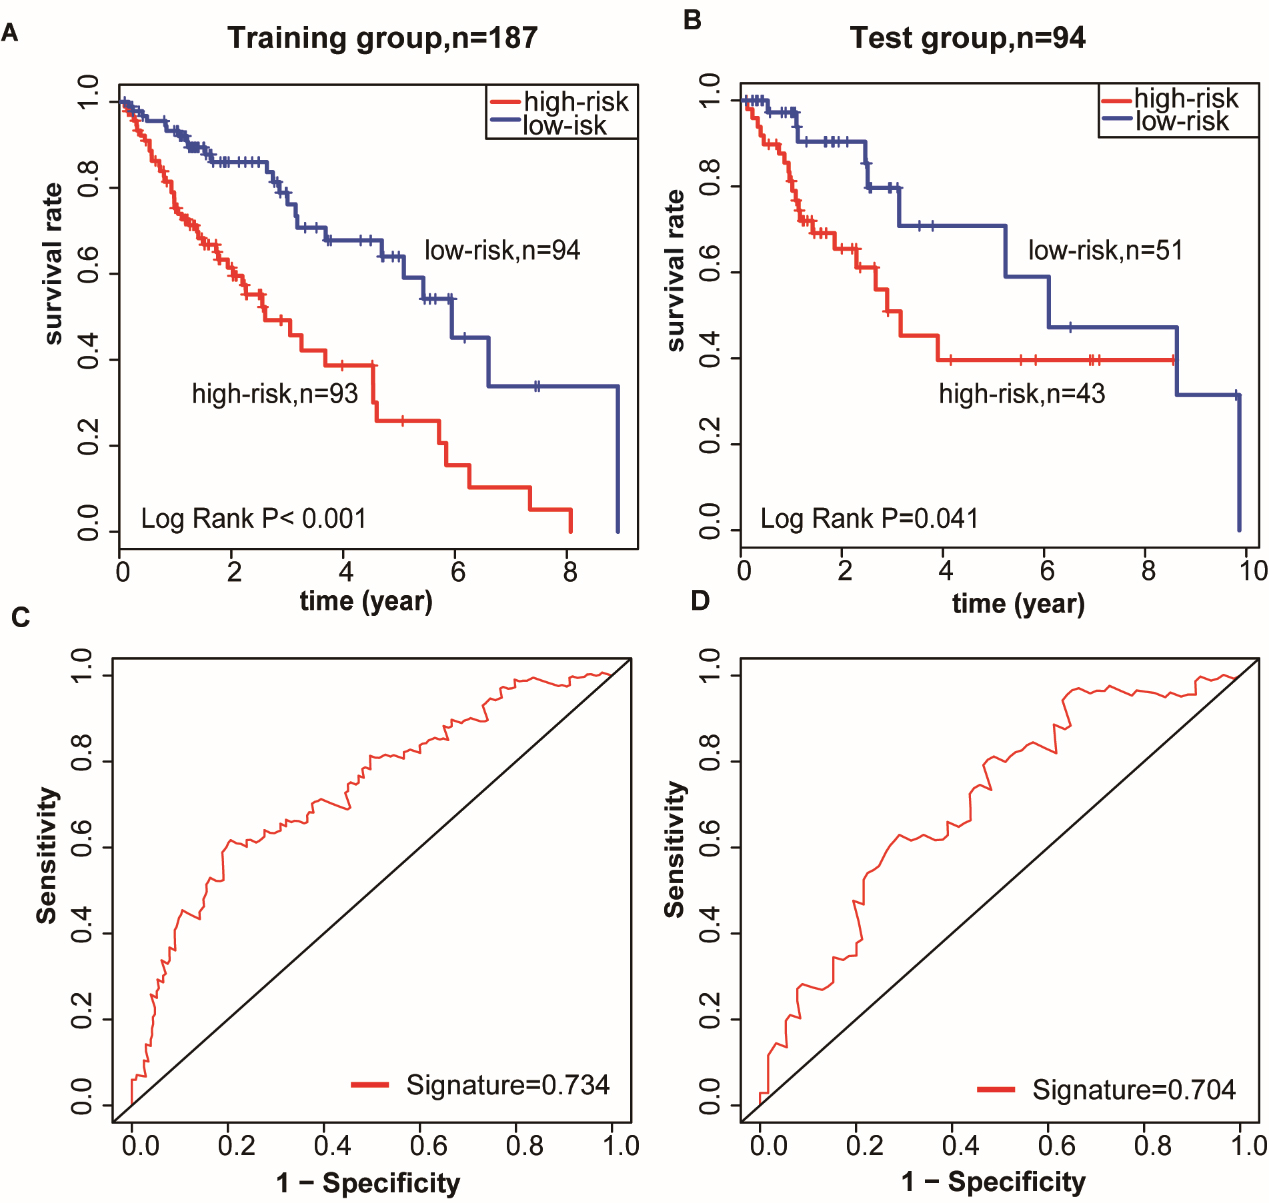
To evaluate gene expression and methylation patterns of LUSC, significant differential analysis was performed in LUSC and compared to adjacent normal samples. We identified 7,332 DEGs (4583 downregulated, and 2749 upregulated, Table S3) and 389 DMGs (20 downregulated, and 369 upregulated, Table S4) (
Methylated site signature was validated in the GSE56044 dataset. (A) Methylated site signature as a prognostic biomarker was validated in the GSE56044 dataset, which was also used to divide LUSC patients into a high-risk and a low-risk group. (B) Area under the curve (AUC) of receiver operating characteristic (ROC) curve was used to determine the sensitivity and specificity of the prognostic model.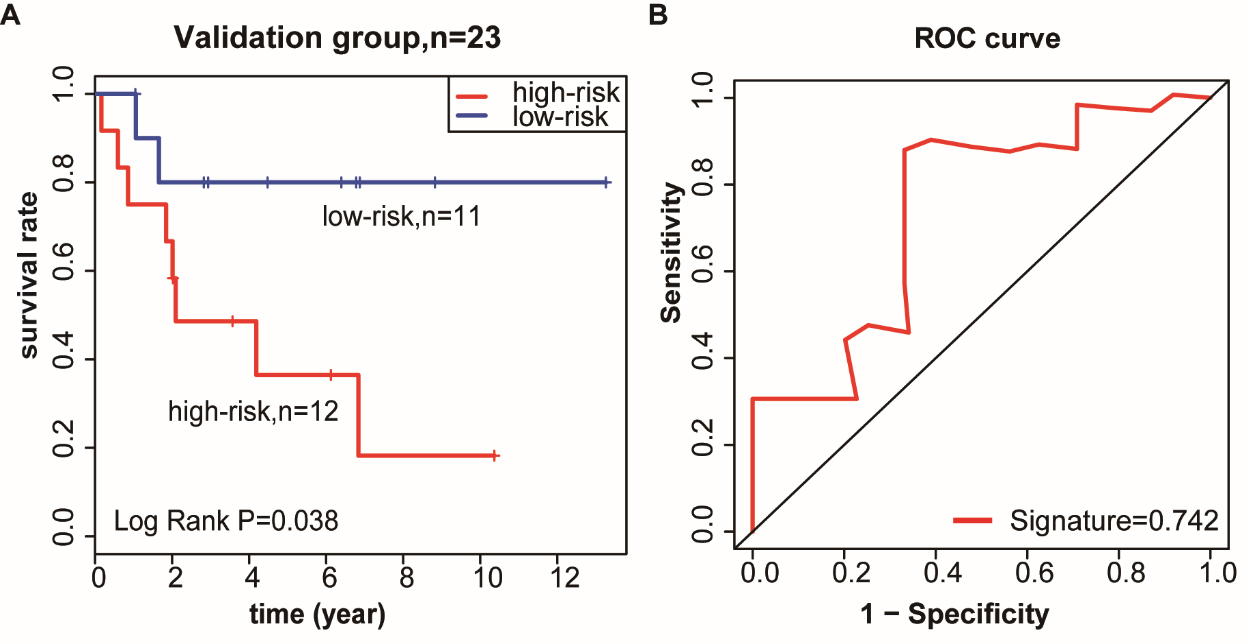
The signature of independent prognostic factors and nomogram development. (A) Combined clinical information was used for multivariate Cox regression analysis to study OS in LUSC patients in the training group (B) The nomogram combined the methylated gene site signature and clinical-related variables to predict patients’ OS.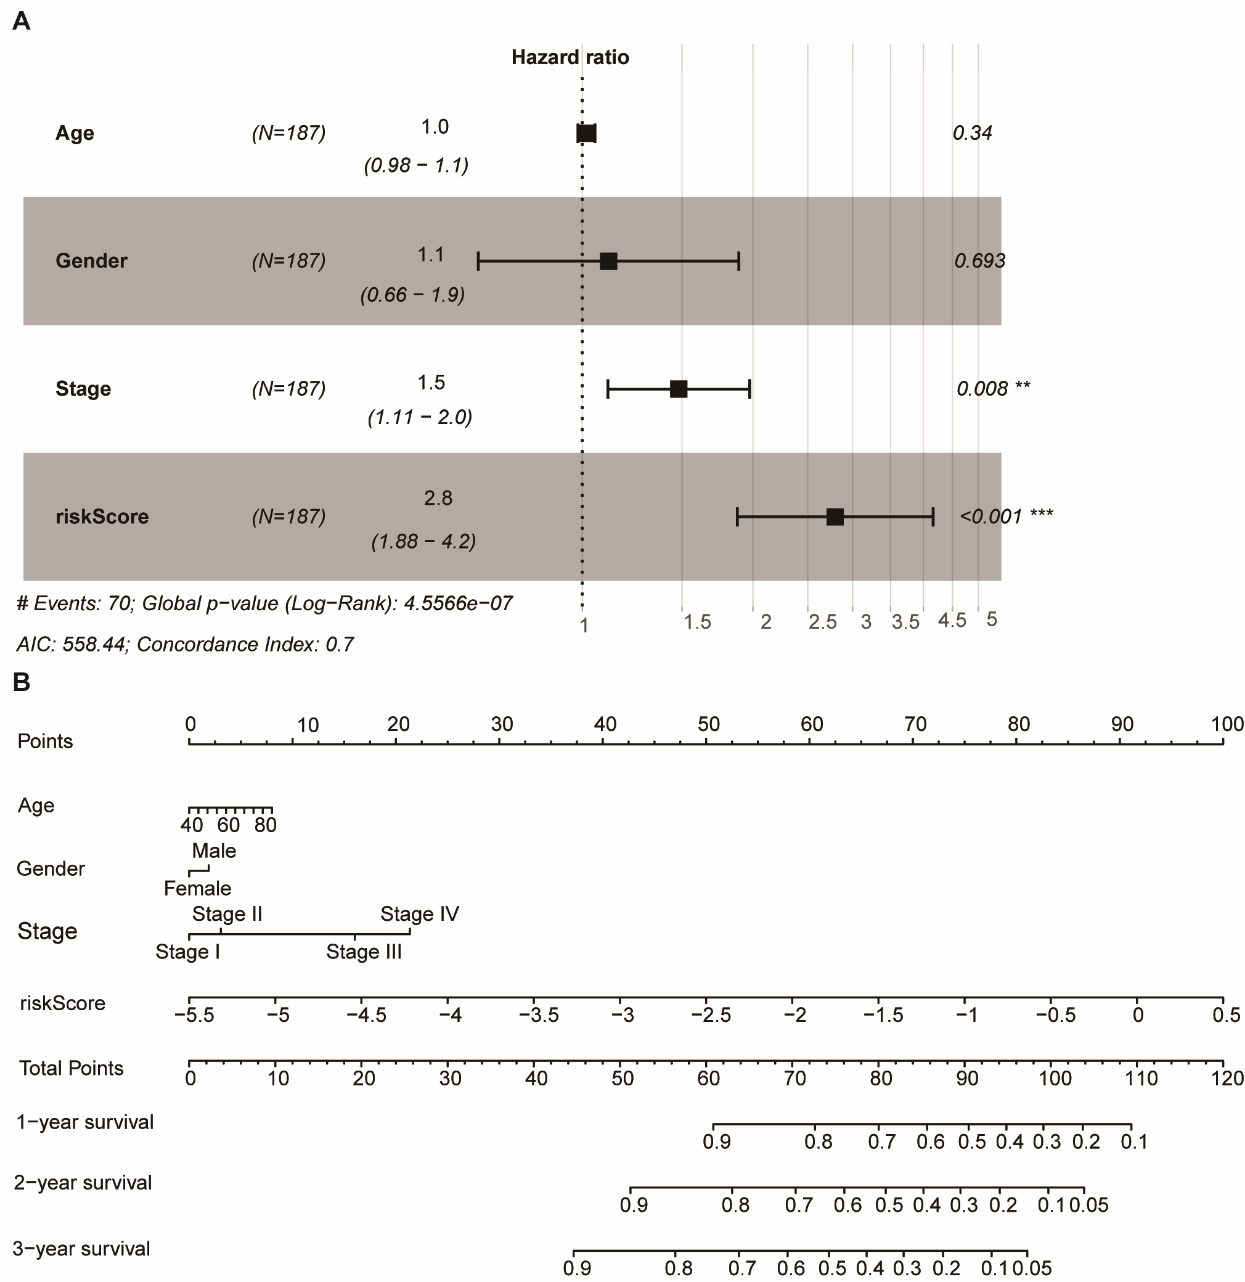
All 279 patients were randomly divided into two groups (training group,
Confirmation of the survival power of the methylation signature in the training and test datasets
The methylation signature was used to calculate each patient’s RS. The median RS was considered as the cut-off point to classify the training cohorts into the low-risk group (
Validation of the robust signature in the independent validation cohorts
To confirm that the identified three-methylated gene site-based classifier had equal prognostic value in different patients, the signature of the GSE56044 data series was evaluated in relation to OS in patients with LUSC (Table S11). Using the established coefficient of the module, the training cohort was divided into a low-risk group (11 patients, 47.8%) and a high-risk group (12 patients, 52.2%). The corresponding 5-year OS was less than 40% in the high-risk group and 80% in the low-risk group (Fig. 4A). In the validation dataset, the predictive ability of the signature was similarly reliable (area under the curve [AUC]
GSVA analysis of differentially-activated pathways between the high- and low-risk groups.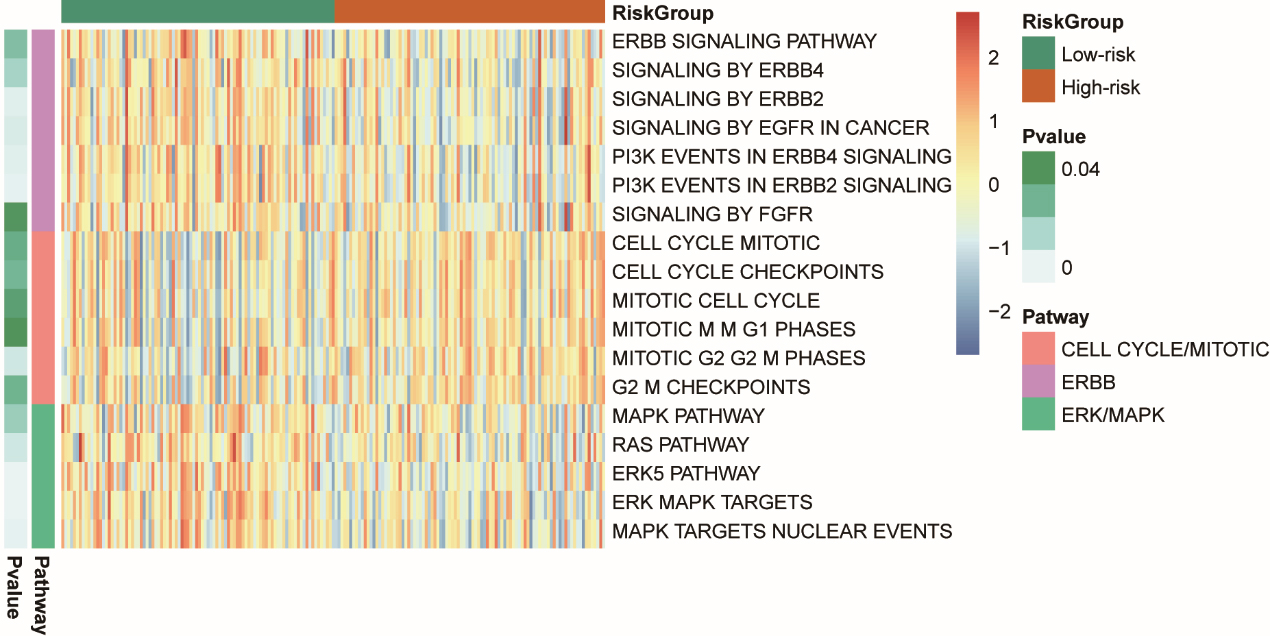
The relationship between the signature RS and the clinicopathological characteristics (e.g., age and stage) was analyzed by multivariate Cox regression analysis. The relationship demonstrated that the signature was an independent prognostic predictor of OS in the training dataset (high-risk group vs. low-risk group, HR
Evaluation of differential pathway activity between the high-risk and low-risk group
GSVA was used to screen for DEGs in different pathways between the high- and low-risk groups in the training dataset. We identified three pathways of interest using the KEGG, BIOCARTA, and REACTOME datasets (non-parametric,
Identification of signature methylation sites in LUSC cell lines that are resistant or sensitive to drugs
High-risk and low-risk groups were identified using the methylation data of gemcitabine and docetaxel-treated LUSC cells based on the training model in the GDSC database. A scatter plot presents the IC50 of common chemotherapy drugs in the high-risk and low-risk groups (Fig. 7). Results show that patients in the high-risk group were more sensitive to gemcitabine and docetaxel than the low-risk group.
Signature methylation sites in LUSC cell lines resistant and sensitive to chemotherapeutic drugs.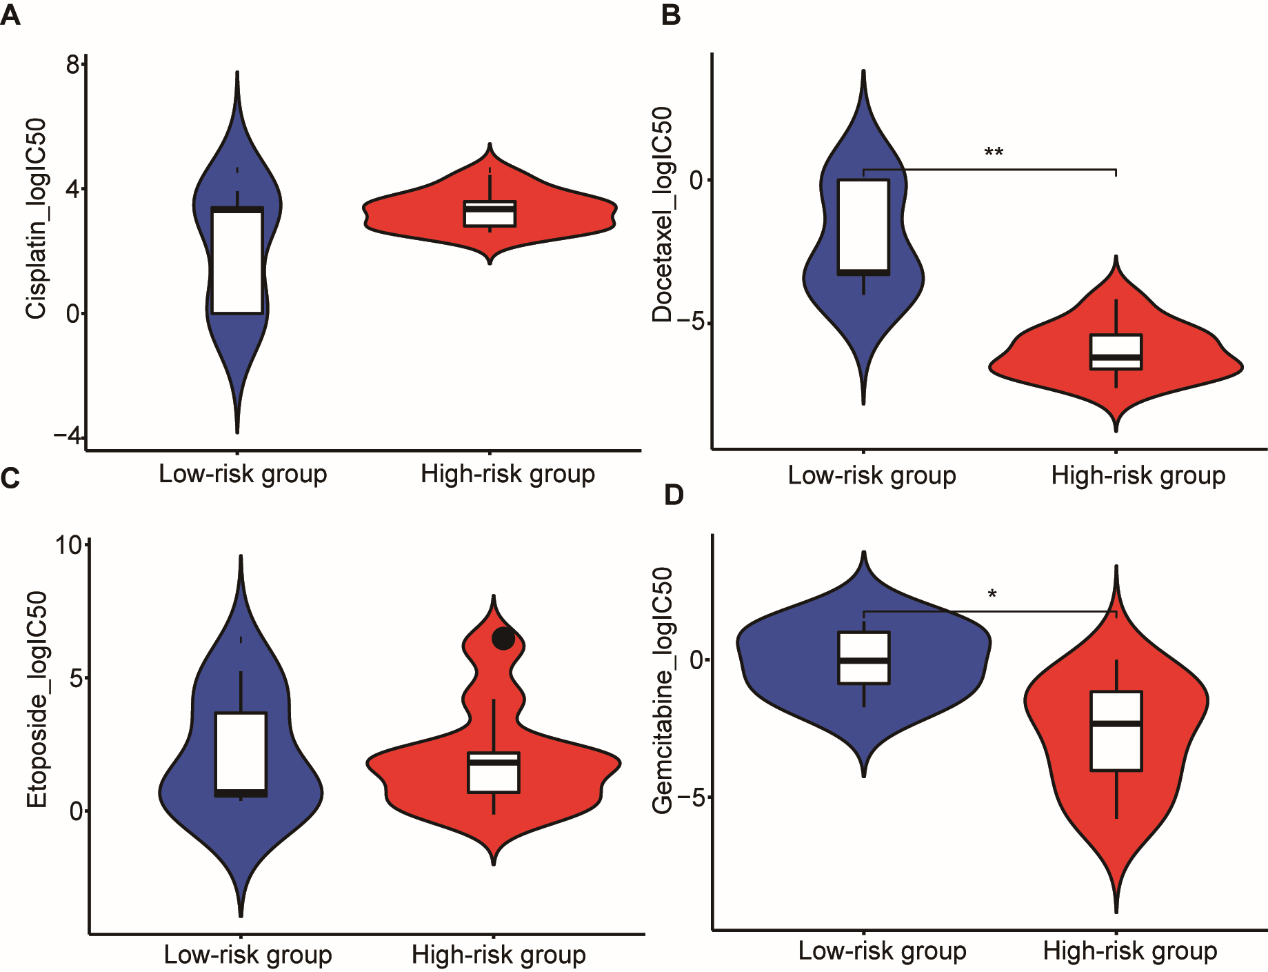
Lung cancer is one of the most aggressive tumors and the leading cause of cancer death worldwide. Until the last decade, metastatic NSCLC was associated with a
We evaluated 475 methylated gene sites from 22 differentially methylated genes which had opposite differential expression patterns. By applying different statistical approaches and a machine-learning method, we identified a three-gene site methylation signature. Furthermore, we validated the methylated gene signature in the TCGA, which was independently associated with OS in patients with LUSC. Moreover, we established a methylated gene site nomogram to predict OS. We found that the cell cycle/mitosis, ERBB, and ERK/MAPK pathways were different between the high-risk and low-risk groups in the training dataset, which lead to variations in OS. Finally, high-risk and low-risk groups were defined from the methylation data for gemcitabine and docetaxel-treated LUSC cells based on the training module in the GDSC database. It is well established that gemcitabine and docetaxel disrupt DNA synthesis and as such are commonly used as chemotherapy drugs [32, 33, 34]. We found that patients in the high-risk group were more sensitive to gemcitabine and docetaxel than the low-risk group. This observation is consistent with previous results of the GSVA, which showed that the cell cycle was different between the high-risk and low-risk group in the training dataset. These results may have important implications for precision therapy, which may result in improved OS in patients with LUSC.
We determined a set of three methylated gene sites consisting of TRIM58, FOXF1, and C16orf86 that predicts OS in three patient cohorts. The TRIM58 promoter was previously shown to be methylated and frequently silenced in early-stage lung adenocarcinoma [35]. As a novel epigenetic signature, TRIM58 has an important role in the early diagnosis of lung cancer [36]. In addition, it was found that TRIM58 methylation was associated with eight prognostic genes in LUSC [37]. It was also previously reported that FOXF1 is hypermethylated and downregulated in chronic obstructive pulmonary disease [38]. It was shown to be an important modulating factor in the lung, influencing important biological events such as maintenance of endothelial barrier function and prevention of edema after lung injury [39], promotion of lung regeneration after partial pneumonectomy [40], and mediation of mesenchymal stem cell fusion-induced reprogramming [41]. C16orf86 is an epigenetically-regulated factor which is conferred by genetic variation located at independent loci [42]. Little is known about the role of C16orf86 in tumor progression.
Our work has several limitations. We obtained a low number of normal adjacent tumor tissue compared to available pathological tissue. We did not investigate for the specific mechanism accounting for methylation of the sites involved in LUSC. We lack prospective data to evaluate the methylated sites signature. Despite these limitations, the significant and consistent correlation of the identified methylated sites signature with the OS found in three independent groups highlights the potentially powerful and significant prognostic signature of these sites in LUSC.
Taken together, our results show that we successfully identified a prognostic signature which may help predict the OS in patients with LUSC. Importantly, we developed a 3-methylated gene site nomogram to predict patients’ prognosis. In keeping with previous results, we found that high-risk patients were more sensitive to gemcitabine and docetaxel than low-risk patients. Our observations suggest that activity in relation to the cell cycle/mitosis may be different between the high-risk and low-risk groups. Our data also suggest that this signature could serve as a precise and robust prognostic biomarker and as a potential therapeutic target in patients with LUSC.
Funding
The work is supported by the National Natural Science Foundation of China (81672267, 81871859) and the Natural Science Foundation of Guangdong Province (2016A030313632).
Supplementary data
The supplementary files are available to download from http://dx.doi.org/10.3233/CBM-201564.
sj-docx-1-cbm-10.3233_CBM-201564.docx - Supplemental material
Supplemental material, sj-docx-1-cbm-10.3233_CBM-201564.docx
sj-xls-1-cbm-10.3233_CBM-201564.xls - Supplemental material
Supplemental material, sj-xls-1-cbm-10.3233_CBM-201564.xls
sj-xls-2-cbm-10.3233_CBM-201564.xls - Supplemental material
Supplemental material, sj-xls-2-cbm-10.3233_CBM-201564.xls
sj-xls-3-cbm-10.3233_CBM-201564.xls - Supplemental material
Supplemental material, sj-xls-3-cbm-10.3233_CBM-201564.xls
sj-xls-4-cbm-10.3233_CBM-201564.xls - Supplemental material
Supplemental material, sj-xls-4-cbm-10.3233_CBM-201564.xls
sj-xls-5-cbm-10.3233_CBM-201564.xls - Supplemental material
Supplemental material, sj-xls-5-cbm-10.3233_CBM-201564.xls
sj-xls-6-cbm-10.3233_CBM-201564.xls - Supplemental material
Supplemental material, sj-xls-6-cbm-10.3233_CBM-201564.xls
sj-xls-7-cbm-10.3233_CBM-201564.xls - Supplemental material
Supplemental material, sj-xls-7-cbm-10.3233_CBM-201564.xls
sj-xls-8-cbm-10.3233_CBM-201564.xls - Supplemental material
Supplemental material, sj-xls-8-cbm-10.3233_CBM-201564.xls
sj-xls-9-cbm-10.3233_CBM-201564.xls - Supplemental material
Supplemental material, sj-xls-9-cbm-10.3233_CBM-201564.xls
sj-xls-10-cbm-10.3233_CBM-201564.xls - Supplemental material
Supplemental material, sj-xls-10-cbm-10.3233_CBM-201564.xls
sj-xls-11-cbm-10.3233_CBM-201564.xls - Supplemental material
Supplemental material, sj-xls-11-cbm-10.3233_CBM-201564.xls
Footnotes
Conflict of interest
The authors declare that they have no conflict of interest.