
Abstract
BACKGROUND:
Acute myeloid leukemia (AML) has a poor prognosis, and the current 5-year survival rate is less than 30%.
OBJECTIVE:
The present study was designed to identify the significant genes closely related to AML prognosis and predict the prognostic value by constructing a risk model based on their expression.
METHODS:
Using bioinformatics (Gene Ontology (GO) and Kyoto Encyclopedia of Genes and Genomes (KEGG) pathways, univariate and multivariate Cox regression analysis, Kaplan-Meier survival analysis, and receiver operating characteristic (ROC) analysis) to identify a prognostic gene signature for AML. Finally, The Cancer Genome Atlas (TCGA) database was used to validate this prognostic signature.
RESULTS:
Based on univariate and multivariate Cox regression analysis, eighteen prognostic genes were identified, and the gene signature and risk score model were constructed. Multivariate Cox analysis showed that the risk score was an independent prognostic factor [hazard ratio (HR)
CONCLUSIONS:
This study evaluated a potential prognostic signature with eighteen genes and constructed a risk model significantly related to the prognosis of AML patients.
Introduction
AML is a hematopoietic system malignant hyperplasia disease [1, 2]. The risk model and prognosis assessment are important in treating AML patients [3, 4, 5]. The treatment effect of patients with AML is still not optimistic, and the 5-year overall survival (OS) rate of patients is less than 30% [6].
AML is the most common acute leukemia in adults. Currently, chemotherapy is still the main treatment for AML patients, but around 70% of patients who have achieved remission eventually relapse and evolve into refractory leukemia, leading to treatment failure. Usually, patients diagnosed with AML often have severe clinical symptoms [7]. As a result, the disease progression of early untreated AML patients is very rapid, and the mortality rate is also very high [8]. Novel therapies for AML, including genetic and epigenetic targeted drugs, immunotherapies, and refinements of conventional cytotoxic chemotherapies, have significantly improved patient outcomes in recent years [9, 10, 11]. In addition, with the continuous exploration of the pathogenesis of AML at the cellular and molecular levels, the pathogenic genes of AML have been continuously discovered, and the development of new drugs for AML has also made new progress [12, 13, 14]. A previous study demonstrated that the co-inheritance of FLT3, CD177, and TTPAL contributed to AML [15]. Some researchers have found that fms-like tyrosine kinase 3 (FLT3) gene internal tandem duplications (FLT3-ITD) are frequently found in adult AML [16, 17, 18, 19]. AML patients with FLT3-ITD mutation have a higher relapse rate and poorer survival than AML patients without FLT3-ITD mutation [20, 21]. Previous studies have shown that FHL1 was a powerful prognostic candidate and potential therapeutic target in acute myeloid leukemia [22, 23]. Despite the continuous improvement of studies in this area, AML has not been completely cured or achieved an ideal survival duration in clinical practice [24], and the current prognostic evaluation system of AML is insufficient. Thus, the exploration of effective prognostic biomarkers is pivotal for improving the clinical outcomes of AML.
The present study was designed to pursue the molecular mechanism of AML using comprehensive bioinformatics analysis and build an applicable model to predict the survival probability of AML patients and provide new research ideas and potential targets for treating AML. To explore the genes related to the prognosis of AML patients, we obtained 187 bone marrow samples with AML and 37 normal bone marrow samples from the GDC TARGET database. We analyzed the RNA expression profiles of these samples and identified 1264 differentially expressed genes (DEGs). GO enrichment and KEGG pathway analyses performed functional annotations on these genes. We identified eighteen prognostic genes from GDC TARGET AML datasets using univariate Cox regression analysis. To predict the prognosis of AML, we constructed an eighteen prognostic genes signature using INPP4A, CFLAR, LNPEP, KLRF1, APAF1, UTRN, TNPO3, G3BP1, ZNF276, LPCAT1, PSD4, ADCY7, HECTD3, VPS52, ANAPC2, SPG11, PHRF1, and FAM111A. We divided AML patients into high-risk and low-risk groups according to the median risk score. OS analysis showed that AML patients in the high-risk group had a worse prognosis than those in the low-risk group. Finally, the TCGA database was used to validate this prognostic signature.
Materials and methods
The workflow of the model construction process
A brief workflow for this study is shown in Fig. 1.
The workflow of the model construction process.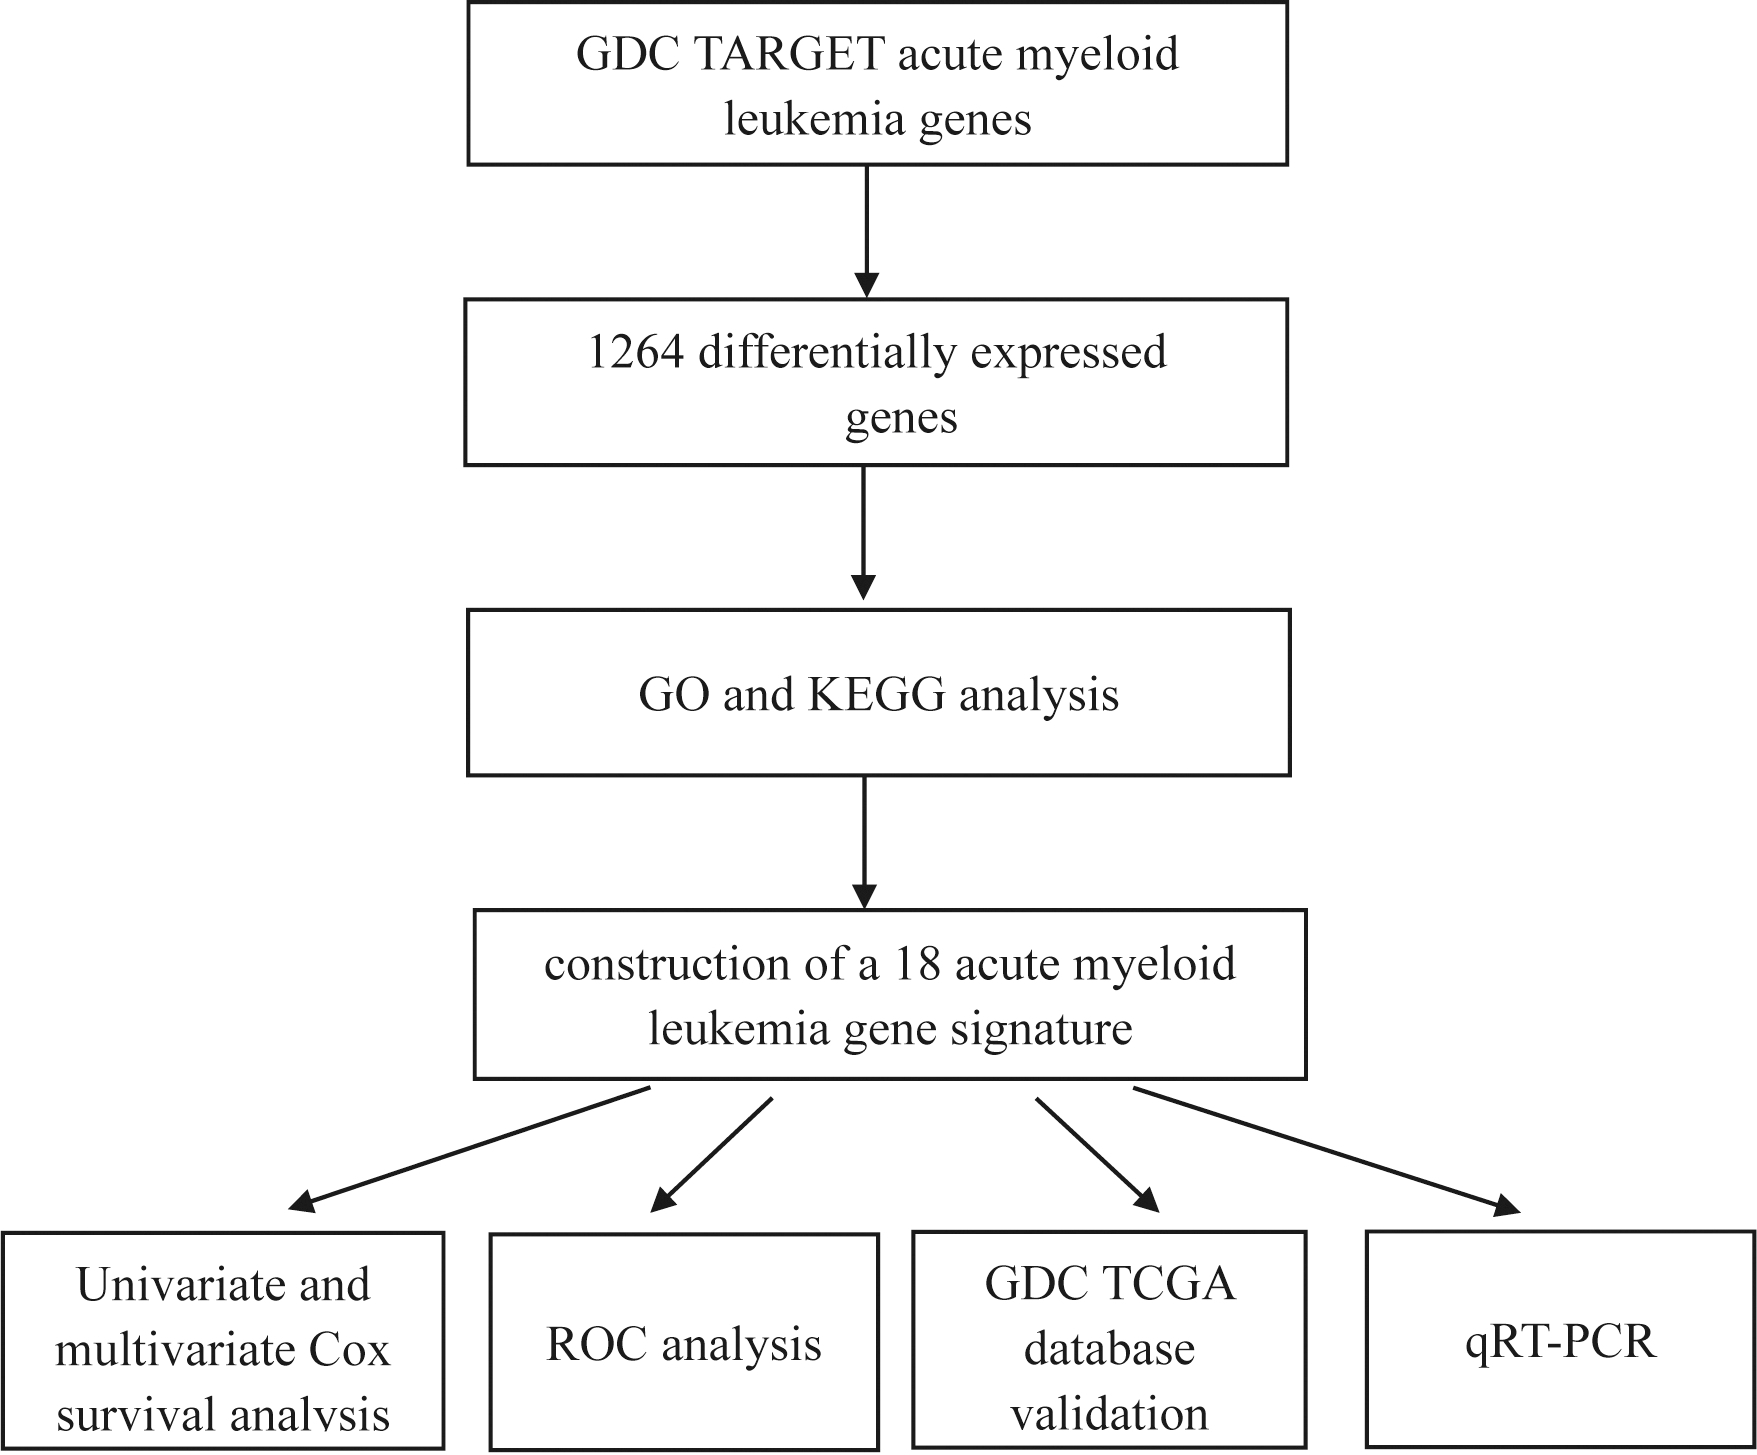
The normalized GDC TARGET-AML datasets (cohort: GDC TARGET-AML) were downloaded from UCSC Xena, which provides 187 AML patients with RNA expression profiles based on high-throughput sequencing (HTS) and detailed clinical information. The GDC TARGET-Bone Marrow Normal datasets were downloaded from the TCGA database. The TCGA database, which provides independent GDC TCGA AML datasets (cohort: GDC TCGA Acute Myeloid Leukemia), was utilized to validate this prognostic signature. Only samples whose sample identities (IDs) end in “A” were retained.
Cell culture
Human bone marrow stromal cell line HS-5 was cultured in DMEM supplemented with 10% heat-inactivated fetal bovine serum (FBS), 1% penicillin-streptomycin, and 2% L-Glutamine. Human acute myeloid leukemia cell line HL-60 was cultured in RPMI-1640 supplemented with 10% fetal calf serum (FCS), 100 units/ml penicillin, 100 mg/ml streptomycin, and 2 mM L-Glutamine. Cell cultures were maintained in a humidified incubator at 37.5
Functional enrichment analysis
The “tidyverse” and “DESeq2” packages [25] in R (version 4.1.2) were used to identify DEGs, then GO and KEGG analyses were performed using the packages of “tidyverse”, “BiocManager”, “org.Hs.eg.db”, and “clusterProfiler” in R [26].
Construction of the eighteen prognostic genes’ signature
Eighteen prognostic genes were identified using univariate Cox regression analysis by the packages of “tidyverse”, “survival” and “forest plot” in R. The predictive ability of these genes was assessed by the Kaplan-Meier survival analysis and log-rank test (
Quantitative real-time polymerase chain reaction (qRT-PCR)
qRT-PCR was used to verify the results. Five of the eighteen genes were validated between HS-5 and HL-60 cells. Total RNA was isolated from cells using TRIzol reagent (Tiangen Biotech, China). To obtain mRNA, total RNA was reverse transcribed to cDNA, and qRT-PCR was performed using a SYBR Green PCR Kit (TaKaRa Bio, Japan). The expression levels were analyzed using the 2
Statistical analysis
Our study used R software (version 4.1.2) to perform all statistical analyses. Univariate Cox regression analysis was performed for the DEGs to screen OS-associated genes. Multivariate Cox regression was used to construct a risk model. ROC analysis [33, 34] and the calculation of the AUC were analyzed by the “tidyverse”, “ROCR”, and “rms” packages of R software. A
Results
Characteristics of AML patients in the dataset from the GDC TARGET database
We obtained 187 patient samples and clinical information from the GDC TARGET database. Among them, 96 (51.3%) patients were female, and 91 (48.7%) were male. The age at initial diagnosis ranged from 0.4 to 22.6 years, with a median age of 8.8 years. The clinical characteristics of the patients are listed in Table 1, including white blood cell (WBC) count at diagnosis (
Characteristics of patients
Characteristics of patients
We compared 187 AML samples and 37 bone marrow normal samples from the GDC TARGET database. 1,264 DEGs were identified, including 693 significantly up-regulated genes and 571 significantly down-regulated genes, as shown in the heat map by the “tidyverse” and “pheatmap” packages of R software (Fig. 2A) and the volcano plot using the packages of “tidyverse”, “ggpubr” and “ggthemes” in R (Fig. 2B).
Identification of differentially expressed genes. (A) Heat map of differentially expressed gene expression levels in the GDC TARGET dataset. (B) Volcano plot for differentially expressed gene expression levels in GDC TARGET dataset.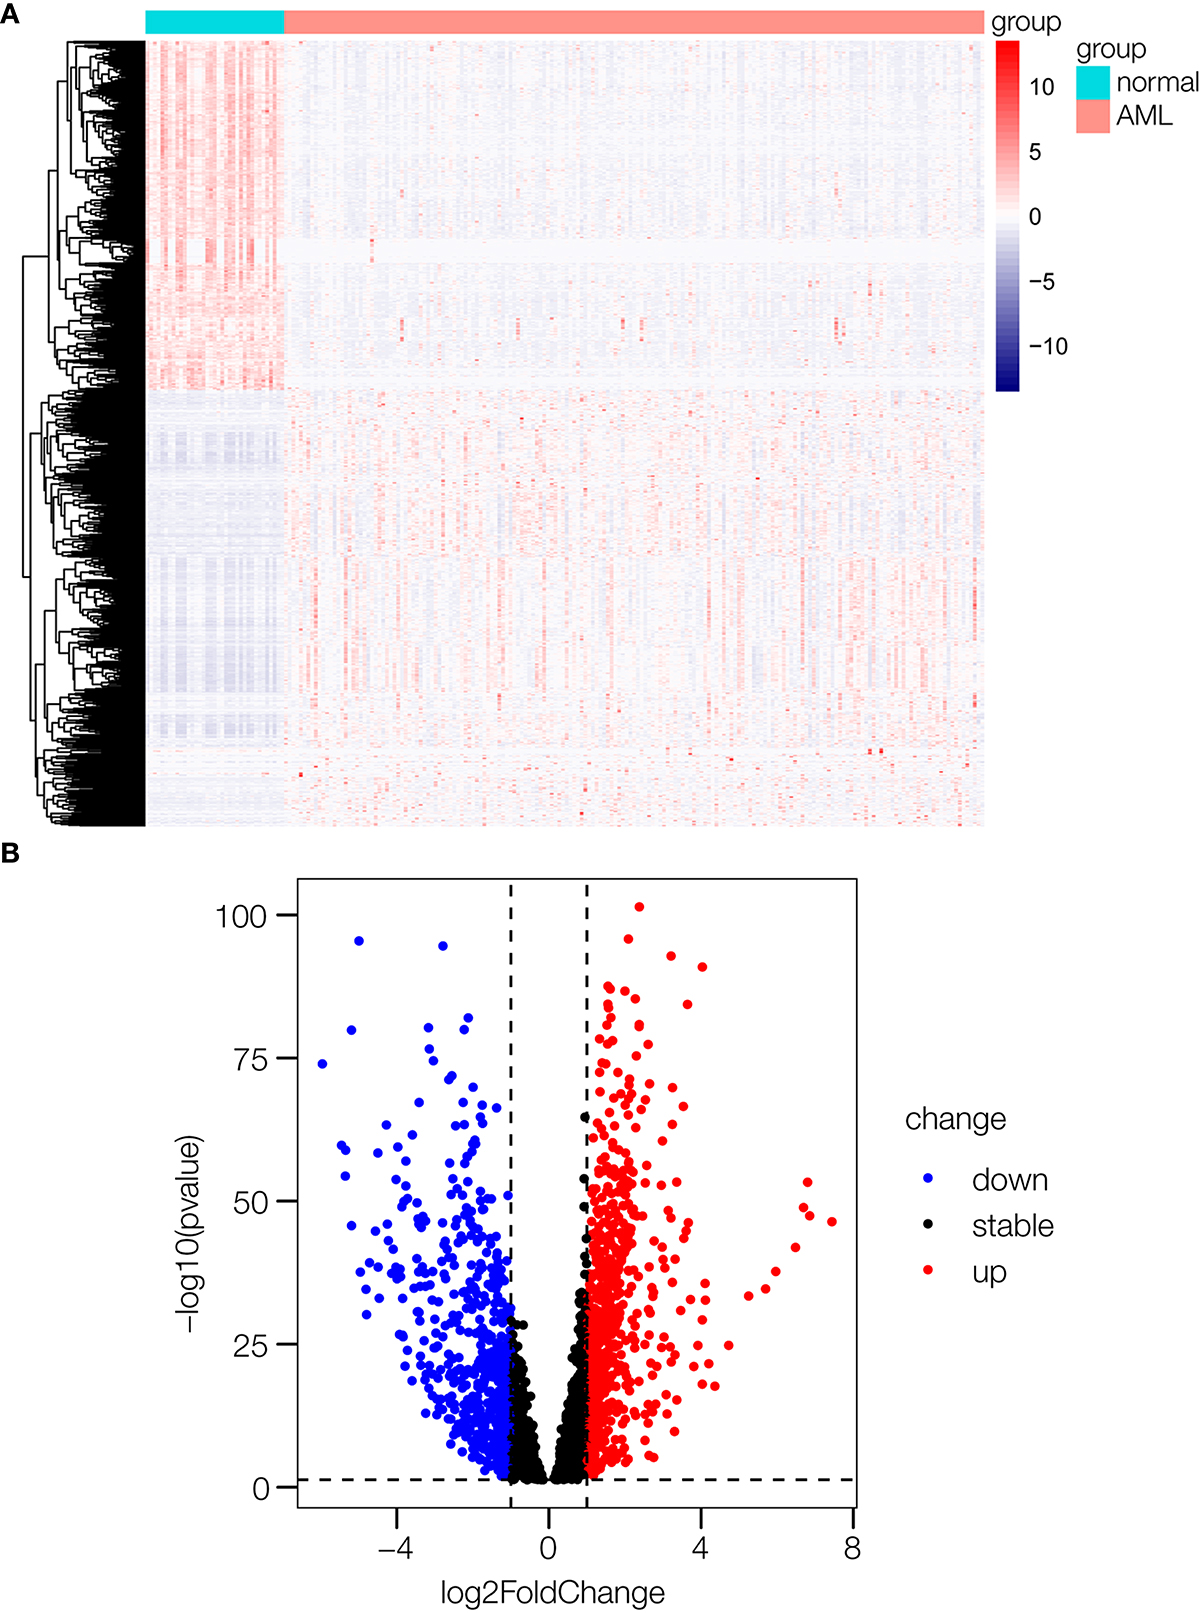
The R package “clusterProfiler” was used for GO enrichment and KEGG pathway analyses. Enriched results with a significant level at
Go and KEGG pathway enrichment analyses. (A) The GO analysis of 693 up-regulated genes. “BP” represents “biological process”, “CC” represents “cellular component”, and “MF” represents “molecular function”. (B) The GO analysis of 571 down-regulated genes. (C) KEGG analysis of 693 up-regulated genes. (D) KEGG analysis of 571 down-regulated genes.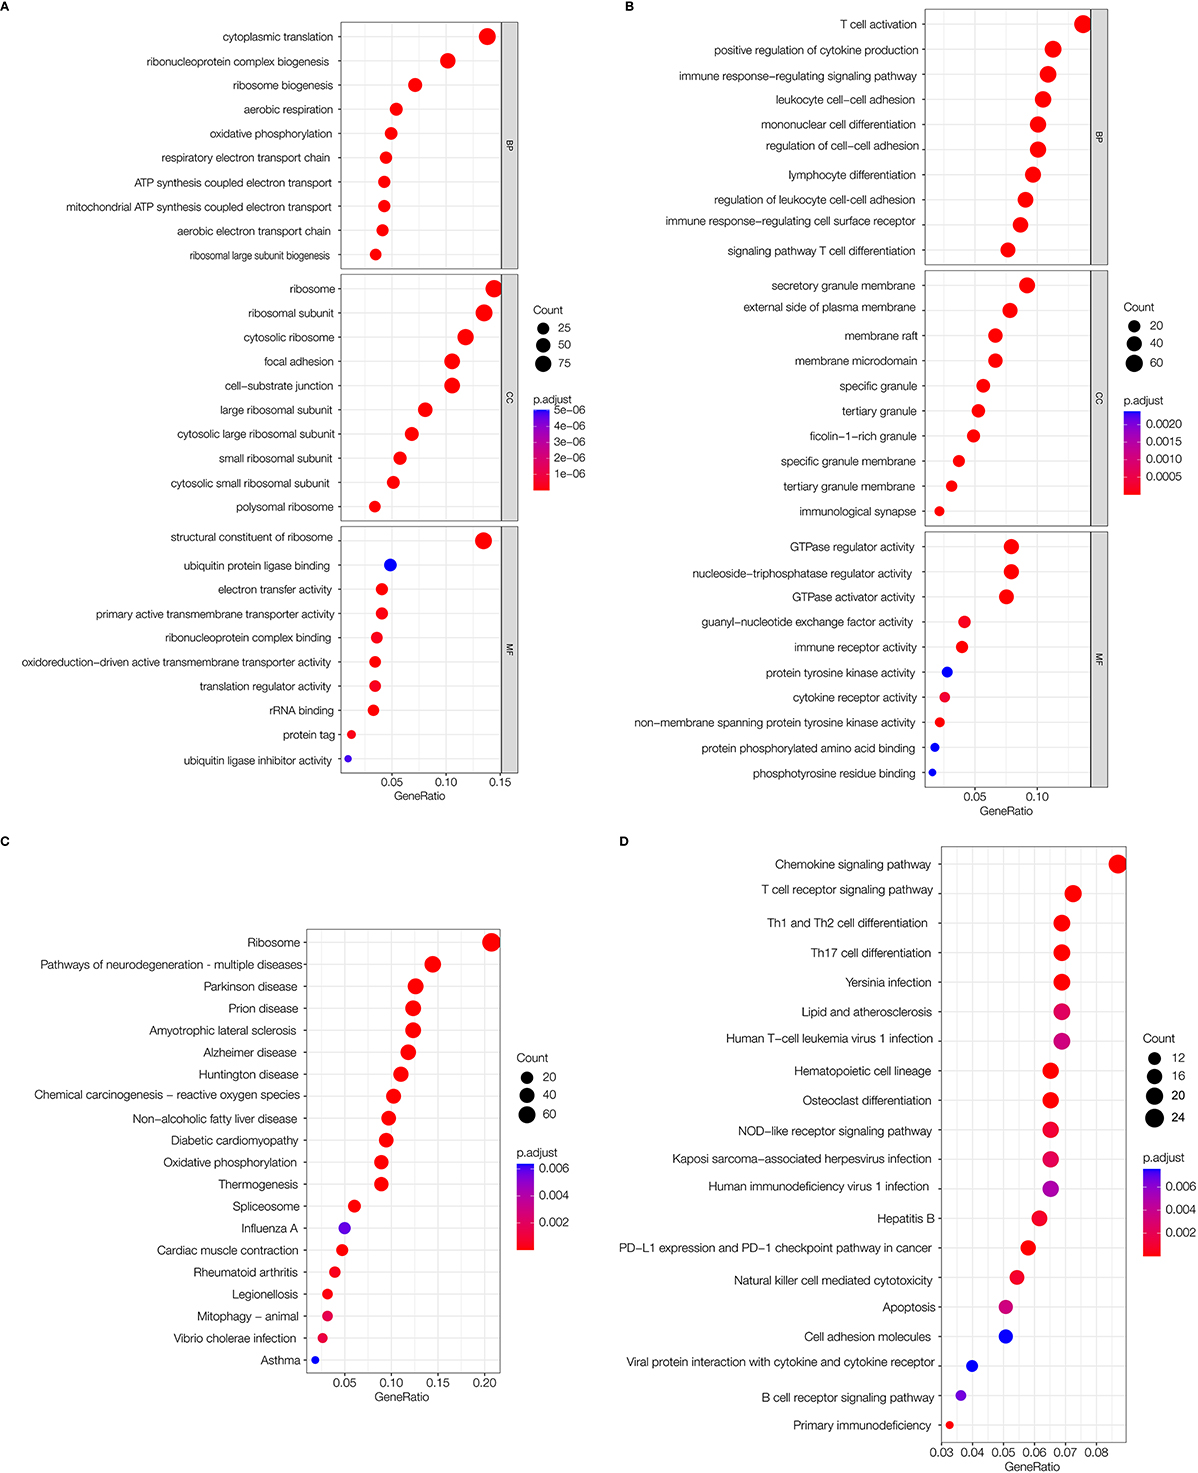
We screened out eighteen prognostic genes associated with AML using univariate Cox analysis (Fig. 5A). The significance level was
Kaplan-Meier survival analysis of AML gene signatures. (A) INPP4A. (B) CFLAR. (C) LNPEP. (D) KLRF1. (E) APAF1. (F) UTRN. (G) TNPO3. (H) G3BP1. (I) ZNF276. (J) LPCAT1. (K) PSD4. (L) ADCY7. (M) HECTD3. (N) VPS52. (O) ANAPC2. (P) SPG11. (Q) PHRF1. (R) FAM111A. 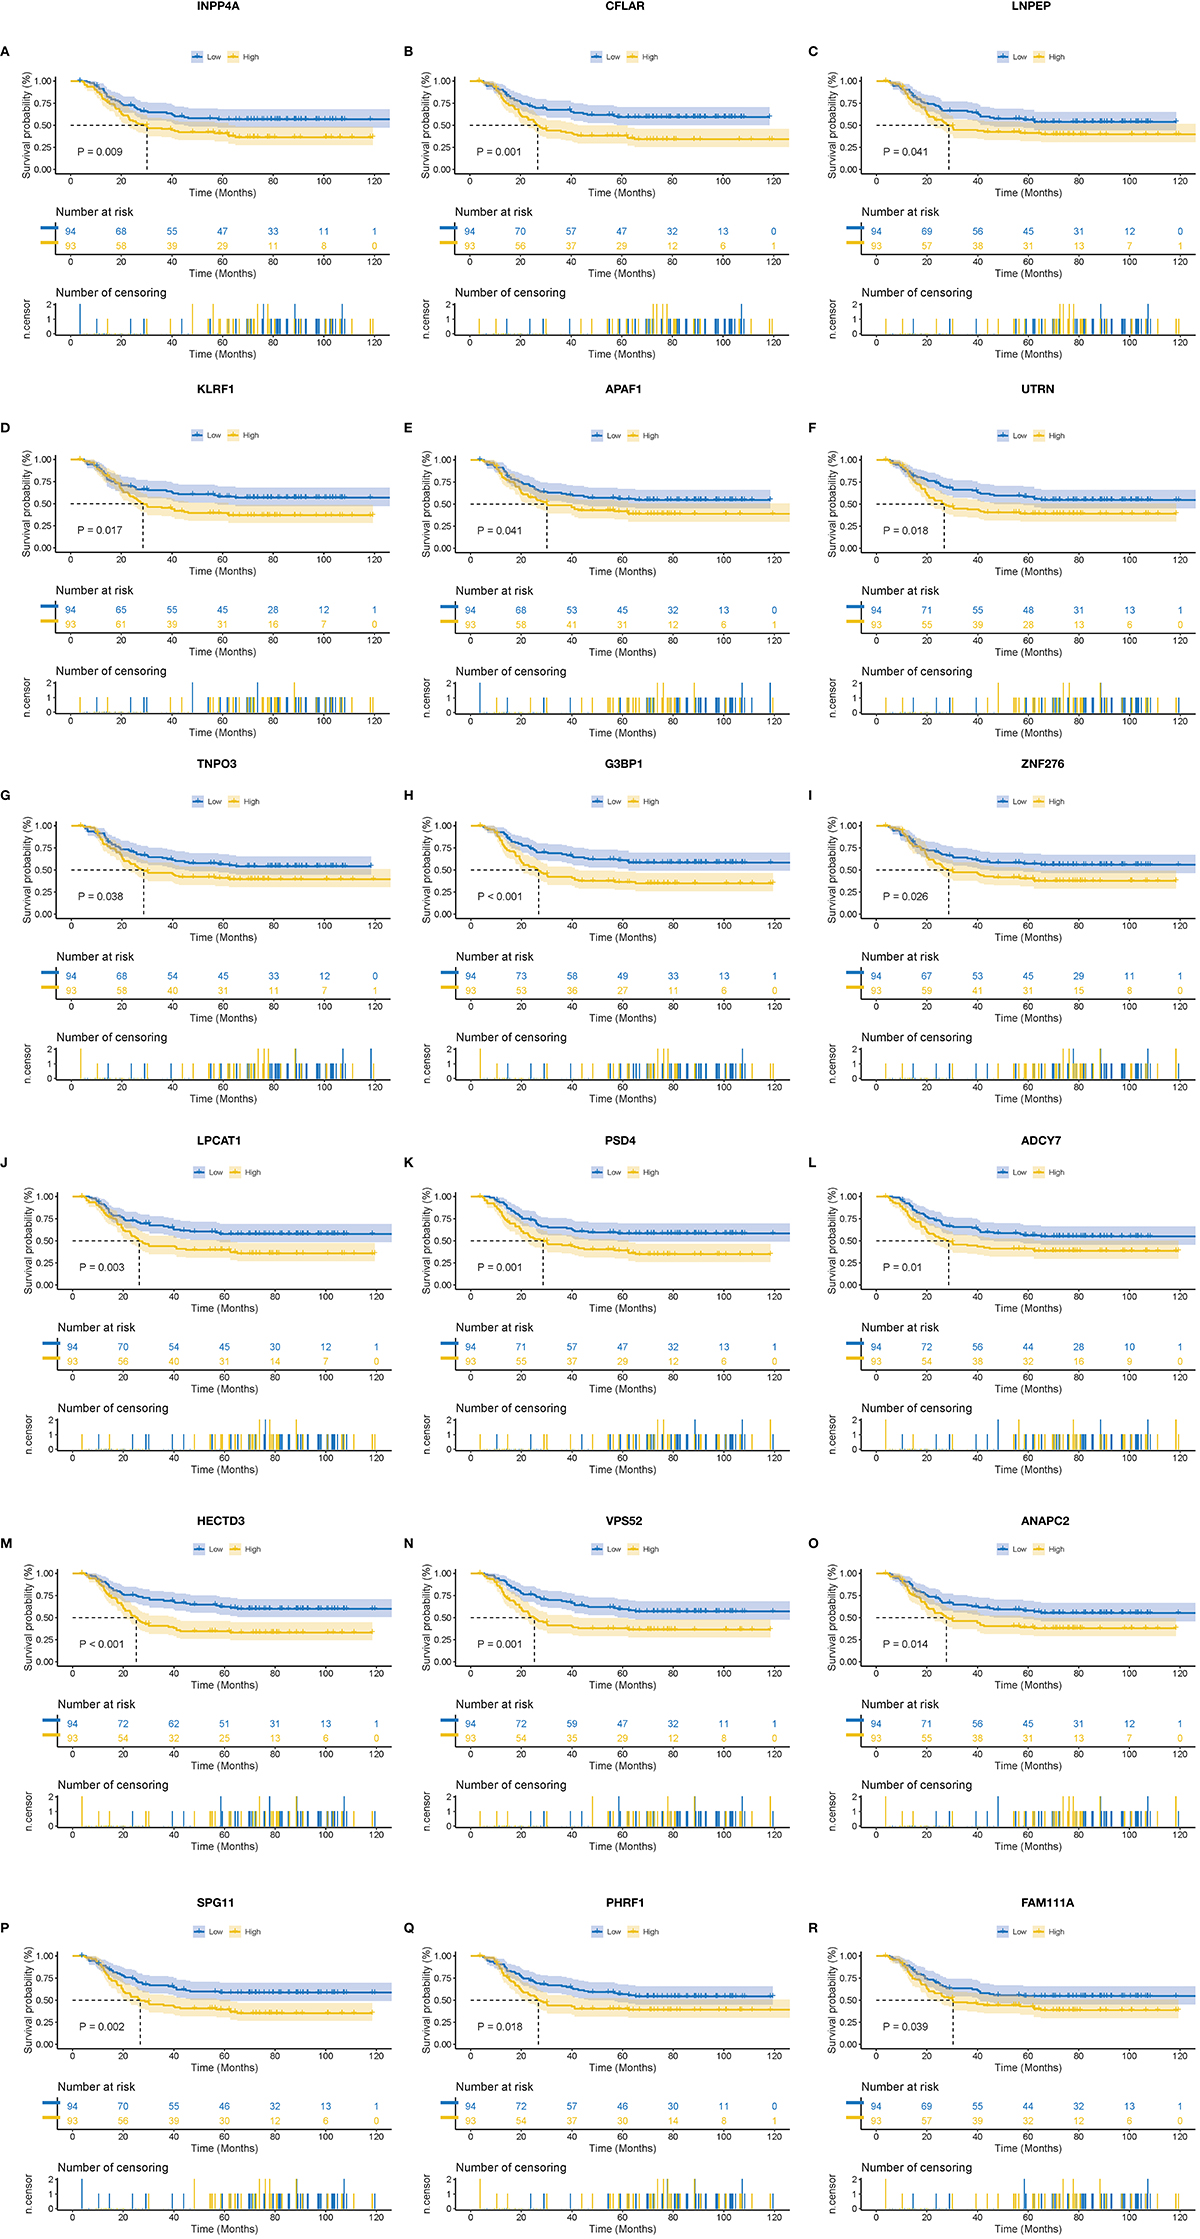
Regression analysis and characteristics of prognostic gene signatures. (A) Forest map of 18 prognostic genes by univariate Cox regression. (B) Distributions of risk scores in all samples. (C) Distribution of follow-up times in the training samples. (D) Heat map of gene expression in the prognostic signature of AML.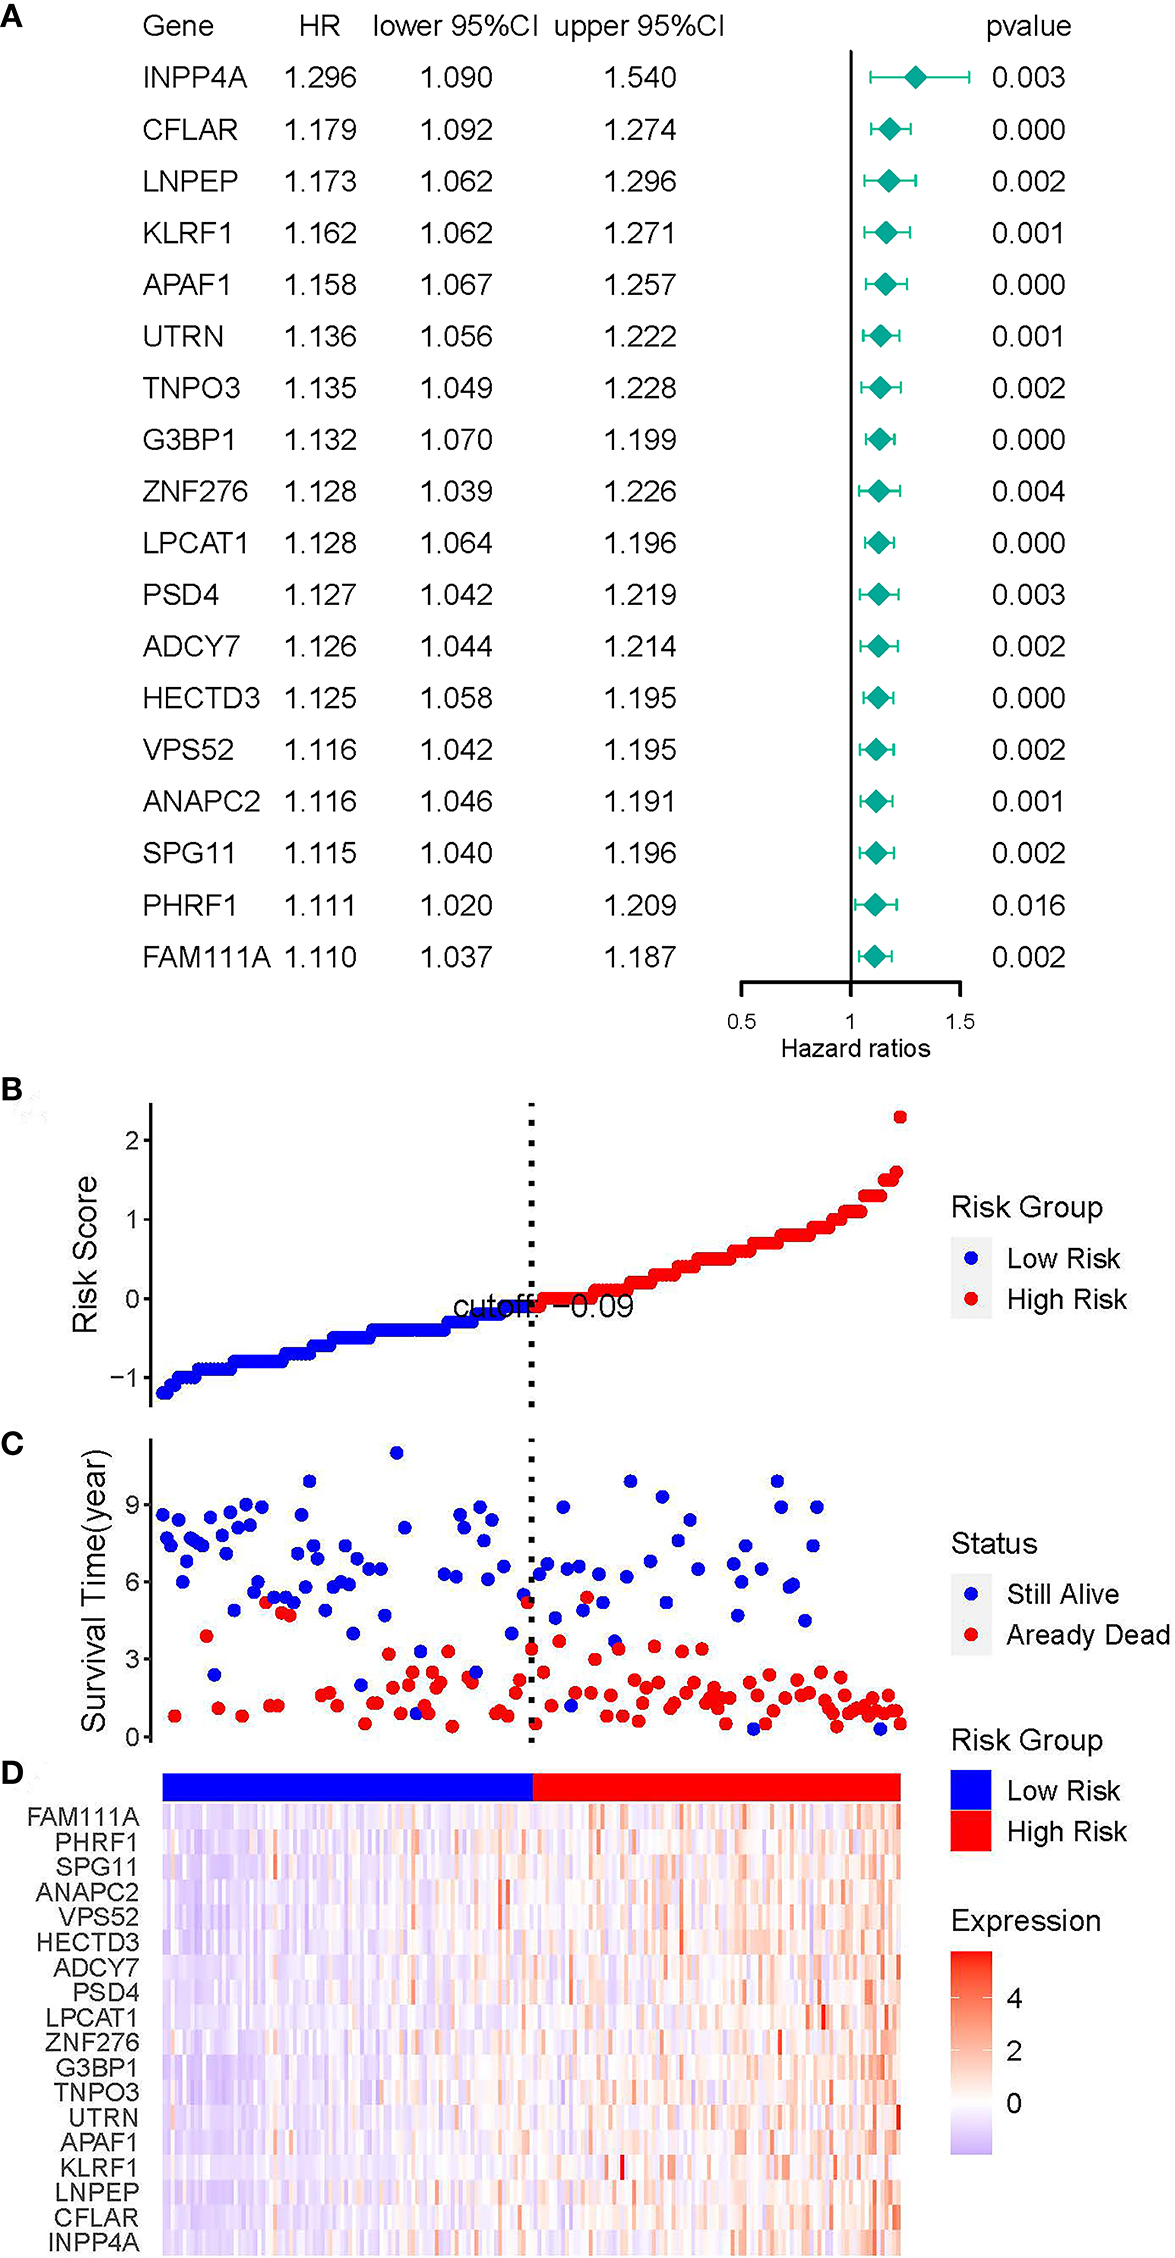
We construct a multivariate Cox regression model to explore the potential progonostic value of the eighteen genes. The coefficients of the eighteen genes are shown in Table 2. We used these genes to construct the risk model. The formula of the AML risk score [36] was constructed, integrating the gene expression value and the coefficients derived from multivariable Cox regression analysis. The formula was exhibited below: Risk score
Genes included in prognostic AML genes signature
Genes included in prognostic AML genes signature
Patients were divided into high-risk and low-risk groups based on the median risk score. As the risk score increased, the survival time of the patients tended to decrease, and the death rate of patients in the high-risk group was higher than that in the low-risk group. The risk score distribution, survival status, and heat map of genes are shown in Fig. 5B–D.
In the univariate Cox regression analysis, we found that age [HR
Cox proportional hazard regression analysis of AML risk factors. (A) Univariate Cox regression analysis of risk score and other indicators. (B) Multivariate Cox regression analyses of risk score and other indicators. (C) Kaplan-Meier analysis of GDC TARGET AML patients grouped according to median risk. (D) Multi-index ROC curve of risk score and other indicators.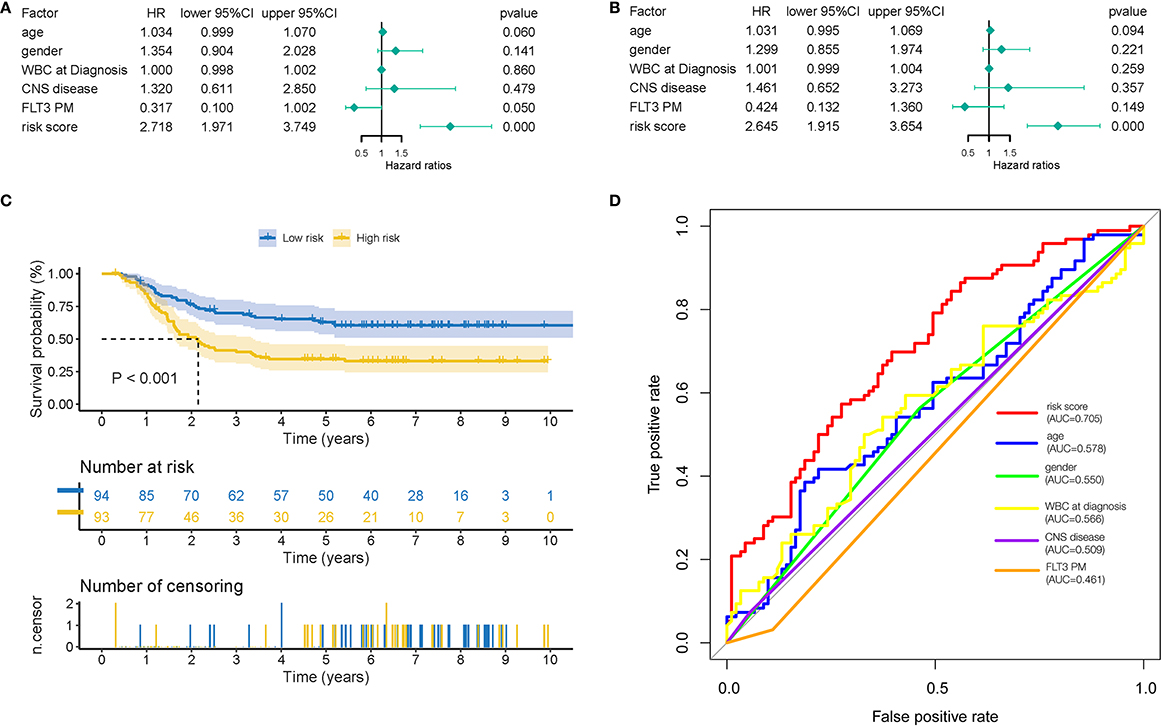
External verification of the prognostic AML gene signature. (A) Risk scores distribution. (B) Survival status of patients. (C) Heat map of gene expression pattern. (D) Kaplan-Meier plot for OS of patients in different risk groups. (E) ROC curve of risk score. (F) Validation of prognostic genes by qRT-PCR. 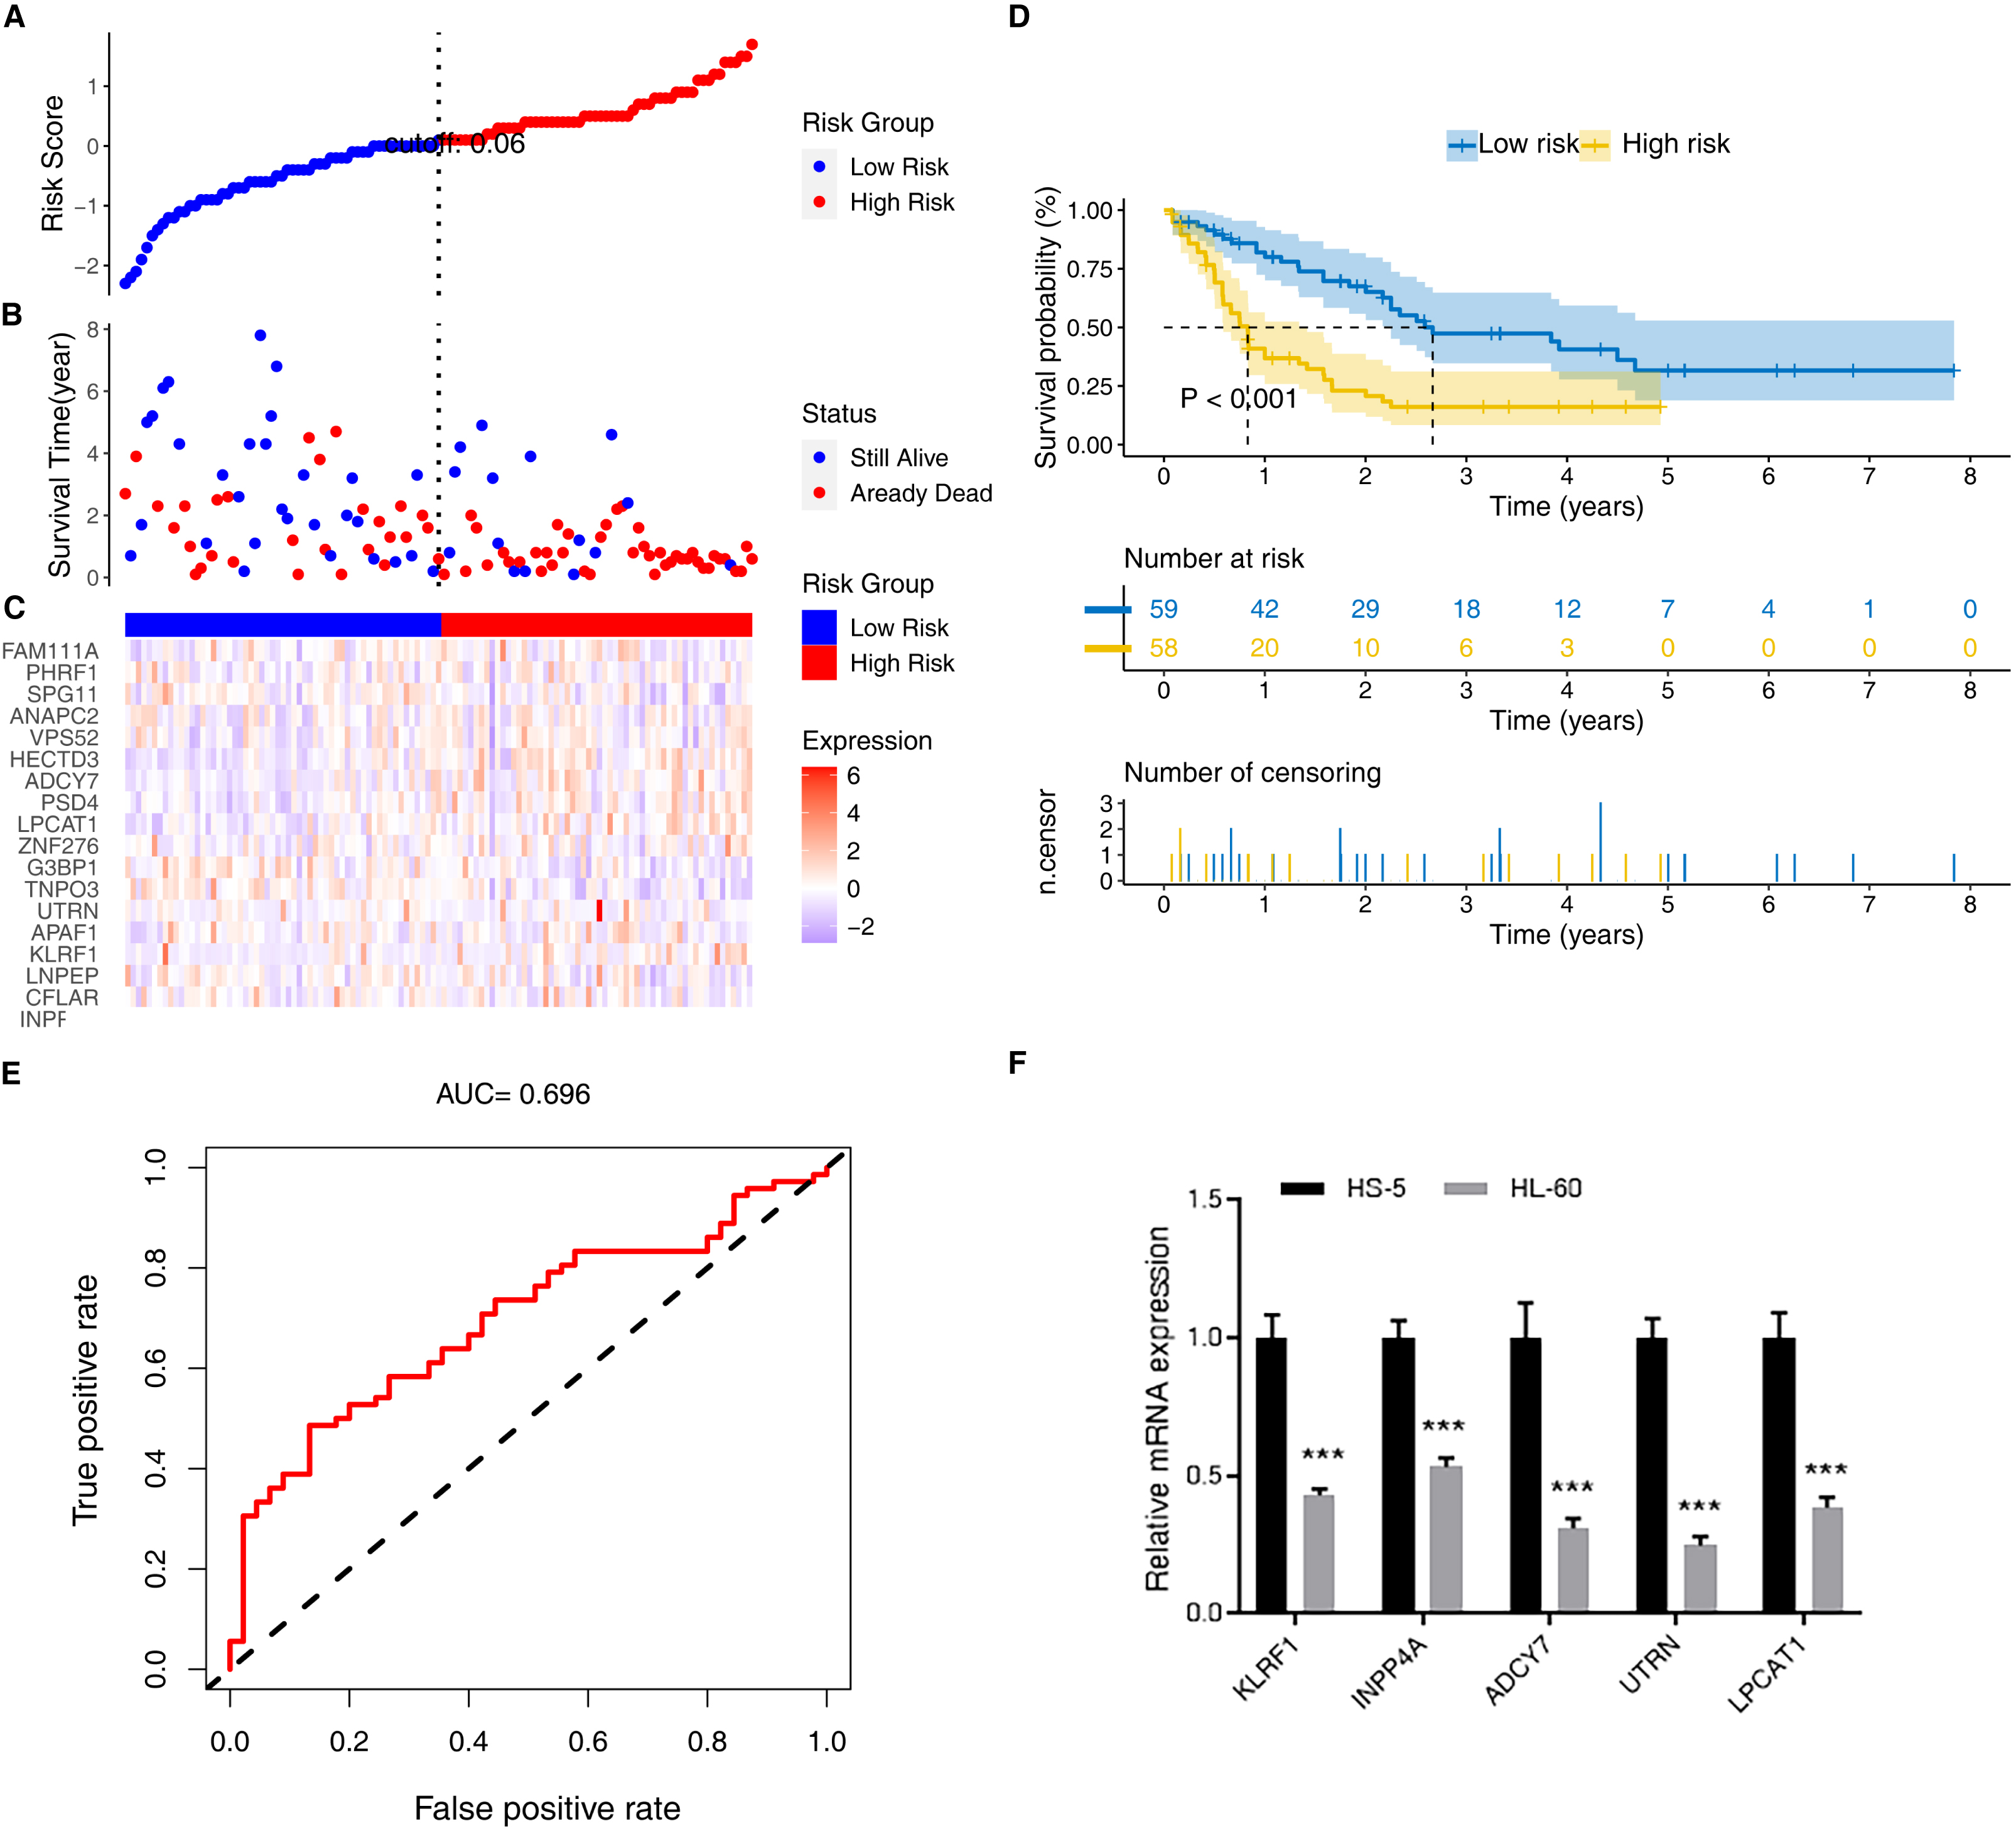
The GDC TCGA database validated the prognostic signature using the same risk score formula. The gene signature was tested in independent AML datasets.
The risk score distribution, survival status of patients, and gene expression pattern are shown in Fig. 7A–C. In the validation datasets, the Kaplan-Meier survival analysis showed that patients in the high-risk group had a significantly poorer OS than those in the low-risk group (Fig. 7D). In ROC analysis, the AUC of the ROC curve of risk score was 0.696, showing a good accuracy in predicting OS (Fig. 7E). These results showed that risk score was an independent prognostic factor for prognosis in patients with AML.
Experimental verification of prognostic genes in mRNA levels
To prove the accuracy and repeatability of the data, five genes were selected for qRT-PCR, as shown in Fig. 7F. The prognostic genes were successfully validated and showed a good correspondence with the transcriptome analysis results.
Discussion
Our study obtained 187 bone marrow samples with AML and 37 normal bone marrow samples from the GDC TARGET database. The significantly different expression levels of mRNAs in AML were calculated. The GO and KEGG analyses found that AML patients’ dysfunctions were primarily enriched in cytoplasmic translation, ribosome, and T-cell activation. Interestingly, a previous study demonstrated that T-cell function was impaired in AML [37]. Our study discovered that T cell activation is one of the pathways through which down-regulated genes were enriched, consistent with the previous study [38].
Meanwhile, up-regulated translation pathways, including cytoplasmic translation and ribonucleoprotein complex biogenesis [39], maybe a potential therapeutic target in AML, confirming previous studies that translational control can play a critical role in modulating gene expression [40, 41]. With univariate and multivariate Cox regressions, eighteen prognostic genes were identified. Finally, the signature of eighteen prognostic genes and a risk score model were constructed. Kaplan-Meier survival analysis was used to validate the prognostic value of the eighteen genes. The Kaplan-Meier plot for OS of AML patients showed that patients with predicted high risk had significantly shorter OS time than those with low risk. The AUC value of ROC of the risk score was higher than that of other clinical parameters, showing a high predictive value of the risk model.
Our study developed and validated the prognostic signature of eighteen genes using GDC TARGET and GDC TCGA databases. Then, INPP4A, CFLAR, LNPEP, KLRF1, APAF1, UTRN, TNPO3, G3BP1, ZNF276, LPCAT1, PSD4, ADCY7, HECTD3, VPS52, ANAPC2, SPG11, PHRF1, and FAM111A were identified. In the Multi-index ROC analysis of the training set, the AUC of the risk score was 0.705, showing a high predictive value of the risk model.
Among the eighteen AML prognostic genes, CFLAR, KLRF1, APAF1, G3BP1, LPCAT1, and ADCY7 have been associated with AML. The protein encoded by CFLAR (CASP8 and FADD-like apoptosis regulator) is an apoptosis regulator structurally similar to caspase-8. Previous studies demonstrated that patients with higher than median CFLAR mRNA expression had a significantly lower 3-year OS than those with low CFLAR expression. High CFLAR mRNA expression was potentially a biomarker of overall adverse survival in an adult AML patient cohort [42]. KLRF1 (killer cell lectin-like receptor, subfamily F, member1, KLRF1) is expressed on most NK cells’ surfaces and a part of T cells [43, 44, 45], stimulating cytotoxicity and cytokine secretion and was seldom reported involving leukemia. KLRF1 expression was significantly lower in AML patients than in non-malignant controls, which might be predominantly caused by the down-regulation of KLRF1 on NK cells or the decrease in NK cell numbers, companies with the reduced NK cell surveillance of tumors [46]. APAF1 (apoptotic peptidase activating factor 1) encodes a cytoplasmic protein that initiates apoptosis. Low expression of APAF-1XL, one of the APAF-1 transcripts in acute myeloid leukemia, may be associated with the failure of remission induction therapy [47]. G3BP1 (G3BP stress granule assembly factor 1) encodes one of the DNA-unwinding enzymes, which prefers partially unwound 3’-tailed substrates and can also unwind partial RNA/DNA and RNA/RNA duplexes in an ATP-dependent fashion. A previous study demonstrated that genomic profiling of acute myeloid leukemia associated with ataxia-telangiectasia identifies a complex karyotype with wild-type TP53 and mutant KRAS, G3BP1, and IL7R [48]. LPCAT1 (lysophosphatidylcholine acyltransferase, 1) encodes a member of the 1-acyl-sn-glycerol-3-phosphate acyltransferase family of proteins. The encoded enzyme plays a role in phospholipid metabolism, specifically in converting lysophosphatidylcholine to phosphatidylcholine in the presence of acyl-CoA. A previous study investigated the clinical implications of the expression of LPCAT family members in AML and demonstrated that LPCAT1 expression is significantly associated with the survival of patients with AML [49]. ADCY7 (adenylate cyclase 7) encodes a membrane-bound adenylate cyclase that catalyzes cyclic AMP formation from ATP and is inhibited by calcium. ADCY7 is a promising target for AML treatment, and high expression of ADCY7 correlates with poor survival of AML patients [50]. Based on this, we speculate that other genes may also have a guiding role in the prognosis of AML and have the potential to be used as new biomarkers for the diagnosis and prognosis of AML. We anticipate that our findings may help identify critical genes associated with AML and provide new ideas and prospective targets for treating AML. Our findings still need more clinical samples and broader prospective studies to validate further.
In summary, we identified eighteen feature genes tightly correlated with AML prognosis, and high expression levels of these genes were related to bad prognosis in AML patients. Meanwhile, a risk score model was developed and could be used to predict survival and applied to AML treatment and prognosis.
Author contributions
Conception: Jingxin Zhang.
Interpretation or analysis of data: Panpan Chen, Jiaming Cao, Lingling Chen, Guanfei Gao.
Preparation of the manuscript: Jingxin Zhang, Panpan Chen.
Revision for important intellectual content: Yuanlin Xu, Peijun Jia, Yan Li, Yating Li, Shijie Zhang, Jiangfeng Du.
Supervision: Jingxin Zhang.
Funding
This study was supported by the National Natural Science Foundation of China under Grants No. 81900111 and 81870095.
Footnotes
Acknowledgments
We acknowledge GDC TARGET and GDC TCGA databases for providing their platforms and contributors for uploading their meaningful datasets.