Post-hepatectomy liver failure (PHLF) is a severe complication of liver surgery in hepatocellular carcinoma (HCC) patients. Reduced lean body mass (LBM) decreases the immune activity and increases adverse clinical outcomes among cancer patients.
OBJECTIVE:
We aimed to assess the association between LBM and PHLF in HCC patients.
METHODS:
PHLF was defined and graded based on the International Study Group of Liver Surgery (ISGLS) criteria. Patients with Grade B or Grade C were included in PHLF Grade B group, while others in PHLF Grade B group. LBM was measured via preoperative computed tomography images. Binary logistic regression was applied for investigating the association between LBM and PHLF. The receiver operating characteristic curve was used to identify potential cut-off values and assess the predictive ability of the measured variables.
RESULTS:
The PHLF Grade B group had significantly lower LBM levels (means standard deviation: 57.0 14.1) than PHLF Grade B group (67.2 15.7) ( 0.001). After controlling other variables, LBM was an independent protective factor for PHLF Grade B (Odds Ratio: 0.406, 95% confidence interval: 0.172–0.957, 0.039). The prevalence of PHLF Grade B in each quartile of LBM was 29.4% (15/51), 25.5% (13/51), 19.2% (10/52) and 4.0% (2/50), respectively ( 0.001).
CONCLUSIONS:
LBM might be a protective factor for PHLF in HCC patients. Our findings might help to develop a novel strategy to reduce the occurrence of hepatic dysfunction following major liver resection. Multicentric prospective studies and further molecular biologic investigation are needed.
Post-hepatectomy liver failure (PHLF) is a severe complication of liver surgery in hepatocellular carcinoma (HCC) patients, with an incidence of 1.2% to 32% [1]. Ascites and hepatic encephalopathy are essential markers of liver failure, but they may be challenging to evaluate immediately after surgery [2]. According to the International Study Group of Liver Surgery (ISGLS), the deterioration of liver synthesis, excretion, and detoxification (increased international normalized ratio and bilirubin levels) after liver surgery (on or after day 5) is defined as PHLF [1]. Although many advances have been made in surgical techniques and perioperative management, PHLF is still the leading cause of postoperative death, 60–100% of all deaths [2, 3, 4, 5, 6]. Small remnant liver volume is one of the significant factors for PHLF morbidity and mortality [5]. Chemotherapy and intraoperative blood loss can also exacerbate liver dysfunction [7, 8]. Age, male, cholestasis, and diabetes are risk factors for developing PHLF [9, 10, 11, 12, 13, 14, 15].
Lean body mass (LBM) is defined as the mass of somatic cells, extracellular water and connective tissue between non-adipocytes, the primary source of biological proteins and essential for any cellular process [16]. Reduced LBM results from the imbalance of protein synthesis and catabolism, related to various diseases and non-disease states, including severe malnutrition and sarcopenia [17, 18, 19]. The loss of LBM and excessive protein catabolism can decrease the immune activity of cancer patients and increase the adverse clinical outcome [20]. Malnourished patients may have immune response-related defects and reduced ability to regenerate liver cells, leading to a high incidence of postoperative complications [21]. However, the relationship between LBM and postoperative liver failure is still unclear. Here, we aimed to assess whether LBM measured from preoperative CT images is associated with the development of PHLF in HCC patients after liver resection.
Material and methods
Experimental subjects
A group of 204 HCC patients who underwent liver resection between January 2016 and December 2017 from Harbin Medical University Cancer Hospital was included in this study. Inclusion criteria were: (1) age between 18 and 75 years old; (2) diagnosis of HCC was confirmed by histology; (3) Child-Pugh A or B liver function; and (4) Eastern Cooperative Oncology Group performance scores 2. Patients with intrahepatic cholangiocarcinoma, obstructive jaundice, metastatic hepatic carcinoma, other cancer, and any cancer treatment were excluded.
The study protocol was approved by the ethics committee of the Harbin Medical University Cancer Hospital, and written informed consent was obtained from all participants.
Body composition
Computed tomography (CT) was applied for each participant one week before surgery. One blinded researcher analyzed and evaluated the transverse CT image of the third lumbar vertebra (L3) in the inferior direction in an anonymized format. The cross-sectional area of total skeletal muscle (cm) (SMA) was quantified by using Hounsfield unit (HU) thresholds of 29 and 150. The skeletal muscle mass index (SMI) was calculated for the skeletal muscle mass: SMI cross-sectional areas of skeletal muscle (cm)/patient’s height (cm/m. Lean tissue was calculated for LBM: lean tissue (kg) (0.30 L3 total cross-sectional area of muscle mass (cm)) 6.06. Muscle quality was examined by intramuscular adipose tissue content (IMAC): IMAC CT attenuation value of the multifidus muscles (HU)/CT attenuation value of the subcutaneous fat (HU). Subcutaneous adipose tissue area was calculated from extra-muscular tissue with a density between 190 and 30 HU and visceral adipose tissue from non-subcutaneous tissue with a density between 150 and 50 HU. Subcutaneous adipose tissue was evaluated by calculated by the formula: subcutaneous adipose tissue area (cm)/patient’s height (cm/m). Visceral adiposity was evaluated by the VSR: VSR visceral adipose tissue area (cm)/subcutaneous adipose tissue area (cm).
Post-hepatectomy liver failure
PHLF and grading for PHLF severity were determined according to the criteria of ISGLS [1]. Patients with Grade B or Grade C were included in PHLF Grade B group, while others in PHLF Grade B group.
Demographic and clinicopathohistological data
All demographic data and clinicopathohistological data were collected based on the medical records system, including age, gender, body mass index (BMI), hepatitis B surface antigen (HBsAg), hepatitis, cirrhosis, transfusion during surgery, Child Pugh score, tumor size, and tumor number. Biochemical data included fibrosis-4 (FIB-4), aspartate aminotransferase to platelet ratio index (APRI), platelet-albumin-bilirubin (PALBI), albumin-bilirubin (ALBI), alpha fetoprotein (AFP), white blood cells (WBC), platelet count, hemoglobin, creatinine, albumin, alanine aminotransferase (ALT), aspartate transaminase (AST), gamma-glutamyl transferase (-GGT) levels, and total bilirubin. Model for End-Stage Liver Disease (MELD) Score and were calculated for each patient, using online website www.mayoclinic.org/gi-rst/mayomodel5.html. Major hepatectomy was defined as liver resection with more than four segments, while minor hepatectomy as three or fewer liver segments. The ratio of the future liver remnant volume (FLRV%) was calculated by dividing the volume of the future liver remnant by the total functional liver volume (FLRV/TLV) and expressed as percentage (%) [22].
Statistical analyses
All statistical analyses were applied using SPSS Statistics version 25.0 (SPSS Inc., Chicago, IL, USA). Categorical variables were reported with number with percentages and compared using Pearson analysis. Means standard deviation (SD) were reported for continuous data with normal distribution, and the median with interquartile range (IQR) for non-normally distributed continuous data. The Student test was used to compare normally distributed continuous data, and Mann-Whitney test for non-normally distributed continuous data. To identify the predictors for the presence of PHLF, binary logistic regression was performed. Univariate logistic regression analysis was used to screen the factors for association with PHLF. All variables with a statistically significant univariate association ( 0.10) were included in the multivariate analysis. Multivariate logistic regression analysis was applied to identify the independent factors. A stepwise backward elimination approach was employed ( 0.05 to enter and 0.10 to be removed). Adjusted odds ratios (ORs) and 95% confidence intervals (CI) for each variable were presented. Receiver operating characteristic (ROC) curve was used to identify potential cut-off values and assess the predictive ability of the measured variables. The area under the curve (AUC) and 95% confidence interval (CI) were calculated by using MedCalc version 15.0. Values with 0.05 were considered significant.
Results
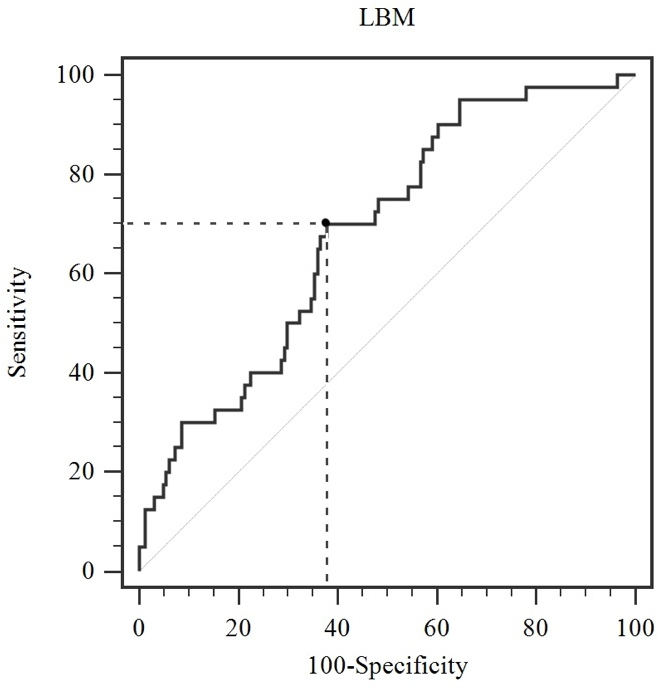
Optimal cut-off value determined for lean body mass based on the Youden index in receiver operating characteristic curve. Legend: cut-off value: 62.2 kg; LBM, lean body mass.
The characteristics of hepatocellular carcinoma patients stratified by post-hepatectomy liver failure Grade B status
Variables
PHLF Grade B
PHLF Grade B
-value
164
40
Age (years)
53.4 9.3
59.3 8.7
0.001
BMI (kg/m
24.4 3.1
23.3 2.9
0.028
Sex (male, %)
134 (81.7)
30 (75.0)
0.203
HBsAg (, %)
129 (78.7)
29 (72.5)
0.403
Hepatitis C (, %)
12 (7.3)
7 (17.5)
0.047
Cirrhosis (, %)
133 (81.1)
36 (90.0)
0.181
Child Pugh score (B, %)
8 (4.9)
8 (25.0)
0.001
Transfusion during surgery (, %)
39 (20.1)
18 (29.7)
0.007
FLRV% (%)
48.1 (36.2–53.6)
40.3 (29.3–50.7)
0.008
Tumor size (cm)
4.6 3.1
6.3 3.7
0.003
Tumor number
1 (1–1)
1 (1–1)
0.440
MELD score
1.09 (2.70 to 0.52)
1.17 (2.47 to 0.69)
0.955
Preoperative FIB-4
2.0 (1.4–3.0)
2.7 (2.0–4.3)
0.003
APRI
0.5 (0.3–0.9)
0.7 (0.4–1.4)
0.014
PALBI
5.0 (5.4 to 4.6)
5.0 (5.4 to 4.2)
0.572
ALBI
2.5 (2.7 to 2.3)
2.4 (2.7 to 2.0)
0.093
AFP (ng/mL)
17.0 (4.4–342.5)
25.5 (4.9–1207.3)
0.184
WBC ( 10/L)
5.47 1.96
5.05 2.04
0.223
Platelet count ( 10/L)
164.7 103.7
162.2 80.1
0.833
Hemoglobin (g/L)
144.0 14.0
135.4 14.7
0.001
Creatinine (mol/L)
80.2 12.8
77.0 20.7
0.218
Albumin (g/L)
38.5 4.0
37.1 4.8
0.095
AST (U/L)
30 (22–44)
40 (31–54)
0.001
ALT (U/L)
32 (20–47)
41 (26–59)
0.077
-GGT (U/L)
48 (31–91)
85 (42–137)
0.120
Total bilirubin (mol/L)
15.4 (11.8–20.5)
15.2 (12.6–19.0)
0.757
Means standard deviation or median with interquartile range was used for continuous data, and number with percentage for categorical data. BMI, body mass index; HBsAg, hepatitis B surface antigen; FLRV%, ratio of the future liver remnant volume; MELD score, Model for End-Stage Liver Disease score; FIB-4, Fibrosis-4; ARPI, androgen receptor pathway inhibition; PALBI, platelet-albumin-bilirubin; ALBI, albumin-bilirubin; AFP, Alpha Fetoprotein; WBC, white blood cells; AST, aspartate transaminase; ALT, alanine aminotransferase; -GGT, gamma-glutamyl transferase; PHLF, post-hepatectomy liver failure; HCC, hepatocellular carcinoma.
PHLF Grade B occurred in 40 of 204 patients (19.6%), including 28 patients with Grade B and 12 patients with Grade C. The characteristics of the participants according to PHLF Grade B status were presented in Table 1. Increased age, Child Pugh score, nodule diameter, FIB-4, APRI, AST and -GGT levels were found in PHLF Grade B group. Patients with PHLF Grade B had a significantly increased rate of intraoperative transfusion and hepatitis C. BMI, FLRV% and hemoglobin levels were statistically decreased in PHLF Grade B group. The characteristics of body composition in HCC patients stratified by PHLF Grade B status are summarized in Table 2. Preoperative SMA, SMI and LBM levels were lower in PHLF Grade B group than Grade B group. To detect PHLF Grade B, when the optimal cut-off value based on the Youden index in ROC curve is 62.2 kg for LBM, the cut-off value corresponds to the sensitivity of 70.0%, the specificity of 62.2%, and Area Under Curves (AUCs) of 0.682 (95% confidence interval [CI]: 0.613–0.745) ( value 0.001) (Fig. 1). Baseline characteristics of the participants according to LBM were presented in Table 3. Women were more likely to have the LBM 62.2 kg ( 0.001). Significant difference was observed in albumin, creatinine, hemoglobin, WBC, AFP, ALBI, FIB-4, MELD score and BMI between two groups by LBM status ( 0.05).
The characteristics of body composition in hepatocellular carcinoma patients stratified by post-hepatectomy liver failure Grade B status
Variables
PHLF Grade B
PHLF Grade B
-value
164
40
SFA (cm
148.5 86.0
129.9 77.1
0.211
SFI (cm/m
53.1 32.6
49.0 29.4
0.472
VFA (cm
105.1 75.5
95.1 70.3
0.449
TAT (cm
253.6 139.4
224.9 131.6
0.240
VSR
0.654 (0.352–0.980)
0.614 (0.438–1.038)
0.685
SMA (cm
203.1 52.1
169.9 46.9
0.001
SMI (cm/m
71.8 17.4
63.5 17.6
0.007
IMAC
0.566 (0.635 to 0.512)
0.566 (0.629 to 0.501)
0.446
SMD (HU)
50.9 5.5
49.0 11.9
0.136
LBM (kg)
67.2 15.7
57.0 14.1
0.001
Means standard deviation or median with interquartile range was used for continuous data. SFA, subcutaneous fat tissue area; SFI, skeletal muscle index; VFA, visceral fat tissue area; TAT, total adipose tissue; VSR, visceral-to-subcutaneous adipose tissue area ratio; SMA, skeletal muscle area; SMI, skeletal muscle index; IMAC, intramuscular adipose tissue content; SMD, skeletal muscle radiodensity; LBM, lean body mass; PHLF, post-hepatectomy liver failure.
The characteristics of hepatocellular carcinoma patients stratified by lean body mass status
Variables
LBM 62.2 kg
LBM 62.2 kg
-value
90
114
Age (years)
56.6 8.9
52.9 9.3
0.005
BMI (kg/m
23.0 2.6
25.1 3.1
0.028
Sex (male, %)
57 (63.3)
107 (93.9)
0.001
HBsAg (, %)
71 (78.9)
87 (76.3)
0.662
Hepatitis C (, %)
9 (10.0)
9 (7.9)
0.599
Cirrhosis (, %)
74 (82.2)
95 (83.3)
0.834
Child Pugh score (B, %)
9 (10.0)
7 (6.1)
0.309
Transfusion during surgery (, %)
28 (31.1)
29 (25.4)
0.370
FLRV% (%)
45.5 (32.0–51.0)
48.0 (37.5–53.0)
0.167
Tumor size (cm)
5.0 3.2
4.8 3.4
0.727
Tumor number
1 (1–1)
1 (1–1)
0.624
MELD score
0.91 (2.38 to 0.87)
1.63 (2.74 to 0.13)
0.017
Preoperative FIB-4
2.2 (1.5–4.1)
2.0 (1.3–3.0)
0.040
APRI
0.6 (0.3–1.2)
0.6 (0.3–1.0)
0.492
PALBI
5.0 (5.4 to 4.4)
5.0 (5.4 to 4.6)
0.336
ALBI
2.5 (2.6 to 2.1)
2.5 (2.7 to 2.3)
0.017
AFP (ng/mL)
31.3 (5.5–1105.0)
12.0 (4.2–224.7)
0.023
WBC ( 10/L)
4.92 1.85
5.76 2.01
0.003
Platelet count ( 10/L)
155.1 67.8
171.4 118.3
0.245
Hemoglobin (g/L)
136.6 14.0
146.9 13.3
0.001
Creatinine (mol/L)
82.7 12.9
75.5 15.9
0.001
Albumin (g/L)
37.3 4.1
39.0 4.1
0.003
AST (U/L)
32 (22–50)
35 (25–44)
0.667
ALT (U/L)
31 (18–46)
35 (24–52)
0.173
-GGT (U/L)
48 (32–109)
59 (33–99)
0.636
Total bilirubin (mol/L)
15.2 (12.1–18.1)
15.4 (11.8–20.9)
0.385
Means standard deviation or median with interquartile range was used for continuous data, and number with percentage for categorical data. BMI, body mass index; HBsAg, hepatitis B surface antigen; FLRV%, ratio of the future liver remnant volume; MELD score, Model for End-Stage Liver Disease score; FIB-4, Fibrosis-4; ARPI, androgen receptor pathway inhibition; PALBI, platelet-albumin-bilirubin; ALBI, albumin-bilirubin; AFP, Alpha Fetoprotein; WBC, white blood cells; AST, aspartate transaminase; ALT, alanine aminotransferase; -GGT, gamma-glutamyl transferase; LBM, lean body mass.
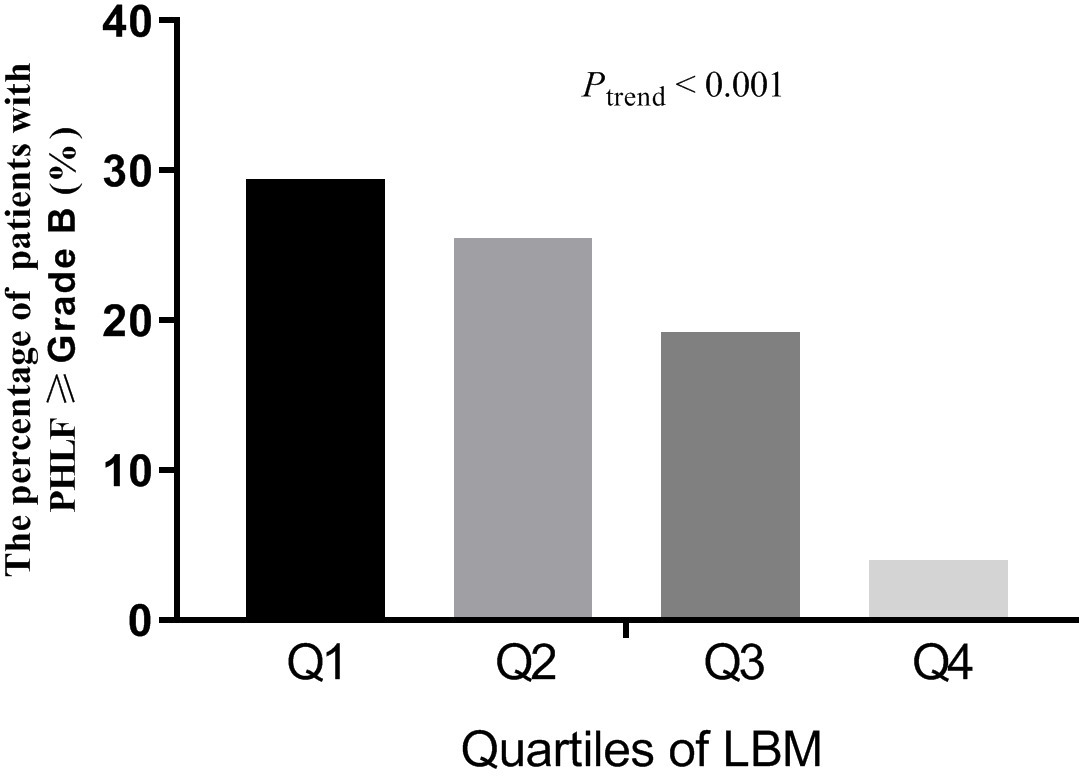
The percentages of post-hepatectomy liver failure Grade B according to quartiles of lean body mass. Legend: Q, quartile; LBM, lean body mass; PHLF, post-hepatectomy liver failure.
Binary logistic regression was applied to identify the association between LBM and PHLF Grade B (Table 4). In the univariate logistic regression analysis, age, BMI, Child Pugh score, hepatitis C, AST, hemoglobin, tumor size, FIB-4, APRI, FLRV%, transfusion during surgery, SMA, SMI, and LBM were significantly associated with PHLF Grade B. All variables with a statistically significant univariate association ( 0.10) were included in the multivariate logistic regression analysis using a stepwise backward elimination approach. The results revealed that LBM (OR: 0.406, 95% CI: 0.172–0.957, 0.039) were independently associated with PHLF Grade B, after adjusting age, hepatitis C, APRI, and FLRV%.
The association between lean body mass and post-hepatectomy liver failure Grade B with binary logistic regression
COR (95% CI)
-value
AOR (95% CI)
-value
Age (years)
1.082 (1.035–1.131)
0.001
1.088 (1.032–1.147)
0.002
BMI (kg/m
0.872 (0.771–0.987)
0.03
Child Pugh score (B vs A)
4.875 (1.704–13.948)
0.003
Hepatitis C (positive vs negative)
2.950 (1.064–8.179)
0.038
3.724 (1.015–13.662)
0.047
AST (U/L)
1.015 (1.004–1.027)
0.008
Hemoglobin (g/L)
0.960 (0.936–0.984)
0.001
0.974 (0.944–1.004)
0.092
Tumor size (cm)
1.149 (1.045–1.263)
0.004
FIB-4
1.226 (1.040–1.445)
0.015
0.715 (0.483–1.058)
0.094
APRI
1.961 (1.186–3.244)
0.009
3.347 (1.196–9.367)
0.021
Transfusion during surgery (Yes, versus No)
2.622 (1.277–5.383)
0.009
FLRV% (%)
0.065 (0.007–0.632)
0.019
0.041 (0.003–0.554)
0.016
SMA (cm
0.986 (0.978–0.994)
0.001
SMD (HU)
0.953 (0.898–1.012)
0.119
SMI (cm/m
0.970 (0.948–0.992)
0.008
LBM (kg)
0.954 (0.930–0.979)
0.001
0.406 (0.172-0.957)
0.039
Variables associated with post-hepatectomy liver failure (PHLF) with 0.05 in Table 1 and Table 2 were considered in binary logistic regression. The crude odds ratio (COR) with 95% confidence interval (CI) in univariate analysis and adjusted odds ratio (AOR) with (95% CI) in multivariate analysis were shown for variables with significance. BMI, body mass index; AST, aspartate transaminase; FIB-4, fibrosis-4; APRI, aspartate aminotransferase to platelet ratio index; FLRV%, ratio of the future liver remnant volume; SMA, skeletal muscle area; SMD, skeletal muscle radiodensity; SMI, skeletal muscle index; LBM, lean body mass.
We classified the patients into equal quartiles according to the LBM levels. The 25th, 50th, and 75th LBM percentiles were 53.2, 66.0, and 75.3 kg, respectively. The prevalence of PHLF Grade B is calculated by the quartiles of LBM (Fig. 2). The prevalence rate of PHLF Grade B in Q1 was markedly higher than that in Q2, Q3 and Q4. The prevalence rate of PHLF Grade B in Q1, Q2, Q3 and Q4 was 29.4% (15/51), 25.5% (13/51), 19.2% (10/52) and 4.0% (2/50), respectively ( 0.001).
Discussion
PHLF is a serious complication after hepatectomy, with a high incidence, which can lead to postoperative death [23]. It is essential to develop new, reliable, non-invasive methods to assess liver function and cirrhosis, and to predict the risk of PHLF before liver resection. This study found that after controlling for other variables, the risk of PHLF increases as LBM decreases. In contrast, increased age, FLRV%, hepatitis C, and APRI levels were risk factors for PHLF.
The evaluation of liver function before surgery is very helpful for predicting PHLF [23]. Several routine preoperative biochemical measurements (albumin, bilirubin, aminotransferase, -GGT, and alkaline phosphatase) are often regarded as liver dysfunction indicators and helpful for reflecting persistent parenchymal damage or cholestasis [24]. But these biochemical variables cannot be used for predicting PHLF independently. Increased age, tumor size, and APRI levels were risk factors for PHLF after controlling other variables in this study, which is consistent of previous finding. Ichikawa’s team reported that the preoperative APRI score can effectively and independently predict PHLF in HCC patients after hepatectomy [25]. Small remnant liver volume is most closely related to morbidity and mortality of PHLF [5]. In addition, age is important because the regeneration capacity of liver tissue decreases with age [9].
Treatment-related toxicity, malnutrition, lack of physical activity, cancer aggressiveness, and cancer treatment can affect changes in body composition during cancer treatment [26, 27, 28, 29]. The decreased muscle mass and strength is negatively correlated with disease-free survival and overall survival [30]. Low SMI is very common and has been shown to be a strong prognostic factor for many types of cancer [31]. In this study, SMI and SMA are related to PHLF in univariate analysis. However, after controlling for other variables, the association between PHLF and SMI and SMA was not statistically significant. LBM, SMI and SMA could represent muscle mass, but these terms could not be used interchangeably. Because their exact components differ. LBM is generally defined as total body weight minus fat mass and bone mineral content and is related to extracellular fluid volume. SMI only represents the dry weight of skeletal muscle. SMIs and LBMs may play different roles in people’s health or disease. A meta-analysis showed that the magnitude and progression of LBM and skeletal muscle mass loss differed in populations undergoing bariatric surgery [32].
As the major source of organism proteins, LBM is re required for all cellular process. The loss of LBM caused by the upregulation of proteolysis and a blunted response to anabolic stimuli is related to various diseases and non-disease states, including severe malnutrition and sarcopenia [17, 18, 19]. The loss of LBM is closely related to imbalance of protein synthesis and catabolism, both of which may work together to lead to a reduction in immunity activity and an increase in adverse clinical outcomes among cancer patients [20]. Malnutrition can also affect the immune response and result in a decrease in liver cell regeneration [21]. This is consistent with the finding that LBM was a protective factor of PHLF after controlling other variables in this study. The prevalence of PHLF in each quartile of LBM was different with significance ( 0.001). Additionally, mediators of metabolic derangement driven by the tumor, such as activin and myostatin might be involved in this association [33]. Pro-inflammatory cytokines, such as IL-6, IL-1, TNF, and IFN-, could cause an energetic imbalance between catabolic and anabolic pathways, which might be potential explanation of our finding [34].
The perioperative rehabilitative exercise/nutrition programs after hepatectomy improve outcomes among patients with HCC undergoing hepatectomy [10, 35]. Exercise 3–4 times a week for 30–40 minutes, or take an extra 2,000 steps per day for about 3 months has been suggested to improve outcomes for liver resection for malignant tumors [36]. The early resumption of exercise could improve the skeletal muscle quality and quantity for preoperative patients with low LBM [37]. Branched-chain amino acid supplementation may exert similar effects as exercise training to improve skeletal muscle steatosis and glucose tolerance, thereby improving hypoalbuminemia, preventing sarcopenia, and reducing fat accumulation in skeletal muscle [38]. In addition, higher dietary protein and chromium picolinate intake maintains LBM [39, 40].
The present study has some limitations. Firstly, our study has a relatively small sample size. Secondly, a mechanistic explanation for the results is not provided by our data and further molecular biologic investigation is required. Finally, our results need to be validated in other populations with different etiologies of HCC due to the high prevalence of hepatitis B viral infection in China.
Conclusion
LBM might be a protective factor for PHLF among HCC. Our findings might help to develop a novel strategy to reduce the occurrence of hepatic dysfunction following major liver resection. Understanding the relationship between lean tissue and PHLF might be the key to improving the safety of major liver resection. Multicentric prospective studies and further molecular biologic investigation are needed.
Funding
This work was supported by grants from the National Cancer Center climbing Foundation (NCC201908B0 95).
Author contributions
Conception: Zeng-yao Liu, Zhao-hui Xing, and Wen Wang.
Interpretation or analysis of data: Rui-tao Wang and Jia-yu Li.
Preparation of the manuscript: Zeng-yao Liu, Zhao-hui Xing, Wen Wang, and Yu-xi Liu.
Revision for important intellectual content: Rui-tao Wang and Jia-yu Li.
Supervision: Rui-tao Wang and Jia-yu Li.
Every author reviewed the draft and approved the final version of the manuscript for publishing.
Footnotes
Conflict of interest
The authors declare that the research was conducted in the absence of any commercial or financial relationships that could be construed as a potential conflict of interest.
References
1.
RahbariN.N.GardenO.J.PadburyR.Brooke-SmithM.CrawfordM.AdamR.KochM.MakuuchiM.DematteoR.P.ChristophiC.BantingS.UsatoffV.NaginoM.MaddernG.HughT.J.VautheyJ.N.GreigP.ReesM.YokoyamaY.FanS.T.NimuraY.FiguerasJ.CapussottiL.BuchlerM.W. and WeitzJ., Posthepatectomy liver failure: a definition and grading by the International Study Group of Liver Surgery (ISGLS), Surgery149 (2011), 713–24.
2.
BalzanS.BelghitiJ.FargesO.OgataS.SauvanetA.DelefosseD. and DurandF., The “50-50 criteria” on postoperative day 5: an accurate predictor of liver failure and death after hepatectomy, Ann Surg242 (2005), 824–8, discussion 828–9.
3.
McCallJ.KoeaJ.GunnK.RodgersM. and JarvisJ., Liver resections in Auckland 1998-2001: mortality, morbidity and blood product use, N Z Med J114 (2001), 516–9.
4.
SunH.C.QinL.X.WangL.YeQ.H.WuZ.Q.FanJ. and TangZ.Y., Risk factors for postoperative complications after liver resection, Hepatobiliary Pancreat Dis Int4 (2005), 370–4.
5.
SchindlM.J.RedheadD.N.FearonK.C.GardenO.J.WigmoreS.J. and Edinburgh Liver Surgery and Transplantation Experimental Research Group, The value of residual liver volume as a predictor of hepatic dysfunction and infection after major liver resection, Gut54 (2005), 289–96.
6.
MullenJ.T.RiberoD.ReddyS.K.DonadonM.ZorziD.GautamS.AbdallaE.K.CurleyS.A.CapussottiL.ClaryB.M. and VautheyJ.N., Hepatic insufficiency and mortality in 1,059 noncirrhotic patients undergoing major hepatectomy, J Am Coll Surg204 (2007), 854–62; discussion 862.
7.
PoonR.T.FanS.T.LoC.M.LiuC.L.LamC.M.YuenW.K.YeungC. and WongJ., Improving perioperative outcome expands the role of hepatectomy in management of benign and malignant hepatobiliary diseases: analysis of 1222 consecutive patients from a prospective database, Ann Surg240 (2004), 698–708; discussion 708–10.
8.
ChunY.S.LaurentA.MaruD. and VautheyJ.N., Management of chemotherapy-associated hepatotoxicity in colorectal liver metastases, Lancet Oncol10 (2009), 278–86.
9.
IakovaP.AwadS.S. and TimchenkoN.A., Aging reduces proliferative capacities of liver by switching pathways of C/EBPalpha growth arrest, Cell113 (2003), 495–506.
10.
FanS.T.LoC.M.LaiE.C.ChuK.M.LiuC.L. and WongJ., Perioperative nutritional support in patients undergoing hepatectomy for hepatocellular carcinoma, N Engl J Med331 (1994), 1547–52.
11.
LittleS.A.JarnaginW.R.DeMatteoR.P.BlumgartL.H. and FongY., Diabetes is associated with increased perioperative mortality but equivalent long-term outcome after hepatic resection for colorectal cancer, J Gastrointest Surg6 (2002), 88–94.
12.
ShoupM.GonenM.D’AngelicaM.JarnaginW.R.DeMatteoR.P.SchwartzL.H.TuortoS.BlumgartL.H. and FongY., Volumetric analysis predicts hepatic dysfunction in patients undergoing major liver resection, J Gastrointest Surg7 (2003), 325–30.
13.
VautheyJ.N.PawlikT.M.RiberoD.WuT.T.ZorziD.HoffP.M.XiongH.Q.EngC.LauwersG.Y.Mino-KenudsonM.RisioM.MuratoreA.CapussottiL.CurleyS.A. and AbdallaE.K., Chemotherapy regimen predicts steatohepatitis and an increase in 90-day mortality after surgery for hepatic colorectal metastases, J Clin Oncol24 (2006), 2065–72.
14.
MannD.V.LamW.W.Magnus HjelmN.SoN.M.YeungD.K.MetreweliC. and LauW.Y., Biliary drainage for obstructive jaundice enhances hepatic energy status in humans: a 31-phosphorus magnetic resonance spectroscopy study, Gut50 (2002), 118–22.
15.
MakinoH.ShimizuH.ItoH.KimuraF.AmbiruS.TogawaA.OhtsukaM.YoshidomeH.KatoA.YoshitomiH.SawadaS. and MiyazakiM., Changes in growth factor and cytokine expression in biliary obstructed rat liver and their relationship with delayed liver regeneration after partial hepatectomy, World J Gastroenterol12 (2006), 2053–9.
16.
SugawaraY.ZasadnyK.R.NeuhoffA.W. and WahlR.L., Reevaluation of the standardized uptake value for FDG: variations with body weight and methods for correction, Radiology213 (1999), 521–5.
17.
PringE.T.MalietzisG.KennedyR.H.AthanasiouT. and JenkinsJ.T., Cancer cachexia and myopenia – Update on management strategies and the direction of future research for optimizing body composition in cancer – A narrative review, Cancer Treat Rev70 (2018), 245–254.
18.
UlmannG.KaiJ.DurandJ.P.NeveuxN.JouinotA.De BandtJ.P.GoldwasserF. and CynoberL., Creatinine-to-cystatin C ratio and bioelectrical impedance analysis for the assessement of low lean body mass in cancer patients: Comparison to L3-computed tomography scan, Nutrition81 (2021), 110895.
19.
ZhouD.C.YangX.H.ZhanX.L.GuY.H.GuoL.L. and JinH.M., Association of lean body mass with nutritional parameters and mortality in hemodialysis patients: A long-term follow-up clinical study, Int J Artif Organs41 (2018), 297–305.
20.
TsaiS., Importance of lean body mass in the oncologic patient, Nutr Clin Pract27 (2012), 593–8.
21.
van den BroekM.A.Olde DaminkS.W.DejongC.H.LangH.MalagoM.JalanR. and SanerF.H., Liver failure after partial hepatic resection: definition, pathophysiology, risk factors and treatment, Liver Int28 (2008), 767–80.
22.
ChapelleT.Op De BeeckB.HuygheI.FrancqueS.DriessenA.RoeyenG.YsebaertD. and De GreefK., Future remnant liver function estimated by combining liver volumetry on magnetic resonance imaging with total liver function on (99m)Tc-mebrofenin hepatobiliary scintigraphy: can this tool predict post-hepatectomy liver failure?HPB (Oxford)18 (2016), 494–503.
23.
MaiR.Y.WangY.Y.BaiT.ChenJ.XiangB.D.WuG.B.WuF.X.LiL.Q. and YeJ.Z., Combination Of ALBI And APRI To Predict Post-Hepatectomy Liver Failure After Liver Resection For HBV-Related HCC Patients, Cancer Manag Res11 (2019), 8799–8806.
24.
SiuJ.McCallJ. and ConnorS., Systematic review of pathophysiological changes following hepatic resection, HPB (Oxford)16 (2014), 407–21.
25.
IchikawaT.UenishiT.TakemuraS.ObaK.OgawaM.KodaiS.ShinkawaH.TanakaH.YamamotoT.TanakaS.YamamotoS.HaiS.ShutoT.HirohashiK. and KuboS., A simple, noninvasively determined index predicting hepatic failure following liver resection for hepatocellular carcinoma, J Hepatobiliary Pancreat Surg16 (2009), 42–8.
26.
CaanB.J.Cespedes FelicianoE.M. and KroenkeC.H., The Importance of Body Composition in Explaining the Overweight Paradox in Cancer-Counterpoint, Cancer Res78 (2018), 1906–1912.
27.
GoldD.V.GoldenbergD.M.KaracayH.RossiE.A.ChangC.H.CardilloT.M.McBrideW.J. and SharkeyR.M., A novel bispecific, trivalent antibody construct for targeting pancreatic carcinoma, Cancer Res68 (2008), 4819–26.
28.
WangY.X.ZhuN.ZhangC.J.WangY.K.WuH.T.LiQ.DuK.LiaoD.F. and QinL., Friend or foe: Multiple roles of adipose tissue in cancer formation and progression, J Cell Physiol234 (2019), 21436–21449.
29.
QuailD.F. and DannenbergA.J., The obese adipose tissue microenvironment in cancer development and progression, Nat Rev Endocrinol15 (2019), 139–154.
30.
PradoC.M.PurcellS.A. and LavianoA., Nutrition interventions to treat low muscle mass in cancer, J Cachexia Sarcopenia Muscle11 (2020), 366–380.
31.
LooijaardS.Te Lintel HekkertM.L.WustR.C.I.OttenR.H.J.MeskersC.G.M. and MaierA.B., Pathophysiological mechanisms explaining poor clinical outcome of older cancer patients with low skeletal muscle mass, Acta Physiol (Oxf)231 (2021), e13516.
32.
NuijtenM.A.H.EijsvogelsT.M.H.MonpellierV.M.JanssenI.M.C.HazebroekE.J. and HopmanM.T.E., The magnitude and progress of lean body mass, fat-free mass, and skeletal muscle mass loss following bariatric surgery: A systematic review and meta-analysis, Obes Rev23 (2022), e13370.
33.
UngefrorenH.WitteD.FiedlerC.GadekenT.KaufmannR.LehnertH.GieselerF. and RauchB.H., The Role of PAR2 in TGF-beta1-Induced ERK Activation and Cell Motility, Int J Mol Sci18 (2017).
34.
FonsecaG.FarkasJ.DoraE.von HaehlingS. and LainscakM., Cancer Cachexia and Related Metabolic Dysfunction, Int J Mol Sci21 (2020).
35.
KaiboriM.IshizakiM.MatsuiK.NakatakeR.YoshiuchiS.KimuraY. and KwonA.H., Perioperative exercise for chronic liver injury patients with hepatocellular carcinoma undergoing hepatectomy, Am J Surg206 (2013), 202–9.
36.
BerardiG.AntonelliG.ColasantiM.MeniconiR.GuglielmoN.LaurenziA.FerrettiS.Levi SandriG.B.SpagnoliA.MoschettaG.SchininaV.AntoniniM.MarignaniM. and EttorreG.M., Association of Sarcopenia and Body Composition With Short-term Outcomes After Liver Resection for Malignant Tumors, JAMA Surg155 (2020), e203336.
37.
WischmeyerP.E.PuthuchearyZ.San MillanI.ButzD. and GrocottM.P.W., Muscle mass and physical recovery in ICU: innovations for targeting of nutrition and exercise, Curr Opin Crit Care23 (2017), 269–278.
38.
KitajimaY.TakahashiH.AkiyamaT.MurayamaK.IwaneS.KuwashiroT.TanakaK.KawazoeS.OnoN.EguchiT.AnzaiK. and EguchiY., Supplementation with branched-chain amino acids ameliorates hypoalbuminemia, prevents sarcopenia, and reduces fat accumulation in the skeletal muscles of patients with liver cirrhosis, J Gastroenterol53 (2018), 427–437.
39.
GillinghamM.B.ElizondoG.BehrendA.MaternD.SchoellerD.A.HardingC.O. and PurnellJ.Q., Higher dietary protein intake preserves lean body mass, lowers liver lipid deposition, and maintains metabolic control in participants with long-chain fatty acid oxidation disorders, J Inherit Metab Dis42 (2019), 857–869.
40.
WilloughbyD.HewlingsS.KalmanD. and Body Composition Changes in Weight Loss:, Strategies and Supplementation for Maintaining Lean Body Mass, a Brief Review, Nutrients10 (2018).