
Abstract
BACKGROUND:
African colorectal cancer (CRC) rates are rising rapidly. A low-cost CRC screening approach is needed to identify CRC from non-CRC patients who should be sent for colonoscopy (a scarcity in Africa).
OBJECTIVE:
To identify urinary metabolite biomarkers that, combined with easy-to-measure clinical variables, would identify patients that should be further screened for CRC by colonoscopy. Ideal metabolites would be water-soluble and easily translated into a sensitive, low-cost point-of-care (POC) test.
METHODS:
Liquid-chromatography mass spectrometry (LC-MS/MS) was used to quantify 142 metabolites in spot urine samples from 514 Nigerian CRC patients and healthy controls. Metabolite concentration data and clinical characteristics were used to determine optimal sets of biomarkers for identifying CRC from non-CRC subjects.
RESULTS:
Our statistical analysis identified N
CONCLUSIONS:
Effective urinary biomarkers for CRC screening do exist. These results could be transferred into a simple, POC urinary test for screening CRC patients in Africa.
Keywords
Introduction
Colorectal cancer (CRC) is the third most common cancer in the world with an estimated 1.93 million new cases diagnosed in 2020 [1]. CRC rates are rapidly increasing worldwide with about 2.4 million cases/yr being expected by 2035 [2]. Until recently, CRC was a rare disease in Africa with rates as low as 1.2 per 100,000 (versus 38.7 per 100,000 in North America) [3]. However, this is changing rapidly. By 2035, the entire WHO African Region is anticipated to have the second highest rate of CRC growth [2]. The rising incidence of CRC in resource poor, low- and middle-income countries (LMICs) in Africa is attributed in part to the adoption of the Western diet and Western lifestyle [4, 5].
CRC disease management and presentation differ in continental Africa compared to Western countries. The average age of incidence is younger (43–46 years versus 78–85 years) [6, 7], the percentage of rectal cancer (compared to colon cancer) is higher in most African regions [8], and the metastatic patterns are different [9]. Furthermore, the African region has no population-wide CRC screening programs. As a result, up to 99% of individuals in Africa diagnosed with CRC have late-stage disease, where a cure is often not possible and the 1-year survival is just 47% [9]. In comparison, the 5-year survival rate in North America and Europe is 60.3% [10].
There are a number of methods that can be used for population-wide screening of CRC. These include fecal immunochemical tests (FIT) [11], stool DNA (sDNA [12]) tests such as Cologuard
For those in LMICs, colonoscopy is neither widely available nor affordable. Moreover, healthcare resources are not available to implement population-based CRC screening programs [6, 17, 18]. In response to increasing CRC rates in LMICS, a surveillance symptom-based model [17] was developed with the intent to reduce mortality from CRC. This point-of-care (POC) symptom-based test uses clinical characteristics of rectal bleeding, weight loss and changes in bowel habits. Such a test was found to be easily delivered and interpreted by healthcare professionals after minimal training. However, its sensitivity and specificity were of moderate quality: only 56% of high-risk patients had CRC (Stage II or III). Other simple, fast, easy-to-use methods are needed to compliment this surveillance symptom-based test to identify and prioritize those with CRC among high-risk individuals.
One fast, easy-to-use complementary approach would be to use metabolite detection for CRC screening. Many metabolomic studies have identified a plethora of metabolite biomarkers for CRC diagnosis from human biofluids, including urine [19, 20, 21, 22, 23, 24, 25, 26]. The close coupling between colonic metabolism and urinary metabolites suggests that urine could be a very informative medium for identifying easy-to-detect CRC biomarkers. Indeed, a recent meta-analysis examined 29 CRC cohort studies where quantitative metabolomic analyses of controls, CRC (stages 1–4), adenomas and polyps were examined [19]. This study identified 6 upregulated (3-hydroxybutyric acid, L-dopa, L-histidinol, and N
The purpose of this study was to discover and validate a combination of urinary metabolite biomarkers for the detection of CRC in symptomatic Nigerian patients. We chose liquid chromatography tandem mass spectrometry (LC-MS/MS) and direct injection tandem mass spectrometry (DI-MS/MS), to help us identify and quantify a large pool of potential biomarkers. Our goal was to use the power of LC-MS to obtain a clinically relevant set of CRC predictive biomarkers that are sufficiently abundant and water-soluble, to make them translatable into a low-cost POC testing device. Coupling a low-cost urinary POC test with the clinical symptom-based test could further improve CRC screening performance. Indeed, when metabolite profiles and clinical characteristics are combined, the sensitivity and specificity of many metabolite tests and models increases [20, 27].
Here, we report the identification of four, high-abundance urinary metabolites that could serve as robust biomarkers of CRC in the Nigerian populations. We also show that by combining these urinary metabolites with clinical characteristics, a urine-based screening test, with good potential for conversion to a POC screening test, can be developed that has high sensitivity to discriminate between symptomatic patients at higher risk for CRC versus others.
Materials and methods
Study design
This was a prospective, observational study designed to develop a urine-based screening test using metabolomics to discriminate between those at higher-risk for CRC from other non-CRC conditions. Study participants provided informed written consent prior to enrolment in accordance with the Obafemi Awolowo University Teaching Hospital (OAUTH) Ethics and Research Committee, which approved the study (IRB/IEC/ 0004553). The study conforms with The Code of Ethics of the World Medical Association (Declaration of Helsinki). Ethics approvals covering sample processing were received by the Health Research Ethics Board at the University of Alberta (Pro00074045). The study was registered with ClinicalTrials.gov as NCT03173729 and has an earlier submission of NCT03032874.
Study population
Recruitment of eligible patients, which was managed by the African Research Group for Oncology (ARGO) Consortium, occurred at one of five Nigerian hospitals: OAUTH, Ibadan University Teaching Hospital, University Ilorin Teaching Hospital, Federal Medical Center, Owo, and Ladoke Akintola University of Technology (LAUTECH). The catchment area of the hospital network includes all the Osun, Ekiti, and Ondo states and part of the Oyo, Kwara, Kogi, Lagos, and Edo states providing care to over 15 million people. Eligible study participants were accrued from one of two populations: adults (
Sample and clinical data collection
At recruitment, all participants completed a questionnaire (see Table S1) concerning their symptoms and medical history and provided a mid-stream spot urine sample. Urine samples were frozen at
Pathologic samples were read at OAU, Ibadan, and Ilorin for all patients with biopsies of CRC or precancerous polyps (adenomatous, hyperplastic, hamartomatous, or inflammatory). A pathologist, Dr. Vakiani, at Memorial Sloan Kettering Cancer Center, performed a central pathologic review remotely for pathologic quality assurance and accuracy of the reference standard results. Prior to conducting the MS-based metabolomic analyses, the urine samples were divided into two batches. The first batch included 413 samples (consisting of 169 biopsy-confirmed CRC cases, 50 polyp cases and 194 healthy controls) which were assigned to the discovery set. The second batch of the remaining 101 samples (consisting of 43 biopsy-confirmed CRC cases, 27 polyp cases and 31 healthy controls) were assigned to the validation set.
Chemicals, reagents and materials for mass spectrometry-based metabolomic assays
Optima™ LC/MS grade formic acid and high performance liquid chromatography (HPLC) grade water were purchased from Fisher Scientific (Ottawa, CA). Pure reference standard compounds, except 3-(3-hydroxyphenyl)-3-hydroxypropionic acid (HPHPA), were purchased from Sigma-Aldrich (Oakville, CA).
Stock solutions, internal standard mixture, and calibration curve standards for metabolomic assays
All solid chemicals were carefully weighed on a CPA225D semi-microelectronic balance (Sartorius, NY, USA) with a precision of 0.0001 g. Stock solutions of each compound were prepared by dissolving the accurately weighed solids in double-distilled water. Calibration curve standards were obtained by mixing and diluting the corresponding stock solutions with double-distilled water. For amino acids, biogenic amines, carbohydrates, carnitines and derivatives, phosphatidylcholines and their derivatives, stock solutions of isotope-labelled compounds were prepared in the same way. A working internal standard (ISTD) solution mixture was also made by mixing all the prepared isotope-labeled stock solutions together in water. For organic acids, stock solutions of isotope-labelled compounds were prepared by dissolving the accurately weighed solids in 75% aqueous methanol. A working ISTD solution mixture was made by mixing and diluting all the isotope-labelled stock solutions in 75% aqueous methanol. All standard solutions were aliquoted and stored at
Sample preparation and liquid chromatography and direct injection mass spectrometry for metabolomic assays
A targeted, quantitative MS-based metabolomics approach was used to analyze the urine samples using a combination of DI-MS and reverse-phase high performance liquid chromatography tandem mass spectrometry (MS/MS). MS/MS analysis of the endogenous metabolites in the urine samples, including amino acids, organic acids, biogenic amines, acylcarnitines, glycerophospholipids, sphingolipids and sugars, was performed on an HPLC (Agilent 1260 HPLC, Agilent Technologies, Santa Clara, USA) equipped Qtrap
Statistical analysis
Numeric and categorical clinical variables were analyzed by Mann-Whitney rank sum tests and
Logistic regression with a least absolute shrinkage and selection operator (LASSO) feature selection algorithm was used to develop diagnostic models of CRC using both metabolite and clinical variables. Logistic regression and LASSO feature selection were performed by using R 3.6.3 [30]. Optimal regression models for CRC diagnosis were first identified on the discovery sets. Then the validation datasets, which were acquired from samples of the patients recruited independently from the discovery cohort, were used to validate the regression models. The area under the receiver-operator characteristic curves (AUC), sensitivities/specificities at selected cut-off points and the 95% confidence intervals were calculated for the discovery and the validation sets for all models using the pROC R package [33]. Cut-off points were selected by calculating the Youden Index (J
Results
Study population and statistical data processing
Summary of grouping of samples
Summary of grouping of samples
A complete data set (survey, urine samples, and pathology reports) was collected from 514 recruited participants (Table 1). The mean age was 53.9 years (range: 19–75 yrs) of which 60.7% were male (data obtained from study questionnaire, Table S1). As noted earlier, the samples were divided into two batches, with 413 samples assigned to the discovery set and 101 samples assigned to the validation set. The discovery and validation sets were built using a ratio of 80.4%:19.6% of participants. Clinical information including age, biological sex, weight, height, personal smoking history [Y/N], cancer history [Y/N], blood in stool [Y/N], hemorrhoids [Y/N], weight loss in 6 months [Y/N] were used as the clinical variables for further statistical analysis. As described in Table S1, additional information on bowel habits and stool features were also included. The feature “change in caliber of stool” was classified as “pellet-like [Y/N]”, “watery [Y/N]”, “diarrhea [Y/N]”, and “alternating constipation with diarrhea/constipation [Y/N]”. All descriptions were introduced into the statistical analysis as independent clinical variables. Colonic polyps detected by colonoscopy are not considered cancerous (they may be precancerous) and are frequently detected in healthy individuals. As a result, patients with colonic polyps were combined with healthy controls as one “Normal” group for the preliminary statistical analysis of the clinical variables. To confirm that the same patient demographics were present in the CRC and the Normal group, Mann-Whitney rank sum tests and
(A) Partial least squares discriminant analysis (PLS-DA) 2D-scores plot of colorectal cancer (CRC) patients (
Using LC-MS/MS and DI-MS/MS analysis, the absolute concentrations of 142 urinary metabolites were identified and quantified in all samples using our previously published, targeted urinary assay [29]. The identified metabolites include 28 amino acids and derivatives, 17 organic acids, 22 biogenic amines and derivatives, 40 acylcarnitines, 34 lipids, and glucose/hexose. Data processing of the measured metabolites was first performed to identify metabolites with missing values. Thirty-eight metabolites had a high (
To determine if there was a difference between the urinary metabolite profiles of the CRC and healthy control groups (excluding those patients with polyps), partial least squares discriminant analysis (PLS-DA) was performed using the remaining 104 metabolites. Using the discovery set, a clear two-dimensional separation in the PLS-DA was achieved between the CRC and healthy control groups (Fig. 1A). Using permutation testing, we confirmed that the observed separation between the cases and controls was not due to chance (
(A) PLS-DA separation of CRC (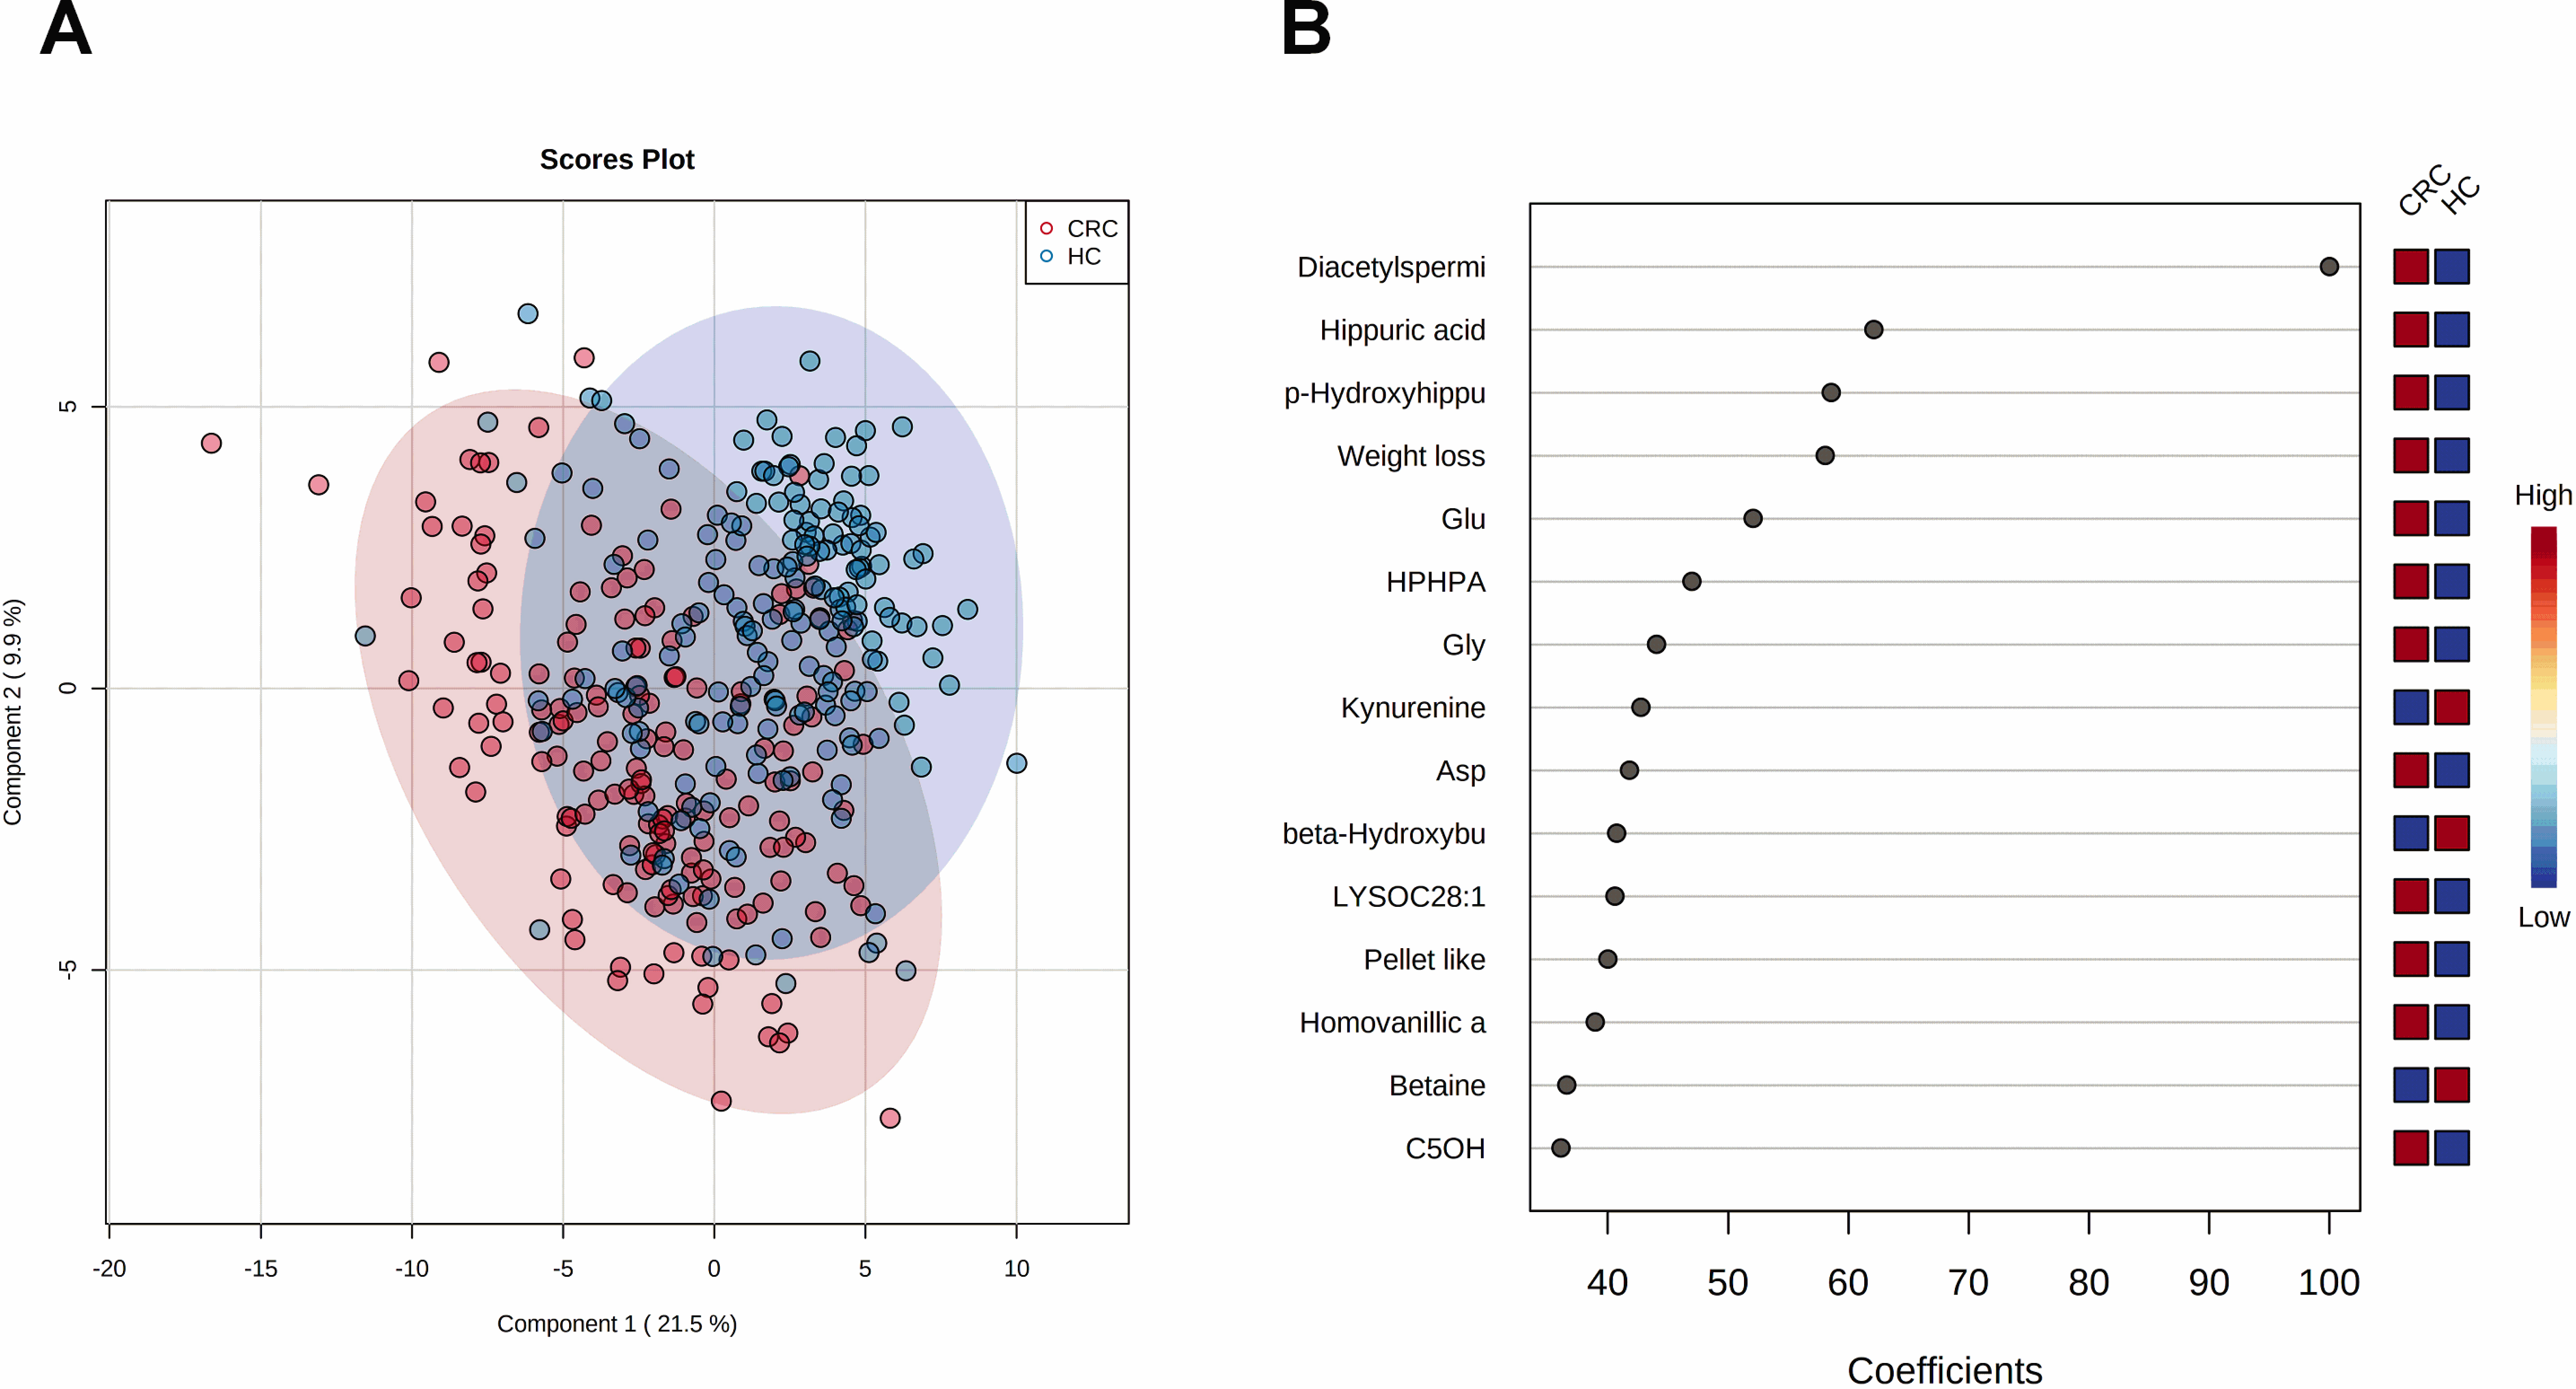
Receiver operating characteristic (ROC) curves of the logistic regression models for CRC versus healthy controls where (A) shows the results for metabolites only and (B) shows the results for metabolites and weight loss.
Logistic regression based optimal model for CRC diagnosis (CRC vs healthy controls)
NA- not applicable. CI indicates the confidence interval.
(A) PLS-DA 2D-scores plot of CRC (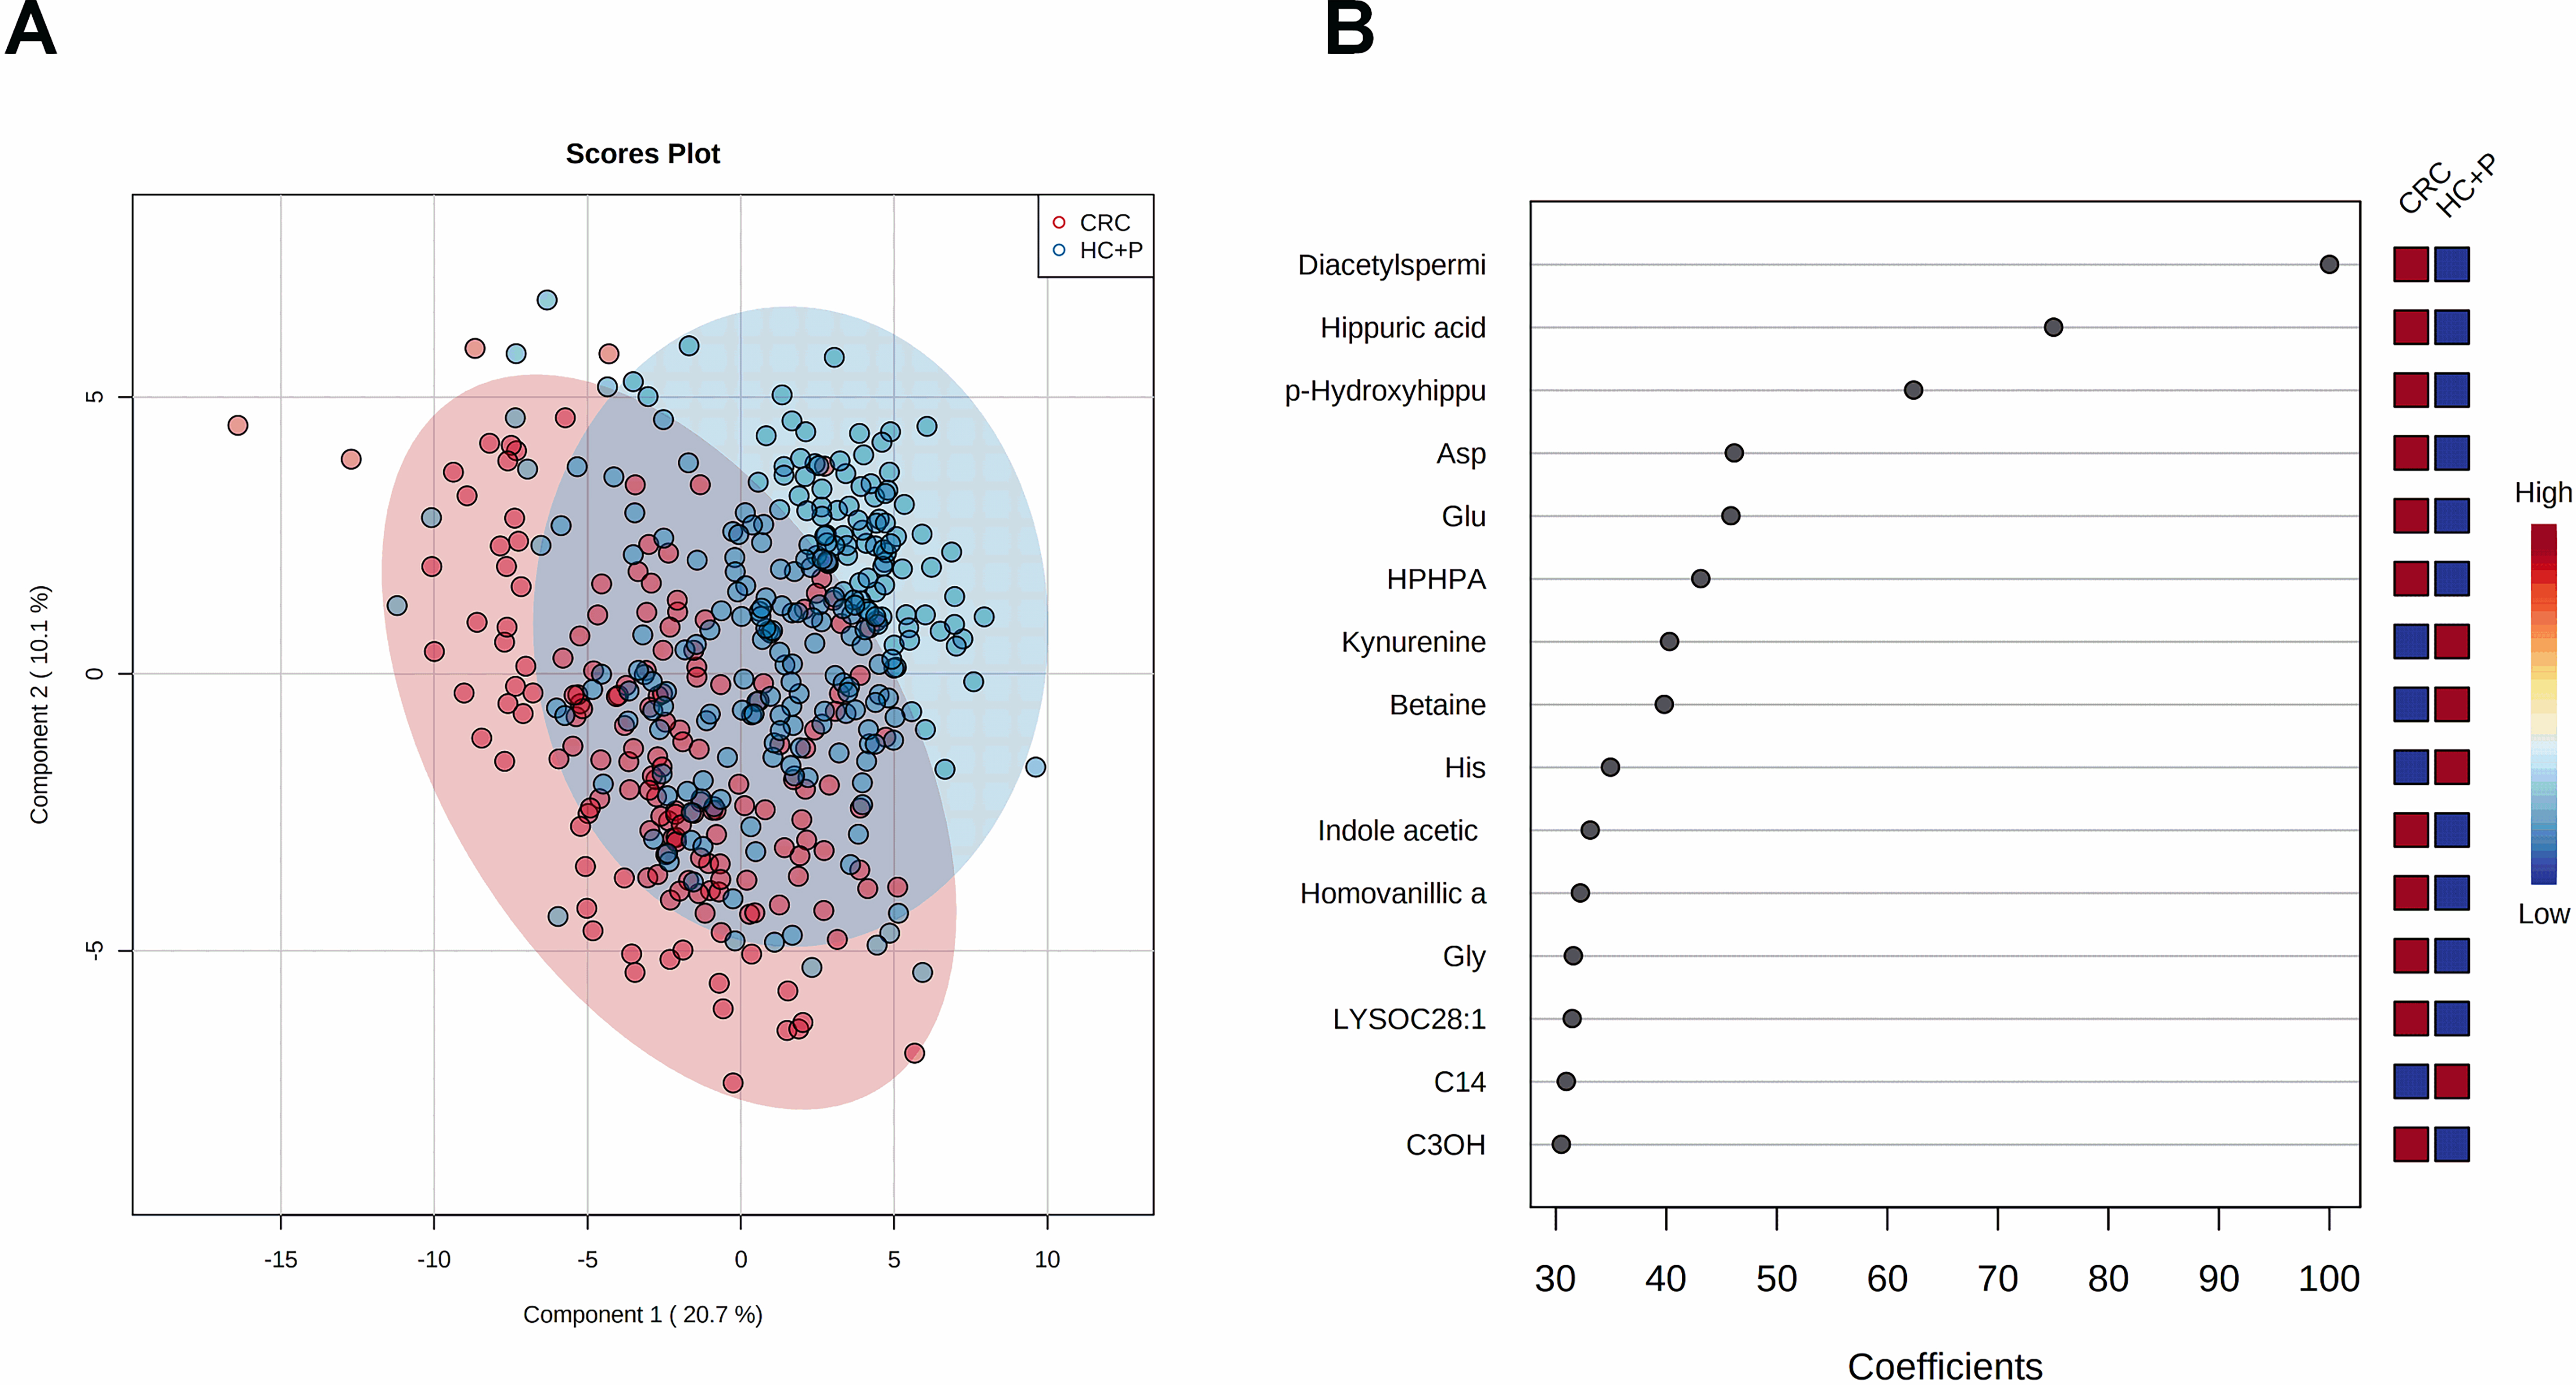
To determine if clinical features combined with metabolite profiles could improve the separation of the CRC patients and healthy controls, further evaluation was performed by PLS-DA. Figure 2A shows that separation between the CRC versus healthy control groups was achieved. Figure 2B shows the most important contributors to the group separation. As before, a permutation test was also performed to ensure that the separation was not due to chance (Fig. S2B). When clinical variables were included in the PLS-DA separation, the same four metabolites once again topped the list and included (in decreasing order of importance) N
These findings suggest that a robust set of urinary metabolites (alone) exist that could serve as biomarkers in a high-performing CRC test among African subjects. Therefore, we performed logistic regression modelling to identify the best combination of urinary metabolites that could distinguish CRC patients from healthy controls. To find the most effective predictors, a LASSO feature selection algorithm was performed. The logistic regression models were first built and optimized using a discovery cohort of 169 CRC patients and 194 healthy controls (Table 1). Using only the metabolomics profile, the following optimum logistic regression model was generated that calculates the odds or likelihood (specifically the log odds) of a patient having CRC (P):
When clinical variables were introduced into the logistic regression modelling, an optimum modified model to predict if a patient has CRC was generated:
Logistic regression based optimal model for CRC diagnosis (CRC vs healthy controls
NA- not applicable. CI indicates the confidence interval
(A) PLS-DA separation of CRC (
ROC curves of the logistic regression models for CRC vs healthy controls 
A total of 15% of study participants had colorectal polyps. To ensure that our models could distinguish CRC from polyps in symptomatic individuals, we assessed the model’s performance comparing CRC patients versus healthy controls plus those with polyps. The influence of including the clinical features (Figs 4A and 5A, respectively) resulted in similar separations in the PLS-DA plots. Combining healthy controls with individuals having polyps into a single “healthy” group led to a few more outliers when compared to healthy controls without polyps (Fig. 1A). Using urinary metabolic profiles only (Fig. 4B), the VIP plot yielded the same order of the top performing metabolites (N
Using only the urinary metabolite profiles, the optimal logistic regression model was generated using the combination of N
Discussion
In this prospective study, urinary metabolomic profiles were used to build a clinically relevant diagnostic model to discriminate between symptomatic patients with CRC versus those with non-CRC conditions (e.g., inflammatory bowel disease, hemorrhoids or polyps). Urinary metabolite concentrations were analyzed via quantitative MS-based techniques and normalized to creatinine levels. Separate discovery and validation cohorts were used to prevent overtraining and any unintended bias in the results. Two different metabolite-only and two different metabolite
Several metabolomic studies have identified urinary biomarkers for CRC [19, 20, 21, 22, 23, 24, 25, 26]. These studies were limited to populations in high income, northern climate countries with very different diet, lifestyle, colonic microflora, climate conditions and lifetime exposures than those from low or middle-income countries. This necessitated a detailed study of CRC urinary biomarkers focused on individuals from LMIC’s. We determined that N
Our CRC diagnostic models were built using metabo-lite-only and metabolite plus clinical characteristics (such as weight loss, rectal bleeding and change in stool habits) to improve the assays specificity and sensitivity. Weight loss was the feature that contributed the most to our predictive models. Rectal bleeding lacked importance as a clinical variable likely because non-cancer related illnesses or conditions such as hemorrhoids and diverticulitis [17] can cause rectal bleeding. A CRC rectal bleeding symptom-screening model developed by Alatise et al. [17], using weight loss and change in bowel habits as the symptoms, found that 56% of patients with these three symptoms were identified with CRC Stages II to IV while 44% did not have CRC. Although change in bowel habits was an important characteristic in the symptom-screening model [17], this feature had a low predictive value when included with our logistic regression models. Instead, we found that the urinary metabolites N
Other CRC models built using urinary metabolites with and without clinical characteristics have been described for North American, Chinese and Korean patients. Deng et al. [20] developed a North American CRC diagnostic model using N
We observed statistically significant changes in urinary N
While the performance of our metabolite-only or metabolite
While our metabolite or metabolite
Author contributions
Conception: D.S. Wishart, O.I Alatise, T.P. Kingham.
Methodology: L. Zhang, J. Zheng, D.S. Wishart.
Data collection: L. Zhang; J. Zheng, K.P. Ismond, S. MacKay, J. Constable, O.I. Alatise, T.P. Kingham, D.S. Wishart.
Interpretation or analysis of data: L. Zhang, J. Zheng.
Preparation of the manuscript: L. Zhang, K.P. Ismond, M. LeVatte, D.S. Wishart.
Revision for important intellectual content: L. Zhang; K.P. Ismond, S. MacKay, M. LeVatte, J. Constable, O.I. Alatise, T.P. Kingham, D.S. Wishart.
Supervision: D.S. Wishart.
Supplementary data
The supplementary files are available to download from
sj-doc-1-cbm-10.3233_CBM-220034.doc - Supplemental material
Supplemental material, sj-doc-1-cbm-10.3233_CBM-220034.doc
Footnotes
Acknowledgments
We thank the staff at The Metabolomics Innovation Centre (TMIC) for the assistance in processing the samples and operating the metabolomics equipment used for this study. This work was funded by the National Institute of Biomedical Imaging and Bioengineering, National Institutes of Health (NIH) (grant number UG3EB024965). Financial support from Genome Canada, the Canada Foundation for Innovation (CFI) and the Canadian Institutes of Health Research (CIHR) is gratefully acknowledged.