
Abstract
Although lysophospholipids are known to play an important role in the development and progression of several kinds of cancers, their role in human colorectal cancer is as yet unclear. In this study, we aim to investigate lysophospholipid levels in colorectal cancer tissues to identify lysophospholipids, the levels of which change specifically in colorectal cancers. We used liquid chromatography–tandem mass spectrometry to measure lysophospholipid levels in cancerous and normal tissues from 11 surgical specimens of sigmoid colon cancers, since recent advances in this field have improved detection sensitivities for lysophospholipids. Our results indicate that, in colon cancer tissues, levels of lysophosphatidylinositol and lysophosphatidylserine were significantly higher (p = 0.025 and p = 0.01, respectively), whereas levels of lysophosphatidic acid were significantly lower (p = 0.0019) than in normal tissues. Although levels of lysophosphatidylglycerol were higher in colon cancer tissues than in normal tissues, this difference was not found to be significant (p = 0.11). Fatty acid analysis further showed that 18:0 lysophosphatidylinositol and 18:0 lysophosphatidylserine were the predominant species of lysophospholipids in colon cancer tissues. These components may be potentially involved in colorectal carcinogenesis.
Keywords
Introduction
Lysophospholipids (LPLs) are glycerophospholipids that are produced when membrane phospholipids are hydrolyzed by phospholipase A1 (PLA1) or A2 (PLA2). LPLs have a hydrophilic head and one acyl chain composed of various fatty acids, linked to the glycerol backbone at either the sn-1 or the sn-2 position. Recent studies have implicated LPLs in intracellular G protein-coupled receptor (GPCR)-mediated signaling. Since many LPLs play important functional roles in cells despite being present in small amounts, their roles in the development or progression of various disorders must be investigated.1,2
Lysophosphatidic acid (LPA), sphingosine-1-phosphate (S1P), and lysophosphatidylserine (LPS), have been extensively studied and their physiological functions are fairly well known. Since LPA1, a GPCR for LPA, was first reported in 1996, 3 at least 16 such GPCRs have been identified, including 6 LPA receptors, 5 S1P receptors, 4 LPS receptors, and 1 lysophosphatidylinositol (LPI) receptor. More recently, GPCRs that serve as ligands for lysophosphatidylcholine (LPC) and lysophosphatidylglycerol (LPG) have also been reported.4,5 In addition, LPLs with the same polar head identity, but different types of fatty acid tails have been shown to exhibit different receptor-activating abilities and physiological activities.
Individual LPL levels are thought to be tightly regulated by specific production and decomposition mechanisms, and LPLs are known to function as lipid mediators in the blood or locally. However, a comprehensive understanding of LPL levels and their localization and distribution patterns in human cells and tissues is lacking. A thorough analysis of LPL levels and distribution patterns could help elucidate the physiological functions and pathological roles played by LPL mediators. To address this gap in our knowledge, we have, in a previous study, investigated the roles of LPA, S1P, and LPS as signaling molecules in colorectal cancer cell lines.6–9 However, due to a lack of effective methodologies, the levels of these molecules in human colorectal cancer tissues could not be accurately measured.
Since recent developments in liquid chromatography–tandem mass spectrometry (LC–MS/MS) techniques have considerably improved detection sensitivities for LPLs, the separation and quantification of various LPL species, even in small amounts of samples such as human tissues, has been made possible. 10 LC–MS/MS analyses of ovarian, stomach, colorectal, and lung cancer tissues have revealed that LPLs are associated with the development and progression of all these cancers.1,11–13 In a previous article, 11 they reported no difference of sphingolipids between colon cancer and normal tissues, although mRNA of S1P receptor 2 and S1P receptor 3 was elevated in colon cancer. However, other glycero-lysophospholipids have not been investigated in colon cancer tissues, since suitable quantification of LPLs is rather difficult. Specifically, 1-acyl LPLs and 2-acyl LPLs can be separately quantified only by appropriate handling of clinical samples including well-controlled pH and temperature.
In this study, we have investigated the levels of different LPLs from preserved human colon cancer and normal mucosal tissues using LC–MS/MS, to identify variations in the LPL profile that may be specific to colorectal cancers.
Materials and methods
Human subjects
We assessed 11 patients who underwent curative resections for advanced sigmoid colon cancers with ulcerated growth patterns in the Department of Surgical Oncology, the University of Tokyo Hospital in 2017.
Sample collection
Colon cancer tissues and surrounding normal tissues (approximately 20–200 mg) were surgically harvested from the resected colonic segments. Specimens were washed thrice in cold phosphate-buffered saline (PBS), placed in a 2-ml tube, and immediately chilled on ice. In the laboratory, all samples were quick-frozen in liquid nitrogen and stored at ‒80°C.
Lipid extraction procedures
We carried out lipid extractions from tissues in accordance with the method described by Inoue et al. 14 Each tissue specimen was placed in a 1.5-ml siliconized sample tube (TOMY TM-625S, Tokyo, Japan), following which 1 mL of acidic methanol (pH 4.0) and the internal standards (ISs) 17:0 LPA (to obtain a final concentration of 100 nM) and 17:0 LPC (to obtain a final concentration of 1 μM) were added. Zirconium beads were added to the mixture in the tube, and homogenization via sonication for 15 min was carried out. The resulting supernatants were harvested in siliconized tubes and centrifuged at 1500 r/min for 15 min. Following this, the supernatants collected were stored at ‒20°C; 20 μL of these extracts were subjected to LC–MS/MS analyses.
LC–MS/MS analysis
We performed LC–MS/MS analyses of the samples according to a previously described method 10 with minor modifications. A methanol extract from 20 μL of the lipid sample was obtained using an UltiMate 3000 (Thermo Fisher Scientific, Tokyo, Japan) equipped with a C18 CAPCELL PAK ACR column (1.5 × 250 mm2; Shiseido, Kyoto, Japan) with a gradient of solvent A (5 mM ammonium formate in water, pH 4.0) and solvent B (5 mM ammonium formate in 95% (v/v) acetonitrile, pH 4.0). MS/MS was carried out using a TSQ Quantiva triple quadrupole mass spectrometer (Thermo Fisher Scientific). LPA, lysophosphatidylethanolamine (LPE), LPG, LPI, and LPS were monitored in the negative ion mode, whereas LPC was monitored in the positive ion mode. The ions produced were as follows: m/z 153.0 (LPA) and m/z 184.1 (LPC). For each LPL class, 11 acyl chains (14:0, 16:0, 16:1, 18:0, 18:1, 18:2, 18:3, 20:3, 20:4, 20:5, and 22:6) were monitored. We calculated the concentrations of LPLs by obtaining the ratios between the LPL peaks and the IS peaks (1 μM of 17:0 LPA for LPA, LPE, LPI, LPG, and LPS species, or 10 μM of 17:0 LPC for LPC species). The ratios of peak areas between the analytes and ISs were then used for quantifying the LPLs in samples using a calibration curve.
In 5 randomly selected patients out of the 11, we further analyzed fatty acid compositions of the various LPLs as 1-acyl type or 2-acyl type. For this analysis, we performed high-performance liquid chromatography (HPLC) with an elongated elution time, as described previously. 10
Histopathology
Surgically collected tissue specimens were fixed in 10% formalin, following which the tumorous areas were dissected and embedded in paraffin for histopathological evaluation by the Department of Pathology, the University of Tokyo Hospital. The final pathological diagnosis of the clinical stage and histological type was made in accordance with the tumor, node, and metastasis (TNM) staging system as defined in the 8th edition of the American Joint Committee on Cancer/International Union Against Cancer (AJCC/UICC) staging system. 15
Statistical analysis
All results are expressed as mean ± standard error. Paired Student’s t-tests using Microsoft Excel software (Microsoft Office standard, v. 16.16.1; Microsoft) were used to evaluate whether differences between sample groups were statistically significant. Differences between sample groups were considered significant at p < 0.05.
Ethical statement
The study protocol was approved by the Research Ethics Committee at the Graduate School of Medicine, the University of Tokyo (approval no. 11308). All participants provided written informed consent statements. This study was conducted in accordance with the tenets of the 1964 Declaration of Helsinki and its later amendments.
Results
Patient characteristics
Clinical features of the 11 patients with ulcerated sigmoid colon cancer are summarized in Table 1. There were seven male and four female subjects, and the median age of the patients was 67.4 years (range: 58–81 years). The mean tumor diameter was 50.5 ± 21.7 mm, and histopathological analysis identified the tumor types carried by all patients as tubular adenocarcinomas. The values for T2, T3, T4a, and T4b were 27.3%, 36.3%, 27.3%, and 9.1%, respectively. Lymphatic involvement, venous involvement, and lymph node metastasis were apparent in 27.3%, 45.5%, and 72.7% of the patients, respectively.
Patient characteristics.

SD: standard deviation; UICC: Union for International Cancer Control.
Differences in the total LPI, LPG, LPS, LPA, LPC, and LPE levels between colon cancer tissues and normal tissues
The levels of different LPLs measured in colon cancer and normal tissues are shown in Figure 1. The amounts of LPI, LPG, LPS, and LPA; LPI levels were significantly higher in colon cancer than in normal tissues (248 ± 59.9 nmol/g and 99.3 ± 34.2 nmol/g, respectively; p = 0.03). Levels of LPG were slightly, but not significantly higher in colon cancer than in normal tissues (178 ± 55.5 nmol/g and 77.2 ± 19.7 nmol/g, respectively; p = 0.11). Levels of LPS were significantly higher in colon cancer than in normal tissues (153 ± 23.3 nmol/g and 68.2 ± 7.83 nmol/g, respectively; p = 0.01). In contrast, LPA levels were significantly lower in colon cancer than in normal tissues (20.0 ± 4.39 nmol/g and 38.6 ± 5.55 nmol/g, respectively; p = 0.002). Levels of LPC and LPE did not differ significantly between colon cancer and normal tissues (LPC: 2419 ± 537 nmol/g and 2186 ± 480 nmol/g, respectively; p = 0.66; LPE: 642 ± 182 nmol/g and 704 ± 212 nmol/g, respectively; p = 0.52) (Figure 1(b)).
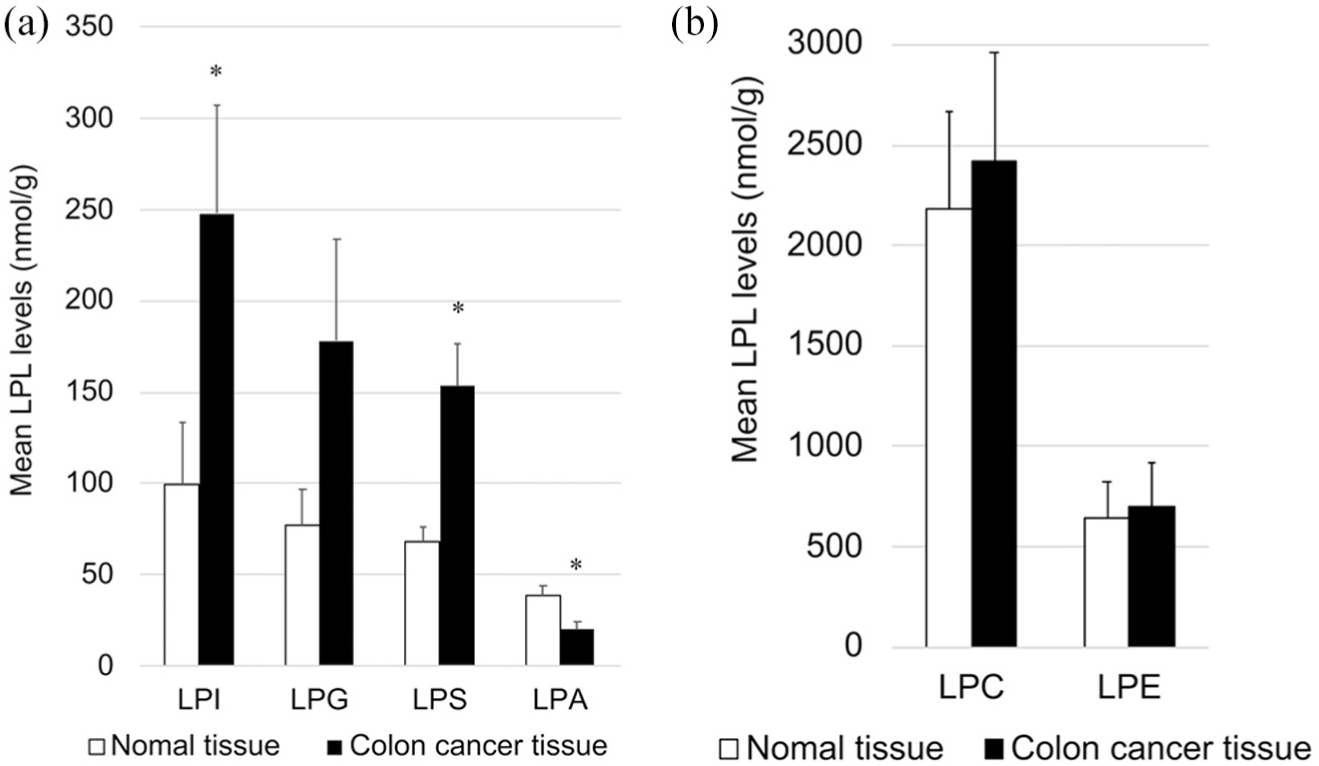
Quantification of different lysophospholipids (LPLs) in colon cancer and normal colon tissues as detected by LC–MS/MS: (a) levels of lysophosphatidic acid (LPA), lysophosphatidylinositol (LPI), lysophosphatidylglycerol (LPG), and lysophosphatidylserine (LPS) in colon cancer and normal tissues; (b) levels of phosphatidylcholine (LPC) and lysophosphatidylethanolamine (LPE) in colon cancer and normal tissues. All data represent mean ± SE.
Fatty acid distribution of LPL species
We investigated the fatty acid compositions of the different LPLs in the 11 sets of colon cancer tissues and normal tissues. As shown in Figure 2(a), colon cancer tissues contained significantly higher levels of 18:0 LPI than normal tissues (166 ± 42.1 nmol/g and 63.0 ± 25.9 nmol/g, respectively; p = 0.018). Levels of 20:4 LPI were significantly higher in colon cancer than in normal tissues (13.0 ± 2.47 nmol/g and 5.48 ± 1.00 nmol/g, respectively; p = 0.016).

Quantification of different fatty acid species of different lysophospholipids (LPLs) in colon cancer and normal tissues. The different types of LPLs based on the polar heads were first quantified: (a) lysophosphatidylinositol (LPI), (b) lysophosphatidylglycerol (LPG), (c) lysophosphatidylserine (LPS), (d) lysophosphatidic acid (LPA), (e) lysophosphatidylcholine (LPC), and (f) lysophosphatidylethanolamine (LPE). Following this, the acyl chains for each polar head were further quantified (14:0, 16:0, 18:0, 18:1, 18:2, 20:3, 20:4, 20:5, and 22:6). All data represent mean ± SE.
Similarly, levels of 18:1 LPG and 18:2 LPG were significantly higher in colon cancer than in normal tissues (18:1 LPG: 101 ± 29.0 nmol/g and 30.5 ± 5.45 nmol/g, respectively; p = 0.03; 18:2 LPG: 40.3 ± 13.4 nmol/g and 7.00 ± 2.1 nmol/g, respectively; p = 0.04) (Figure 2(b)). Levels of 22:6 LPG in colon cancer tissues were also significantly higher than those in normal tissues (5.00 ± 1.61 nmol/g and 1.82 ± 0.65 nmol/g, respectively; p = 0.04) (Figure 2(b)).
Levels of 18:0 LPS and 18:1 LPS were significantly higher in colon cancer than in normal tissues (18:0 LPS: 83.6 ± 13.3 nmol/g and 36.0 ± 5.55 nmol/g, respectively; p = 0.006; 18:1 LPS: 50.1 ± 7.53 nmol/g and 25.8 ± 3.00 nmol/g, respectively; p = 0.01) (Figure 2(c)). Similarly, the levels of 20:4 LPS and 22:6 LPS were significantly higher in colon cancer than in normal tissues (20:4 LPS: 2.16 ± 0.38 nmol/g and 0.91 ± 0.15 nmol/g, respectively; p = 0.009; 22:6 LPS: 4.06 ± 0.83 nmol/g and 1.21 ± 0.21 nmol/g, respectively; p = 0.005). Although the mean levels of 18:2 LPS in colon cancer tissues were found to be 4.5 times higher than those in normal tissues, this result was not found to be significant (p = 0.06) (Figure 2(c)).
We also found that the levels of 18:1 LPA and 18:2 LPA were significantly lower in colon cancer than in normal tissues (18:1 LPA: 8.06 ± 2.02 nmol/g and 18.7 ± 2.79 nmol/g, respectively; p = 0.01; 18:2 LPA: 4.55 ± 1.36 nmol/g and 8.96 ± 2.05 nmol/g, respectively; p = 0.02) (Figure 2(d)).
Finally, the levels of different molecular species of LPC and LPE were found to be similar between colon cancer and normal tissues (Figure 2(e) and (f)).
Separation and quantification of 1-acyl types and 2-acyl types of LPLs in colon cancer tissues
We determined the distribution of acyl chains between the sn-1 and sn-2 positions in LPIs, LPGs, LPSs, and LPAs via reverse-phase HPLC in five sets of colon cancer tissues and normal tissues. Patient characteristics of the five selected samples are provided in Supplementary Table 1.
The levels of 1-acyl LPIs in colon cancer tissues were higher than those of 2-acyl LPIs (336 ± 59.5 nmol/g and 149.4 ± 59.3 nmol/g, respectively). The predominant species in the 1-acyl LPI group was 18:0 1-acyl LPI (273 ± 47.8 nmol/g), followed by 18:1 1-acyl LPI (21.7 ± 4.07 nmol/g) (Figure 3(a)). In contrast, 18:0 2-acyl LPI was not detected in colon cancer tissues, and the predominant 2-acyl LPI species was found to be 18:1 2-acyl LPI (38.0 ± 13.8 nmol/g), followed by 18:2 2-acyl LPI (16.7 ± 6.17 nmol/g) and 20:4 2-acyl LPI (12.4 ± 1.78 nmol/g) (Figure 3(b)).
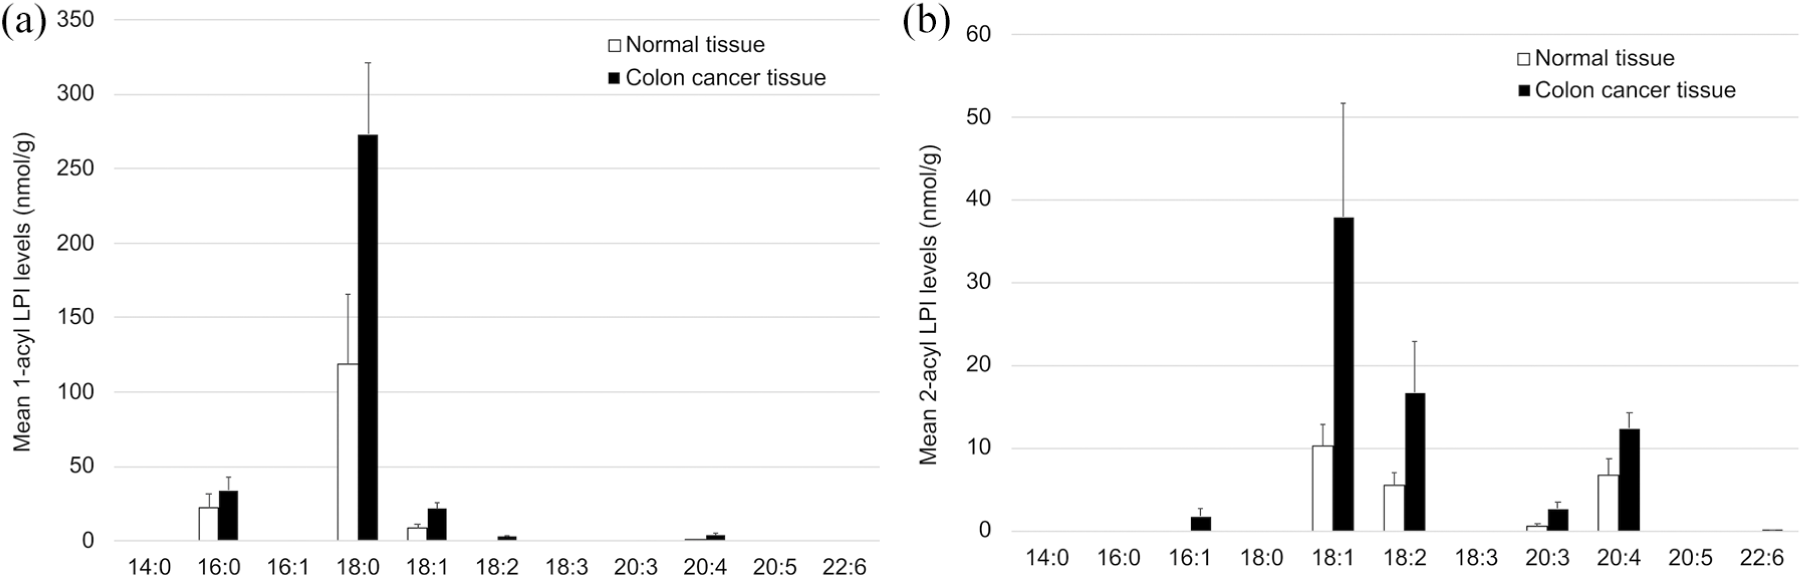
Quantification of 1-acyl lysophosphatidylinositols (LPIs) and 2-acyl LPIs in colon cancer and normal tissues using LC–MS/MS for a subset of samples (n = 5). The levels of 1-acyl LPIs (a) and 2-acyl-LPIs (b) are shown for each acyl chain. All data represent mean ± SE.
The levels of 2-acyl LPGs in colon cancer tissues were higher than those of 1-acyl LPGs (202 ± 41.3 nmol/g and 69.5 ± 16.6 nmol/g, respectively) (Figure 4). Among the 1-acyl LPG species, levels of 18:1 1-acyl LPG were the highest (26.9 ± 9.51 nmol/g), followed by 18:2 1-acyl LPG (17.1 ± 8.53 nmol/g), 16:0 1-acyl LPG (15.5 ± 12.1 nmol/g), and 18:0 1-acyl LPG (7.55 ± 5.33 nmol/g) (Figure 4(a)). Among the 2-acyl LPG species, the predominant species was found to be 18:1 2-acyl LPG (118 ± 22.6 nmol/g), followed by 18:2 2-acyl LPG (49.2 ± 10.9 nmol/g) (Figure 4(b)).

Quantification of 1-acyl lysophosphatidylglycerols (LPGs) and 2-acyl LPGs in colon cancer and normal tissues using LC–MS/MS for a subset of samples (n = 5). The levels of 1-acyl LPGs (a) and 2-acyl LPGs (b) are shown for each acyl chain. All data represent mean ± SE.
The levels of 1-acyl LPSs in colon cancer tissues were greater than those of 2-acyl LPSs (154 ± 22.0 nmol/g and 62.9 ± 13.6 nmol/g, respectively) (Figure 5). The 18:0 1-acyl LPS species was the predominant component (121 ± 18.9 nmol/g) in the 1-acyl LPS species group, followed by 18:1 1-acyl LPS (18.8 ± 2.38 nmol/g) (Figure 5(a)). The 18:1 2-acyl LPS species was the predominant component in the 2-acyl LPS group (40.8 ± 7.60 nmol/g), followed by 18:2 2-acyl LPS (9.28 ± 3.60 nmol/g), 22:6 2-acyl LPS (4.50 ± 1.15 nmol/g), and 20:4 2-acyl LPS (2.15 ± 0.32 nmol/g) (Figure 5(b)).
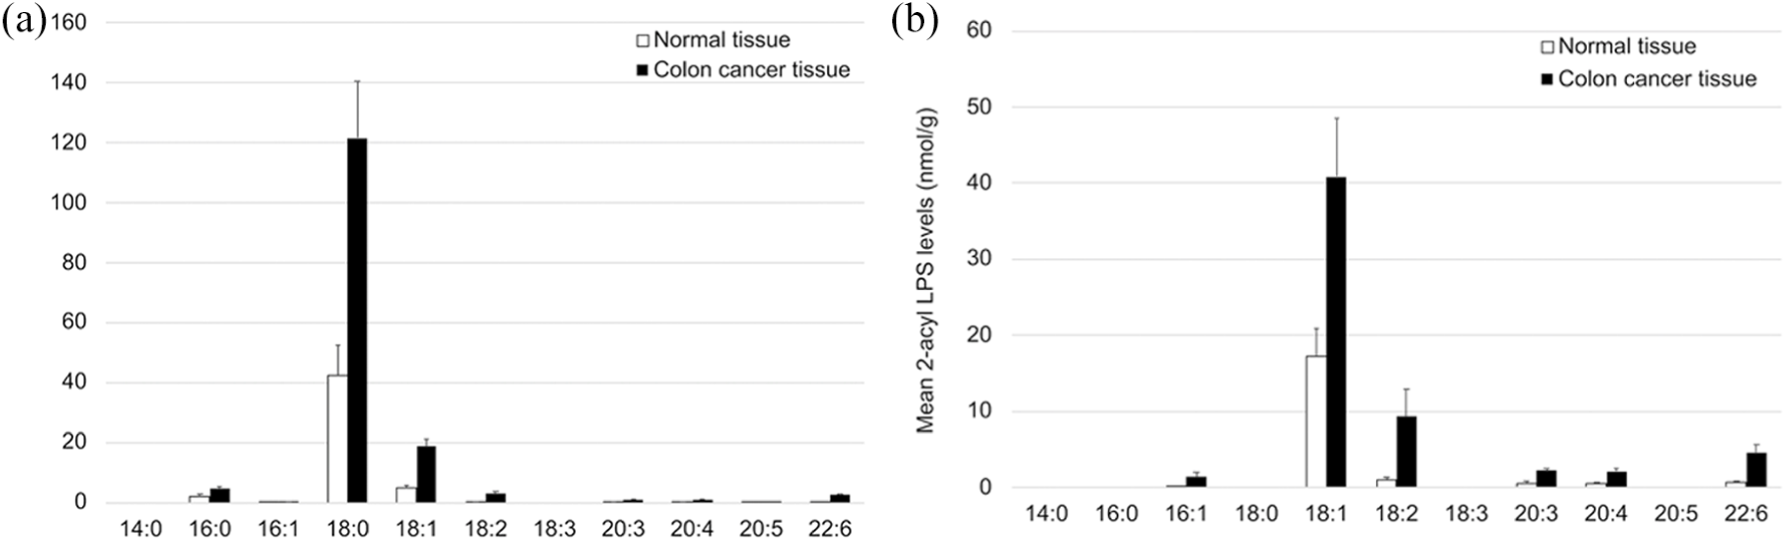
Quantification of 1-acyl lysophosphatidylserines (LPSs) and 2-acyl LPSs in colon cancer and normal tissues using LC–MS/MS for a subset of samples (n = 5). The levels of 1-acyl LPSs (a) and 2-acyl LPSs (b) are shown for each acyl chain. All data represent mean ± SE.
Levels of 1-acyl LPAs in colon cancer tissues did not significantly differ from those of 2-acyl LPAs (12.0 ± 3.50 nmol/g and 12.2 ± 3.78 nmol/g, respectively) (Figure 6). The 18:1 1-acyl LPA species was the predominant component (4.22 ± 1.65 nmol/g) in the 1-acyl LPA group, followed by 18:0 1-acyl LPA (3.20 ± 0.61 nmol/g) (Figure 6(a)). In the 2-acyl LPA group, 18:1 2-acyl LPA was found to be the most abundant (6.44 ± 2.10 nmol/g), followed by 18:2 2-acyl LPA (4.69 ± 1.31 nmol/g) (Figure 6(b)).
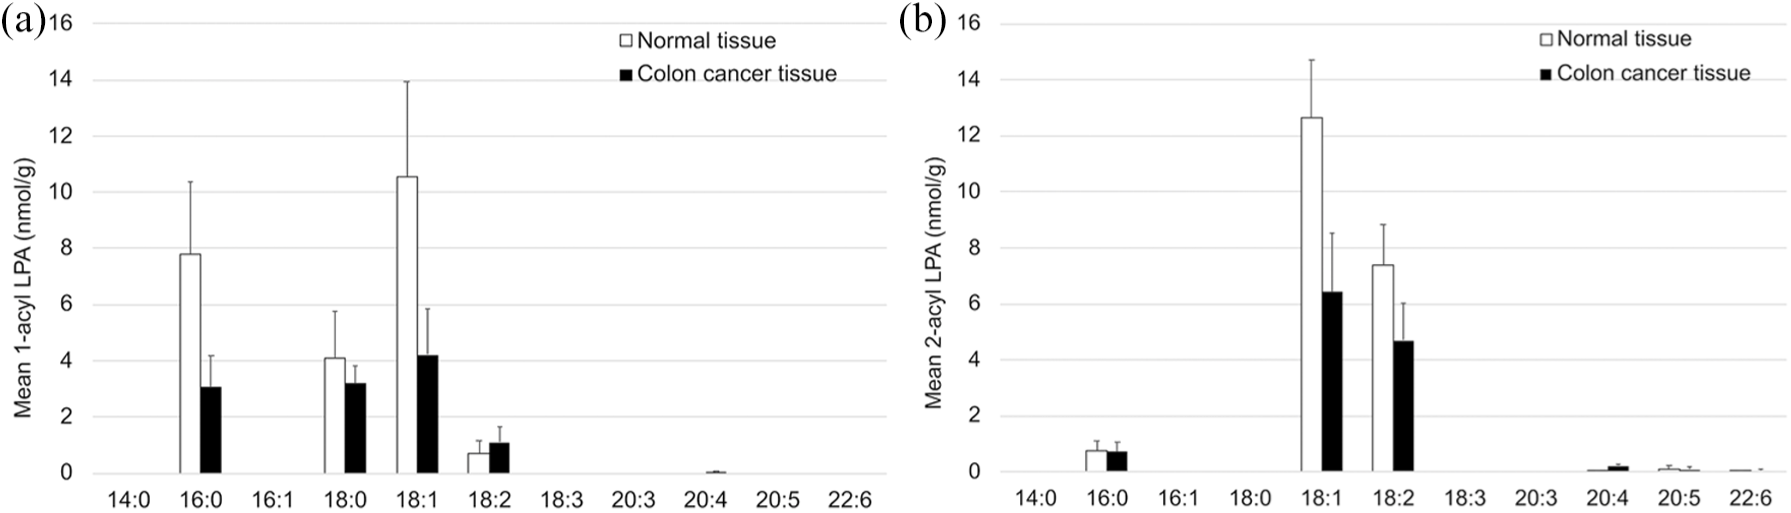
Quantification of 1-acyl lysophosphatidic acids (LPAs) and 2-acyl LPAs in colon cancer and normal tissues using LC–MS/MS for a subset of samples (n = 5). The levels of 1-acyl LPAs (a) and 2-acyl LPAs (b) are shown for each acyl chain. All data represent mean ± SE.
Discussion
In the past, sphingolipids were only species of LPLs, the levels of which were evaluated in colon cancer. 11 To our knowledge, this study is the first to directly quantify each LPL species in clinical samples of colon cancer and normal tissues. Owing to improvements in LC–MS/MS methodologies, we were able to use this technique in quantifying LPL species and found that the levels of LPIs and LPSs were significantly higher in colon cancer tissues than in normal tissues. In addition, colon cancer tissues were also found to contain higher levels of LPGs than normal tissues, although this difference was not found to be significant. However, levels of LPAs were significantly lower in colon cancer tissues than in normal tissues (Figure 1(a)).
Our results also indicate that, among all the LPIs in colon cancer tissues, 18:0 LPI was the most dominant species, followed by 18:1 LPI and 20:4 LPI (Figure 2(a)). Furthermore, 1-acyl LPIs were more abundant than 2-acyl LPIs in colon cancer tissues, with the most dominant species in the two classes being 18:0 1-acyl LPI and 18:1 2-acyl LPI, respectively (Figure 3). LPIs are known to bind to the G protein-coupled receptor 55 (GPR55), which was previously considered an orphan receptor. 4 Since GPR55 is upregulated in the spleen, thymus, testes, small intestine, brain, and other organs, the receptor has been suggested to be involved in immune function.16,17 In human colorectal cancers, GPR55 upregulation is reportedly associated with lower relapse-free survival (RFS) rates. 18 Furthermore, GPR55-mediated LPI stimulation is known to induce migration in colorectal cancer cells, 19 in addition to which GPR55 may be implicated in the proliferation of prostate, ovarian, and kidney cancer cell lines.20,21
Although we find that 20:4 2-acyl LPI is present in much lower levels than 18:0 1-acyl LPI in colon cancer tissues, the biological activity of 20:4 2-acyl LPI in activating GPR55 has been reported to be 10–20 times higher than that of 18:0 1-acyl LPI, suggesting that 20:4 2-acyl LPI is a physiological ligand for GPR55. 22 In this study, we found that the levels of 20:4 2-acyl LPI are approximately twofold higher in colon cancer tissues than in normal tissues, although the difference was not found to be statistically significant (Figure 3(b)); however, we believe that this upregulation of 20:4 2-acyl LPI levels may play an important role in colon cancer proliferation.
We have also found that colon cancer tissues contain higher levels of 1-acyl LPIs than 2-acyl LPIs, which suggests that PLA2 may play a major role in the biosynthesis of LPIs in colon cancer. This is because PLA2 hydrolyzes the glycerol skeleton at the sn-2 position to produce 1-acyl LPLs. The most prevalent form of PLA2 responsible for 1-acyl LPI production is cytoplasmic PLA2 (cPLA2α), which releases arachidonic acid (AA) from membrane phospholipids. 23 The enzyme responsible for the biosynthesis of 2-acyl LPIs is intracellular PLA1 (DDHD domain containing 1 (DDHD1), previously identified as phosphatidic acid-preferring PLA1 (PA-PLA1)).24,25 DDHD1 is believed to decompose phosphatidylinositols (PIs) in the cell membrane to generate 20:4 2-acyl LPI. 24 According to a report by Hiraide et al., 26 the invasive fronts of colorectal cancers contain elevated levels of AA-containing PIs. Taken in conjunction with our results, this suggests that both, 18:0 1-acyl LPI and 20:4 2-acyl LPI, may play important roles in colon cancer progression.
In addition to the above results, this study also shows that the predominant LPG species present in colon cancer tissues is 18:1 2-acyl LPG (Figure 4(b)). A study by Oka et al. 4 reported that, much like LPI, LPG can also cause a minor Ca2+ influx into GPR55-expressing cells, accompanied by a slight rise in cellular activities such as migration. However, the mechanisms underlying LPG biosynthesis, and other receptors that LPG molecules may bind to, are as yet unknown. The increase in 2-acyl LPG levels in colon cancer tissues suggested that PLA1 may cause the increase of its substrate, phosphatidylglycerol (PG) and the activation of PLA1, the enzyme responsible for 2-acyl LPG production.
Our study further indicates that the levels of 18:0 1-acyl LPS and 18:1 2-acyl LPS are higher in colon cancer tissues than in normal tissues (Figure 5). The reported physiological functions of LPS include the promotion of degranulation in mast cells, 27 suppression of T-cell proliferation,28,29 and promotion of neural axis extension. 30 To date, three LPS receptors, namely, LPS1/GPR34, LPS2, and LPS3, have been identified. 31 In a previous publication, we have reported that LPS can activate the phosphatidylinositol 3-phosphate kinase/Akt pathway via LPS1/GPR34 and increase cell migration in colorectal cancer cells. 9 Furthermore, it has also been observed that phosphatidylserine-specific PLA1 expression not only enhances the invasiveness of primary colorectal cancers, but also promotes blood-borne metastasis. 32 Expression levels of secreted PLA2, which produces 1-acyl LPS, are also associated with lymph node and distant metastases in colorectal cancer, and high levels of expression of this protein indicate poor prognosis.33,34 In all, our results seem to support the theory that LPS, LPS receptors, and LPS-producing enzymes likely play pivotal roles in colorectal cancer progression.
LPAs, which are reportedly involved in various cellular functions, including the promotion of cell growth and cancer infiltration,35–37 were found to occur in lower levels in colon cancer tissues than in normal tissues (Figure 1(a)). One plausible mechanism for this decrease in LPA levels could lie in the upregulation of LPA2 receptors which is known to occur in colorectal cancer. 6 We hypothesize that LPA2, which has also been implicated in the malignant phenotypes of colorectal cancer in vitro and in vivo,38,39 may have bound LPA molecules, due to which the levels of LPAs in colon cancer tissues were found to be unexpectedly lower by 48% as compared to normal tissues (Figure 1(a)). Further work will be required to elucidate the mechanisms by which this happens.
Limitations of this study are a small sample size and the limited localization of primary cancer. Therefore, it is required to perform the same analyses using more cases of colorectal cancer arising in other locations and of different macroscopic and histological types. In addition, further studies should be performed to elucidate the role of individual LPLs that changed in colon cancer tissues.
Conclusion
We demonstrated that LPI and LPS increased significantly, whereas LPA decreased in colon cancer. We noted marked increases in 18:0 LPI and 18:0 LPS. These components may be potentially involved in colorectal carcinogenesis.
Supplemental Material
TUBSupplementary_Table – Supplemental material for The component changes of lysophospholipid mediators in colorectal cancer
Supplemental material, TUBSupplementary_Table for The component changes of lysophospholipid mediators in colorectal cancer by Chieko Kitamura, Hirofumi Sonoda, Hiroaki Nozawa, Kuniyuki Kano, Shigenobu Emoto, Koji Murono, Manabu Kaneko, Masaya Hiyoshi, Kazuhito Sasaki, Takeshi Nishikawa, Yasutaka Shuno, Toshiaki Tanaka, Keisuke Hata, Kazushige Kawai, Junken Aoki and Soichiro Ishihara in Tumor Biology
Footnotes
Acknowledgements
Declaration of conflicting interests
The author(s) declared no potential conflicts of interest with respect to the research, authorship, and/or publication of this article.
Funding
The author(s) disclosed receipt of the following financial support for the research, authorship, and/or publication of this article: This research was supported by Grants-in-Aid for Scientific Research (C: grant no. 16K07143, C: grant no. 16K07161, C: grant no. 17K10620, C: grant no. 17K10621, C: grant no. 17K10623, and C: grant no. 18K07194) from Japan Society for the Promotion of Science, by the Project for Cancer Research and Therapeutic Evolution (P-CREATE, grant no. 18cm0106502h0003 from the Japan Agency for Medical Research and Development (AMED)), and by the LEAP JP17gm0010004 (K.K. and J.A.) from the Japan Agency for Medical Research and Development (AMED).
Supplemental material
Supplemental material for this article is available online.
References
Supplementary Material
Please find the following supplemental material available below.
For Open Access articles published under a Creative Commons License, all supplemental material carries the same license as the article it is associated with.
For non-Open Access articles published, all supplemental material carries a non-exclusive license, and permission requests for re-use of supplemental material or any part of supplemental material shall be sent directly to the copyright owner as specified in the copyright notice associated with the article.