
Abstract
BACKGROUND:
Kidney renal clear cell carcinoma (KIRC) belongs to renal cell carcinoma which is a very aggressive malignant tumor with poor prognosis and high mortality. The MKRN family includes three members MKRN1, MKRN2 and MKRN3, which are closely related to cancers, and have been involved in many studies.
OBJECTIVE:
This study aimed to explore the roles of MKRN family in KIRC.
METHODS:
The expression of MKRNs was analyzed using the UALCAN database, prognostic analysis was performed with the GEPIA2 and Kaplan-Meier Plotter database, and correlation analysis was assessed by GEPIA2. The CCK-8 and colony formation assay were performed to detect cell proliferation, wound healing assays were performed to detect cell migration, cell cycles were detected by flow cytometry analysis, GST pull-down and co-immunoprecipitation assays were performed to detect the interaction of proteins, and the expression of MKRNs, p53 and other proteins were detect by immunoblotting analysis or quantitative PCR (qPCR).
RESULTS:
MKRN1 and MKRN2 were lowly expressed in KIRC samples compared to the corresponding normal tissues, and KIRC patients with high levels of MKRN1 and MKRN2 showed higher overall survival (OS) and disease free survival (DFS) rates. The overexpression of MKRN1 and MKRN2 inhibited the proliferation of human KIRC cells by arresting the cell cycles, but shows little effect on cells migration. The expression of MKRN1 and MKRN2 are correlated, and MKRN1 directly interacts with MKRN2. Moreover, both MKRN1 and MKRN2 were closely correlated with the expression of TP53 in KIRC tumor, and promoted the expression of p53 both at protein and mRNA levels.
CONCLUSIONS:
Our study suggests that MKRN1 and MKRN2 serve as tumor suppressors in KIRC, and act as promising therapeutic targets for KIRC treatment.
Abbreviation
Introduction
The MAKORIN (MKRN) gene family encodes proteins with a makorin-specific Cys-His arrangement, a RING zinc finger and several zinc-finger motifs [1, 2]. Three members, namely MKRN1, MKRN2 and MKRN3, are included in this family, which share highly homologous amino acid sequences, especially in the zinc finger motifs, suggesting that they may have similar functions [1]. All these MKRN family proteins can function as E3 ligase, and many substrates for them have been identified.
MKRN1 has been involved in regulating the length of telomere, and the degradation of cell cycle regulator p21 and tumor suppressor protein p53 [3, 4]. MKRN1 shows both the negative and positive effects on RNA polymerase II-dependent transcription, and was identified as a repressor for androgen receptor, c-Jun and retinoic acid (RA) receptor transcriptional activity [5]. MKRN1 has been shown to bind with and ubiquitylate adenomatous polyposis coli (APC) which is a tumor-suppressor function, increasing its proteasome degradation and favorably regulating Wnt/-catenin-mediated biological activities [6]. MKRN1 promotes the ubiquitination and proteasome degradation of Fas-associated protein with death domain (FADD) regulates death receptor-mediated apoptosis and necroptosis in HeLa cells [7].
MKRN2 promotes the degradation of inflammatory responsed p65, regulates the proliferation and migration of human neuroblastoma cells by ubiquitinating IGF2BP3, and inhibits the metastasis of non-small cell lung cancer by regulating the PI3K/Akt signaling pathway [8, 9, 10].
MKRN3 is frequently mutated in non-small cell lung cancers (NSCLCs), and genomic MKRN3 aberrations are significantly enriched in NSCLC samples. MKRN3 modulates cell proliferation through PABPC1 nonproteolytic ubiquitination and subsequently, PABPC1-mediated global protein synthesis [11], which suggested that MKRN3 act as a tumor suppressor. However, elevated expression of MKRN3 was observed in in squamous cell carcinoma of the head and neck [12].
Clear cell renal carcinoma (KIRC) is the most common subtype of renal cell carcinoma with a poor prognosis and few treatment options [13]. Due to distant metastases, the 5-year survival rate of KIRC patients is only 10–20% [14]. Many targets for the treatment of advanced KIRC have been discovered and used in clinical practice, but few patients have benefited [15], so other targets are urgently needed. The MKRN family members are closely related to cancers and were involved in many studies as above descrbed, but their roles in KIRC have not been illustrated. The aim of this study is to explore the roles of MKRN1, MKRN2 and MKRN3 in human KIRC.
Materials and methods
Analyses involving publicly available databases
University of alabama cancer database (UALCAN)
ULACAN (
Gene expression profiling interactive analysis 2 (GEPIA2)
GEPIA2 (
Kaplan-meier plotter
The Kaplan-Meier plotter (
cBioPortal
cbiopportal (
Cell culture and transfection
The human embryonic kidney cell line HEK293T and human kidney renal clear cell carcinoma cell lines (786-O and OSRC-2) were purchased from the cell bank of Chinese Academy of Sciences (CAS). HEK293T cells were cultured in DMEM (high glucose), while786-O and OSRC-2 were cultured in RPMI1640, supplemented with 10% fetal bovine serum (FBS) and penicillin/streptomycin (all from Gibco, USA) in a 37
Plasmids construction
The plasmids containing MKRN1 and MKRN2 were amplified from the cDNA of human HEK293T cells using specific primers in Table S1, and inserted into pCDH, pCDNA3.0, pET28a or pGEX4T-1 vectors that digested with BamH I or Xho I, and recombination with amplified fragments using the ClonExpress II One Step Cloning Kit (Vazyme, China) according to the manufacturer’s instructions. Three shRNAs for MKRN1 and four shRNAs for MKRN2 were synthesized as oligos (Tingke, Shanghai, China), annealed and inserted into the pLKO.1 vector which was digested with restriction endonucleases EcoR I and Age I, the specific sequences for shRNAs seen in Table S2.
Cell proliferation assay
Five thousand 786-O or OSRC-2 cells that stably transfected with indicated plasmids that expressing genes or shRNAs were seeded into 96-well plates. Incubate the cells with Cell Counting Kit-8 (CCK8) solution (Beyotime, China) for 3 hours at the specified time, and the product was quantified by spectrophotometry at a wavelength of 450 nm in a microplate reader (Bio-Rad, USA). The experiments were conducted with eight replicates and repeated three times.
Colony formation assay
One thousand cells that stably transfected with pCDH, pCDH-MKRN1 or pCDH-MKRN2 were seeded into 6-well plates. Seven days later, Cells were fixed with 4% paraformaldehyde (Merck, Germany) at room temperature for 15 min, and stained with 0.2% crystal violet (Beyotime, China) seven days later. Images were obtained and the number of colonies was counted and calculated.
Cell cycle assay
786-O or OSRC-2 cells that stably transfected with pCDH, pCDH-MKRN1 or pCDH-MKRN2, were plated into 6-well plates and cultured overnight. Next day, the cells were collected and fixed with 70% ethanol for 1 hour, and then treated with 0.2% Triton X-100, 100
Wound healing assay
786-O cells that stably transfected with pCDH, pCDH-MKRN1 or pCDH-MKRN2 were seeded into 6-well plates at a density of 5
Recombinant protein purification
GST tagged MKRN1 or His6- tagged MKRN2 were expressed in BL21 E. coli cells. After isopropyl-
GST pull-down assay
Purified GST or GST-MKRN1 (50
Co-immunoprecipitation (Co-IP) and immunoblotting
For Co-IP, cells that co-transfected with pCDNA3.0-MKRN1-HA and pCDNA3.0-MKRN2-Flag were lysed in 1 ml Co-IP buffer (50 mM Tris-HCl, 150 mM NaCl, 5 mM EDTA and 1% NP-40, pH 7.4) supplemented with a protease inhibitor cocktail (Roche, Switzerland). The cell lysate was then centrifuged and incubated with anti-Flag affinity gel (Sigma, USA) at 4
Quantitative PCR (qPCR)
Total RNAs were extracted from cells using total RNA kit (Tiangen, China). Complementary DNA (cDNA) was synthesized using ReverTra Ace RT Master mix (Toyobo, Japan). Quantitative PCR (qPCR) assay was performed to determine the relative abundances of TP53 and GAPDH mRNAs using specific primers in Table S3, stained by SYBR Green (Tiangen, China) on the CFX96 real-time PCR system (Bio-Rad, USA). The relative abundances of TP53 mRNAs were normalized to that of GAPDH mRNAs, using the 2
Statistical analysis
Data of experiments are expressed as mean
Low expression levels of MKRN1 and MKRN2 in human kidney renal clear cell carcinoma (KIRC). (A) The mRNA expressions of MKRN1, MKRN2 and MKRN3 in human kidney renal clear cell carcinoma (KIRC) and corresponding normal tissues were analyzed using the UALCAN database. 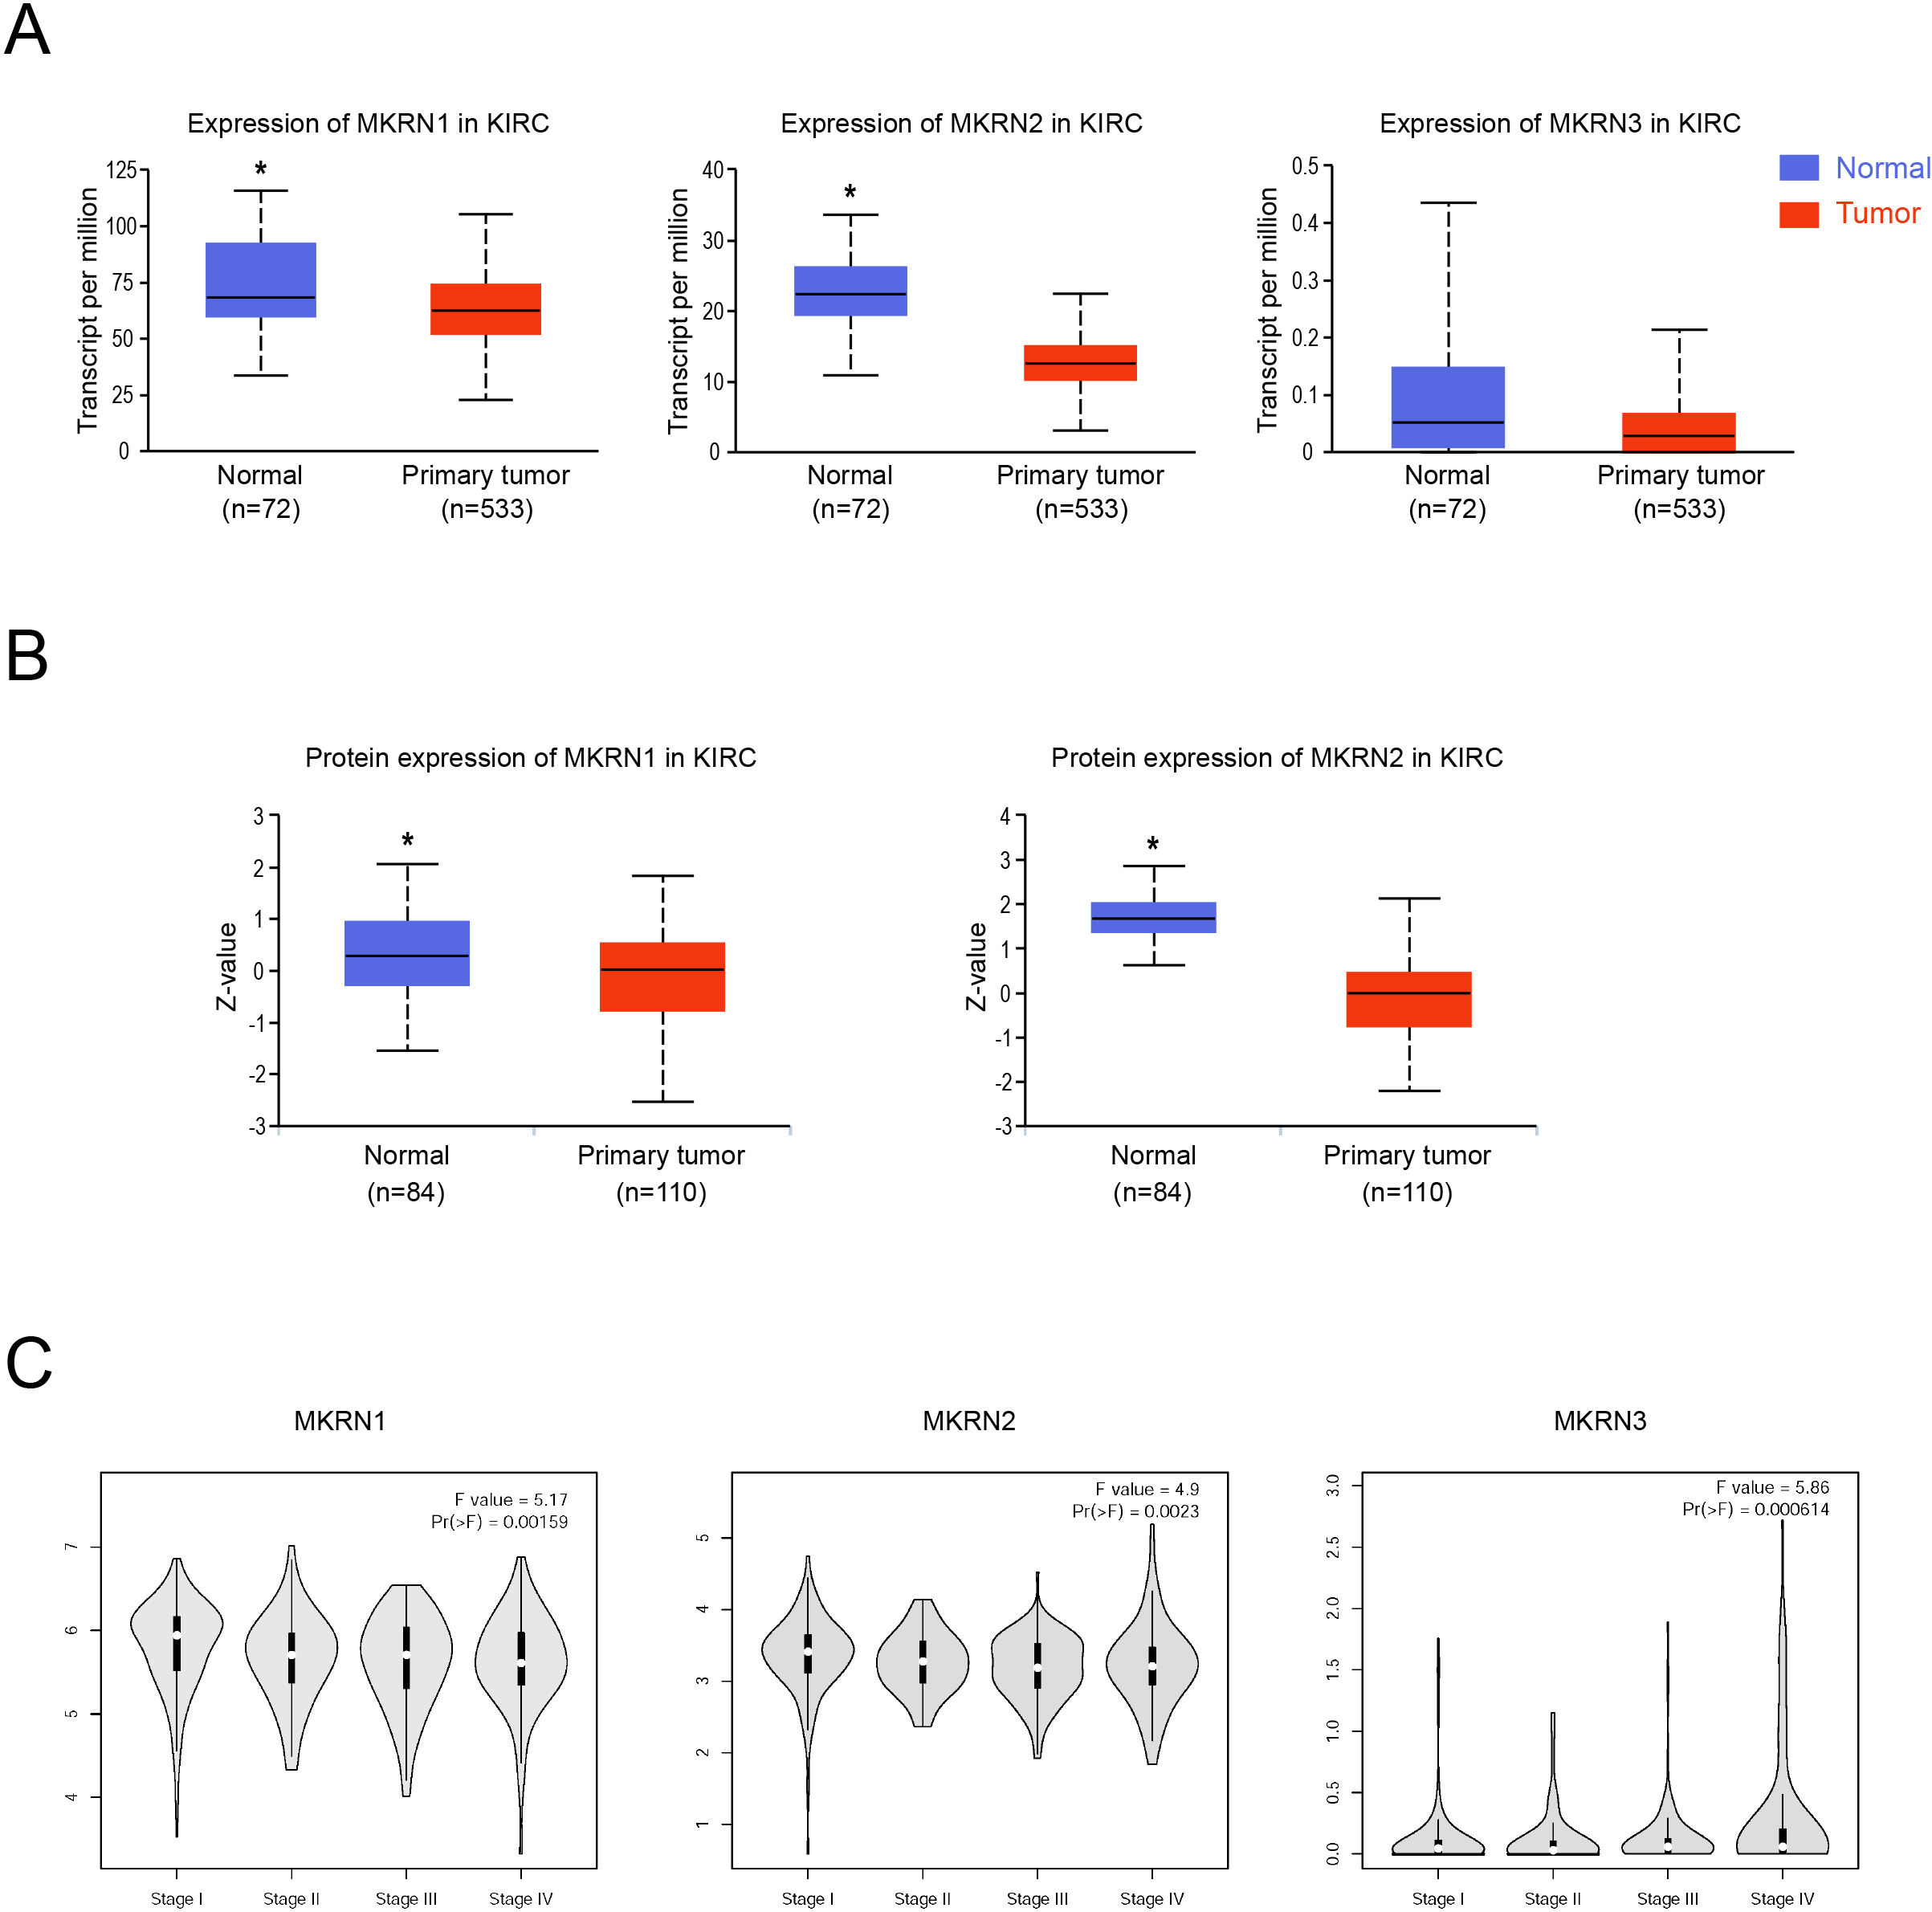
Prognostic values of MKRNs in KIRC. (A, B) The overall survival (OS) map (A) and disease free survival (DFS) map (B) of MKRNs in TCGA cancers analyzed using the GEPIA2 database. HR, hazard rate ratio 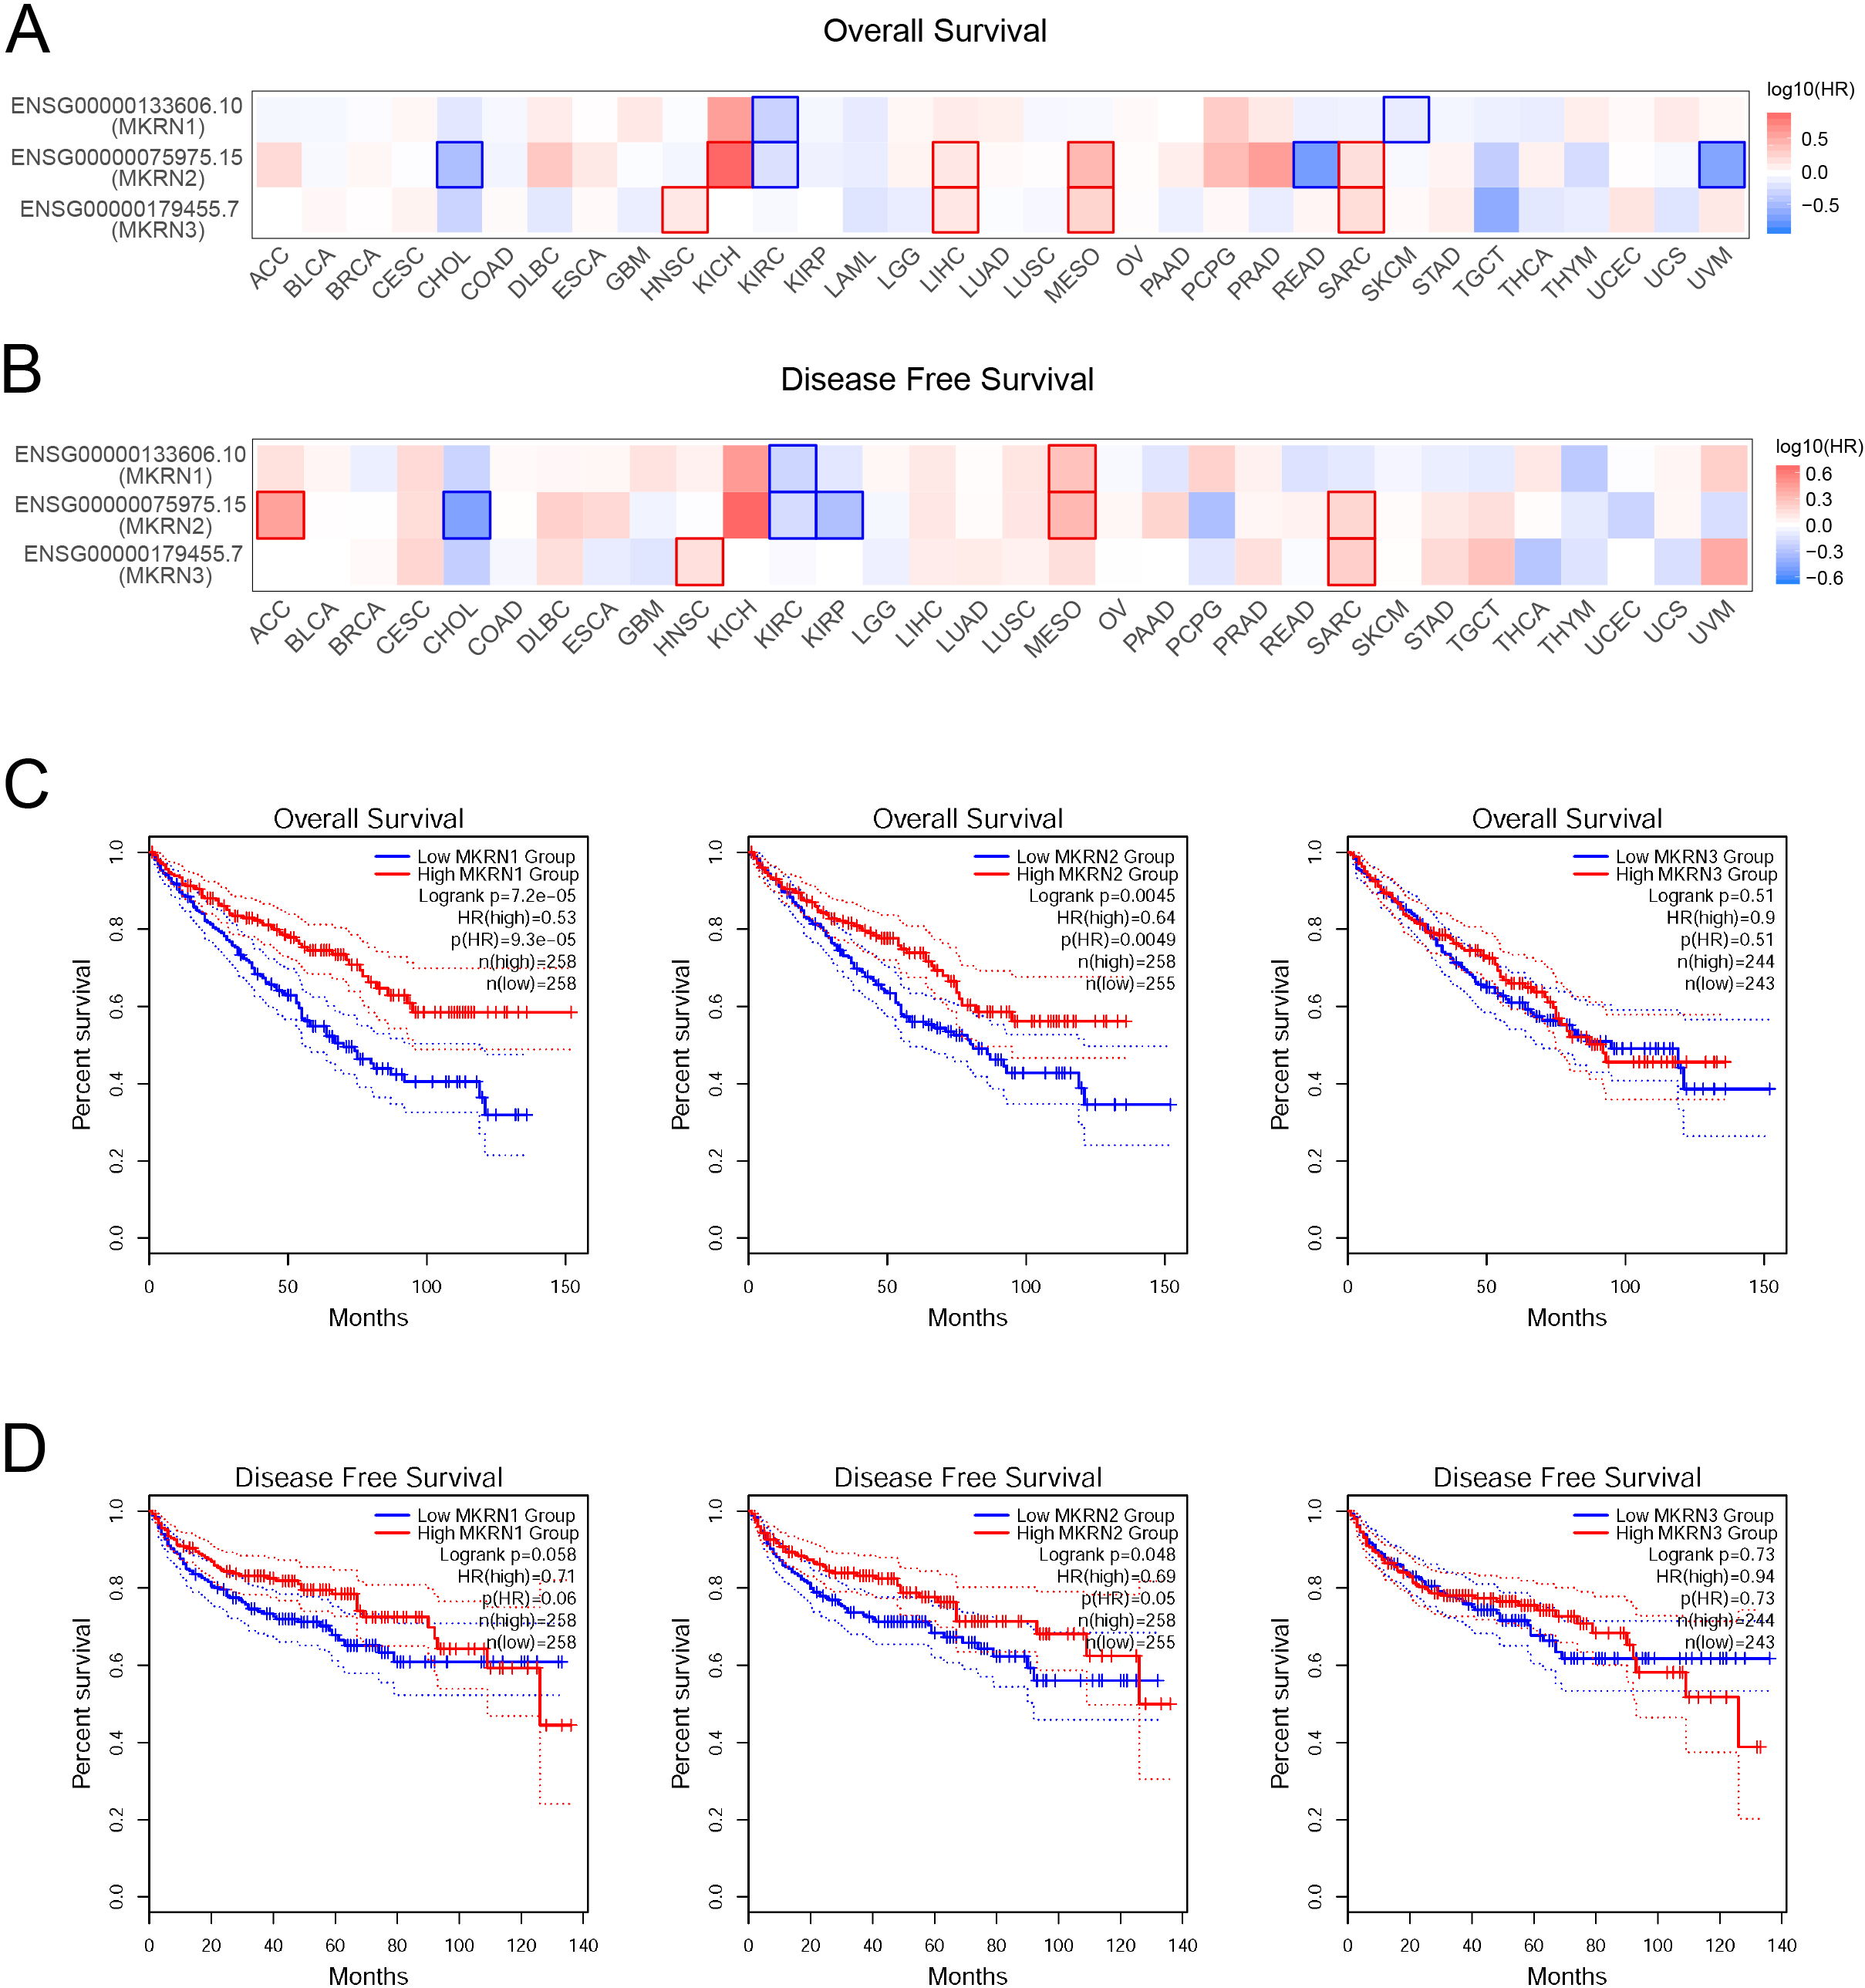
Low expression levels of MKRN1 and MKRN2 in human kidney renal clear cell carcinoma (KIRC)
A pan-cancer analysis of MKRN1, MKRN2 and MKRN3 in cancers was curated using the UALCAN database (Fig. S1A–C), and MKRN1 and MKRN2 were found lowly expressed in human kidney renal clear cell carcinoma (KIRC) samples compared to the corresponding normal tissues both at mRNA and protein levels (Fig. 1A and B). Since there is no data in the UALCAN CPTAC database, the protein expression of MKRN3 is not shown. The mRNA expression of MKRN3 is low in KIRC samples, and no obvious difference was observed in human KIRC tissues and the corresponding normal tissues (Fig. S1C and A).
Then the correlation between MKRNs (MKRN1, MKRN2 and MKRN3) mRNA expression and the pathological stage of KIRC patients were assessed using the GEPIA2 database. All three groups were highly variable, and the mRNA expression levels of MKRN1 and MKRN2 were gradually decreased with the progression of KIRC (Fig. 1C).
High levels of MKRN1 and MKRN2 predicts better survival in KIRC patients
To assess the value of differentially expressed MKRN family members in the progression of cancers, correlations between different MKRNs and clinical outcomes were analyzed using GEPIA2 (Fig. 2A and B). KIRC patients with high mRNA expression levels of MKRN1 and MKRN2 were significantly associated with better overall survival (OS) and disease free survival (DFS) rates, while this effect was not observed on MKRN3 (Fig. 2C and D). Furthermore, the Kaplan-Meier plotter were also used to analyze the prognostic values of MKRNs in patients with KIRC, high MKRN1 mRNA expression was significantly correlated with better OS and DFS rates (Fig. S2A and B). So, MKRN1 and MKRN2, but not MKRN3, were chosen for further study.
MKRN1 and MKRN2 inhibited the proliferation of human KIRC cells. (A) Protein expression profiles of MKRN1 and MKRN2 in human KIRC cell lines and human embryonic kidney 293T (HEK293T) cells detected by immunoblotting analysis. HEK293T cells acted as normal control. (B, C) MKRN1 and MKRN2 inhibited the proliferation of human KIRC cells. 786-O and OSRC-2 cells that stably transfected with pCDH (empty vector), and pCDH-MKRN1 (B) or pCDH-MKRN2 (C) were seeded into 96-well plates and the cell viability were detected by the CCK-8 assay at indicated time points. Three independent experiments. (D, E) MKRN1 and MKRN2 inhibited the colony formation of human KIRC cells. 786-O and OSRC-2 cells that stably transfected with pCDH (empty vector), and pCDH-MKRN1 (D) or pCDH-MKRN2 (E) were seeded into 6-well plates, the cells colonies were stained with crystal violet, and photos were taken. The colony numbers were counted and calculated.Three samples each group.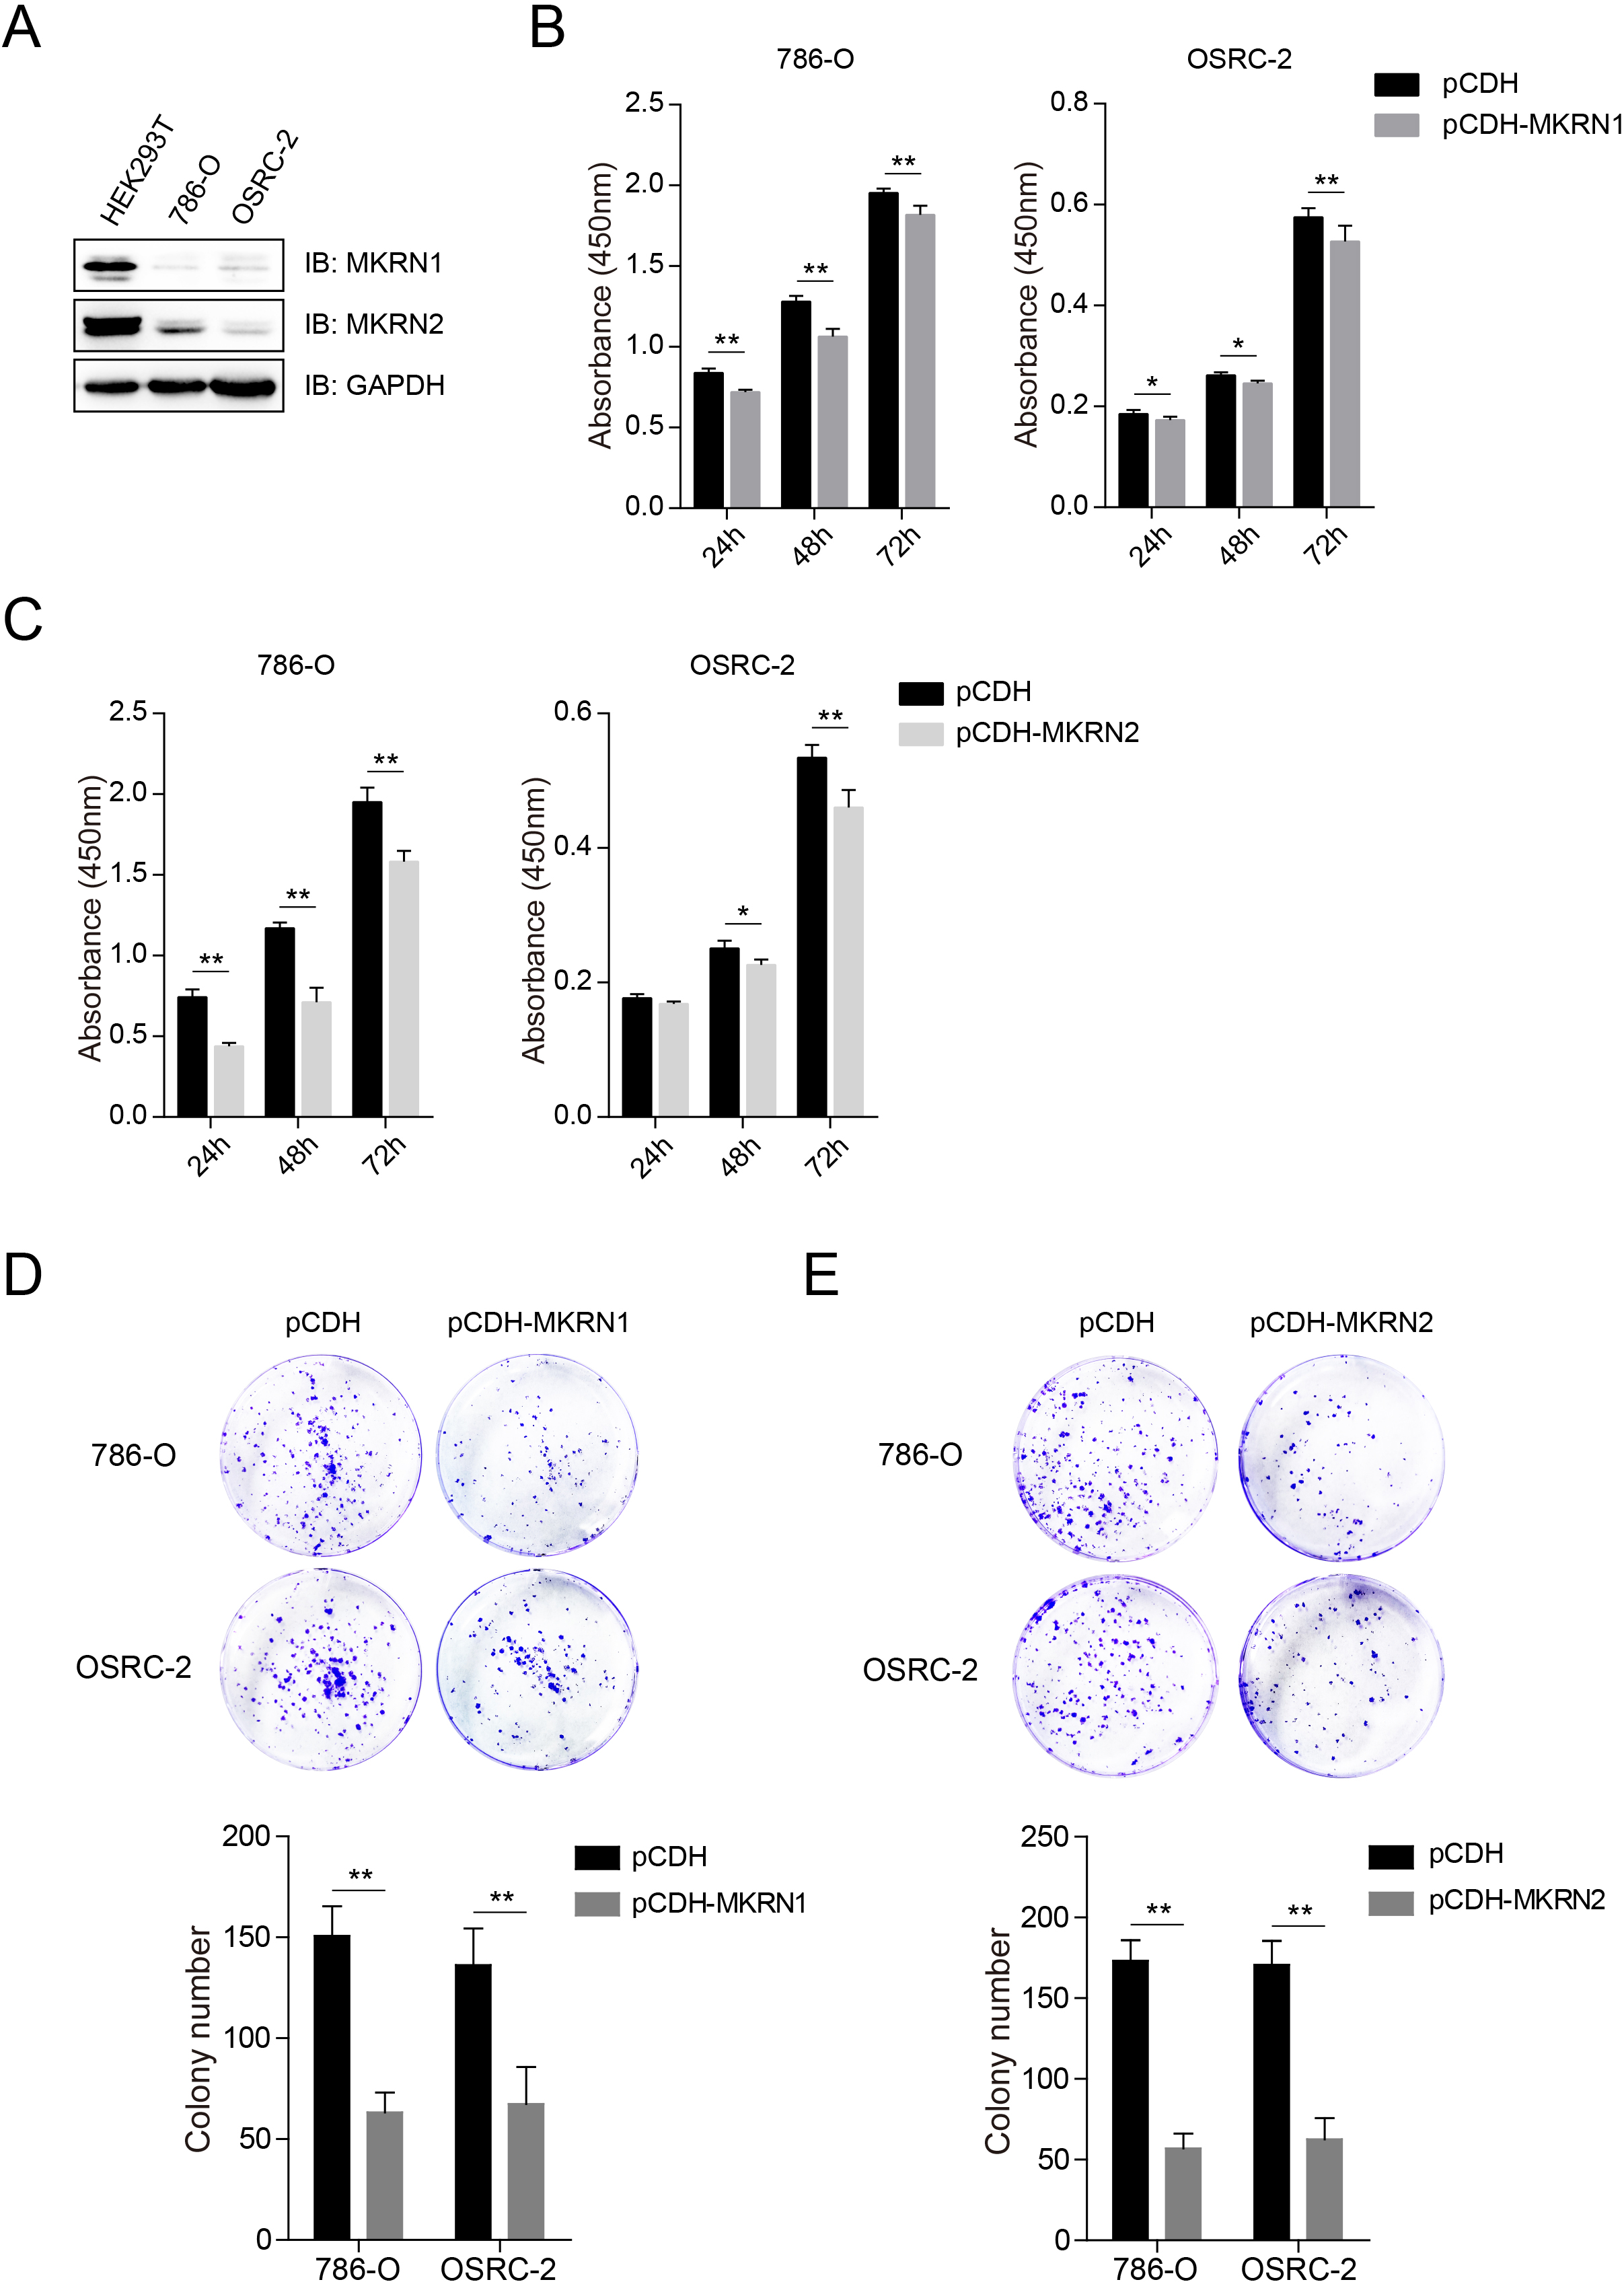
The expression of MKRN1 and MKRN2 are correlated, and MKRN1 interacts with MKRN2. (A) Correlation analysis of MKRN1 and MKRN2 mRNA levels in KIRC tumor, KIRC normal and kidney cortex using the GEPIA2 database. (B) MKRN1 interacted with MKRN2 in vitro. Recombinant GST-tagged MKRN1 and His6-tagged MKRN2 proteins were purified, and GST pull-down assay was performed before subjected to immunoblotting analysis. PD, pull-down. (C) MKRN1 formed a complex with MKRN2 in HEK293T cells. Cells were co-transfected with plasmids that expressed Flag tagged MKRN2 and HA tagged MKRN1, and the lysates were immunoprecipitated using anti-Flag affinity gels before subjected to immunoblotting analysis with indicated antibodies. Co-IP, Co-immunoprecipitation.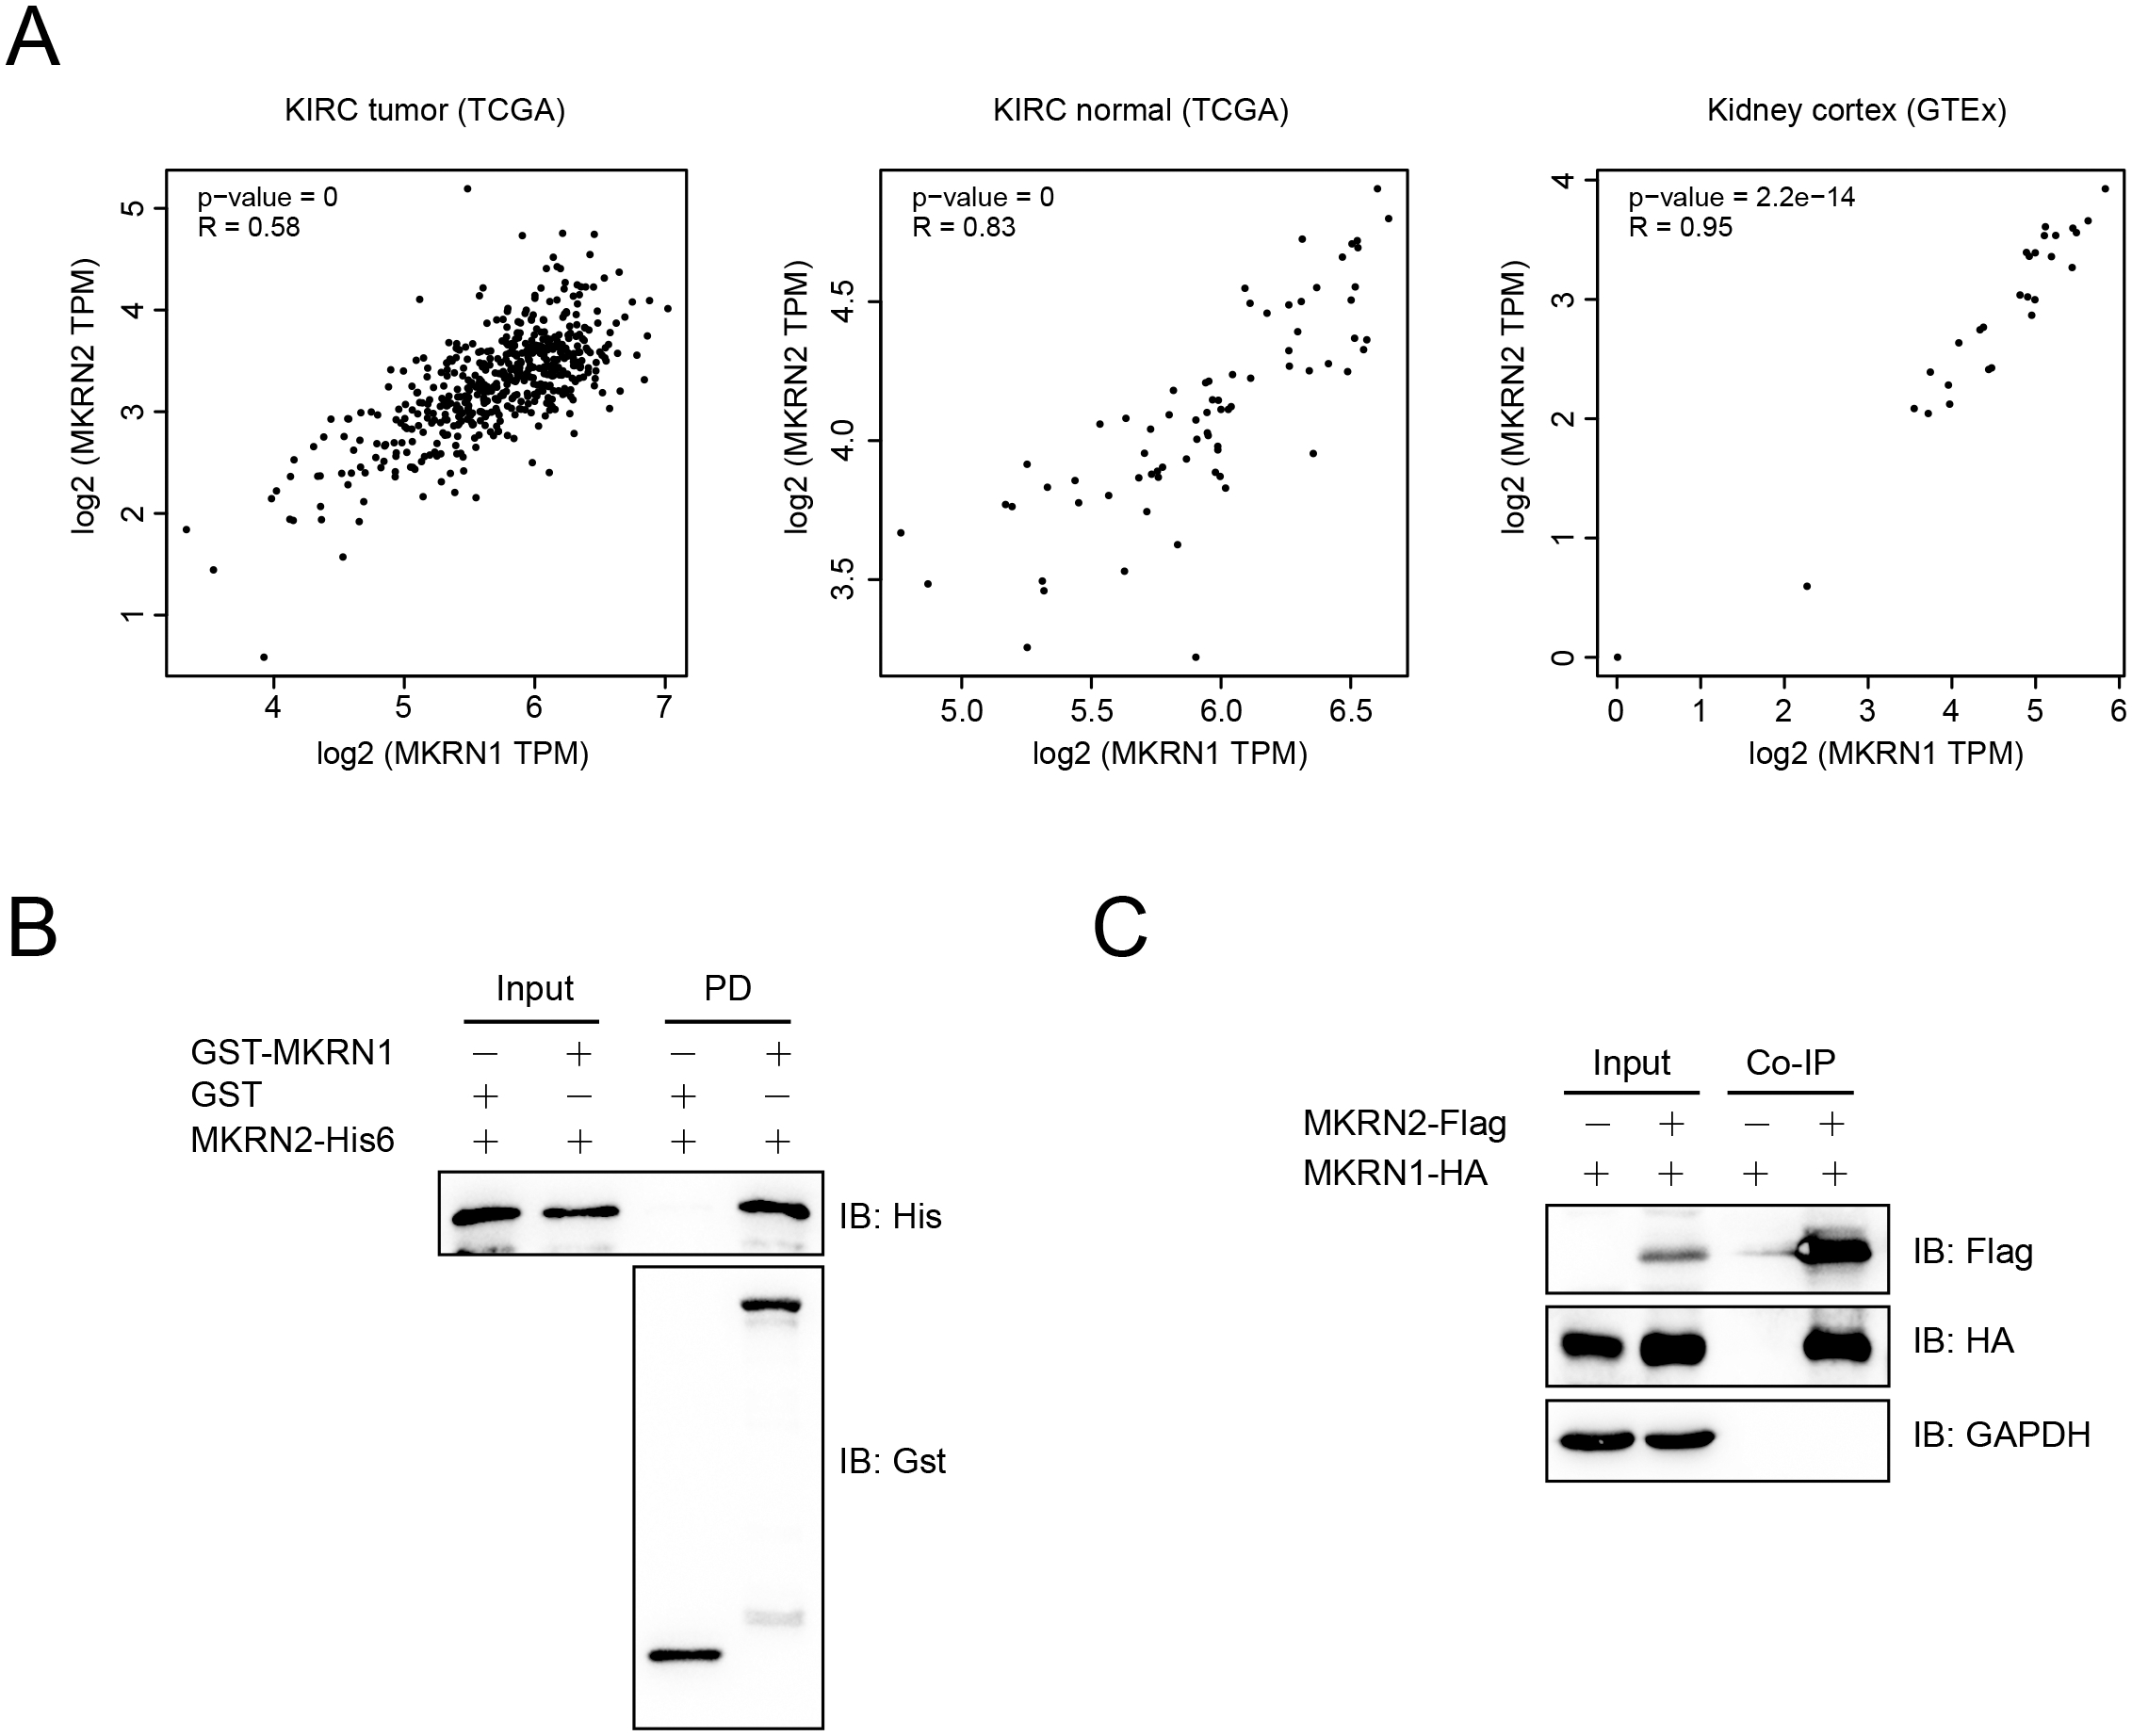
MKRN1 and MKRN2 promoted the expression of p53. (A, B) Correlation analysis of MKRN1 (A) or MKRN2 (B) and TP53 mRNA levels in KIRC tumor, KIRC normal and kidney cortex using the GEPIA2 database. (C) MKRN1 and MKRN2 promoted the expression of p53 protein in a dose-dependent manner. OSRC-2 cells were transiently transfected with different amounts of pCDH (empty vectors), pCDH-MKRN1or pCDH-MKRN2, and subjected to immunoblotting analysis using indicated antibodies 48 hours later. (D) MKRN1 and MKRN2 synergistically promoted the expression of p53 protein. OSRC-2 cells were transiently transfected with pCDH-MKRN1 or pCDH-MKRN2, and subjected to immunoblotting analysis using indicated antibodies 48 hours later.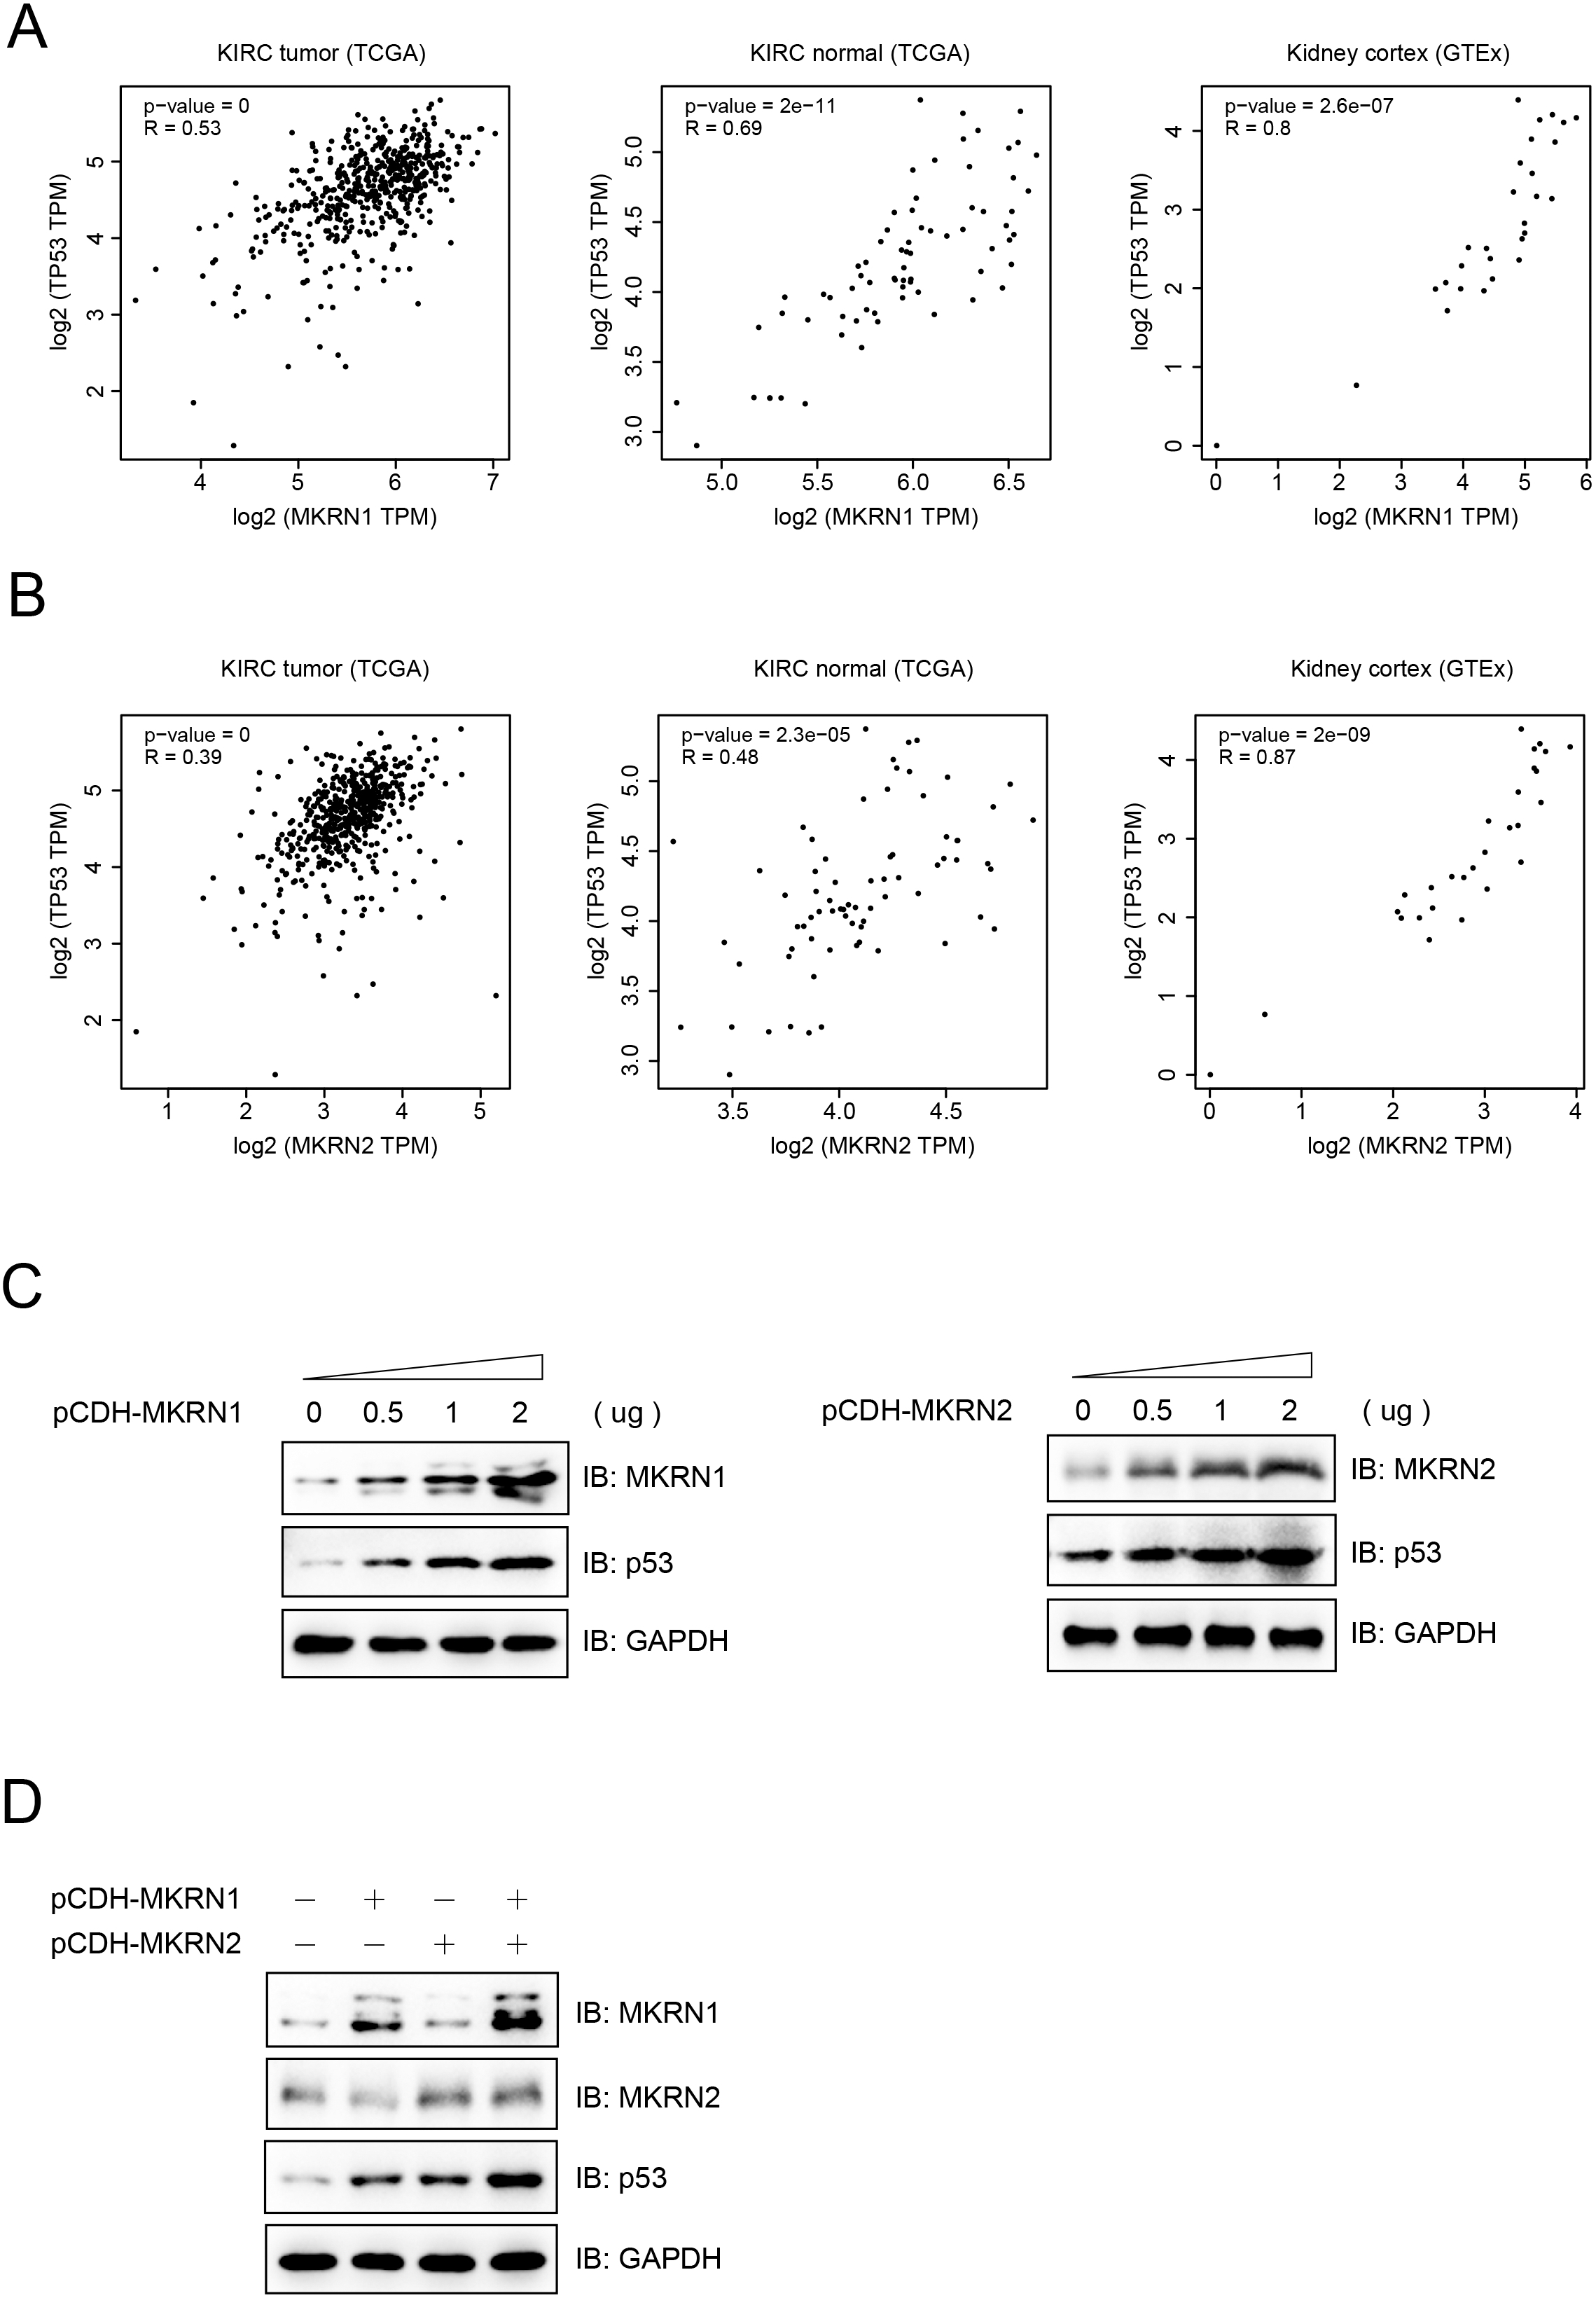
The genetic alterations of MKRNs in KIRC patients were analyzed using the cBioPortal online tool. As showed in Fig. S3A and B, MKRNs were altered in 15 of 354 KIRC patients, accounting for 4.2%. MKRN1 were altered in 3 samples of 354 patients, including 2 gene mutations and 1 amplification; MKRN2 were altered in 9 samples of 354 patients, all were deep deletion; MKRN3 were altered in 3 samples of 354 patients, all are gene mutations. The results might suggest that gene mutations of MKRN1 and MKRN2 were seldom found in KIRC patients, so their expression changes become the focus of our further study.
The protein levels of MKRN1 and MKRN2 were lower in the two human KIRC cell lines (786-O and OSRC-2) compared to human embryonic kidney 293T (HEK293T) cells (Fig. 3A). To investigate the effect of MKRN1 and MKRN2 on KIRC cells, 786-O and OSRC-2 that stably transfected with MKRN1 or MKRN2 were established (Fig. S4A). As showed in Fig. 3B and C, significant cells growth arrest were observed in MKRN1 or MKRN2 overexpression cell lines (pCDH-MKRN1or pCDH-MKRN2) compared with that of control groups (pCDH), which was consistent with the results of colony formation assay (Fig. 3D and E). Flow cytometry analysis revealed that MKRN1 and MKRN2 inhibited the cell cycle progression of both786-O and OSRC-2 cells (Fig. S4B). Immunoblotting analysis found that MKRN1 and MKRN2 inhibited the expression of cell cycle proteins including CCNA1, CCNB1 and CCND1, but showed little effect on apoptosis protein markers (CASPASE3 and PARP) and epithelial-mesenchymal transition (EMT) protein markers (Vimentin and E-cadherin) (Fig. S4C). Wound healing assays were performed with 786-O cells that stably transfected with MKRN1 or MKRN2, and no obvious effect on the migration of human these cells were observed (Fig. S4D).
Furthermore, the shRNAs targeting MKRN1 and MKRN2 were designed and the knockdown efficiency was tested (Fig. S5A and C). The shMKRN1-1 and shMKRN1-3 for MKRN1, and shMKRN2-1 and shMKRN2-2 for MKRN2 were chosen for further study. The CCK-8 assay indicated that the ablation of MKRN1 and MKRN2 promoted the proliferation of 786-O and OSRC-2 cells (Fig. S5B and D).
The expression of MKRN1 and MKRN2 are correlated, and MKRN1 interacted with MKRN2
A correlation analysis was performed between MKRN1 and MKRN2 using the GEPIA2 database. The mRNA expression of MKRN1 and MKRN2 were closely correlated in KIRC tumor, KIRC normal and kidney cortex (Fig. 4A). Further study indicated that MKRN1 directly interacted with MKRN2 in vitro as detected by GST pull-down assay (Fig. 4B), and MKRN1 formed a complex with MKRN2 in HEK293T cells (Fig. 4C). These data suggested that MKRN1 and MKRN2 are synergistic in their biological functions.
MKRN1 and MKRN2 promoted the expression of p53
A correlation analysis was performed between MKRN1 or MKRN2 and TP53 using the GEPIA2 database. Both MKRN1 and MKRN2 were closely correlated with the mRNA expression of TP53 in KIRC tumor, KIRC normal and kidney cortex (Fig. 5A and B). MKRN1 or MKRN2 promoted the expression of p53 in a dose-dependent manner both at protein and mRNA levels (Figs 5C and S6A). We also found that MKRN1 and MKRN2 synergistically promoted the expression of p53 both at protein and mRNA levels (Figs 5D and S6B). Further study indicated that the ablation of MKRN1 or MKRN2 inhibited the expression of p53 (Fig. S6C and D). These results suggested that MKRN1 or MKRN2 regulated the expression of p53 mainly at transcription level.
Discussion
Kidney renal clear cell carcinoma (KIRC) is a subtype of renal cell carcinoma, which is a very aggressive malignant tumor shows poor prognosis and high mortality [15], so promising biomarkers or therapeutic targets for KIRC are urgently needed. MKRN1 and MKRN2 is lowly expressed in KIRC samples compared to the corresponding normal tissues (Fig. 1) and patients with high levels of MKRN1 and MKRN2 shows higher overall survival (OS) and disease free survival (DFS) rates (Fig. 2), which suggest that they might act as an important prognostic indicators, even good therapeutic targets for KIRC treatment.
MKRN1 and MKRN2 are widely expressed in human tissue [1, 23], and we found that they are extensively expressed across TCGA cancers (Fig. S1A and B), while the expression of MKRN3 is low in most tumors (Fig. S1C). The expression of MKRN3 is tissue-specific, mainly expressed in the brain and reproductive system [24], which may explain why MKRN3 is highly expressed in Glioblastoma (Fig. S1C). Due to its low expression, its role in KIRC is limited.
The expression of MKRN1 and MKRN2 are highly correlated in KIRC tumor and normal tissues, and they show a direct interaction (Fig. 4). One possibility is that MKRN1 and MKRN2 can form a heterodimer, and they indeed synergistically promoted the mRNA expression of p53 (Figs 5D and S6B).
Both MKRN1 and MKRN2 were closely correlated with the expression of TP53 gene which encodes the most famous tumor suppressor p53 (Fig. 5A and B). KIRC cells that transfected with MKRN1 or MKRN2 showed higher p53 protein and mRNA levels (Figs 5C and S6A), and we inferred that MKRN1 or MKRN2 regulated the expression of p53 mainly at transcription level. As previously reported, MKRN2 binds selectively to the 3’UTR of a diverse subset of mRNAs [25], one possibility is that MKRN2 might binds to the 3’ UTR of TP53 mRNA or the regulators of TP53 mRNA. These are several studies seem to be contrary to our results: MKRN1 destabilize both p53 and p21 through ubiquitination and proteasome-dependent degradation that promotes the proliferation of H1299 and U2OS cells [4], and the ubiquitination of p53 by E3 ligase MKRN2 promotes melanoma cell proliferation [26]. Whether MKRN1/2 acts as an oncogene or tumor suppressor gene might depend on the cancer types, and the detailed reason need to be further explored.
The von Hippel-Lindau tumor suppressor gene (VHL) is mutated or silenced in
Thus, our study suggests that MKRN1 and MKRN2 are tumor suppressor genes, and might be potential therapeutic targets for KIRC treatment. There are also some limitations or weaknesses in our study, such as no in vivo experiments or animal studies were not involved, and an ongoing effort is to test the functions of MKRN1 and MKRN2 in animal models and patient samples of KIRC.
Conclusions
Based on bioinformatics analysis and validated by experiments, MKRN1 and MKRN2 serve as tumor suppressors in kidney renal clear cell carcinoma, and act as promising therapeutic targets for KIRC treatment.
Data availability
All the data generated or analyzed during this study are included in the published article, and the cell lines and plasmids could be offered on reasonable request.
Ethics approval and consent to participate
No animals and patients’ samples were involved in this study.
Consent for publication
Not applicable.
Author contributions
Conception: Chuanyin Li, Chengcheng Wang and Yonghui Tao.
Interpretation or analysis of data: Chuanyin Li, Chengcheng Wang, Yun Yang, Yanyan Luo and Shuting Huang.
Preparation of the manuscript: Chuanyin Li, Chengcheng Wang, Yun Yang and Yanyan Luo.
Revision for important intellectual content: Chuanyin Li, Chengcheng Wang, Yonghui Tao and Yun Yang.
Supervision: Chengcheng Wang and Chuanyin Li.
Funding
This work was funded by the National Natural Science Foundation of China (31900804, 31960179), the Guizhou Province Science and Technology Foundation ([2020]1Y086), the Shanghai Sailing Program (19YF1444700), the Interdisciplinary Program of Shanghai Jiao Tong University (ZH2018QNA64) and the China Postdoctoral Science Foundation (2018M642109).
Supplementary data
The supplementary files are available to download from http://dx.doi.org/10.3233/CBM-210559.
sj-pdf-1-cbm-10.3233_CBM-210559.pdf - Supplemental material
Supplemental material, sj-pdf-1-cbm-10.3233_CBM-210559.pdf
sj-docx-1-cbm-10.3233_CBM-210559.docx - Supplemental material
Supplemental material, sj-docx-1-cbm-10.3233_CBM-210559.docx
Footnotes
Acknowledgments
We thank all members of our laboratory for their support.
Conflict of interest
All authors declare that they have no conflict of interest.