
Abstract
Introduction
Renal cancer, particularly Kidney Renal Clear Cell Carcinoma (KIRC), remains a major clinical challenge due to its aggressive nature and poor prognosis. Identifying reliable biomarkers for tumor progression and survival is critical for improving patient outcomes. This study aimed to investigate the role of Centromere Protein F (CENPF) as a potential prognostic biomarker for renal cancer.
Method
Data from the TCGA database, including Kidney Chromophobe (KICH), Kidney Renal Papillary Cell Carcinoma (KIRP), and KIRC, were analyzed to identify differentially expressed genes. Molecular Complex Detection (MCODE) was used to identify significant gene modules among upregulated genes, and univariate Cox regression analyses assessed the prognostic value of hub genes. Retrospective qPCR was conducted on tissue and plasma samples from KIRC patients to validate findings. Single-cell sequencing data from the GSE159115 dataset were analyzed, and the CIBERSORT algorithm was applied to evaluate the composition of tumor immune infiltrating cells (TIICs).
Results
CENPF was identified as a hub gene significantly upregulated in renal cancer subtypes, with overexpression linked to worse survival outcomes in KIRC patients. Retrospective qPCR confirmed high CENPF expression was associated with poorer prognosis. Single-cell sequencing revealed that CENPF is predominantly expressed in T-cell clusters. TIIC analysis showed a negative correlation between CENPF and resting mast cells, but positive correlations with follicular helper T-cells and memory-activated CD4T-cells. Prognostic analysis indicated that high follicular helper T-cell expression predicted poorer survival, while high plasma cell expression correlated with better outcomes.
Conclusion
CENPF plays a critical role in tumor progression and the modulation of the tumor immune microenvironment in KIRC. These findings suggest that CENPF could serve as a valuable prognostic biomarker and potential target for therapeutic intervention in renal cancer.
Introduction
Renal cell carcinoma (RCC) is a type of cancer that originates from renal tubular epithelial cells 1 and ranks among the top ten most common cancers worldwide. RCC accounts for approximately 2% of all cancer diagnoses and deaths globally, with higher incidence rates observed in developed countries. 2 Furthermore, it appears that new favorable subsets of cancers of unknown primary (CUP) are emerging, including RCC, contributing to the current surge in RCC incidence. Nevertheless, the absence of established or validated diagnostic criteria for CUP exhibiting renal characteristics hinders the clinical interpretation of treatment outcomes, thereby limiting our understanding and ability to optimize patient care. 3
Significant progress has been made in understanding RCC's histopathology and molecular characteristics over the past two decades, leading to major revisions in its classification by pathology experts.4–6 The primary subtypes, 7 each with an incidence of at least 5%, include KIRC, 8 KIRP, 9 and KICH. 10 Standard treatment typically involves surgical resection of the tumor, either partial or radical nephrectomy, for resectable cases. Patients with inoperable or metastatic RCC often receive systemic treatments, such as targeted therapies or immune checkpoint inhibitors, with treatment decisions guided by various nomograms. 11 Over the past 15 years, groundbreaking advancements have been achieved in the realm of targeted therapies for advanced renal cell carcinoma, notably through the integration of tyrosine kinase inhibitors (TKIs), mTOR inhibitors, and immunotherapeutics, either as standalone treatments or in strategic combinations with TKIs. 12 Despite these advancements, TKI monotherapy continues to occupy a pivotal position as the first-line therapy of choice for a considerable segment of patients who are ineligible for immunotherapy, with the STAR trial findings offering direct relevance to this patient population. 13
While some patients may not initiate their treatment journey with a TKI as a first-line option, they may still benefit from it as a monotherapy in a second-line setting. Notably, a recent study has revealed an intriguing insight: the observed difference in life expectancy between patients adhering to a drug-free interval strategy and those following a conventional continuous treatment approach appears to be clinically insignificant. This finding underscores the potential feasibility and cost-effectiveness of incorporating treatment breaks into TKI therapy regimens for renal cell carcinoma patients while also offering the promise of lifestyle enhancements. 13
A recent study, utilizing comprehensive bioinformatics analysis, identified and analyzed novel biomarkers associated with chromophobe renal cell carcinoma, highlighting CENPA, KNG1, and AGT as the top three hub genes specific to this subtype. 14 Additionally, bioinformatics analysis revealed ADCY1, APLN, FRMD5, GNG4, GREB1, KIF23, CXCL1, CXCL2, GPR84, IRF8, and TLR4 as key hub genes associated with clear cell renal cell carcinoma. 15 Another investigation demonstrated a significant correlation between CD8+ T cells and improved overall survival in KICH, whereas a higher proportion of regulatory T cells was linked to poorer outcomes in KIRC. In KIRP, favorable outcomes were associated with M1 macrophages, while worse outcomes were linked to M2 macrophages. 16 Furthermore, a separate study integrated CHEK2, PDK4, ZNF304, SNAI2, and SRC genes to develop a risk prediction model for KIRC. 17 Notably, there is a research gap in studies that integrate single-cell sequencing results with CIBERSORT immune infiltration analysis, particularly in KIRC. Therefore, this study aims to fill that gap with comprehensive research.
In this study, we identified differentially expressed genes (DEGs) in KIRC, KIRP, and KICH by analyzing datasets from the TCGA. Using Cytoscape, we selected CENPA, CENPU, CENPM, CENPF, and CENPE as key genes. Our analysis revealed that CENPF was significantly more highly expressed in KIRC tissues and plasma compared to paracancerous tissues or plasma from healthy individuals. The immunological significance of CENPF was further clarified through single-cell sequencing and immune infiltration analyses. These findings indicate that CENPF is upregulated and plays a role in modulating the immune microenvironment in renal cancer.
Materials and Methods
Data Sources
We downloaded clinical and gene expression data from the UCSC Xena database (https://xenabrowser.net/datapages/), with the clinical and gene expression data sourced from The Cancer Genome Atlas (TCGA). The datasets included normalized count data for KIRC (n = 607), KIRP (n = 321), and KICH (n = 89) patients. Additionally, we obtained single-cell gene expression matrix data (GSE159115) from the National Center for Biotechnology Information (NCBI) Gene Expression Omnibus (GEO), which includes 14 RCC specimens. The platform for GSE159115 is GPL16791 Illumina Hiseq 2500 (Homo sapiens). We also retrieved microarray datasets GSE105261 (GPL10558), GSE53000 (GPL6244), GSE6344 (GPL96), GSE68417 (GPL6244), GSE781 (GPL96), and GSE85258 (GPL570) from GEO to analyze the expression of CENPF.
Identifying and Visualizing Differentially Expressed Genes (DEGs) in KICH, KIRP, and KIRC
The “limma” package in R was employed to analyze differential RNA-seq log2(count + 1) data between tumor and normal groups. A P-value < .05 and |fold change| > 1 were used as thresholds to identify significant differential expression of the genes. The “ComplexHeatmap” package in R was then utilized to visualize DEGs in renal cancers, with hierarchical clustering applied for cluster analysis and heatmap generation.
Identification of Overlapping Hub Genes in KICH, KIRP, and KIRC
We screened for commonly upregulated differentially expressed genes (DEGs) across KICH, KIRP, and KIRC. We then utilized the STRING tool 18 to construct a protein-protein interaction (PPI) network for these common upregulated DEGs, with the network visualization performed using Cytoscape. 19 Subsequently, we employed the Molecular Complex Detection (MCODE) plug-in 20 within Cytoscape to identify the most significant module among the upregulated DEGs. Further analysis included univariate Cox regression on the hub genes, with the results visualized using the forestplot R package.
Study Population
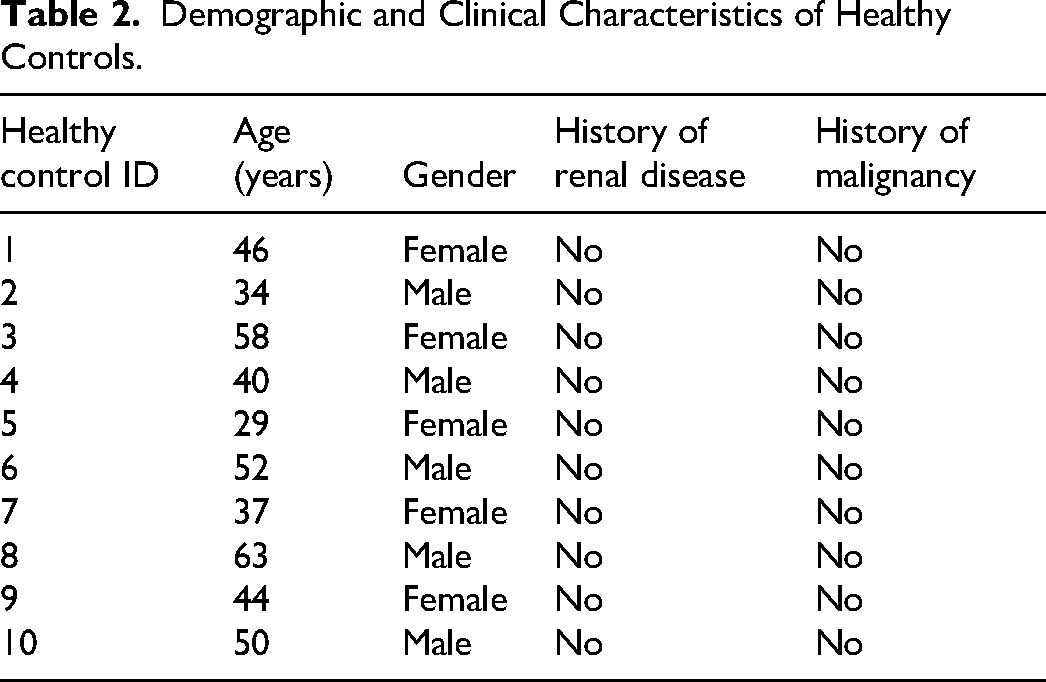
This study is a retrospective analysis utilizing pre-collected and preserved samples from both cases and controls. The study population included patients diagnosed with clear cell renal cell carcinoma (KIRC) and healthy control participants, with stratified analyses conducted based on factors such as TNM staging, age, and gender. Patient samples were collected between January 1, 2023, and March 1, 2023, with follow-up extending until November 2023 and a median follow-up time of August 2023. KIRC patients were recruited from our hospital, which provided comprehensive clinical data. The control group consisted of age- and gender-matched healthy volunteers with no history of cancer. Written informed consent was obtained from all participants, and the study protocol was approved by the hospital's ethics committee. Inclusion and Exclusion Criteria are shown in Figure 4. Sample size calculations were performed using the “pwr” package in R, with an effect size (d) set to 2, indicating that a minimum of five samples were required for both experimental and control groups. Samples were categorized into groups (eg, tumor vs adjacent normal tissue), and marker levels between these groups were compared using t-tests to assess statistical significance. Tumor tissue samples from KIRC patients were obtained through surgical resection or biopsy, immediately frozen at −80 °C, or fixed in formalin and embedded in paraffin. Blood plasma samples were collected from both patient and control groups via venipuncture with EDTA tubes, separated by centrifugation, and stored at −80 °C for subsequent analysis. Demographic and Clinical Characteristics are shown in Tables 1 and 2.
Demographic and Clinical Characteristics of KIRC Patients.

Demographic and Clinical Characteristics of Healthy Controls.
Real-Time Quantitative PCR (qPCR)
Plasma samples were collected from 10 healthy individuals and 10 KIRC patients, along with 14 pairs of KIRC tissues and adjacent non-cancerous kidney tissues, from our hospital between January 1, 2023, and March 1, 2023. This was a prospective qPCR study. Total RNA was extracted using TRIzol™ LS Reagent (Invitrogen™, 10296010CN) following the manufacturer's instructions. Cycle threshold (Ct) values were normalized to ACTIN expression levels, and the relative quantity of mRNA for each target gene was calculated using the 2−ΔΔCt method. Specifically, CENPF was amplified using the forward primer AGCACGACTCCAGCTACAAGGT and reverse primer CATCATGCTTTGGTGTTCTTTCTG, while ACTB (the reference gene) was measured with forward primer CATGTACGTTGCTATCCAGGC and reverse primer CTCCTTAATGTCACGCACGAT. Additional target genes were also quantified: CENPA used forward primer GTGTGGACTTCAATTGGCAAG and reverse primer TGCACATCCTTTGGGAAGAG; CENPU was amplified with forward primer ACCCACCTAGAGCATCAACAA and reverse primer ACTTCAATCATACGCTGCCTTT; CENPE was measured with forward primer ACTCAAGGAAAGCCTGCAAGA and reverse primer GGTTCTGTCGGTCCTGCTTT; and CENPM used forward primer GCTGTGATGTCGGTGTTGAG and reverse primer CTTTGCCAAGTGGACCTTCAG.
Single-cell Analysis of KIRC
The “Seurat” package in R was used to identify cell clusters in KIRC samples from the GSE159115 dataset. We then further analyzed these clusters to determine which specific cell types exhibited high expression levels of CENPF.
Filtering CENPF-Related Immune Cells
CIBERSORT is a method commonly used to characterize immune cell composition based on gene expression profiles from various tissues. We reuploaded the KIRC expression matrix to the CIBERSORT website (https://cibersort.stanford.edu/) for analysis, utilizing the LM22 reference matrix. The resulting abundance ratio matrix was obtained from CIBERSORT. We identified significant differences in tumor immune infiltrating cells (TIICs)between high and low CENPF expression groups using a t-test, with the results visually represented through barplot and pheatmap functions in R. Next, Pearson correlation coefficients were calculated between the significantly different TIICs and CENPF using the cor function in R, and the results were visualized using the corrplot package. Finally, a univariate Cox analysis was conducted to filter TIICs related to CENPF, with the significance threshold set at P < .05.
Statistical Analyses
All statistical analyses were conducted using R version 4.2.1. Spearman's test was employed for correlation analysis. Student's t-test was used to assess differences between the two groups. Correlations between variables were evaluated using Spearman's correlation coefficient. All statistical tests were two-sided, with P < .05 considered statistically significant.
Results
Recognition of Overlapping Up-regulated DEGs in KIRC, KICH, and KIRP
To identify differentially expressed genes (DEGs) across the three subtypes of kidney cancer (KIRC, KICH, and KIRP), we analyzed the RNA-seq log2(count + 1) expression dataset from the GDC Hub, consisting of 607 samples for KIRC, 89 for KICH, and 321 for KIRP. Using the criteria of adjusted P < .01 and |log2 FC| > 1, we identified 9663 DEGs in KIRC (4808 up-regulated and 4855 down-regulated), 11,926 DEGs in KICH (1809 up-regulated and 10,117 down-regulated), and 8065 DEGs in KIRP (1755 up-regulated and 6310 down-regulated). Heatmaps were generated to visualize the up-and-down-regulated genes in KIRC (Figure 1A), KICH (Figure 1B), and KIRP (Figure 1C). Additionally, a Venn diagram was used to illustrate the overlap, showing 150 up-regulated (Figure 1D) and 2298 down-regulated DEGs (Figure 1E) shared among the three datasets.

Recognition of DEGs in KIRC,KICH and KIRP. Heatmaps of DEGs in (A) KIRC, (B) KICH and (C) KIRP. Red: up-regulated DEGs; Blue: down-regulated DEGs; Normal: normal samples; Primary: primary carcinoma. (D) Up-regulated DEGs in KIRC, KICH and KIRP were displayed by using the Venn diagram. (E) Down-regulated DEGs in KIRC, KICH and KIRP were displayed by using the Venn diagram.
Construction and Module Analysis of the PPI Network
Given the abundance of co-downregulated differential genes, we decided to focus our analysis on co-upregulated genes. To achieve this, we used STRING 18 to identify interacting genes and construct a protein-protein interaction (PPI) network based on the overlapping up-regulated DEGs. The resulting PPI network was visualized using Cytoscape 19 and consisted of 83 nodes and 1082 edges (Figure 2A). To detect significant modules among the up-regulated DEGs, we employed the MCODE algorithm, identifying 44 key molecules, including TPX2, CDKN3, FOXM1, CDC25C, ASPM, BIRC5, TICRR, KIF4A, CENPA, NEIL3, ERCC6L, BUB1, KIF20A, KIF14, KIF18B, CDT1, CDC45, ASF1B, CENPM, CENPU, TTK, GTSE1, HJURP, MYBL2, MKI67, TOP2A, UHRF1, PLK1, DLGAP5, DEPDC1, CENPE, CENPF, E2F8, MELK, UBE2C, NCAPG, CCNB2, PBK, GINS2, CKAP2L, MCM10, TROAP, SKA1, CCNA2 (Figure 2B). Using the limma package, we found that CENP-E, CENP-A, and CENP-F were ranked among the top 15 molecules according to the MCODE Score, while CENP-M and CENP-U were in the top 50. Considering the functional roles of the CENP family, 21 we focused on these five genes for further analysis (Figure 2C).
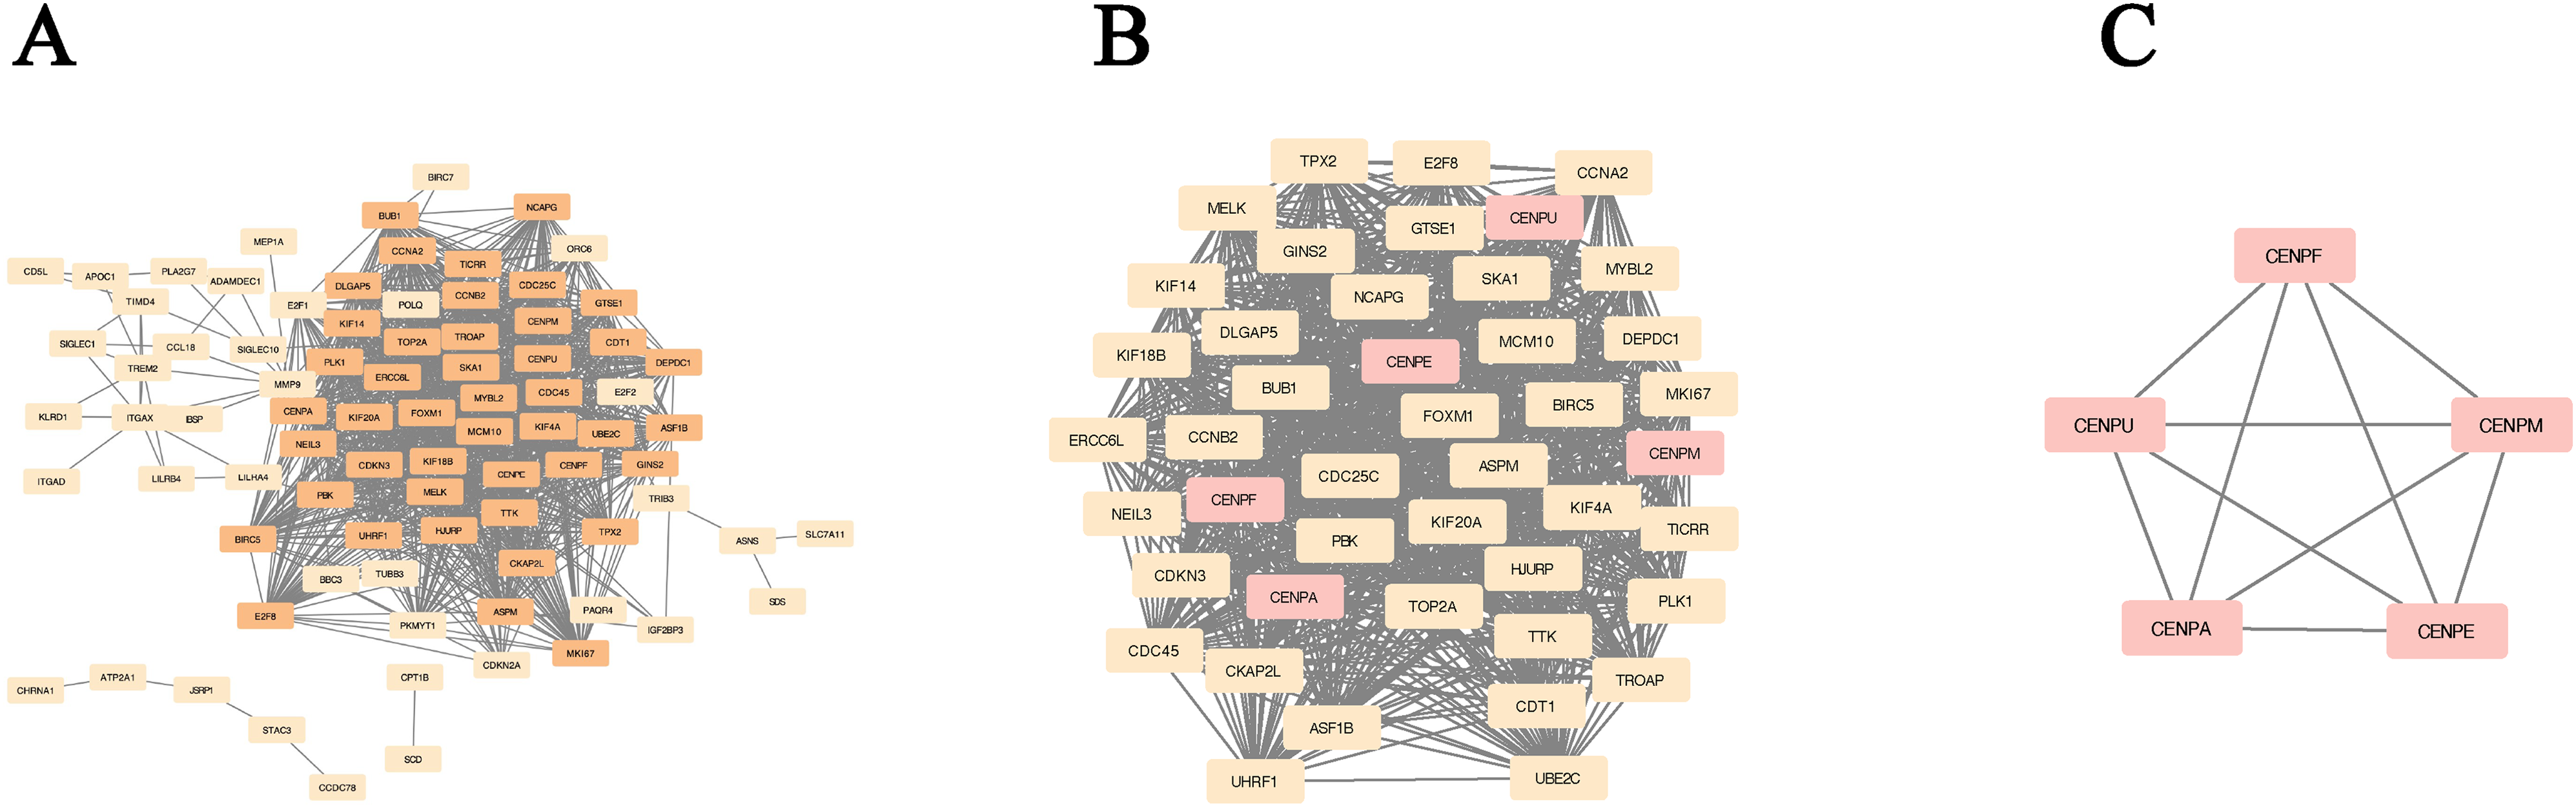
Construction of PPI network of up-regulated DEGs and identification of the most significant module of up-regulated DEGs. (A) PPI network of up-regulated DEGs. (B) The most significant module of up-regulated DEGs. The up-regulated genes were marked in pink. (C) CENPA and four members of CENP-A distal complex (CAD).
Univariate Cox Regression Analyses of Hub Genes
We performed univariate Cox regression analyses on hub genes across different subtypes of kidney cancer, using the “ggplot2” package to visualize the results as forest plots. Figure 3A, B, and C display the outcomes of these analyses for CENPU, CENPM, CENPF, CENPE, and CENPA in the three renal cancer subtypes. The results emphasize the significant role of these hub genes as risk factors in all three types of kidney cancer. Given that clear cell renal cell carcinoma (ccRCC) is the most prevalent subtype, accounting for over 70% of all renal cancers, 22 and that the clinical specimens we collected were KIRC, the subsequent sections focusing on the importance of CENPF in kidney cancer will concentrate on KIRC.

Univariate cox regression analyses of the hub genes. (A) The forest plot displays the results of univariate Cox regression analysis for the five members of the CENP family in KIRP. (B) The forest plot displays the results of univariate Cox regression analysis for the five members of the CENP family in KICH. (C) The forest plot displays the results of univariate Cox regression analysis for the five members of the CENP family in KIRC.
CENPF Expression is Elevated in KIRC and Associated with Poor Prognosis
We randomly collected plasma samples from 10 healthy individuals and 10 KIRC patients at our hospital, all aged between 25 and 65 years, with an equal male-to-female ratio (1:1) in both groups. Additionally, we collected cancerous and adjacent non-cancerous tissue samples from another 14 KIRC patients (male-to-female ratio of 1:1, aged between 25 and 65 years)(As the flow chart showed in Figure 4A). All patients and healthy individuals involved in this study fully completed the research process. Validation of the five hub genes in 10 pairs of KIRC tissues showed that only CENPF met our expected results (Figure 4B). Additionally, we analyzed 14 paired KIRC tissues, adjacent normal tissues, and plasma from 10 healthy individuals and 10 KIRC patients. Quantitative polymerase chain reaction (qPCR) confirmed that CENPF expression was significantly higher in tumor samples compared to normal tissues and plasma (Figure 4C). The demographic and clinical characteristics of the patients are shown in Tables 1 and 2.

CENPF expression is elevated in KIRC and associated with poor prognosis. (B) Comparison of CENPU, CENPM, CENPE, CENPA, mRNA expression between KIRC tissues and paracancerous kidney tissues from hospital. (C) Comparison of CENPF mRNA expression between KIRC tissues and paracancerous kidney tissues from hospital. Comparison of CENPF mRNA expression between KIRC plasma and healthy people plasma. (D) Kaplan-Meier analysis of OS KIRC patients with low and high CENPF expression. (E) Comparison of CENPF mRNA expression between stage I/II and stage III/IV patients. (F) Comparison of CENPF mRNA expression between grade I/II and grade III/IV patients . (G) Comparison of CENPF expression in KIRC and normal specimens from different microarray datasets. *, P < .05; **, P < .01; ***, P < .001; KIRC, kidney renal clear cell carcinoma; CENPF, centromere protein F; TCGA, The Cancer Genome Atlas; mRNA, messenger RNA; OS, overall survival.
To further validate these findings, we obtained mRNA and clinical data for KIRC patients from the UCSC Xena database. Our analysis revealed that patients with higher CENPF expression had a poorer overall survival rate (Figure 4D). Moreover, tumors of stage or grade III/IV expressed significantly higher levels of CENPF compared to those of stage or grade I/II (Figures 4E, F). To further explore the role of CENPF in renal cell carcinoma, we validated its expression using microarray datasets from GEO (GSE105261, GSE53000, GSE6344, GSE6847, GSE781, GSE85258). A t-test showed significant differences in CENPF expression between renal cancer and normal tissues in GSE105261, GSE53000, GSE6344, GSE6847, and GSE781. However, no significant difference was observed between metastatic and non-metastatic KIRC samples in GSE85258, which may be due to the limited number of specimens (Figure 4G).
Analysis of KIRC Single-Cell Sequencing Results
To further explore the role of CENPF in the tumor immune microenvironment of KIRC, we analyzed renal tumor samples from 7 KIRC patients using data from the GSE159115 dataset. The cell grouping results from the single-cell sequencing analysis of KIRC are shown in Figure 5A. Our findings indicate that CENPF is predominantly expressed in the T cells present within the tumor tissue (Figure 5B).

Single cell analysis of KIRC revealed that CENPF is predominantly expressed in T cells. (A) Single-cell atlas of ccRCC. t-SNE plot of scRNA-seq data from KIRC samples obtained from seven KIRC patients. Cell clusters found there in representing 13 cell types are shown. vSMC, vascular smooth muscle cells; Macro, macrophages; Endo, Endothelial cells; Fibo, fiboblastcells.(B) Expression of CENPF in various cell clusters.
Distinguishing Immune Cells Associated with CENPF
We divided the KIRC expression matrix into two groups based on CENPF expression levels: high and low. Using the immune cell reference matrix (LM22) provided by Cibersort, we analyzed the immune cells closely associated with CENPF. Figure 6A illustrates the infiltration levels of 22 immune cell types in the KIRC data.

Recognisation of three CENPF-related immune cells. (A) Heatmap of the expression of TIICs. (B) Box diagram of TIICs’ abundance in high and low-CENPF groups. (C) Correlation coefficients between abundance ratios of different immune cells and CENPF. The correlation curve between CENPF and follicular helper T cells. The correlation curve between CENPF and mast cells. (D) Kaplan-Meier analysis of OS KIRC patients with low and high follicular helper T cells. Kaplan-Meier analysis of OS KIRC patients with low and high mast cells. (E) Comparison of follicular helper T cells infiltration between grade I/II and grade III/IV patients. Comparison of mast cells infiltration between grade I/II and grade III/IV patients. (F) Comparison of follicular helper T cells infiltration between stage I/II and stage III/IV patients. Comparison of mast cells infiltration between stage I/II and stage III/IV patients.
A box plot (Figure 6B) demonstrates the differences in tumor-infiltrating immune cell (TIIC) content between the high and low CENPF groups. We selected immune cells with significant differences between these groups to perform a correlation analysis with CENPF, as shown in Figure 6C. The results revealed that CENPF had a significant negative correlation with resting mast cells and a positive correlation with follicular helper T cells and memory-activated CD4 T cells.
Next, we examined the association between CENPF and mast cells, follicular helper T cells, and memory-activated CD4 T cells in KIRC. Due to insufficient data for statistical analysis after excluding outliers from memory-activated CD4 T cells, we focused on the clinical relevance of follicular helper T cells and mast cells. Our findings indicate that follicular helper T cells are associated with improved overall survival in KIRC patients (Figure 6D), and their infiltration levels vary across different grades and stages of KIRC (Figure 6E-6F). Conversely, mast cells were negatively correlated with overall survival (Figure 6D), and patients with grade 3/4 and stage III/IV KIRC showed lower mast cell infiltration (Figure 6E-6F).
Discussion
Patients with recurrent or metastatic renal cell carcinoma (RCC) often face a poor prognosis. In recent years, significant progress has been made in understanding the tumor microenvironment of RCC.
For example, exosomes have emerged as a novel source of non-invasive tumor biomarkers. The unique bilayer membrane structure of exosomes offers protection against external RNases and proteases, leading to enhanced stability of the enclosed mRNAs, miRNAs, and functional proteins, thus making exosomes highly sensitive markers for disease diagnosis. The cargo in tumor-derived exosomes, such as the range of miRNAs, can also serve as biomarkers for clear cell RCC in the serum and urine of patients, offering valuable targets for early detection and monitoring of the disease. 23
Additionally, research has demonstrated the prognostic and predictive value of immune- and stromal-related gene biomarkers in RCC, 24 with further studies confirming the prognostic significance of immune-associated gene panels in clear cell renal cell carcinoma (KIRC). 25 In this study, we systematically analyzed The Cancer Genome Atlas (TCGA) RCC databases and identified five overlapping hub genes across the three RCC subtypes, including CENPF. Centromeric proteins (CENPs) are categorized into immobile structural proteins (eg, CENP-A, CENP-B, CENP-C) and transient centromere proteins (eg, CENP-E, CENP-F).26,27
CENP-A overexpression is a feature identified in many cancer types, 28 including lung, 29 ovarian, 30 and others.31–33 Importantly, high levels of CENP-A lead to its mislocalization outside the centromere,21,34 which disrupts normal chromosomal function. Given the essential role of CENP-E in mitosis and its predominant expression during this phase, it has emerged as a promising therapeutic target for next-generation anti-mitotic agents. 35 Furthermore, pioneering research by Ohashi et al (2015) highlighted the potential of CENP-E inhibitors as a therapeutic strategy for tumors with disrupted Spindle Assembly Checkpoints (SAC). 36 The upregulation of CENPM or CENPU has been shown to promote tumorigenesis across various cancers, including breast cancer,37,38 pancreatic cancer, 39 ovarian cancer,40,41 and liver cancer.42,43 Moreover, studies have found that CENPM overexpression correlates with poor clinical outcomes and immune profile suppression in clear cell renal cell carcinoma, 44 suggesting its role in chromosomal instability, which is critical in cancer progression. CENPF, a kinetochore-related protein, plays a crucial role in mitosis, cell cycle regulation, and spindle checkpoint response.45–48 Its upregulation has been associated with the development of several cancers, including gastric, 49 papillary thyroid, 50 breast, 51 and adrenocortical carcinoma. 52 Moreover, CENPF has been identified as a cancer stem cell marker and is associated with poor prognosis in collecting duct RCC, 53 with one study recognizing it as a key gene involved in KIRC metastasis. 54
In light of these findings, we focused on the CENP family—CENP-A, CENP-E, CENP-M, CENP-U, and CENP-F—due to their central role in chromosomal stability and mitotic regulation. While the MCODE algorithm identified 44 key molecules, the CENP family members were selected not only based on their high MCODE scores but also because of their critical involvement in chromosomal instability, a hallmark of cancer progression, particularly in renal cancer. This selection was guided by existing literature linking the dysregulation of CENP proteins to various cancers, including renal carcinoma.44,55 Given their established relevance in chromosomal dynamics and tumorigenesis, we believe that focusing on these specific CENP family members is both justified and relevant for understanding cancer biology, especially in the context of KIRC.
We validated its potential as a prognostic biomarker through survival analysis and univariate Cox regression. Further validation in 10 pairs of KIRC tissue samples revealed that CENPF was the only gene to meet our expected results. In addition, we confirmed that CENPF is highly expressed not only in KIRC tissue samples but also in the plasma of KIRC patients. This elevated expression was consistently observed across multiple microarray datasets, including GSE105261, GSE53000, GSE6344, GSE68417, and GSE781. These findings reinforce the role of CENPF as a potential pathogenic factor in KIRC, aligning with previous studies that suggest its tumor-promoting function in KIRC. 56
Our single-cell sequencing analysis further revealed a subgroup of T cells with high CENPF expression, referred to as CENPF-T cells. Previous studies have shown that CENPF upregulation may lead to premature depletion of CD4+ memory T cells, resulting in immunosuppression, as seen in skin cutaneous melanoma. 45 This prompted us to investigate the role of CENPF in immune cell infiltration within the KIRC tumor microenvironment.
The tumor microenvironment (TME) consists of various cells and factors, including immune cells, which can either promote or inhibit tumor progression. 57 For instance, the down-regulation of lactotransferrin has been linked to enhanced metastasis and responsiveness to mTOR inhibitors in clear cell RCC, suggesting its potential as a therapeutic predictor. 58 Immune checkpoint blockade (ICB) has also been shown to reshape the RCC microenvironment and alter cancer-immune cell interactions. 59 Follicular helper T cells (Tfh), a CD4+ T cell subset, support B lymphocyte function and are generally associated with better immune responses60–62 and improved outcomes in solid tumors. 62 In KIRC, Tfh cells have been linked to mature tertiary lymphoid structures (TLS), 63 which form in non-lymphoid tissues postnatally and contribute to anti-tumor immune responses. 64
Our analysis revealed that CENPF is positively correlated with follicular helper T cells and memory-activated CD4+ T cells but negatively associated with mast cells. While Tfh cells are typically thought to enhance anti-tumor immunity,63,65 our findings suggest that in KIRC, high Tfh infiltration correlates with poorer prognosis. CD4+ T follicular helper (Tfh) cells provide effective assistance to B cells and can be found in the tertiary lymphatic structure (TLS) of tumors. 62 In many solid organ tumors that exhibit TLS, promoting the number or function of Tfh cells may help enhance anti-tumor immune responses. 62 Tfh can actively coordinate the formation of TLS by secreting CXCL13 66 and can indirectly enhance CD8+ T cell-mediated anti-tumor immunity by secreting IL-21. 67 However, our analysis has revealed that in KIRC, patients with high levels of Tfh infiltration do not have a favorable prognosis. This contrasts with their generally favorable role in other cancers and highlights the need for further investigation into the interaction between CENPF and Tfh cells in promoting immune escape. A study has demonstrated a negative correlation between the abundance of CXCL13 + CD8+ T cells and overall and disease-free survival in KIRC. High-level infiltration of CXCL13 + CD8+ T cell subgroups has been shown to elevate fatigue markers (such as PD-1, Tim-3, and TIGIT) and reduce the expression of activation markers (TNF-α, IFN-γ). In addition, the abundance of CXCL13 + CD8+ T cells within tumors has been linked to immune escape within the tumor microenvironment, characterized by an increase in Th2 cells, tumor-associated macrophages, Foxp3 + regulatory T cells, and TLS, alongside a decrease in natural killer cells and GZMB + cells. 68 Thus, Tfh cells correlated with high expression of CENPF may promote immune escape in KIRC by interacting with CXCL13 + CD8+ T cells.
Mast cells (MCs) are innate immune cells characterized by their expression of FcεRI and CD117. They are distinct from bone marrow hematopoietic progenitors 69 and are known for their roles in angiogenesis and inflammation, also demonstrating varying effects depending on the tumor context. 70 In recent studies, tumor-infiltrating mast cells (TIMs) have garnered attention due to their potential role in shaping adaptive immune responses.71,72 For instance, MMP-2 and MMP-9 released by MCs can promote tumor angiogenesis and growth. 73 In some cases, tumor-infiltrating mast cells (TIMs) exhibit cytotoxicity against cancer cells, prolonging survival in non-metastatic clear cell RCC. 74
However, they have also been associated with poor prognosis due to their promotion of tumor blood vessel formation. 75 Furthermore, these studies indicate that TIMs are negatively correlated with the prognosis of patients. 76 In our study, we found a negative correlation between CENPF and TIMs, and patients with higher TIM levels had better prognoses. Mast cells (MCS) accumulate in the tumor microenvironment with the aid of chemoattractants(such as CXCL2 77 and VEGF-A 78 ) released by tumor cells. 79 This suggests that CENPF may influence mast cell activity by modulating cytokine secretion or related signaling pathways in the TME.
However, our study has several notable limitations. First, as we primarily focused on KIRC, all the clinical cancer specimens were derived exclusively from KIRC patients. Consequently, our analysis of CENPF expression was restricted to comparisons between KIRC and normal tissues, without extending to other renal cancer subtypes. Second, due to the limited number of specimens and the observational nature of this study, the small sample size may have limited the statistical power to detect significant associations. Third, due to the large number of significantly co-downregulated genes across the three renal cancer subtypes, which makes analysis with STRING challenging, we opted to focus our study on the significantly upregulated genes instead. Finally, while we examined the tumor microenvironment in KIRC, further in vivo and in vitro experiments are essential to validate and expand our understanding of CENPF's role in modulating the immune landscape in KIRC. These additional studies will be critical for confirming our findings and elucidating the broader implications of CENPF in renal cancer progression and immune interactions.
In conclusion, our study demonstrates that CENPF is highly expressed in KIRC and serves as a risk factor for its occurrence and progression. Notably, we identified a subset of T cells within KIRC exhibiting elevated CENPF expression. CENPF showed a positive correlation with follicular helper T cells and a negative correlation with mast cells, suggesting that CENPF plays a crucial role in modulating the immune microenvironment in KIRC. Based on our findings and existing literature, it is likely that the CENPF-high T cells are CXCL13 + CD8+ T cells or other T cell subsets. The interaction between CENPF-expressing T cells and follicular helper T cells might contribute to immune evasion in KIRC. On the other hand, mast cells in the tumor microenvironment appear to have an inhibitory effect on tumor growth. These insights underscore the complex interplay between CENPF and immune cells in shaping the KIRC tumor microenvironment.
Conclusion
In KIRC, KICH, and KIRP, the key upregulated oncogenes include CENPA, CENPM, CENPU, CENPE, and CENPF. Among these, CENPF is notably associated with the progression of KIRC and is linked to a distinct T-cell sub-cluster. CENPF expression is negatively correlated with resting mast cells, while it shows positive correlations with follicular helper T cells and memory-activated CD4 T cells. Importantly, high infiltration of follicular helper T cells is associated with a poorer prognosis, whereas elevated plasma cell expression correlates with improved outcomes. These findings suggest that CENPF may modulate the tumor immune microenvironment and could potentially become a prognostic marker in KIRC.
Remark Checklist
The reporting of this study conforms to REMARK guidelines. 80 We have de-identified all patient details.
Footnotes
Acknowledgements
Special thanks to Wang Ruizhi for his guidance in this study, and the Laboratory Department of the First Affiliated Hospital of Sun Yat-sen University for providing the specimens and PCR testing platform. We would like to express our gratitude to all those who contributed to this study. We acknowledge Cen Junjie for his involvement in related research projects that have contributed to the broader context of our work.
Availability of Data and Material
Database sources and specimen information have been described in the Materials and methods section.
Ethical Considerations and Consent for Publication
We guarantee that all experiments conducted in this study comply with the Helsinki Declaration. All authors and participants in this study confirm that all experiments related to human tissue samples were performed following relevant guidelines and regulations. This research received ethical approval from the Ethics Committee of the First Affiliated Hospital, Sun Yat-sen University (Office 502, No.1, Mapenggang, Yuexiu District, Guangzhou City, Guangdong Province, China), and informed consent was obtained from all participants and/or their legal guardians. All methods employed in this study were conducted following established guidelines and regulations. Furthermore, we confirm that all experimental protocols were approved by the Ethics Committee of the First Affiliated Hospital, Sun Yat-sen University (Ethics Number: [2022]680, date of approval: 23 December 2022). All study participants agree to publish their data in the research paper.
Author Contributions/CRediT
Meilin Chen, Xiuxin Tang, YanPing Liang, Tangdang Ding, Meifang He, Dong Wang, Ruizhi Wang all have made a substantial contribution to the concept or design of the article; or the acquisition, analysis, or interpretation of data for the article; AND drafted the article or revised it critically for important intellectual content; AND approved the version to be published; AND have agreed to be accountable for all aspects of the work in ensuring that questions related to the accuracy or integrity of any part of the work are appropriately investigated and resolved.
Funding
The authors disclosed receipt of the following financial support for the research, authorship, and/or publication of this article: This study was supported by grant from the National Natural Science Foundation of China (81972750).
Conflicting Interests
The authors declared no potential conflicts of interest with respect to the research, authorship, and/or publication of this article.
Data Availability
Details regarding database sources and specimen information are provided in the Materials and Methods section. We ensure that we have de-identified patient details.