Pleural mesothelioma is a deadly asbestos induced cancer. Less than 10% of mesothelioma patients survive 5 years post diagnosis. However survival can range from a few months to a number of years. Accurate prediction of survival is important for patients to plan for their remaining life, and for clinicians to determine appropriate therapy. One unusual feature of mesothelioma is that patients frequently present with tumor-associated pleural effusions early in the course of the disease.
OBJECTIVE:
To study whether cells and molecules present in pleural effusions provide prognostic information for mesothelioma.
METHODS:
We profiled the cellular constituents and concentrations of 40 cytokines, chemokines and cellular factors (collectively “soluble factors”) involved in inflammatory and immune signalling pathways in pleural effusion samples from 50 mesothelioma patients.
Associations with survival were evaluated by Cox proportional hazards regression methods. Results for the two soluble factors most significantly and independently associated with survival were validated in an independent set of samples ( 51) using a separate assay system.
RESULTS:
Survival analysis revealed that IL8, IL2Ra (CD25) and PF4 were independent determinants of a more negative prognosis in mesothelioma patients, independent of other known prognostic factors. Lipocalin2 and IL4 were associated with better prognosis.
CONCLUSIONS:
This study demonstrates that pleural effusions rich in a range of soluble factors are associated with poor prognosis. These findings will enhance our ability to prognosticate outcomes in mesothelioma patients.
Pleural mesothelioma is a deadly cancer, commonly associated with previous exposure to asbestos [1, 2]. These patients have a poor prognosis, with unselected large series revealing median survivals between 7 and 11 months [3, 4]. However, there is a wide range in survival time with 5 to 10% of the cohort surviving for 5 years [5]. An accurate prediction of survival is needed to enable patients and clinicians to decide on treatment, and to plan and prioritise in the setting of an incurable cancer. General prognostic indicators that have been published include age, sex, histology, and performance status, with refinements accounting for weight loss, haemoglobin and albumin levels also being reported [6]. However, these are indirect measurements, so we sought to determine if analysis of aspects of the tumor biology and the immunological response to the tumour is reflected in the tumor-associated fluid and if these could add extra valuable information.
Typically tumor cells secrete a complex milieu of growth factors, cytokines and chemokines, some of which are pro-tumorogenic [7, 8, 9]. In mesothelioma, over 80% of cases are associated with a pleural effusion that bathes the tumor [10]. The composition of this fluid is very variable in terms of both the quantity and type of cells present, and the soluble factors and cytokines present. We have shown that different pleural effusions have variable effects in vitro on tumour growth and response to chemotherapy [11] and thus we reasoned that a more detailed analysis of the soluble and cellular composition of pleural effusions might provide a window of understanding into differences in survival between mesothelioma patients.
Our previous report suggests that factors in effusions including vascular endothelial growth factor (VEGF), interleukin (IL) – 6, IL-8, IL-10, tumor necrosis factor- (TNF) and interferon-gamma (IFN) as well as leukocyte numbers are relatively constant over time in an individual, although gradually increasing concentrations of monocyte chemotactic protein (MCP-1) have been noted [12]. These results suggest that effusion cytokine and cellularity measures may reliably reflect the underlying disease process in individual mesothelioma patients.
Previous studies have suggested that some pleural effusion biomarkers are associated with prognosis, including fibulin-3 [13, 14, 15] and hyaluronic acid [16], however none of these have been comprehensively validated or cross-evaluated in individuals.
In this study we undertook an evaluation of the cellular constituents as well as the cytokine and chemokine composition using a multiplexed assay of a comprehensive panel of soluble factors and then determined if these were associated with prognosis.
Materials and methods
Experimental subjects
Consecutive patients attending a specialist referral centre for mesothelioma were invited to participate in the NCARD Biobanking program. Patients with a confirmed pathological diagnosis of mesothelioma and a pleural effusion sample larger than 100 mL and with more than 5 10 total cells, that was available prior to treatment or pleurodesis were included in the discovery set. The validation cohort was chosen, independently, at a later time-point from the Biobank using the simplified selection criteria of confirmed pathological diagnosis of mesothelioma and a pleural effusion sample available prior to treatment or pleurodesis. Validation samples were selected randomly using the RAND function in excel. Demographic and clinical data were collected including age, gender, weight loss, performance status, blood biochemistry, tumour histology, smoking history, treatment and survival. This study was approved by Sir Charles Gairdner and Osborne Park Hospitals Human Research Ethics Committee and all participants provided written informed consent and conformed with the Code of Ethics of the World Medical Association (Declaration of Helsinki) [17].
Differences in the characteristics and treatment of patients in the discovery and validation cohorts
Characteristic
Discovery ( 50)
Validation ( 51)
value
Median age (IQR)
71 (56–88)
70 (30–94)
0.25
Sex (male:female)
42:8
40:11
0.612
Median survival (95%CI)
22.1 (16.98–27.22)
12.53 (7.37–17.70)
0.003
Histology
0.389
Epithelioid
35
35
Biphasic
1
4
Sarcomatoid
4
3
NOS
10
7
ECOG
0.417
0–1
40
41
2–3
10
6
ND
0
4
Effusion management
0.543
IPC
32
29
Pleurodesis
18
22
Smoking
0.623
Current
4
4
Ex
25
18
Never
18
25
Unknown
1
1
Treatment
0.234
1st Line
23
30
2nd Line
16
11
3rd Line
15
8
Radiotherapy
15
6
Resection
1
0
BSC
16
18
-value between groups: For continuous variables Mann-Whitney U test applied; for categorical groups Fischer’s exact test used and for survival analyses the log rank test applied following the the Kaplan Meier method. For treatment groups the p value is applied only to the proportion of cases undergoing first line chemotherapy treatment. Abbreviations: NOS – not otherwise specified; ECOG – The Eastern Cooperative Group Performance Status; ND – not determined; IPC – interpleural catheter; BSC – best supportive care.
Pleural effusion samples
Pleural effusions were collected in sterile containers following pleural aspiration or drainage. Samples were transferred immediately at ambient temperature to the laboratory and centrifuged at 1000 for 10 min. The supernatant was transferred to 80C for storage until later analysis and counts were performed on effusion cell pellets by haemocytometer. Cell composition was determined from a visual review of cytospin slides stained with Rapid Stain (Amber Scientific). Cells were classified as mesothelial, macrophage, lymphocyte, neutrophil, eosinophil or other by trained observers, with a total of 400 cells per sample counted.
Cytokine, chemokine and cellular factors analysis
Concentrations of soluble factors were determined using a Quantibody Human Immune Response Assay (RayBiotech, Norcross GA), which measured a panel of 40 cytokines, chemokines and cellular factors involved in inflammatory and immune signalling pathways. Pleural effusion supernatant was diluted 1:2 and assayed in quadruplicate, along with serial standards, buffer controls and in-house human control plasma samples. Concentrations were determined from standard curves run in parallel and values reported as pg/mL. Values for concentrations reported to be below the sensitivity limit of detection were imputed for statistical comparisons using a Missing at Random (MAR) pattern [18], implemented using a fully conditional specification Markov Chain Monte Carlo (MCMC) multiple imputation method in the SPSS statistical program (IBM Corp., Armonk, NY, ver 24).
Enzyme-linked immunosorbent assays (ELISAs)
Mesothelin is the only clinically approved biomarker for mesothelioma. Mesothelin concentrations were determined using the MESOMARK kit (Fujirebio Diagnostics, Malvern PA) following the manufacturer’s instructions. A mesothelin value 20 nM was considered positive for mesothelioma [19]. IL8 was measured using the human CXCL8/IL8 ELISA DuoSet ELISA Development kit (R&D systems, Minneapolis MN), with a sensitivity of 31 pg/ml and PF4 was measured using the human PF-4 ELISA (Thermo Scientific, Frederick, MD), with a sensitivity of 20 pg/ml, following the manufacturers’ protocols.
Association of potential prognostic variables with survival in the discovery cohort
Univariate HR
(95% CI)
value
Cytokine adjusted HR (95% CI)
value
Cytokine cluster group adjusted HR (95% CI)
value
Age
1.023 (0.988–1.060)
0.200
1.057 (1.006–1.110)
0.028
1.027 (0.990–1.066)
0.152
Sex (female vs male)
2.535 (1.082–5.937)
0.032
1.479 (0.560–3.907)
0.430
3.173 (1.281–7.861)
0.013
PE mesothelin (SD change)
1.145 (0.845–1.609)
0.434
1.122 (0.784–1.683)
0.579
1.025 (0.725–1.449)
0.888
Histology (sarc/bi vs epi)
2.268 (0.782–6.574)
0.132
1.405 (0.405–4.875)
0.592
3.212 (1.062–9.713)
0.039
ECOG status (vs 0)
1
1.125 (0.560–2.260)
0.741
1.172 (0.527–2.607)
0.698
1.143 (0.561–2.327)
0.713
2
1.654 (0.471–5.809)
0.433
1.727 (0.465–6.415)
0.415
2.523 (0.695–9.167)
0.160
3
3.721 (1.476–9.382)
0.005
2.619 (0.830–8.267)
0.101
5.945 (2.226–15.881)
0.001
Chemotherapy (Y vs N)
0.433 (0.231–0.809)
0.009
0.261 (0.120–0.564)
0.001
0.270 (0.130–0.558)
0.001
Immune cells (Hi vs Lo)
% lymphocytes
0.704 (0.356–1.392)
0.313
0.731 (0.344–1.552)
0.441
0.698 (0.342–1.423)
0.322
% macrophages
0.699 (0.355–1.377)
0.301
0.690 (0.313–1.519)
0.357
0.665 (0.338–1.310)
0.238
% neutrophils
1.651 (0.8885–3.080)
0.113
1.499 (0.744–3.020)
0.257
1.293 (0.596–2.805)
0.515
NLR
1.516 (0.714–3.221)
0.279
1.665 (0.688–4.030)
0.258
1.585 (0.840–2.990)
0.155
Hazard ratios determined by univariate analysis. Hazard ratios determined after adjustment for pleural effusion cytokines that were shown to be independently associated with survival (IL8, IL2Ra, PF4, Lipocalin2, IL4) (see Text). Hazard ratios determined after adjustment for the cluster analysis determined group (see Fig. 2). Abbreviations: PE – pleural effusion; NLR – neutrophil to lymphocyte ratio.
Statistical analysis
Unless otherwise stated data is presented as median and the interquartile (IQ) range. Patient survival was calculated from the time of sample collection. For hierarchical clustering and survival analysis soluble factor levels were log (10) transformed and normalised. Survival analysis was performed using the Kaplan Meier product limit estimator, where difference in survival of categorical variables were assessed using a log-rank test, and using the Cox proportional hazards regression methods where hazard ratios (HR) are presented with 95% confidence intervals of a 1 SD difference in the variable. The Cox regression results were also adjusted by sex, prognostic risk group [6] and age as a continuous variable. For multivariate analysis a forward stepwise multiple Cox regression analysis was used with a probability of F to enter (pIN) value of 0.05 unless otherwise stated. Due to the high dimensionality of the data set, a more stringent pIN value of 0.0003, (determined from the sample size and number of variables being tested [20]), was used in a separate multivariate analysis in order to identify a sparser set of the most strongly associated variables. Group comparisons were made using the Student’s t test, using an adjustment for non-normality if indicated by a significant Levene’s test for equality of variances. Receiver Operator Curve (ROC) analysis was performed with two survival groups determined based on the lower 95% confidence interval for median mesothelioma survival time in Australia [21] (i.e. (survival 9 and survival 9 months). A difference was considered to be statistically significant if the associated p-value was less than 0.05. Survival analysis, group comparisons and ROC analysis were performed using IBM SPSS statistics. Hierarchical clustering was performed using hclust and heatmaps were produced using ggplot2 [22] in the R statistical package [23].
Results
Patient characteristics
The 50 individuals with pleural mesothelioma in the discovery cohort were predominantly male, approximately 70 years old at diagnosis, with good performance status. The tumours were of predominantly epithelioid histology. In this cohort effusions were predominately managed with indwelling pleural catheters. This was an observational study and patients received a range of treatments, including novel clinical trial agents. Of the 50 individuals, 23 received chemotherapy of some form. Patients undergoing active treatment received standard pemetrexed/platinum combination in the first line, and generally vinorelbine as a second line chemotherapy (Table 1).
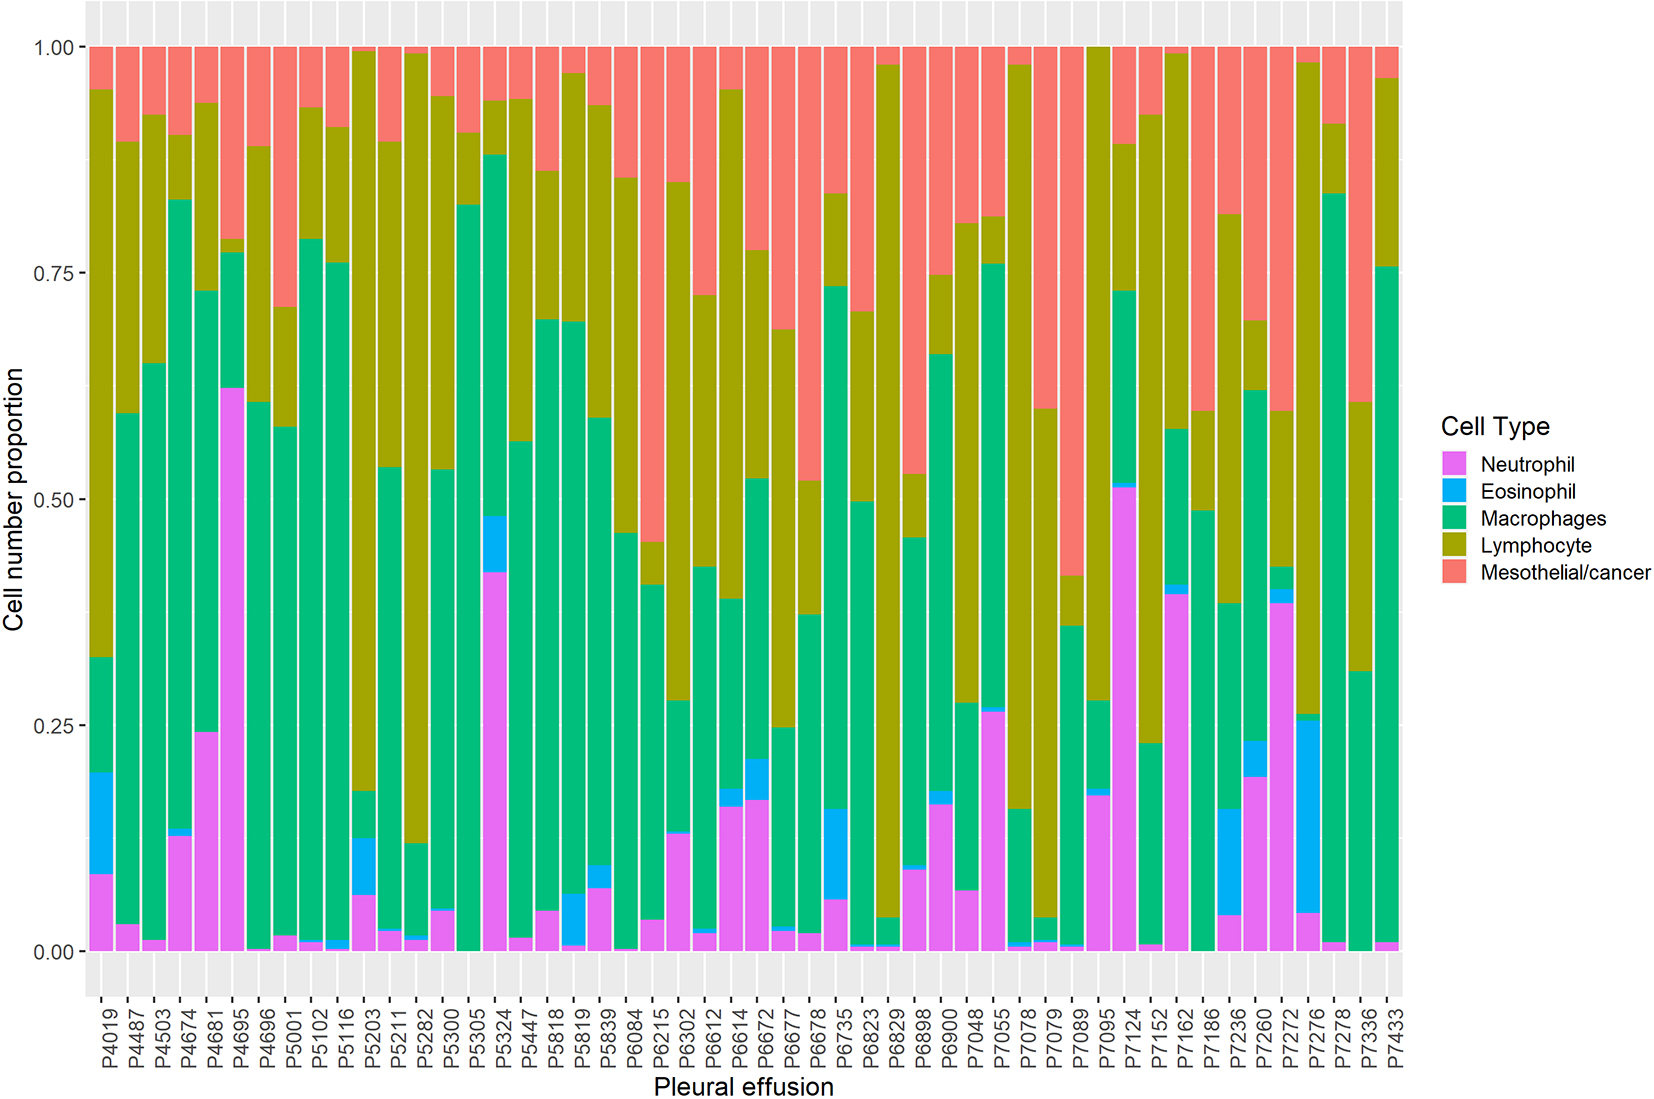
Cellular composition of pleural effusions, determined from a cell count of approximately 400 cells.
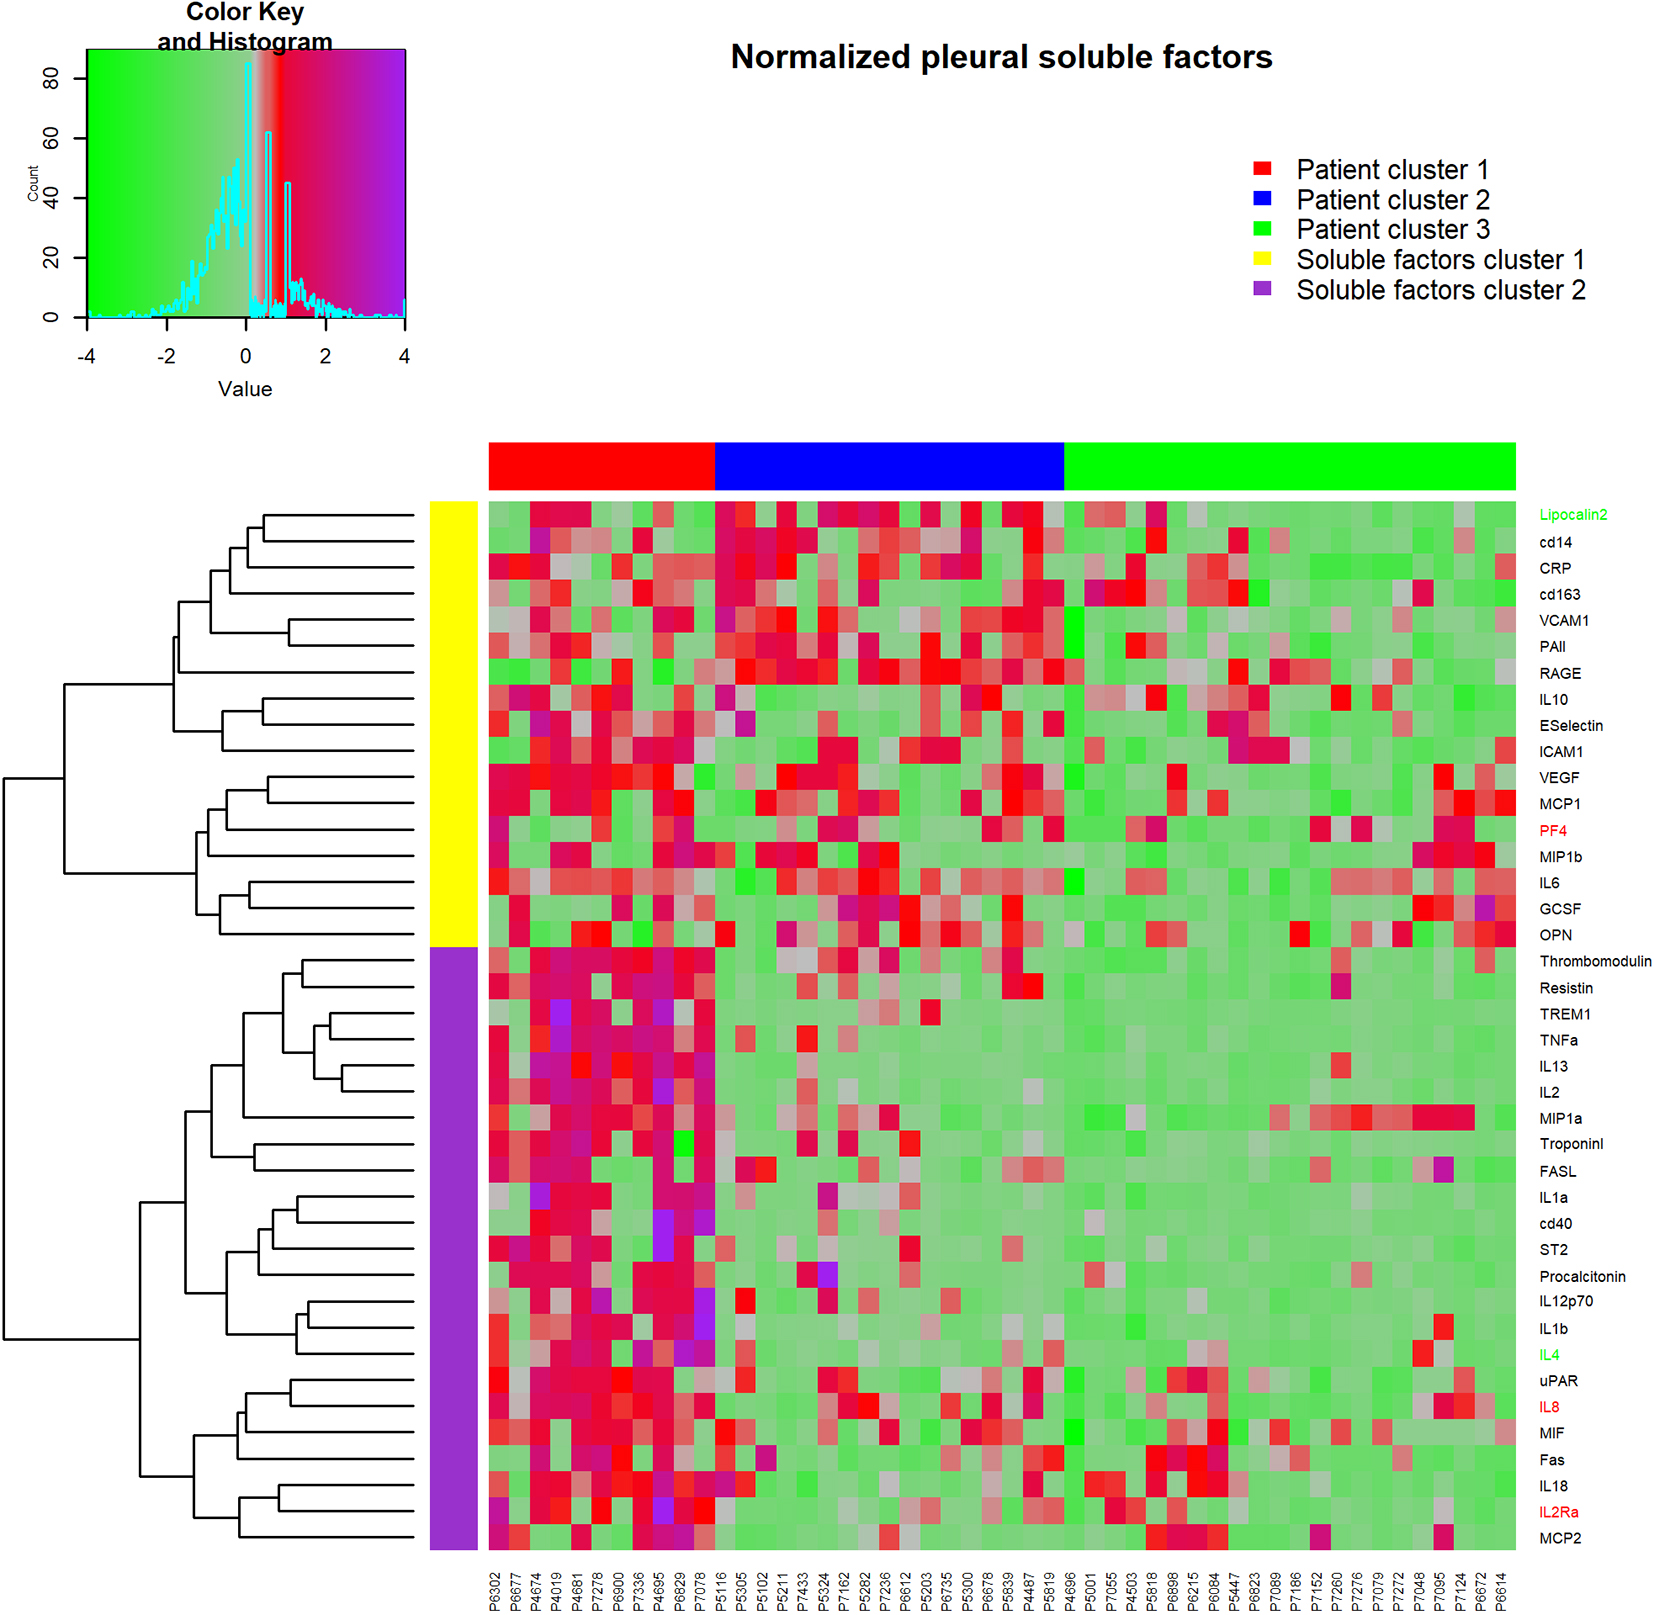
Heatmap of cytokine, chemokines and soluble factor results, clustered into groups using hierarchical clustering. Rows are standard deviation normalized cytokine values, columns are individual pleural effusion samples. Red (negative) and green (positive) row labels indicate cytokines that were identified as being independently associated with prognosis in multivariate Cox regression survival analysis.
A similar number of samples were studied from individuals in an independent validation cohort (Table 1). There was no difference between the discovery and validation groups in terms of age, gender distribution, tumour histology, performance status, effusion management, smoking status and treatment received. Despite random selection, as a group patients in the validation cohort had a significantly poorer prognosis than those in the discovery cohort (median survival 12.53 (7.37–17.70) versus 22.1 (16.98–27.22) months ( 0.003), respectively (Table 1) highlighting the need for prognostic markers in this disease. Prognosis within the discovery cohort was significantly associated with sex, performance status and treatment in univariate analysis (Table 2). Patients who received chemotherapy, subsequent to the pleural fluid sample collection, had significantly better prognosis (HR 0.433 (0.231–0.809); 0.009) compared to those who did not.
Concentrations of pleural effusion soluble factors and their association with survival as determined by Cox regression univariate analysis
Factor
Median (IQ range) pg/ml
HR per SD increase (95% CI)
value
Discovery using Quantikine Multiplex Assay system
CD14
10864.8
(1524.2)
0.967 (0.715–1.309)
0.806
CD40
998.8
(226.7)
1.761 (1.195–2.596)
0.004
CD163
36234.5
(18511.8)
0.716 (0.807–1.367)
0.716
CRP
12703.7
(3581.5)
0.997 (0.719–1.384)
0.987
E-SELECTIN
4858.9
(1645.6)
1.242 (0.921–1.675)
0.156
FAS
534.0
(745.0)
1.352 (1.00–1.828)
0.050
FAS-L
140.5
(75.8)
1.119 (0.821–1.750)
0.347
G-CSF
11.3
(23.9)
1.189 (0.888–1.591)
0.244
ICAM-1
102589.0
(149201.0)
1.055 (0.773–1.440)
0.736
IL1a
45.5
(13.8)
1.320 (0.978–1.781)
0.069
IL1b
12.6
(9.9)
1.941 (1.388–2.715)
0.001
IL2
92.6
(31.8)
1.601 (1.185–2.163)
0.002
IL2-Ra
479.3
(186.9)
1.664 (1.16–2.387)
0.006
IL4
39.5
(13.4)
1.561 (1.099–2.216)
0.013
IL6
3596.4
(1594.7)
1.425 (0.968–2.099)
0.073
IL8
84.8
(121.2)
1.877 (1.352–2.607)
0.001
IL10
125.5
(52.9)
0.931 (0.707–1.226)
0.612
IL12-p70
16.5
(7.3)
1.486 (1.046–2.111)
0.027
IL13
25.4
(5.4)
1.534 (1.138–2.069)
0.005
IL18
411.5
(617.7)
1.134 (0.849–1.516)
0.395
LIPOCALIN-2
5372.4
(1695.5)
0.921 (0.688–1.233)
0.581
MCP-1
2090.3
(2604.9)
1.475 (1.046–2.080)
0.027
MCP-2
42.7
(114.4)
1.272 (0.899–1.801)
0.174
MIF
4987.5
(3116.1)
1.315 (0.951–1.818)
0.098
MIP-1a
756.3
(1023.8)
1.447 (1.049–1.996)
0.024
MIP-1b
125.7
(189.2)
0.969 (0.659–1.425)
0.874
OPN
56944.3
(45651.9)
0.943 (0.696–1.278)
0.704
PAI-1
59368.9
(26951.9)
1.309 (0.945–1.813)
0.106
PF4
15316.6
(21646.6)
2.056 (1.426–2.965)
0.001
PROCALCITONIN
798.2
(257.3)
1.066 (0.782–1.453)
0.688
RAGE
9614.5
(8635.9)
0.778 (0.570–1.062)
0.114
RESISTIN
1325.9
(499.5)
1.612 (1.159–2.243)
0.005
ST2
22.1
(18.8)
1.144 (0.814–1.606)
0.439
THROMBOMODULIN
11011.4
(41453.8)
1.501 (1.117–2.015)
0.007
TNF
835.9
(184.4)
1.527 (1.186–1.966)
0.001
TREM-1
1119.2
(450.9)
1.249 (0.963–1.619)
0.094
TROPONIN-1
1190.7
(365.8)
1.103 (0.761–1.599)
0.605
UPAR
43928.6
(21326.7)
1.676 (1.216–2.309)
0.002
VCAM-1
232606.8
(80647.8)
1.140 (0.876–1.484)
0.330
VEGF
1567.0
(2526.9)
2.081 (1.375–3.184)
0.001
Validation using single ELISA
IL8
399.4
(1445.2)
1.625 (1.066–2.477)
0.024
PF4
4311.9
(7714.5)
1.850 (1.267–2.701)
0.001
Cell counts
In the discovery cohort there was considerable inter-patient variability in the cellular composition of the pleural effusion samples. As a percentage of total cells, lymphocytes on average comprised approximately a third of total cell counts (27% (34)), however there was a wide range in values from 1 to 94%. Effusions had on average 10.5 (22.5)% mesothelial and/or mesothelioma cells. Samples could be segregated by the presence of a predominant cell type with 24% of samples being predominately (i.e. 50%) lymphocytic and 30% being comprised predominately of macrophages. There were two samples that had 50% neutrophils; post hoc review of clinical records provided no indication of infection at this time for these patients (Fig. 1). No significant association was observed for groups dichotomised on percentage of lymphocytes, macrophages or neutrophils with survival in univariate analysis (Table 2; column 2), although the HR for the association of each with prognosis was positive for lymphocytes and macrophages and negative for neutrophils when analysed as a continuous variable.
Pleural effusion soluble factors independently associated with prognosis using multivariate forward stepwise analysis Cox Proportional Hazards Regression
Soluble factor
HR in discovery cohort
value
HR in validation cohort
value
IL8
2.688 (1.690–4.273)
0.001
1.501 (0.988–2.279)
0.057
IL2Ra
2.223 (1.275–3.877)
0.005
ND
PF4
1.936 (1.311–2.859)
0.001
1.687 (1.157–2.461)
0.007
Lipocalin2
0.419 (0.275–0.640)
0.001
ND
IL4
0.615 (0.395–0.956)
0.031
ND
Abbreviation: ND – not determined.
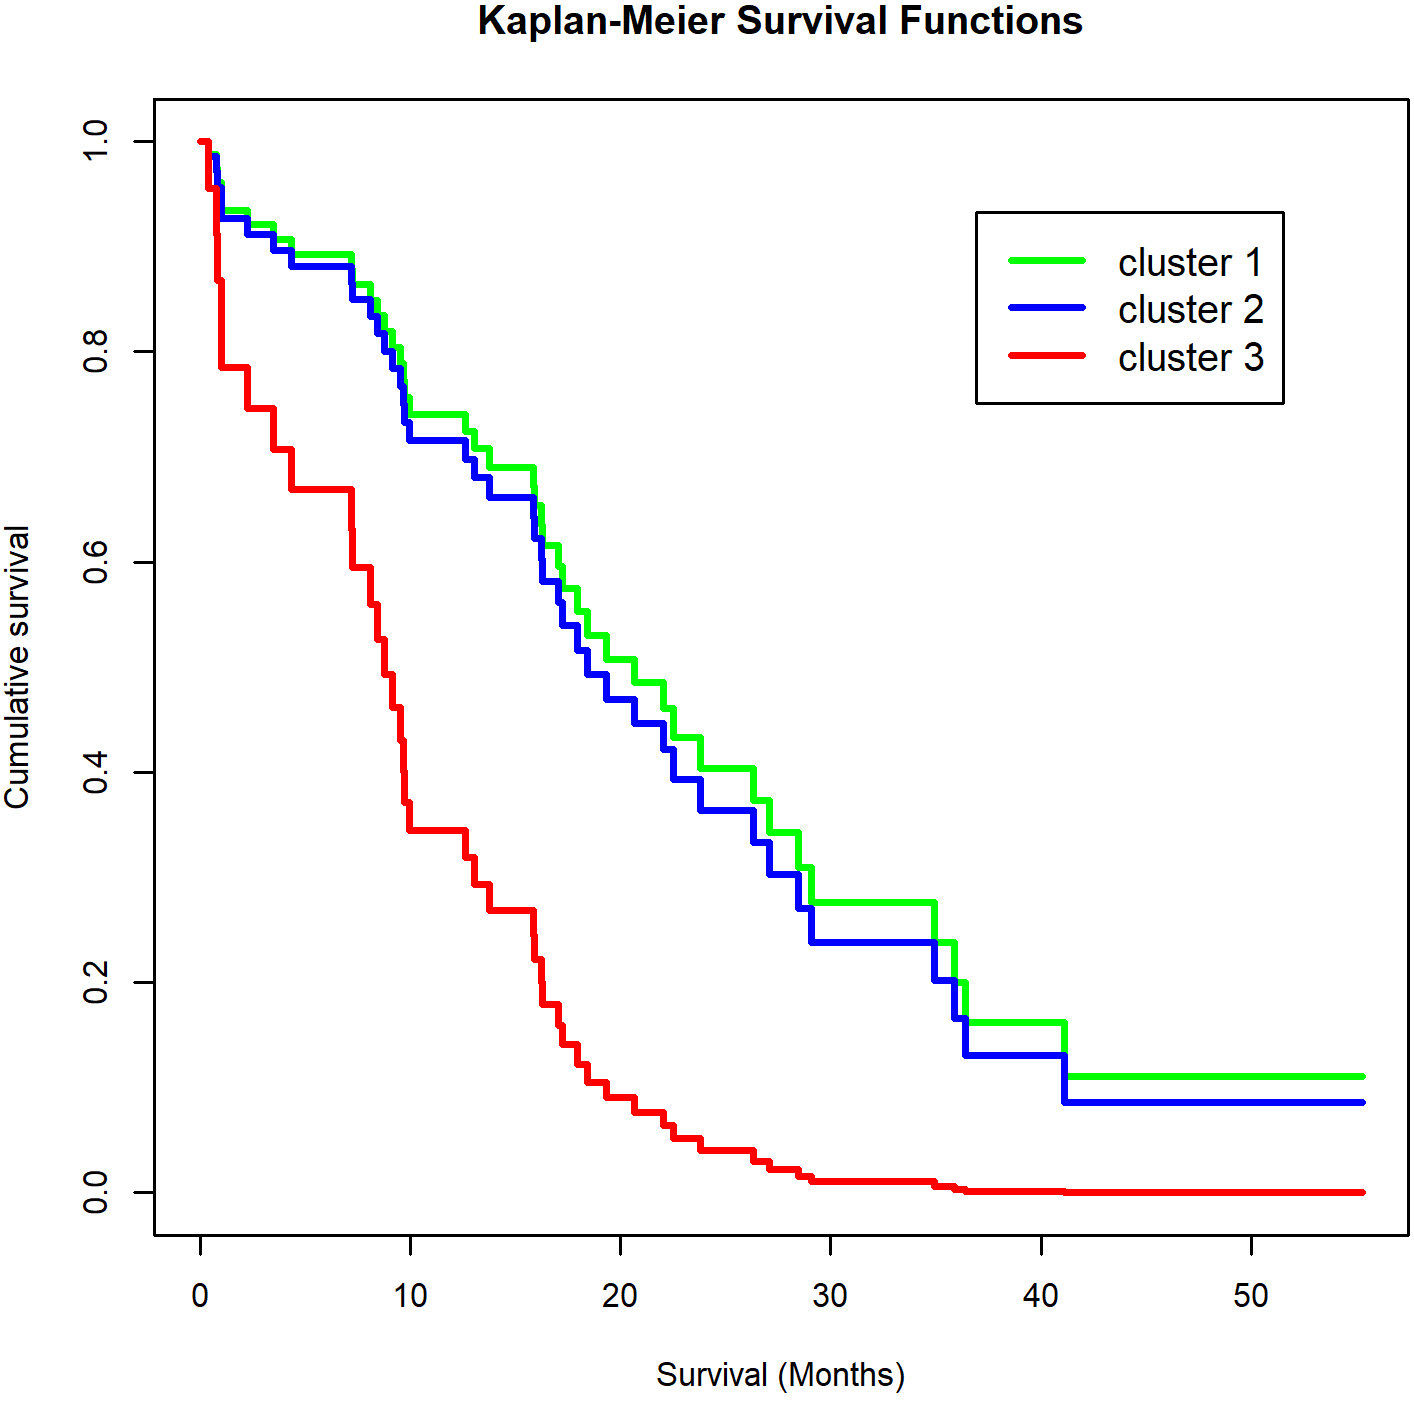
Kaplan-Meier plot of the association of cytokine cluster group with prognosis. Log-rank test 2 11.41, 0.003. Vertical marks are censored time points.
Cytokine, chemokine and soluble factor concentrations
The majority of the 40 molecules measured in the pleural effusions of the discovery cohort were measured in the linear range of the assay for all 50 samples; note, 0.25% (i.e. 5/2000) were below the limit of detection of the assay and 0.35% (7/2000) were above the upper limit of the assay (Table 3). Values below the limit of detection were imputed as described under Methods. Univariate analysis demonstrated that 14 of the 40 molecules (35%) were significantly associated with survival. For each of these 14 molecules, an increasing value was associated with a poorer prognosis (Table 3). Given the known interrelationships between cytokines and chemokines, multivariate analysis was performed. Five molecules had an independent association with survival; increasing concentrations of IL8, IL2Ra and PF4 were independently associated with a poorer prognosis and increasing concentrations of lipocalin-2 and IL4 were associated with a more favourable prognosis (Table 4). Of particular note, IL4 was significantly associated in univariate analysis in the opposite direction with a poorer prognosis, indicating that its relationship with prognosis is strongly confounded by its correlation with other factors. Using a more stringent analysis (pIN value of 0.0003), IL8 was the only pleural effusion cytokine that was significantly associated with prognosis.
Cluster analysis
Hierarchical cluster analysis (of normalized log(10) transformed values for expression levels in pleural effusions) revealed three major clusters (Fig. 2), with patient cluster 1 (consisting of 11 patients) having an overall higher concentration of pleural effusion soluble factors than cluster 2 (17 patients) or cluster 3 (22 patients). In the second dimension soluble factors partitioned into two major cluster groups; soluble factor group 1 (top, Fig. 2) and soluble factor group 2 (bottom, Fig. 2). The five soluble factors independently associated with prognosis were distributed throughout the clusters (Fig. 2 – PF4, IL8 and IL2RA, indicated in red; lipocalin-2 and IL4, indicated in green).
Patients in cluster 1 had a strikingly poorer prognosis than either cluster 2 or cluster 3 patients (HR 3.549 (1.557–8.089); 0.001 Fig. 3). Notably, only one of the 11 cluster 1 patients had a tumour with sarcomatoid histology, therefore sarcomatoid histology was not over represented in this cluster (1 sarcomatoid patient, 2 0.654, 0.721). Histology (epithelioid or sarcomatoid/biphasic), which was not a significant prognostic indicator in univariate analysis, achieved statistical significance in a multivariate Cox regression analysis after adjustment for patient cluster group (Table 2, column 6), emphasising the importance of high soluble factor levels in determining survival in this cohort of patients.
Post-hoc analysis of soluble factor concentrations between individuals who survived less than 12 months ( 18) versus those that survived greater than 24 months ( 8) confirmed that IL8 (136 (137) vs 55 pg/ml (61), 0.007) and PF4 (35443 (56943) vs 15505 pg/ml (15623), 0.005) concentrations were higher in the short term survival group, as was TNF (878 (305) vs 818 pg/ml (110), 0.01).
Association between soluble factor levels and cell composition
When the association between soluble factor levels and the broad cellular composition of the effusion was examined IL4 was the strongest predictor of cellular composition, being positively associated with lymphocytes and negatively associated with neutrophils (Table 5). The neutrophil to lymphocyte ratio (NLR) in the effusion was also strongly negatively predicted by IL4.
Association of pleural effusion cellular composition and soluble factor concentrations with pleural effusion cellular composition determined using multiple regression analysis on normalized values
Component
Cytokine
Beta coefficient
value
Adjusted
% lymphocytes
IL4
0.561
0.001
uPAR
0.490
0.001
MCP1
0.417
0.001
Fas
0.400
0.001
cd40
0.321
0.009
VCAM
0.217
0.033
0.618
% macrophages
CRP
0.352
0.007
PF4
0.301
0.020
MIP1b
0.271
0.034
0.269
% neutrophils
IL4
0.576
0.001
IL6
0.500
0.001
IL1a
0.394
0.001
RAGE
0.334
0.001
IL10
0.293
0.005
0.571
NLR
IL4
0.732
0.001
RAGE
0.456
0.001
Thrombomodulin
0.400
0.003
Procalcitonin
0.301
0.016
0.506
Several other factors were associated with cellular composition. MCP1 and VCAM were positive predictors and uPAR, Fas and CD40 were significant negative predictors of pleural effusion lymphocyte frequencies. For pleural effusion neutrophils, in addition to IL4, IL6 and IL1a, were significant positive predictors and RAGE and IL10 were negative predictors. Pleural effusion macrophages were positively predicted by CRP and negatively predicted by PF4 and MIP1b. The NLR was negatively predicted by RAGE in addition to IL4 and positively predicted by thrombomodulin and procalcitonin. Notably, IL8 levels were not significantly associated with cell composition.
Validation study
To determine if the observation in the discovery cohort that pleural effusion concentrations of IL8 and PF4 were independent prognostic predictors, an independent set of randomly selected pleural effusion samples was then studied and levels of these factors were measured using stand-alone ELISA kits. There were quantitative differences in concentrations of IL8 and PF4 for the samples when measured by the multiplex assay and by ELISA. Median IL8 levels were 85 (121) pg/ml in the multiplex assay and 399 (1445) pg/ml by ELISA (Table 3). However, there was a strong correlation between PF4 ( 0.900, 0.037) and IL8 ( 0.903, 0.001) for samples measured on both platforms.
Using the ELISA generated data, PF4 concentrations were more strongly associated with prognosis (HR (per SD increase) 1.850 (1.267–2.701), 0.001)) than IL8 concentrations (HR (per SD increase) 1.625 (1.066–2.477, 0.024)) in the discovery cohort (Table 3). The independent association of the two factors with prognosis was evident but less pronounced in the validation cohort when the two factors were adjusted for each other in the Cox regression analysis (IL8 HR 1.501 (per SD increase) (0.988–2.279); 0.057: PF4 (per SD increase) HR 1.687 (1.157–2.461); 0.007). Therefore, the validation study examining IL8 and PF4 concentrations determined using stand-alone ELISA assays confirmed the prognostic association of these factors that was originally observed in the discovery cohort using a Quantikine multiplex assay.
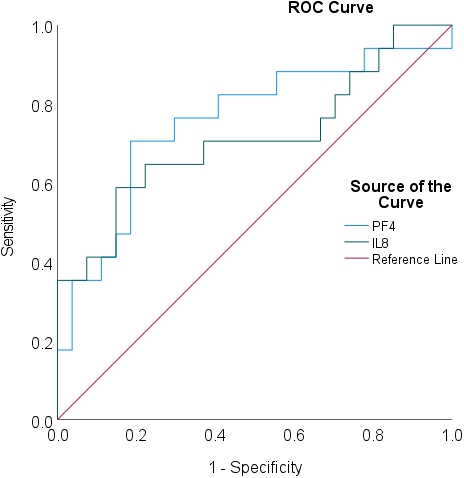
ROC analysis confirmed that IL8 and PF4 were predictive of survival with area under the curve (AUC) values of 0.712 (0.543–0.881, 0.019) and 0.756 (0.600–0.912, 0.005), respectively. Both IL8 and PF4 displayed similar specificity versus sensitivity characteristics (Fig. 4).
ROC analysis for pleural effusion IL8 and PF4 concentrations in predicting prognosis in the validation cohort (survival 9 months compared to survival 9 months). AUC for IL8 0.712 (0.543–0.881, 0.019); AUC for PF4 0.756 (0.600–0.912, 0.005).
Discussion
The key finding in this study is that mesothelioma patients with high concentrations of a range of soluble factors in the pleural effusion have a relatively poor prognosis which is independent of other potential prognostic factors, including histology. Three soluble factors that most closely and independently correlated with a negative prognosis were IL8, IL2Ra (CD25) and PF4, whilst lipocalin2 and IL4 were associated with an improved prognosis. Importantly, results for IL8 and PF4 were validated in an independent sample set and using a different assay system.
Pleural effusions are tumor-associated fluids that commonly occur in mesothelioma. They are routinely drained for diagnostic purposes and for patient symptom relief. They represent an ideal opportunity to sample the immune and inflammatory environment associated with the early stages of the disease – few other cancers offer this opportunity. This study shows that prognostic value can be derived from studies of pleural effusion samples through the measurement of factors using a simple ELISA assay. Given the poor prognosis and relatively short timeframe for provision of treatment, additional prognostic information independent of patient age, sex and tumour histology would be useful for clinical decision making. This paper demonstrates that this is indeed the case.
Previously, IL8 serum concentrations and tissue expression have been associated with negative prognosis in a range of tumour types including breast cancer [24, 25, 26], hepatocellular carcinoma [27, 28] and others. Also, PF4 has been reported to be a negative prognostic factor in pancreatic adenocarcinoma [29] and lung cancer [30]. Neither IL8 nor PF4 have previously been associated with prognosis in mesothelioma. As they are relatively easy to assay, measurement of these factors provides an opportunity for clinicians to gain extra useful information early in the course of the disease.
This study does not reveal the reason for the association of pleural effusion concentrations with prognosis. It may be related to the known effects of cytokines on tumour growth; epithelial-to-mesenchymal transition (EMT); chemoresistance or on their direct effects on immune cells. Further studies to elucidate these mechanisms may help provide clues to new therapeutic approaches.
The factor most strongly associated with negative prognosis in this study, IL8 (CXCL8), is a well-known cytokine which has been shown to induce EMT in epithelial [31] and breast cancers [32]. It has also been demonstrated that there is a direct causal association of IL8 with mesothelioma tumour growth and migration [9]. Of particular interest is the finding that IL8 producing tumours, including mesothelioma, induced the migration of Foxp3 CD4 T regulatory cells present in PMBCs through a IL8 mediated migration, suggesting that this may contribute to tumour escape from the immune system [33], with a consequent negative effect on prognosis. PF4 (CXCL4), a secreted chemokine released from activated platelets [34] has been reported to decrease T cell proliferation and IFN- release, which are associated with down-regulation of IL2 release from T cells, as well as decreasing mononuclear cell proliferation [35]. Therefore PF4, like IL8, is a potential negative regulator of anti-tumour immune activity.
The third independent negative prognostic cytokine was IL2Ra (CD25), which is the alpha chain component of the IL2 receptor and its soluble form is the result of extracellular proteolysis associated with mononuclear cell activation. High serum levels are a feature of a range of autoimmune diseases, lymphomas and leukaemia [36]. Soluble IL2Ra has been reported to be a potential decoy receptor for IL2 and soluble IL2Ra release by T regulatory cells may therefore have an anti T cell response [37]. This is supported by the finding that IL2 can ameliorate CD8+ T cell exhaustion in lung cancer pleural effusions [38].
Despite the overall poorer outcome of patients with a high pleural effusion cytokine composition, two cytokines were associated with an improved prognosis; lipocalin2 and IL4. This effect was seen even after adjustment for all other factors measured in the multivariate analysis. Lipocalin 2 is a neutrophil secreted innate immune protein that has roles in inflammation and iron homeostasis [39]. Its role in cancer is varied with both tumourigenic and anti-tumourogenic effects being reported [39]. Pleural effusion IL4 was associated with a more positive prognosis and was also associated with a greater lymphocyte and a smaller neutrophil cellularity. IL4 is produced by activated T cells, so its significant association with a positive outcome is likely to be the result of a more robust anti-tumour immune response. However, the IL4 association with prognosis is weak and is confounded by its correlation with other cytokines that have a negative association with prognosis.
Pleural effusion cytokines, chemokines and cellular factors may also influence the immune cell composition of the pleural effusion as the result of the chemokine effects of many of these [40], which in turn may be associated with prognosis. The strong positive association of CRP with the percent macrophage cellular pleural effusion content indicates that the predominant macrophage type in mesothelioma pleural effusion is the pro-inflammatory M1 type [41], rather than the tumour associated M2 macrophage. PF4 had a significant negative association with the percent macrophage cellular pleural effusion content, which is of some interest as PF4 has been reported to specifically stimulate CXCL4 induced macrophages that are associated with atherosclerosis [42] and suggests that PF4 actively inhibits the pro-inflammatory M1 subtype.
In conclusion, this study demonstrates that a pleural effusion enriched in cytokines, chemokines and soluble factors is associated with a poor prognosis independent of other prognostic factors. These factors present in pleural fluid are likely to be associated with enhanced tumour growth, EMT and chemoresistance and are therefore potential therapeutic targets. Measurement of pleural fluid IL8, PF4, IL2Ra, lipocalin2 and IL4 will add valuable prognostic information in mesothelioma in addition to those that are already used. Confirmation studies are now required to be done in order to further evaluate their use as biomarkers and to determine optimum threshold values for their clinical use.
Footnotes
Acknowledgments
The authors would like to thank Ms Justine Leon and Ms Hanne Dare for excellent technical assistance with this project.
Author contributions
Preparation of the manuscript; interpretation or analysis of data: Ian M Dick.
Conception; revision for important intellectual content: Y.C. Gary Lee.
Interpretation or analysis of data: Hui Min Cheah.
Interpretation or analysis of data: Alina Miranda.
Conception; preparation; revision for important intellectual content: Bruce W.S. Robinson.
Conception; preparation of the manuscript; interpretation or analysis of data; supervision: Jenette Creaney.
References
1.
RobinsonB.W. and LakeR.A., Advances in malignant mesothelioma, N Engl J Med353(15) (2005), 1591–603. doi: 10.1056/NEJMra050152.
2.
RobinsonB.W.MuskA.W. and LakeR.A., Malignant mesothelioma, Lancet366(9483) (2005), 397–408. doi: 10.1016/S0140-6736(05)67025-0.
3.
DamhuisR.A.KhakwaniA.De SchutterH.RichA.L.BurgersJ.A. and van MeerbeeckJ.P., Treatment patterns and survival analysis in 9014 patients with malignant pleural mesothelioma from Belgium, the Netherlands and England, Lung Cancer89(2) (2015), 212–7. doi: 10.1016/j.lungcan.2015.05.014.
4.
TaioliE.WolfA.S.Camacho-RiveraM.KaufmanA.LeeD.S.NicastriD. et al., Determinants of Survival in Malignant Pleural Mesothelioma: A Surveillance, Epidemiology, and End Results (SEER) Study of 14,228 Patients, PLoS One10(12) (2015), e0145039. doi: 10.1371/journal.pone.0145039.
5.
HeJ.XuS.PanH.LiS. and HeJ., Does size matter? – a population-based analysis of malignant pleural mesothelioma, Transl Lung Cancer Res9(4) (2020), 1041–52. doi: 10.21037/tlcr-19-488.
6.
BrimsF.J.MeniawyT.M.DuffusI.de FonsekaD.SegalA.CreaneyJ. et al., A novel clinical prediction model for prognosis in malignant pleural mesothelioma using decision tree analysis, Journal of Thoracic Oncology: Official Publication of the International Association for the Study of Lung Cancer11(4) (2016), 573–82. doi: 10.1016/j.jtho.2015.12.108.
7.
LecotP.AlimirahF.DesprezP.Y.CampisiJ. and WileyC., Context-dependent effects of cellular senescence in cancer development, Br J Cancer114(11) (2016), 1180–4. doi: 10.1038/bjc.2016.115.
8.
CaninoC.MoriF.CambriaA.DiamantiniA.GermoniS.AlessandriniG. et al., SASP mediates chemoresistance and tumor-initiating-activity of mesothelioma cells, Oncogene31(26) (2012), 3148–63. doi: 10.1038/onc.2011.485.
9.
di MartinoS.AmoreoC.A.NuvoliB.GalatiR.StranoS.FaccioloF. et al., HSP90 inhibition alters the chemotherapy-driven rearrangement of the oncogenic secretome, Oncogene37(10) (2018), 1369–85. doi: 10.1038/s41388-017-0044-8.
10.
LightR.W.LeeY.C.G., Textbook of Pleural Diseases, Third Edition: CRC Press, 2016.
11.
CheahH.M.LansleyS.M.Varano Della VergilianaJ.F.TanA.L.ThomasR.LeongS.L. et al., Malignant pleural fluid from mesothelioma has potent biological activities, Respirology22(1) (2017), 192–9. doi: 10.1111/resp.12874.
12.
ThomasR.CheahH.M.CreaneyJ.TurlachB.A. and LeeY.C., Longitudinal measurement of pleural fluid biochemistry and cytokines in malignant pleural effusions, Chest149(6) (2016), 1494–500. doi: 10.1016/j.chest.2016.01.001.
13.
PassH.I.LevinS.M.HarbutM.R.MelamedJ.ChiribogaL.DoningtonJ. et al., Fibulin-3 as a blood and effusion biomarker for pleural mesothelioma, N Engl J Med367(15) (2012), 1417–27. doi: 10.1056/NEJMoa1115050.
14.
CreaneyJ.DickI.M.MeniawyT.M.LeongS.L.LeonJ.S.DemelkerY. et al., Comparison of fibulin-3 and mesothelin as markers in malignant mesothelioma, Thorax69(10) (2014), 895–902. doi: 10.1136/thoraxjnl-2014-205205.
15.
KirschnerM.B.PulfordE.HodaM.A.RozsasA.GriggsK.ChengY.Y. et al., Fibulin-3 levels in malignant pleural mesothelioma are associated with prognosis but not diagnosis, Br J Cancer113(6) (2015), 963–9. doi: 10.1038/bjc.2015.286.
16.
CreaneyJ.DickI.M.SegalA.MuskA.W. and RobinsonB.W., Pleural effusion hyaluronic acid as a prognostic marker in pleural malignant mesothelioma, Lung Cancer82(3) (2013), 491–8. doi: 10.1016/j.lungcan.2013.09.016.
17.
RickhamP.P., Human experimentation. code of ethics of the world medicalassociation. Declaration of helsinki, Br Med J2(5402) (1964), 177. doi: 10.1136/bmj.2.5402.177.
18.
BlankersM.KoeterM.W. and SchippersG.M., Missing data approaches in eHealth research: simulation study and a tutorial for nonmathematically inclined researchers, J Med Internet Res12(5) (2010), e54. doi: 10.2196/jmir.1448.
19.
CreaneyJ.YeomanD.NaumoffL.K.HofM.SegalA.MuskA.W. et al., Soluble mesothelin in effusions: a useful tool for the diagnosis of malignant mesothelioma, Thorax62(7) (2007), 569–76. doi: 10.1136/thx.2006.068114.
20.
UrminskyO.HansenC. and ChernozhukovV., Using double-lasso regression for principled variable selection, Randomized Social Experiments Journal, 2016. doi: 10.2139/ssrn.2733374.
21.
MuskA.B.W.de KlerkN. and BrimsF.J., Mesothelioma in Australia: a review, Med J Aust207(10) (2017), 449–52. doi: 10.5694/mja17.00397.
22.
WickhamH., ggplot2: Elegant Graphics for Data Analysis, New York: Springer-Verlag, 2009.
23.
R Core Team. R: A Language and Environment for Statistical Computing. Vienna, Austria: R Foundation for Statistical Computing, 2017.
24.
MilovanovicJ.Todorovic-RakovicN. and RadulovicM., Interleukin-6 and interleukin-8 serum levels in prognosis of hormone-dependent breast cancer, Cytokine, 2018, doi: 10.1016/j.cyto.2018.02.019.
25.
MaY.RenY.DaiZ.J.WuC.J.JiY.H. and XuJ., IL-6, IL-8 and TNF-alpha levels correlate with disease stage in breast cancer patients, Adv Clin Exp Med26(3) (2017), 421–6.
26.
JiaD.LiL.AndrewS.AllanD.LiX.LeeJ. et al., An autocrine inflammatory forward-feedback loop after chemotherapy withdrawal facilitates the repopulation of drug-resistant breast cancer cells, Cell Death Dis8(7) (2017), e2932. doi: 10.1038/cddis.2017.319.
27.
ChanS.L.ChanA.W.ChanA.K.JianP.MoF.ChanC.M. et al., Systematic evaluation of circulating inflammatory markers for hepatocellular carcinoma, Liver Int37(2) (2017), 280–9. doi: 10.1111/liv.13218.
28.
SunQ.LiF.SunF. and NiuJ., Interleukin-8 is a prognostic indicator in human hilar cholangiocarcinoma, Int J Clin Exp Pathol8(7) (2015), 8376–84.
29.
PorukK.E.FirpoM.A.HuerterL.M.ScaifeC.L.EmersonL.L.BoucherK.M. et al., Serum platelet factor 4 is an independent predictor of survival and venous thromboembolism in patients with pancreatic adenocarcinoma, Cancer Epidemiol Biomarkers Prev19(10) (2010), 2605–10. doi: 10.1158/1055-9965.EPI-10-0178.
30.
PucciF.RickeltS.NewtonA.P.GarrisC.NunesE.EvavoldC. et al., PF4 Promotes Platelet Production and Lung Cancer Growth, Cell Rep17(7) (2016), 1764–72. doi: 10.1016/j.celrep.2016.10.031.
31.
CoppeJ.P.PatilC.K.RodierF.SunY.MunozD.P.GoldsteinJ. et al., Senescence-associated secretory phenotypes reveal cell-nonautonomous functions of oncogenic RAS and the p53 tumor suppressor, PLoS Biol6(12) (2008), 2853–68. doi: 10.1371/journal.pbio.0060301.
32.
Ortiz-MonteroP.Londono-VallejoA. and VernotJ.P., Senescence-associated IL-6 and IL-8 cytokines induce a self- and cross-reinforced senescence/inflammatory milieu strengthening tumorigenic capabilities in the MCF-7 breast cancer cell line, Cell Commun Signal15(1) (2017), 17. doi: 10.1186/s12964-017-0172-3.
33.
EikawaS.OhueY.KitaokaK.AjiT.UenakaA.OkaM. et al., Enrichment of Foxp3+ CD4 regulatory T cells in migrated T cells to IL-6- and IL-8-expressing tumors through predominant induction of CXCR1 by IL-6, J Immunol185(11) (2010), 6734–40. doi: 10.4049/jimmunol.1000225.
34.
RucinskiB.NiewiarowskiS.StrzyzewskiM.HoltJ.C. and MayoK.H., Human platelet factor 4 and its C-terminal peptides: heparin binding and clearance from the circulation, Thromb Haemost63(3) (1990), 493–8.
35.
FleischerJ.Grage-GriebenowE.KasperB.HeineH.ErnstM.BrandtE. et al., Platelet factor 4 inhibits proliferation and cytokine release of activated human T cells, J Immunol169(2) (2002), 770–7. doi: 10.4049/jimmunol.169.2.770.
36.
CarusoC.CandoreG.CignaD.ColucciA.T. and ModicaM.A., Biological significance of soluble IL-2 receptor, Mediators Inflamm2(1) (1993), 3–21. doi: 10.1155/S0962935193000018.
37.
LindqvistC.A.ChristianssonL.H.SimonssonB.EnbladG.Olsson-StrombergU. and LoskogA.S., T regulatory cells control T-cell proliferation partly by the release of soluble CD25 in patients with B-cell malignancies, Immunology131(3) (2010), 371–6. doi: 10.1111/j.1365-2567.2010.03308.x.
38.
HuC.Y.ZhangY.H.WangT.ChenL.GongZ.H.WanY.S. et al., Interleukin-2 reverses CD8(+) T cell exhaustion in clinical malignant pleural effusion of lung cancer, Clin Exp Immunol186(1) (2016), 106–14. doi: 10.1111/cei.12845.
39.
XiaoX.YeohB.S. and Vijay-KumarM., Lipocalin 2: An Emerging Player in Iron Homeostasis and Inflammation, Annu Rev Nutr37 (2017), 103–30. doi: 10.1146/annurev-nutr-071816-064559.
40.
AtanackovicD.CaoY.KimJ.W.BrandlS.ThomI.FaltzC. et al., The local cytokine and chemokine milieu within malignant effusions, Tumour Biol29(2) (2008), 93–104. doi: 10.1159/000135689.
41.
DevarajS. and JialalI., C-reactive protein polarizes human macrophages to an M1 phenotype and inhibits transformation to the M2 phenotype, Arterioscler Thromb Vasc Biol31(6) (2011), 1397–402. doi: 10.1161/ATVBAHA.111.225508.
42.
GleissnerC.A., Macrophage Phenotype Modulation by CXCL4 in Atherosclerosis, Front Physiol3 (2012), 1. doi: 10.3389/fphys.2012.00001.