
Abstract
BACKGROUND:
Gastric cancer (GC) patients with peritoneal metastasis usually have extremely poor prognosis. Intraperitoneal infusion of paclitaxel (PTX) provides an effective treatment, but relapse and PTX-resistance are unavoidable disadvantages, and it is difficult to monitor the occurrence of PTX-resistance.
OBJECTIVE:
The aim of this study was to explore novel autoantibodies in the ascites of individuals with relapsed PTX-resistant GC with peritoneal metastasis.
METHODS:
Ascites samples were collected before PTX infusion and after the relapse in 3 GC patients. To determine the expression of significantly changed proteins, we performed autoantibody profiling with immunome protein microarrays and tandem mass tag (TMT) quantitative proteomics, and then, the overlapping proteins were selected.
RESULTS:
Thirty-eight autoantibodies that were differentially expressed between the ascites in the untreated group and relapsed PTX-resistant group were identified. For confirmation of the results, TMT quantitative proteomics was performed, and 842 dysregulated proteins were identified. Four proteins, TPM3, EFHD2, KRT19 and vimentin, overlapped between these two assays.
CONCLUSIONS:
Our results first revealed that TPM3, EFHD2, KRT19 and vimentin were novel autoantibodies in the ascites of relapsed PTX-resistant GC patients. These autoantibodies may be used as potential biomarkers to monitor the occurrence of PTX-resistance.
Introduction
Gastric cancer (GC) is the fifth most common malignancy and the third leading cause of cancer-related deaths in China [1]. Peritoneal metastasis (PM) is the main type of metastasis of GC, which accounts for nearly 50% of all metastatic types. Patients with PM have extremely poor prognosis even with intensive systemic chemotherapy.
Recently, GC patients with PM were treated by intravenous (IV) and intraperitoneal (IP) administration of paclitaxel (PTX) with oral intake of S-1 [2, 3]. In this IP chemotherapy, PTX is repeatedly administered into the IP cavity via a subcutaneously placed IP port, and IP infusion of PTX is well tolerated. This combination chemotherapy is remarkably effective for GC patients with PM and appears to prolong survival, with a 3-year overall survival rate of 21.9%. Importantly, the IP PTX group showed a better response in patients with high levels of ascites [4, 5], and malignant ascites is usually controlled after 1–3 cycles of chemotherapy. However, the likelihood of resistance is a disadvantage of PTX. In some patients, relapse with ascites was observed after several cycles of chemotherapy, and the patients showed resistance to PTX infusion along with more aggressive metastasis. To date, however, there are few studies about the recurrence of ascites, and biomarkers in ascites still need to be explored.
The present study aims to identify novel native autoantibodies in recurrent ascites of GC patients with PM through immunome protein microarrays and proteomics. Protein microarray technology is an emerging high-throughput option for the discovery of cancer biomarkers [6]. The microarray utilizes KREX technology and contains a biotin carboxyl carrier protein (BCCP) domain affinity tag to promote fusion of post-translationally biotinylated proteins to an array surface to include a total of 1631 proteins that play important functions in the human immune response, including kinases and transcription factors [7]. This microarray allows the detection of autoantibodies in patient body fluid samples, making it an effective tool for biomarker discovery [8, 9]. In this study, we selected ascites samples from 3 patients before PTX infusion and after the relapse of malignant ascites. Then, the samples were analyzed by immunome protein arrays and tandem mass tag (TMT) quantitative proteomics, and 4 novel autoantibodies, TPM3, EFHD2, KRT19 and vimentin were identified.
In this study, we aimed to identify novel autoantibody signatures utilizing proteomic antibody profiling and defining the signature autoantibodies of the disease, which could potentially be involved in the pathogenesis of recurrent ascites.
Materials and methods
Patients medication and samples selection
In this study, PM in GC patients were determined by laparoscopic exploration and metastatic nodules biopsy, and ascites cytology was also performed. The regimen used consisted of intravenous (iv) PTX and IP PTX and oral tegafur/gimeracil/oteracil (S-1) [10]. Specifically, PTX was administered via iv and IP at doses of 50 mg/m
We collected the ascites from the patients that met the follow criteria: GC patients with peritoneal metastasis but no other metastasis; patients received no other treatments before the infusion of PTX; and the malignant ascites disappeared after the 1–3 cycles of PTX chemotherapy but relapsed later with more metastasis and were resistant to PTX treatment. Between January 2018 and October 2018, 3 patients who met all the above criteria were selected. The pathological type of these patients was poorly differentiated adenocarcinoma. Ascites before the chemotherapy were collected in the first laparoscopic exploration. The first patient (Case 022260) was given at doses of 85 mg PTX via intravenous injection (iv) and 35 mg via IP for 6 cycles of chemotherapy, and the regimen sustained 4.0 months before relapse. After the diagnosis of clinical progression, ascites was collected and stored. The second patient (Case 022282) was given at doses of 75 mg PTX via iv and 30 mg via IP for 8 cycles of chemotherapy, and the regimen sustained 6.0 months before relapse. Ascites was extracted out after the diagnosis of relapse. The third patient (Case 022295) was given at doses of 80 mg PTX via iv and 30 mg via IP for 5 cycles of chemotherapy, and the regimen sustained 3.5 months before relapse. Ascites was extracted out after the diagnosis of relapse (Supplementary Table S1).
Fifty milliliters of ascites from patients was collected, transferred into 50 ml tubes and centrifuged at 2000 g for 15 min at 4
Immunome protein microarray profiling
Immumome
Ascites LC-MS/MS
Moderate SDT-lysis buffer was added to the ascites samples, and the ratio was 1:10 sample to buffer and boiled at 95
Data pre-processing
Quality control based on raw and normalized data was performed to verify the quality of protein microarray profiling. The fluorescence intensities of 2 positive controls including IgG and Cy3-BSA were also examined. The percentage of coefficient of variant (CV%) of intra-protein, intra-slid was calculated to determine the variations signal intensity between the replica spots on each slide. Quantile-based normalization of all Cy3-BSA across all samples were calculated as described previously [7].
RAW files for TMT results were processed by using Proteome Discoverer (PD version 2.1; Thermo Fisher Scientific, Bremen, Germany) with the Mascot algorithm. The data processing was performed as previously described [12].
Data analysis
The main objectives of the data analysis are to determine the quality of the data and identify the putative biomarkers from the assay. Biomarker hits were determined for each individual patient based on score value
Post vs Pre-fold change (FC) values per antigen for each individual patient were calculated as shown in Eq. (2).
where
Quality control
For determination of the binding capability of the fluorescent-conjugated secondary antibody, accurate serial dilution quantification was used as a benchmark to ensure that labeling efficiency and spot detection passed the quality control [7]. Based on the relative fluorescence units (RFUs) of IgG controls, secondary antibody incubation was performed with serial dilution from IgG1 to IgG6 (Fig. 1A). In this study, the IgG serial dilution to the experimental IgG serial dilution was plotted, and the mean CV% for the IgG control spots across all samples was 11.88% (Fig. 1B). To determine the quality of the spot intensities, we assessed the CV% between the replica assays, and the mean CV% for the IgG replica spots across all samples was determined to be 5.746% (Fig. 1C).
Quality control of labeling efficiency and spot detection. (A) Secondary antibody incubation was performed with serial dilution from IgG1 to IgG6. (B) Plot of IgG 1–6 ratios for all samples, the mean CV% for the IgG control spots across all samples was 11.88%. (C) The CV% between the replica assays and the mean CV% for the IgG replica spots across all samples was 5.746%. 
Cy3-BAS controls were included as positive controls for each array on the slide. Figure 2A reflects the successful calibration of our RFU from this protein array experiment across all samples. Post-normalization, the Cy3-BSA controls showed a common intensity value across all samples and thus improving the quality of the data (Fig. 2B). The CV% between the mean RFU of all Cy3-BSA replicates across all samples was calculated and the mean was found to be 3.281% (Fig. 2B). In this study, the mean of CV% for the Cy3-BSA replica spots across all samples that determines the quality of the spot intensities was calculated to be 5.557% (Fig. 2C).
Cy3-BAS was used as a positive control. (A) Line plot of Cy3-BSA controls from this protein array experiment. (B) Cy3-BAS distribution post-composite normalization. The relative fluorescence unit (RFU) mean CV% for all Cy3-BSA replicates across all samples was 3.281%. The blue line represents the mean CV% for each sample. (C) Intra-protein, intra-slide and inter-array CV% of Cy3-BSA replica spots across all samples. The blue line represents the mean CV% for each sample. The mean CV% for all samples is 5.557%.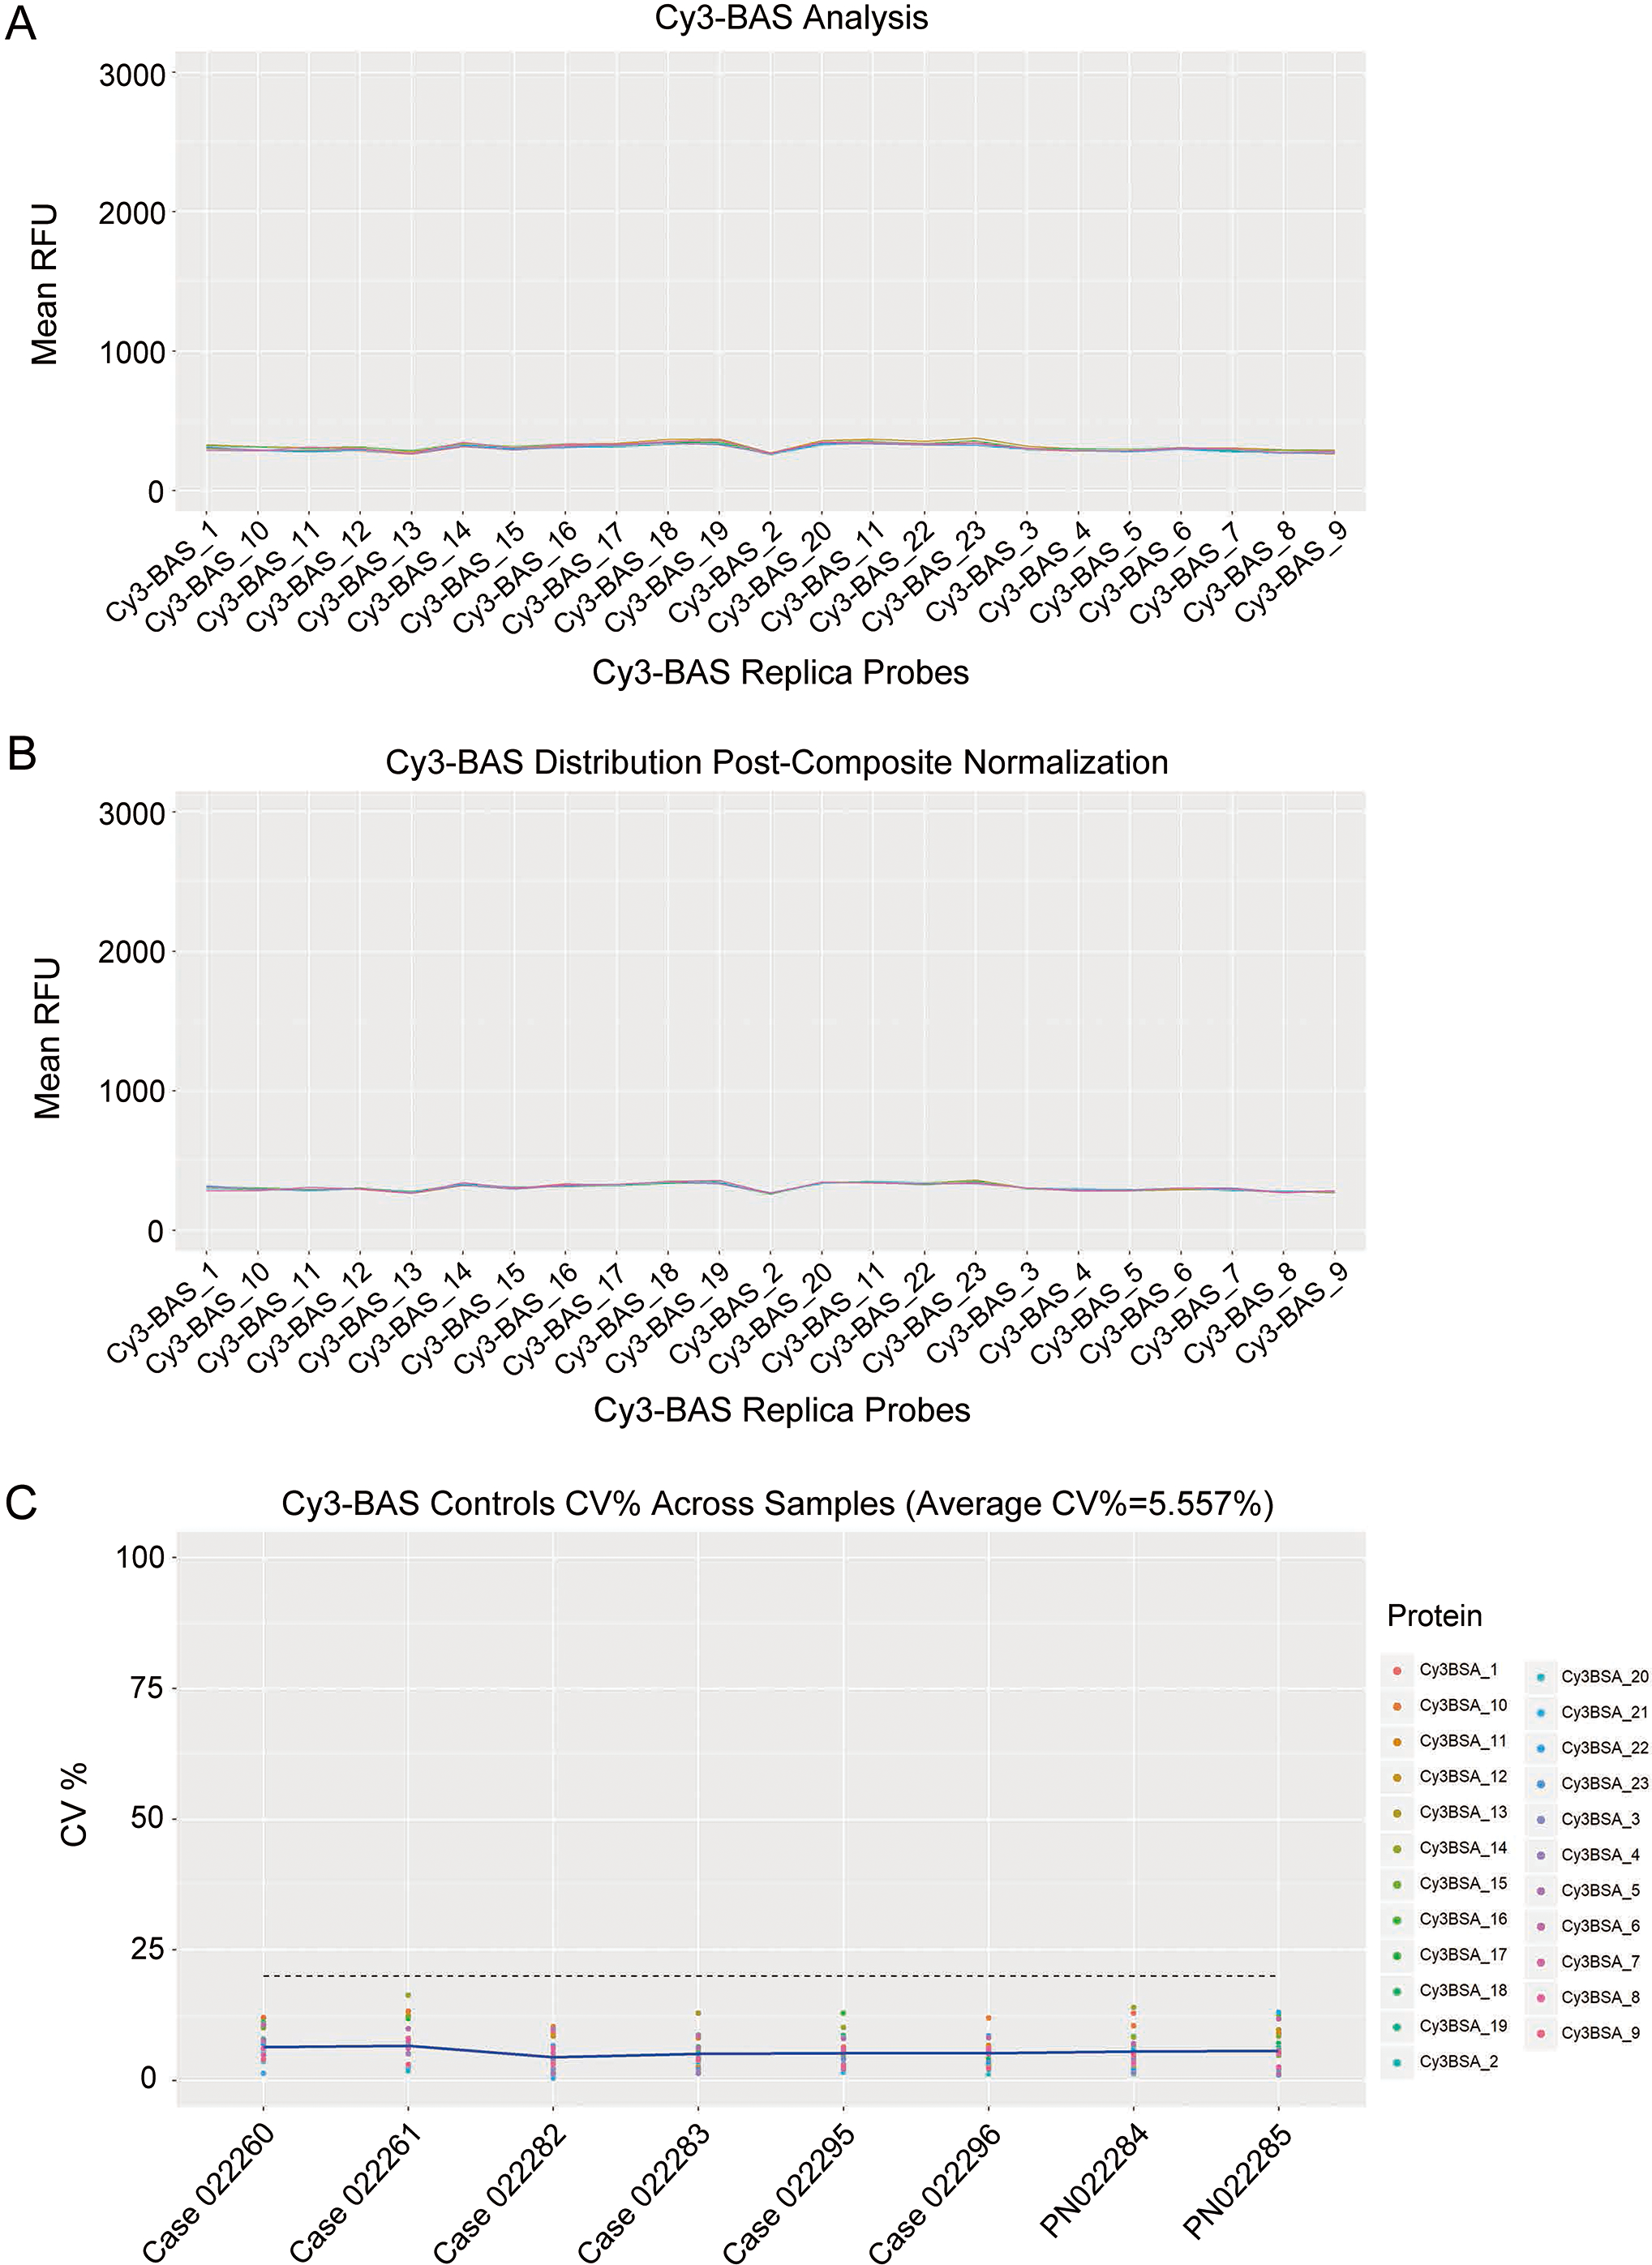
The CV% between the replicates on each slide determined the quality of the spot intensities and allowed us to assess the variability of the Cy3-BSA replica spots in each sample (Fig. 3). In this experiment, the mean CV% across all samples was 5.001%.
Intra-protein, intra-slide and inter-array CV% of 6 IgG replica spots across all samples. The mean CV% for all samples was found to be 5.001%. The blue line represents the mean CV% for each sample. 
Gene ontology analysis of 3 patients. Functional analysis included cellular components, molecular functions and biological processes.
A pairwise comparison analysis was performed between pre and post-PTX treatment for all 3 patients. In brief, the overall autoantibody profile against all 1631 antigens on the Sengenics Immunome
Dysregulated autoantibodies identified by immunome protein microarray in all cases
Dysregulated autoantibodies identified by immunome protein microarray in all cases
The 38 identified autoantibodies were subjected to functional analysis. Biological process analysis showed that the autoantibodies are related to cellular processes, biological regulation, regulation of biological processes, developmental processes and others. The molecular functions of the antibodies were also analyzed, with most antibodies being involved in binding and response to stimulus. The cellular component analysis demonstrated that the antibodies are related to cells, organelles, membranes and others in patient 1 (Fig. 4). In patient 2, the biological process analysis showed that regulation of biological process, biological regulation and metabolic process were the main processes. The molecular functions indicated cellular processes, multicellular organismal processes and developmental processes were the main functional annotations. The cellular component analysis showed that antibodies are related to cell parts, organelles, binding and protein-containing complexes (Fig. 4). In patient 3, the biological process analysis also showed that biological regulation, metabolic process, developmental process and localization were the main processes. The molecular function of autoantigens was related to cellular processes and regulation of biological processes. Cellular component analysis showed antibodies related to cell parts, organelles, protein-containing complexes and membrane-enclosed lumens (Fig. 4).
Identification of differentially expressed proteins between immunome protein microarray and TMT assay
The ascites samples were then validated by TMT proteomics assays, and 842 proteins identified by TMT-based proteomics were represented by
Venn diagram showing 4 biomarkers across the 2 data cohorts of tested samples.
Few studies have investigated the binding of patient autoantibodies to native autoantigens, especially in GC patients with PM. To our knowledge, this study is the first to use immunome protein arrays and TMT proteomics for autoantibody screening of ascites from relapsed PTX-resistant GC patients with PM.
By using immunome protein arrays, we successfully identified 38 autoantibodies as potential PTX-resistant biomarkers in ascites (Table 1). Further, using TMT proteomics analysis of ascites, we screened 842 changed proteins, and 4 proteins overlapped with the immunome protein microarray results.
The immune system can produce antibodies against foreign molecules, and generates antibodies to self-proteins pathological processes. Elevated levels of autoantibodies have been discovered in the early and late stages of most common human malignancies, including lung cancer [13], breast cancer [14], colon cancer and prostate cancer [15], which provides an opportunity for early cancer detection. Autoantibodies can also be used to monitor cancer progression and recurrence in some types of tumors [16]. Additionally, increased levels of autoantibodies are related with tumor remission or relapse for some anticancer therapies [17]. Regele S. et al. indicated that serum autoantibodies against mutant p53 protein could be used to monitor the development of breast cancer relapse [18]. However, autoantibody function in the field of GC with PM is still unknown, especially in the ascites of PTX-resistance individuals. With the assistance of immunome protein microarrays, we identified dysregulated autoantibodies in the recurrent ascites. The majority of these identified autoantibodies such as tropomyosin 1 (TPM1), tropomyosin 3 (TPM3), KRT15, DBNL, CRYAB, VIM, KRT19, HDAC3, NUBP2, SH3GL1, ATXN3 and TACC1, are associated with cytoskeletal organization. Four proteins, TPM3, EFHD2, KRT19 and vimentin, overlapped between the immunome and TMT assays.
TPM3 is a member of the tropomyosin family, and encodes an actin-binding protein. Many studies have shown that TPM3 promotes the metastasis of tumor cells [19]. In gliomas, TPM3 was positively correlated with the expression of MMP family members and EMT-like activators, and overexpression of TPM3 was associated with high-grade and higher mortality.
EF-hand domain-containing protein D2 (EFHD2) is another promising biomarker for recurrence and PTX resistance. In lung cancer, EFHD2 promotes epithelial-to-mesenchymal transition and correlates with postsurgical recurrence [20]. Additionally, EFHD2 contributes to cisplatin resistance by activating the NOX4-ROS-ABCC1 axis in non-small cell lung cancer [21].
Another interesting finding from our results was the dysregulation of keratin 19 (KRT19). Higher expression of KRT19 is related to decreased relapse free survival and overall survival in breast cancer [22]. High levels of KRT19 mRNA were associated with earlier recurrence of pancreatic cancer [23]. Importantly, high expression of KRT19 subpopulations of the esophageal squamous cell carcinoma cell line showed significant paclitaxel resistance [24].
Vimentin is an intracellular protein that belongs to the intermediate filament family, and is expressed in all mesenchymal cells. Upregulated vimentin was found in PTX-resistant ovarian cancer cells and prostate cancer cells [25, 26]. Vimentin expression was also proven to be a significant predictor of tumor relapse in some types of cancer including breast cancer and prostate cancer [27, 28]. The role of vimentin is much less studied in recurrent ascites with PTX-resistance, and it may serve as a promising biomarker for recurrence of ascites.
None of these 4 potential biomarkers are reported to be dysregulated in the recurrent ascites with PTX-resistance, and this study demonstrated that these proteins could be used as biomarkers for the early warning of recurrent ascites. However, this study has a number of limitations, including the following: 1) due to the difficulty of finding appropriate patients, only 3 patients conformed to the inclusion criteria; 2) the immunome protein microarray contains only 1631 proteins, and some changed autoantibodies may not be detected; 3) the identified potential biomarkers should be further verified in future studies.
In summary, this study presents the first attempt to comprehensively use immunome protein microarray and TMT proteomic technology to explore the novel autoantibodies in ascites from relapsed individuals with PTX-resistance, and we have identified 4 novel ascites autoantibodies, TPM3, EFHD2, KRT19 and vimentin. These findings may aid in the further understanding of recurrent ascites, and novel antibodies may be used to monitor the occurrence of PTX-resistance.
Author contributions
Conception: YZY and ZZG
Interpretation or analysis of data: YZY and YC
Preparation of the manuscript: YZY, YC and ZZG
Revision for important intellectual content: LWT, XW and LC
Supervision: YM, LBY and ZZG
Ethics approval and informed consent
Ethical approval for the use of patient ascites samples was approved by the Institutional Review Board at Ruijin Hospital, Shanghai Jiao Tong University School of Medicine. Written informed consents have attained from patients. The in vivo experiments were approved by Institutional Animal Care and Use Committee of Ruijin Hospital.
Supplementary data
The supplementary files are available to download from http://dx.doi.org/10.3233/CBM-203142.
sj-docx-1-cbm-10.3233_CBM-203142.docx - Supplemental material
Supplemental material, sj-docx-1-cbm-10.3233_CBM-203142.docx
Footnotes
Acknowledgments
We appreciate all subjects that participated in this study. This work was supported by National Natural Science Foundation of China No. 81772518; Multicenter Clinical Trial of Shanghai Jiao Tong University School of Medicine No. DLY201602.
Conflict of interest
The authors declare that they have no competing interests.