
Abstract
Background:
Circulating tumor DNA (ctDNA) is a promising technique for predicting curative effects and monitoring tumor recurrence. The utility of ctDNA for gastric cancer with peritoneal dissemination remains elusive.
Objectives:
To assess the feasibility of ctDNA in predicting tumor response to chemotherapy in gastric cancer with peritoneal dissemination.
Design:
This was a prospective study.
Methods:
We enrolled 30 patients with gastric cancer peritoneal metastasis, treated with intraperitoneal and intravenous paclitaxel plus S-1. Peripheral blood samples of patients were prospectively collected at baseline, after treatment initiation accompanied by computed tomography scan and disease progression. Mutational profiles from ctDNA were analyzed to evaluate its association with chemotherapeutic response.
Results:
Tumor protein 53 (TP53) was the most frequently altered gene at baseline blood samples. Although baseline TP53 mutation was not related to therapeutic response, patients with TP53 mutation had worse progression-free survival (PFS) and overall survival (OS). Additionally, baseline ctDNA content fraction (CCF) was found to be significantly lower in responders than non-responders. Meanwhile, patients with high CCF had a trend of worse PFS and OS. Combining TP53 alteration and CCF, the prognosis of TP53-wt patients could be further stratified. Patients with CCF-low_TP53-wt had markedly longer survival than those with CCF-high_TP53-wt.
Conclusion:
Our study highlighted the significance of ctDNA in predicting potential clinical outcomes in gastric cancer patients during chemotherapy.
Trial registration:
ChiCTR-IIR-16009802 (Chinese Clinical Trial Registry).
Keywords
Introduction
Gastric cancer is the fourth cause of cancer death (7.7%) and remains the fifth commonly diagnosed cancer (5.6%). 1 In recent years, the mortality and morbidity rates of gastric carcinoma have decreased gradually in China. 2 Peritoneal carcinomatosis is the most frequent reason for distant metastasis and disease recurrence in gastric carcinoma. 3 In a population-based study from the south of the Netherlands, 14% of total gastric cancer patients had peritoneal carcinomatosis at diagnosis initiation, with a dismal median survival of only 4 months. 4
On the basis of the Chicago consensus on peritoneal surface malignancies in 2020, chemotherapy agents commonly prescribed in intraperitoneal delivery were cisplatin, mitomycin C, and paclitaxel (PTX). 5 A phase II study assessed the efficacy of patients with gastric cancer peritoneal metastasis (GCPM) treated with neoadjuvant intraperitoneal and systemic chemotherapy (NIPS) prospectively. The median survival time of 25 treatment-naïve patients with peritoneal cytology positive for carcinoma cells (CY1) or peritoneal metastasis (P1) was 16.7 months. 6 PHOENIX-GC study failed to demonstrate statistical superiority of intraperitoneal and intravenous PTX plus S-1 in patients with GCPM. However, the exploratory analyses indicated potential clinical benefits of intraperitoneal PTX for gastric carcinoma with a moderate amount of ascites. 7 A phase II trial suggested that biweekly regimen of intraperitoneal PTX in combination with intravenous oxaliplatin, fluorouracil, and leucovorin is safe, and the recommended dose of intraperitoneal PTX is 60 mg/m2 for gastric carcinoma with peritoneal metastasis. 8 In our previous study, we found that oxaliplatin plus S-1 with intraperitoneal PTX was effective in Chinese patients with GCPM, with prolonged survival by conversion operation. 9
The clinical utility of circulating tumor DNA (ctDNA) mainly focused on screening or early diagnosis, detection of residual disease after surgical resection or adjuvant treatment, 10 molecular profiling or prognostication, 11 evaluation of response to treatment, 12 and monitoring relapse.13,14 Researchers evaluated genomic alterations of 55 patients with gastroesophageal adenocarcinoma by next-generation sequencing (NGS) performed on ctDNA derived from blood. They found the most common alterations were tumor protein 53 (TP53) (50.9%), followed by PIK3CA (16.4%), ERBB2 (14.5%), and KRAS (14.5%). 15 Elimination of ctDNA before or after operation could function as a predictive biomarker of response to perioperative therapy in patients with stage IB-IVA operable gastric cancer. 16 Analysis of ctDNA identified FGFR2 amplification and concurrent MET amplification associated with FGFR inhibitor efficacy in FGFR2-amplified metastatic gastric cancer. 17 Our previous study revealed that KRAS molecular mutational burden at baseline and after 4 cycles of first-line therapy might aid in monitoring clinical efficacy in metastatic colorectal cancer (mCRC) patients. 18
The aim of this study was to investigate the prognostic value of mutational landscape of ctDNA for intraperitoneal and intravenous PTX plus S-1 therapy in patients with GCPM. TP53 mutation status and ctDNA content fraction (CCF) will be used to address the association between ctDNA alterations and therapeutic response.
Materials and methods
Study design
This prospective study was implemented in Ruijin Hospital. Thirty patients with gastric cancer peritoneal dissemination were enrolled from November 2017 to May 2021. Gastric adenocarcinoma was confirmed by histology. Peritoneal metastasis was confirmed by diagnostic imaging or laparoscopy. The amount of ascites was evaluated by computed tomography (CT) and categorized as none, small (within the pelvic cavity), or moderate (beyond the pelvic cavity) at enrollment. Peripheral blood samples of patients were collected at baseline, after NIPS therapy together with CT evaluation, and disease progression sequentially. Five variables at baseline were analyzed, including CCF, tumor mutational burden (TMB), mean variant allele frequency (mean VAF), maximum VAF, and copy number instability (CNI). Patients received intraperitoneal and intravenous PTX plus S-1 treatment (intraperitoneal PTX 20 mg/m2 and intravenous PTX 50 mg/m2 on days 1 and 8 plus oral S-1 80 mg/m2 per day on days 1 to 14) every three weeks. Intraperitoneal PTX was diluted in 500 ml of normal saline and administered through a port over 1 h, after intraperitoneal administration of 500 ml of normal saline. Clinical response was assessed by the investigators according to the Response Evaluation Criteria in Solid Tumors (RECIST version 1.1).
Diagnostic laparoscopy is going to be performed if patients have a clinical complete response or clinical partial response after conversion therapy based on radiological evaluation. Patients will receive the protocol regimen again within 3–4 weeks after conversion surgery. The time course of NIPS treatment was 1 year in total (perioperative treatment). Then, patients received intraperitoneal PTX plus S-1 therapy until disease progression, unacceptable toxicity, investigator decision, or patient withdrawal. After conversion treatment, patients with stable disease/complete or partial response but unresectable disease will continue intraperitoneal and intravenous PTX plus S-1 treatment. After conversion treatment, patients with clinical progressive disease (PD) would be excluded.
Targeted capture sequencing and genomic data analysis
For each sample, 10 ml of whole blood was collected and centrifuged at 4000 g for 15 min at 4°C to separate the plasma and cellular components. The separated plasma was then subjected to a second centrifugation at 120,000 RPM for 15 min at 4°C, after which the supernatant was collected, and the pellet was discarded. After centrifuging whole blood, plasma supernatant and peripheral blood mononuclear cell (PBMC) were used for further extractions. Plasma cell-free DNA (cfDNA) was isolated using MagMAX Cell-Free DNA Isolation (Thermo Fisher Scientific, Waltham, MA, US). PBMC was treated as normal control to filter germline mutations using TIANamp Blood DNA Kit (TIANGEN, Beijing, CN). DNA quality was evaluated by NanoDrop 2000 (Thermo Fisher Scientific, Waltham, MA, US). DNA concentration was measured using Qubit dsDNA HS Assay kit or Qubit dsDNA BR Assay kit (Life Technologies, Carlsbad, CA, US).
Building a DNA library required at least 10 ng cfDNA. Genomic DNA was sheared into 150–200 base-pair (bp) fragments and then was processed with KAPA Hyper Preparation Kit (Kapa Biosystems, Boston, MA, US) for library construction. A designed panel containing 543 cancer-related genes, covering 1.7 Mb of the genome (Genecast, Wuxi, Jiangsu, CN), was used for hybridization enrichment (Supplemental Table S1). The captured library was sequenced on Illumina Novaseq 6000 platform (San Diego, CA, US) for paired-end sequencing.
Somatic mutation calling
Raw data of FASTQ format was first subject to quality control using Trimmomatic (version 0.39). 19 Then processed data was mapped to the reference sequence data (hg 19) using Burrows-Wheeler Aligner (BWA-mem, version 0.7.17). 20 Reads realignment was performed on Genome Analysis Tool Kit (GATK, version 3.7).
Mutations were called through VarDict (version 1.5.1) 21 and FreeBayes (version 1.2.0). VarDict was used to detect single nucleotide variant (SNV) and FreeBayes was used for the calling of compound heterozygous mutations. After filtered germline mutations, final somatic mutations were annotated with Annotate Variation (ANNOVAR 22 and further filtered by Exome Aggregation Consortium (ExAC), Genome Aggregation Database (gnomAD), COSMIC, and The Single Nucleotide Polymorphism Database (dbSNP) The filtering criteria for somatic mutation calling were based on the following standards: support read ⩾5; frequency ⩾0.3%; nonsynonymous mutations in exonic and splicing regions; allele frequency ⩽0.2% in the database ExAC and gnomAD.
Measurement of CCF
CCF was calculated based on a maximum likelihood model as previously described. 18 This method was proven to have higher sensitivity and specificity than benchmarked tools, according to experimental data. We calculated the CCF value of each single nucleotide polymorphism (SNP) based on the VAF of tumor sample compared with blood cell sample and the copy number variant loss. These SNPs were filtered as informative SNPs, defined as depth ⩾50× in paired samples; exclude high polymorphism; no InDels in the upstream or downstream region of 50 bp; not in regions with copy number gain; germline SNPs with different VAFs in paired samples, or somatic SNPs with higher VAFs than background noise. Informative SNPs were clustered into several groups based on their VAFs, local copy numbers, and hypothetic genotypes. Each cluster represented a unique source of ctDNA. The CCF of each cluster was estimated using a global likelihood. The cluster with the highest CCF was regarded as the primary source from ctDNA, and this CCF was output as the final estimate.
TMB analysis and variant allele frequencies
For the TMB, somatic nonsynonymous substitutions and indels in targeted exonic and splicing regions were included in its estimation. Mutations like known driver mutations were excluded in TMB calculation. 23 TMB value was equal to the number of somatic nonsynonymous mutations per megabase. The max VAF value was equal to the maximum VAF of all somatic mutations in each sample. The mean VAF value was defined as the mean value of all mutations’ VAFs in each sample.
Copy number instability
The computation of the CNI score begins with a correction for GC content and target region length, employing tailored algorithms to ensure accuracy. Read counts are subsequently normalized as log2 ratios, facilitating comparison across different genomic regions. These ratios are converted into Z-scores through Gaussian transformations, benchmarked against a normal control group to contextualize variability. 24 Significant genomic aberrations are identified by isolating target regions with Z-scores that not only exceed the 95th percentile but also surpass twice the absolute standard deviation of the control group’s Z-scores. The sum of these Z-scores, from all target regions that meet the aforementioned criteria, constitutes the CNI score. This aggregate measure reflects the overall degree of genomic instability present within the sample, which is a vital indicator of tumorigenic processes and has potential prognostic and therapeutic implications.
Survival analysis
Univariate Cox regression analyses were carried out using survival (version 3.2.11) and survminer (version 0.4.9) packages in R. A multivariable Cox proportional hazards model was used to assess the association between clinical variables and survival outcomes by ezcox (version 1.0.2). The hazard ratio (HR) and 95% confidence interval (CI) were calculated to identify features associated with progression-free survival (PFS) and overall survival (OS).
Statistics
Comparisons between categorical variables were using Fisher’s exact test, while continuous variables were using Wilcoxon rank sum test. The best cutoff of CCF was determined through Youden index by pROC package. Survival analysis was assessed by Kaplan–Meier survival with Log-rank test. HRs were calculated by Cox proportional hazards model. A multivariable Cox proportional hazards model, implemented through the ezcox package (version 1.0.2), was employed to evaluate the relationship between clinical variables and survival outcomes, ensuring that all included variables satisfied the proportional hazards assumption. All analyses were performed on R program. p < 0.05 was considered statistically significant.
Study approval
The reporting of this study conforms to the REMARK statement (Supplemental File). This study was approved by the Ethics Committee of Ruijin Hospital, Shanghai Jiao Tong University School of Medicine, complied with the Declaration of Helsinki, and registered in Chinese Clinical Trial Registry (ChiCTR-IIR-16009802). Ethics Committee Reference Number is 2016(53). All patients signed the written informed consent for serial sample collection prior to enrollment.
Results
Patient collection, baseline characteristics
Between November 2017 and May 2021, 30 gastric cancer patients with peritoneal metastasis were included. Their blood samples were collected at baseline, ctDNA dynamics during NIPS therapy accompanied by CT imaging, and PD prospectively (Figure 1). Table 1 shows the clinical characteristics of enrolled patients. In brief, 6 (20.0%) patients were 65 years or older, and 12 (40.0%) patients were male. TP53 ctDNA mutations were detected in 5 patients (16.7%) at baseline and 1 patient (3.3%) during chemotherapy. Peritoneal cancer index (PCI) levels of 9 patients (30.0%) were 0–9 score, 4 patients (13.3%) were 10–19 score, 6 patients (20.0%) were 20–29 score, and 11 patients (36.7%) were 30–39 score at the first laparoscopic exploration. The included patients received intraperitoneal and intravenous PTX plus S-1 treatment. Conversion surgery was achieved in 12 of the 30 patients (40.0%).

Study schematic. Gastric cancer patients with peritoneal metastasis received intraperitoneal and intravenous PTX plus S-1 therapy (N = 30). Serial blood draws were collected for each patient at the time of study enrollment (baseline), after NIPS therapy accompanied by CT imaging, and disease progression. Mutational parameters (including CCF, TMB, mean VAF, max VAF, and CNI) were tested for their association with clinical outcomes and response to NIPS therapy.
Baseline characteristics of gastric cancer patients with peritoneal metastasis.

MUT, mutant; PCI, peritoneal cancer index; PD, progressive disease; PR, partial response; SD, stable disease; WT, wild-type; TP53, tumor protein 53.
Mutational profile in ctDNA from gastric cancer patients with peritoneal metastasis
Of the 30 patients, 19 (63.3%) had confirmed partial response (PR), 8 (26.7%) had confirmed stable disease (SD), and 3 (10.0%) had PD after NIPS therapy [Figure 2(a)]. In our study, 12 of 30 patients (P1, P3, P4, P6, P14, P17, P21, P23, P24, P25, P26, and P30) underwent conversion surgery. At the analysis cutoff date (31 July 2021), 18 of 30 patients (60.0%) were alive, and their treatments were ongoing, with a median follow-up of 14.38 months [Figure 2(a)].

Clinical course and SNV profile of 30 patients. (a) Swimming plot depicted duration of treatment, and RECIST version 1.1 status at CT scans (green circles = partial response, purple triangles = stable disease, red squares = PD). Time of censoring was shown (yellow triangles = treatment ongoing). Patients 2, 5, 8, 9, 10, 11, 13, 19, 20, 22, 27, and 28 died at the time of the data cutoff. Survival time was depicted as horizontal lines (blue = PFS, blue plus orange = OS). (b) The oncoprint diagrams of SNV profile at baseline of the 30 patients with GCPM. Middle panel: The matrix of mutations in a selection of frequently mutated genes. Each column represented one tumor sample, and each row represented one gene. Right panel: The frequency of listed driver genes. Bottom annotation showed patient ID. Response to NIPS treatment and surgery/non-surgery were also shown.
We analyzed the SNV and mutations of DNA isolated from 30 pretreatment blood samples. Figure 2(b) illustrates the molecular landscape of the detected high-frequency (>5%) alterations in the pretreatment peripheral blood samples. The most commonly altered genes were TP53 (17%), ARID1A (7%), EGFR (7%), KMT2D (7%), and RHOA (7%) [Figure 2(b)]. The ctDNA detection rate was 33.3% in 10 of the 30 patients at baseline (Patients 2, 3, 9, 12, 17, 20, 22, 23, 28, and 30).
Prognostic value of circulating TP53 status
Since TP53 was the most frequently altered gene at baseline, we analyzed the TP53 alterations in detail. By comparing the status of TP53 in the two subgroups, we found that baseline TP53 mutation was not associated with therapeutic response to NIPS treatment [Figure 3(a)]. In addition, we analyzed the association between survival and TP53 ctDNA mutations. Patients with TP53-wt had significantly longer PFS than those with TP53-mut (median PFS: 20.22 months in TP53-wt group, 7.63 months in TP53-mut group, HR = 0.148, 95% CI 0.036–0.603, p = 0.002; Figure 3(b)]. The median OS was 29.26 months in patients with TP53-wt, which was longer than 15.78 months in those with TP53-mut [HR = 0.085, 95% CI 0.013–0.544, p = 0.001; Figure 3(c)].
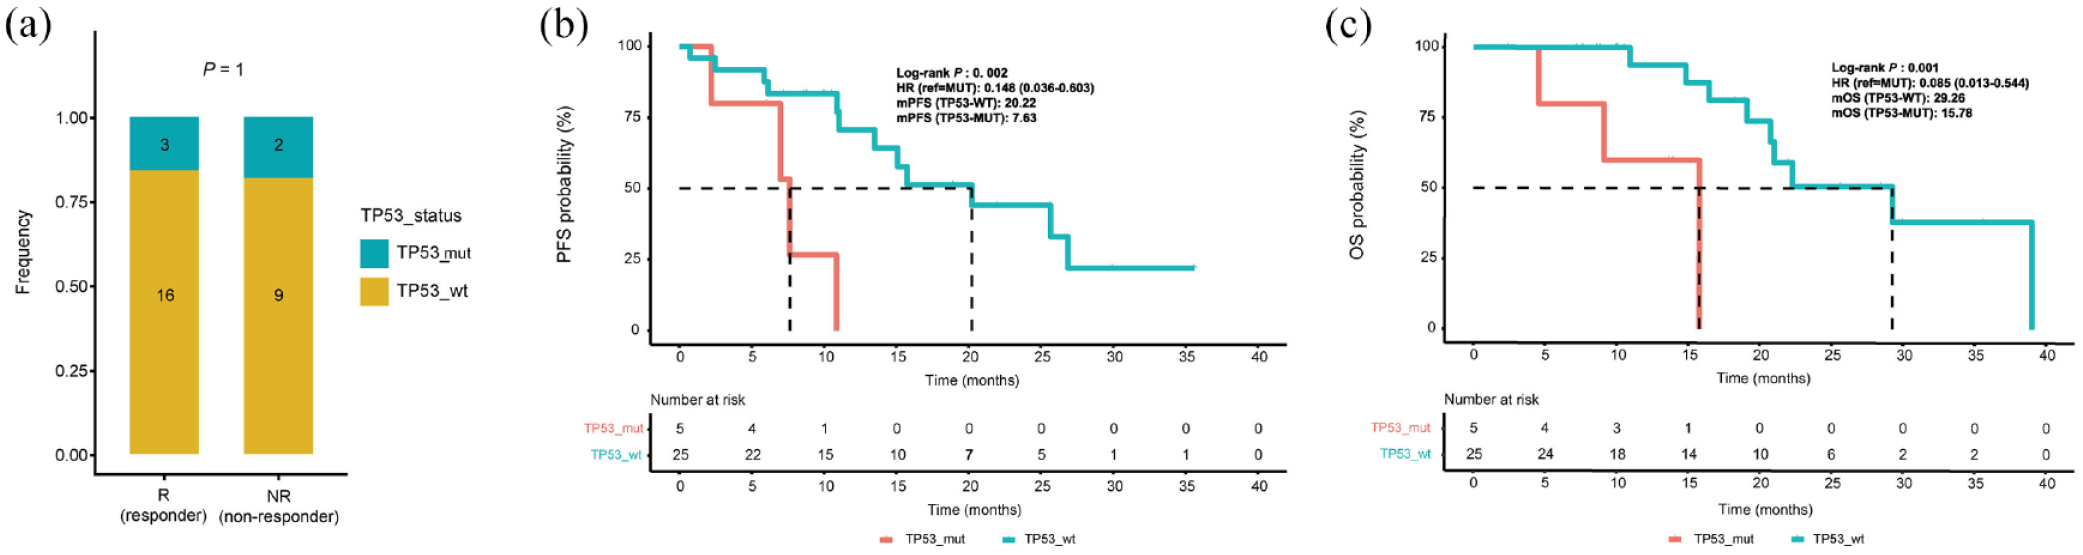
Prognostic value of circulating TP53 status. (a) The distribution of patients with R/NR in TP53-mut and TP53-wt subgroups. (b) PFS was longer in patients with TP53-wt than in patients with TP53-mut. (c) OS was longer in patients with TP53-wt than in patients with TP53-mut.
Five patients harbored TP53 mutation at baseline, among them only one patient receiving conversion surgery (p = 0.622; Supplemental Figure S1B). Accordingly, we analyzed the correlation between survival and TP53 status in non-surgery subgroup. Median PFS of patients with non-surgery and TP53-wt was 13.51 months, and HR was 0.38 (95% CI 0.063–2.285, p = 0.228, relative to non-surgery and TP53-mut group). Median PFS in surgery and TP53-wt subgroup was not reached (Supplemental Figure S1C). Median OS was longer for surgery group than for non-surgery group in both TP53-wt and TP53-mut subgroup. Median OS of patients with non-surgery and TP53-wt was 20.75 months, and HR was 0.244 (95% CI 0.027–2.085, p = 0.014, relative to non-surgery and TP53-mut group). The mOS of patients with surgery was not reached in both TP53-wt and TP53-mut subgroups. Only one patient harbored TP53 mutation, received conversion surgery, and was still alive at the last follow-up (Supplemental Figure S1D).
Prognostic value of CCF
To further explore the association between mutational parameters and clinical response, we analyzed the predictive value of CCF, TMB, mean VAF, maximum VAF, and CNI in GCPM patients who received NIPS therapy. We found that the level of TMB could not differentiate R from NR group (p = 0.56; Supplemental Figure S2A). Accordingly, the mean VAF (p = 0.57; Supplemental Figure S2B) or maximum VAF (p = 0.61; Supplemental Figure S2C) did not discriminate R versus NR group. Nevertheless, the changes in the CNI levels between R and NR patients at baseline did not attain statistical significance (p = 0.9; Supplemental Figure S2D).
The CCF was low-level in responders (R, defined as PR) group, and high-level in non-responders (NR, defined as SD/PD) group [p = 0.039; Figure 4(a)]. To assess the prognostic significance of CCF, we divided 30 patients into two subgroups (CCF-high versus CCF-low) according to the median value of CCF at initiation (0.033). We found that R patients were mainly in CCF-low subgroup, while NR cases were mainly in CCF-high subgroup [Figure 4(b)]. Furthermore, the median PFS in patients with CCF-low and CCF-high was 26.86 months and 13.51 months, respectively [HR = 0.398, 95% CI 0.139–1.136, p = 0.075; Figure 4(c)]. Patients with CCF-high tended to have inferior OS compared with patients with CCF-low [median OS: 20.75 months in CCF-high group, 39.02 months in CCF-low group, HR = 0.339, 95% CI 0.098–1.1678, p = 0.072; Figure 4(d)], but it did not reach statistical significance.

Association between pretreatment CCF levels and therapeutic response in 30 patients. (a) Relationship between CCF levels and therapeutic response (R versus NR). (b) The distribution of patients with R/NR in CCF-high and CCF-low subgroups. (c) PFS was longer in patients with low CCF than in patients with high CCF. (d) OS was longer in CCF-low group than CCF-high group.
We compared the changes in mutational parameters between surgery and non-surgery group at initiation. The CCF was low in surgery group, and high in non-surgery group (p = 0.0043; Supplemental Figure S1A). There were no differences in pretreatment TMB levels between the two groups (p = 0.74; Supplemental Figure S3A). Moreover, mean VAF levels did not discriminate between surgery and non-surgery groups at baseline (p = 0.86; Supplemental Figure S3B). Use of maximum VAF yielded similar relationships (p = 0.78; Supplemental Figure S3C). The pretreatment CNI levels were not significantly different in non-surgery group compared with surgery group (p = 0.98; Supplemental Figure S3D). These results indicated that changes in pretreatment CCF levels might distinguish GCPM patients between surgery and non-surgery groups. However, there was no statistically significant difference between the two groups except CCF levels.
Survival analysis of patients with GCPM based on TP53 mutational status combined with CCF levels
To further assess the prognostic value of the combination of TP53 and CCF, we divided 30 patients into two subgroups (CCF-high versus CCF-low) and investigated the association between TP53/CCF and survival. Box plot depicted the correlation between CCF levels and TP53 status [p = 0.44; Figure 5(a)]. The distribution of patients with CCF-high/low in TP53_wt and TP53_mut subgroups was displayed in Figure 5(b).

Association between TP53/CCF status and survival. (a) Relationship between CCF levels and TP53 mutational status (TP53-wt versus TP53-mut). (b) The distribution of patients with CCF-high/low in TP53_wt and TP53_mut subgroups. (c) Patients with high-CCF_TP53-wt had significantly shorter PFS than those with low-CCF_TP53-wt. (d) Patients with high-CCF_TP53-wt had distinctly shorter OS than those with low-CCF_TP53-wt.
The median PFS in patients with CCF-high_TP53-wt or CCF-low_TP53-wt was 13.51 months and 26.86 months, respectively [HR = 0.21, 95% CI 0.05–0.81, p = 0.024; Figure 5(c)]. Patients with CCF-low_TP53-wt had significantly longer OS than those with CCF-high_TP53-wt [median OS: 39.02 months in CCF-low_TP53-wt group, 20.75 months in CCF-high_TP53-wt group, HR = 0.19, 95% CI 0.03–0.95, p = 0.038; Figure 5(d)]. It indicated that CCF levels could significantly distinguish survival benefit of TP53-wt patients.
Prognostic value of CCF considering PCI
We investigated the correlation between PCI values and treatment efficacy as well as prognosis. Despite it did not attain statistical significance, discernible trends were observed in both therapeutic efficacy [Figure 6(a), Supplemental Figure S4A–C] and prognostic assessment. PCI levels were notably lower in R group compared to those in NR group [p = 0.17, Figure 6(a)]. We further classified PCI scores into PCI-high (PCI > 30) and PCI-low (PCI ⩽ 30) groups. Survival curves for PFS [Figure 6(b)] and OS [Figure 6(c)] indicated an inferior prognosis for the PCI-high group compared to the PCI-low group. There was no discernible correlation between PCI and CCF (R = 0.17, p = 0.36; Supplemental Figure S4D).

Prognostic value of CCF considering PCI. (a) Relationship between PCI scores and therapeutic response (R versus NR). (b) PFS was longer in patients with low PCI than patients with high PCI. (c) OS was longer in PCI-low group than PCI-high group. (d) and (e) In multivariable survival analyses including PCI, age, sex, and CCF, CCF was associated with PFS and OS in TP53_wt patients.
Lastly, we performed a multivariate analysis including PCI, age, sex, and CCF. Due to the significant outcomes of CCF identified within the TP53_wt subtype, our multivariate analysis was exclusively performed on a subset of 25 patients with TP53_wt. Our findings indicated the significance of CCF in the multivariate analysis for both PFS [Figure 6(d)] and OS [Figure 6(e)], while the impact of PCI on prognosis exhibited a diminished clarity.
Concordance between serial ctDNA profiling and measurable tumor burden
Thereafter, we selected three representative patients meeting the criteria that plasma samples of at least three time points (including pretreatment, after NIPS therapy accompanied by CT imaging, and PD). Genetic alterations in at least three different genes were detected during treatment. The divergent processes of these three typical patients exhibited the molecular evolution of mutation subclones [Figure 7(a), (d), and (g)]. As for P5, the VAF of PTEN, PTPRD, and RPTOR had a gradual increase (from T3 to T5), and disease progression was confirmed at T4 [Figure 7(b)]. The VAF of TP53 in P17 showed an increase from T3 to T4, and relapse was confirmed at T5 [Figure 7(e)]. As for P22, the VAF of TP53 had a slight increase (from T1 to T2), and disease progression was confirmed at T3 [Figure 7(h)]. We also displayed the CT imaging of these patients at three time points (baseline, best response, and PD). P5 and P22 obtained SD according to RECIST version 1.1 criteria after NIPS therapy [Figure 7(c) and (i)]. The RECIST version 1.1 score of P17 was PR [Figure 7(f)].

The dynamic alteration of mutations and evolution of ctDNA in three typical patients. (a) The fishbone diagrams of the genetic evolution of P5. (d) and (g) The fishbone diagrams of P17 and P22, respectively. Different colors represented different mutation subclones. (b), (e), and (h) The prevalence rates of detectable genes during treatment. (c), (f), and (i) CT scan changes of P5, P17, and P22, respectively, from baseline to PD. (c) P5, male, 69 years old at diagnosis, PCI score was 22 at the first laparoscopic exploration, RECIST version 1.1 evaluation was SD after NIPS therapy, non-conversion surgery group. (f) P17, female, 36 years old at diagnosis, RECIST version 1.1 evaluation was PR after NIPS therapy, conversion surgery group. (i) P22, female, 36 years old at diagnosis, PCI score was 33 at the first laparoscopic exploration, RECIST version 1.1 evaluation was SD after NIPS therapy, non-conversion surgery group.
Discussion
Our data depicts the prognostic significance of ctDNA in GCPM patients, detected by NGS during NIPS treatment. Our results indicated that TP53 mutations were identified in pretreatment ctDNA from 15.8% (3/19) of PR, 12.5% (1/8) of SD, and 33.3% (1/3) of PD group. Baseline CCF was lower in Rs than NRs. Furthermore, the combination of TP53-mut and non-surgery was associated with shorter survival compared with patients without any TP53 alterations. Patients with CCF-low_TP53-wt had markedly longer survival than those with CCF-high_TP53-wt.
Gastric cancer is a heterogeneous disease, in which advancements on the basis of ‘one-size-fits-all’ clinical trials yield only mild survival benefits. Genomic heterogeneity was regarded as a barrier to precision medicine in metastatic gastric cancer. Additionally, peritoneal dissemination, a hallmark of advanced gastric cancer, has no curative therapy, and its molecular features have not been examined extensively at present. Previous studies have revealed that baseline interpatient heterogeneity affected response to biomarker-selected therapies. 25 On the basis of spatial and temporal heterogeneity, we collected peripheral blood for ctDNA analysis at initiation and each CT evaluation until disease progression to analyze tumor evolution.
Owing to the biological complexity and intratumoral/intertumoral heterogeneity, tissue biopsy from a single site can hardly illustrate landscape and dynamics of advanced gastrointestinal cancer. In addition, the requirement for tissue sample hampers candidate enrollment, prolongs screening duration, and increases failure rate. Archived tumor tissues provide information for a single timepoint and fail to monitor molecular evolution, impairing biomarker-targeted agents selection. It was reported that liquid biopsy-based genotyping increased screening success rate, shortened screening duration, and accelerated study enrollment. 26 CtDNA has displayed its capability in the detection of genomic alterations at high accuracy and high concordance with tissue genotyping.
Due to limitations in obtaining patient-matched biopsy samples during disease course, tissue mutation calling was not explored in the present study. Although blood- and tissue-derived ctDNA results were sometimes discordant, blood-based ctDNA profiling might provide a repeated and non-invasive solution to meet the unmet need for dynamic molecular diagnosis. Nevertheless, ctDNA analysis has not yet complemented or replaced radiological evaluations in guiding multi-modality therapy nowadays. Blood TMB may reveal clinical benefits for patients with locally advanced or metastatic stage IIIB-IVB non-small cell lung cancer treated with first-line atezolizumab monotherapy. 27 Nevertheless, our results suggested that pretreatment mutational parameters, including TMB, mean VAF, maximum VAF, and CNI, cannot distinguish Rs from NRs, partially owing to the small sample size.
In a prospective cohort of breast cancer patients, higher estimated CCF was found in metastases compared with primary tumors, and CCF changes were more prominent in metastases with clinical subtype conversion. 28 Baseline CCF levels cannot distinguish PR/SD from PD patients with mCRC receiving oxaliplatin/irinotecan-based first-line therapy. 18 A previous study reported that either the absolute value of CCF or fold change of CCF can clearly discriminate PD from SD and objective response patients. 29 Interestingly, we found that Rs to NIPS therapy were mainly in CCF-low subgroup, while NRs were mostly in CCF-high subgroup. Furthermore, patients with CCF-low tended to receive conversion surgery and had longer survival than patients with CCF-high, indicating that CCF levels might serve as a tool to predict the therapeutic response. A prospective, population-based cohort study is warranted to validate the predictive efficacy of CCF in the future.
Additionally, TP53 is one of the most commonly mutated genes in cancer. TP53 mutations occur in ±50% and up to 70% of advanced gastric cancer and are regarded as an early event in tumorigenesis. 30 The mutation frequency of TP53 was slightly lower in our present study than previously reported. The mutation status of TP53 was determined by blood-based ctDNA NGS from longitudinal plasma samples, which may underestimate the prevalence and limit the sensitivity. The role of TP53 was explored in other types of cancer. In CONKO-001 trial, the benefit from adjuvant gemcitabine was confined to TP53-mut patients. TP53 mutations were considered as a negative prognostic factor in untreated patients and a positive predictive factor for gemcitabine efficacy in gemcitabine-treated patients. 31 It has also been reported that circulating TP53 mutations were related to unfavorable prognosis and early tumor progression in pancreatic cancer patients treated with FOLFIRINOX. 32 Postoperative ctDNA detection was associated with early recurrence of colorectal liver metastases after hepatectomy, and co-mutation of RAS and TP53 resulted in an increase in postoperative ctDNA positivity. 33 The main discovery of our study is that TP53-mut patients had poor survival compared with TP53-wt patients with GCPM and had a clear benefit from surgery. It should be noted that our discoveries are only hypothesis-generating and need to be validated in further study.
There are several limitations of our study. The small mutation-defined subgroup size limited the statistical significance of our exploratory analyses. Due to the accessibility of sequencing data and collection of clinical characteristics, only 30 patients were included in this study, which may cause potential selection bias. Secondly, we did not observe significant differences in pretreatment mutational parameters, including TMB, mean VAF, max VAF, and CNI between R versus NR/surgery versus non-surgery subgroups. Thirdly, it seems less clinically meaningful to develop predictive biomarkers to benefit from chemotherapy in the epoch of cancer immunotherapy. Oxaliplatin/PTX-based chemotherapy still plays a significant role in the first-line therapy for advanced gastric cancer. A phase II study assessing the efficacy and safety of immunotherapy plus chemotherapy is performing in our center. Last but not the least, the prevalence of TP53 mutations in our study was lower than in previous literature, which might be attributed to a lower sensitivity of blood-based NGS analysis.
To summarize, our work suggested that the genomic profiling of ctDNA is associated with clinical benefit to NIPS treatment in patients with GCPM. CCF plays an important role in guiding treatment response, and circulating TP53 mutation might monitor clinical efficacy and deserve further study. Our work also shed a light on the value of ctDNA in reflecting the response to NIPS therapy in patients with GCPM. The promising findings observed in our work deserve to be further explored in prospective studies.
Supplemental Material
sj-docx-1-tam-10.1177_17588359231225038 – Supplemental material for Analysis of circulating tumor DNA identifies distinct therapeutic response to intraperitoneal and intravenous paclitaxel plus S-1 in gastric cancer patients with peritoneal metastasis
Supplemental material, sj-docx-1-tam-10.1177_17588359231225038 for Analysis of circulating tumor DNA identifies distinct therapeutic response to intraperitoneal and intravenous paclitaxel plus S-1 in gastric cancer patients with peritoneal metastasis by Hong Yuan, Fei Xu, Shengzhou Wang, Di Liu, Huan Zhang, Jun Zhang, Min Shi, Chao Yan and Zhenggang Zhu in Therapeutic Advances in Medical Oncology
Supplemental Material
sj-docx-2-tam-10.1177_17588359231225038 – Supplemental material for Analysis of circulating tumor DNA identifies distinct therapeutic response to intraperitoneal and intravenous paclitaxel plus S-1 in gastric cancer patients with peritoneal metastasis
Supplemental material, sj-docx-2-tam-10.1177_17588359231225038 for Analysis of circulating tumor DNA identifies distinct therapeutic response to intraperitoneal and intravenous paclitaxel plus S-1 in gastric cancer patients with peritoneal metastasis by Hong Yuan, Fei Xu, Shengzhou Wang, Di Liu, Huan Zhang, Jun Zhang, Min Shi, Chao Yan and Zhenggang Zhu in Therapeutic Advances in Medical Oncology
Supplemental Material
sj-docx-3-tam-10.1177_17588359231225038 – Supplemental material for Analysis of circulating tumor DNA identifies distinct therapeutic response to intraperitoneal and intravenous paclitaxel plus S-1 in gastric cancer patients with peritoneal metastasis
Supplemental material, sj-docx-3-tam-10.1177_17588359231225038 for Analysis of circulating tumor DNA identifies distinct therapeutic response to intraperitoneal and intravenous paclitaxel plus S-1 in gastric cancer patients with peritoneal metastasis by Hong Yuan, Fei Xu, Shengzhou Wang, Di Liu, Huan Zhang, Jun Zhang, Min Shi, Chao Yan and Zhenggang Zhu in Therapeutic Advances in Medical Oncology
Supplemental Material
sj-jpg-5-tam-10.1177_17588359231225038 – Supplemental material for Analysis of circulating tumor DNA identifies distinct therapeutic response to intraperitoneal and intravenous paclitaxel plus S-1 in gastric cancer patients with peritoneal metastasis
Supplemental material, sj-jpg-5-tam-10.1177_17588359231225038 for Analysis of circulating tumor DNA identifies distinct therapeutic response to intraperitoneal and intravenous paclitaxel plus S-1 in gastric cancer patients with peritoneal metastasis by Hong Yuan, Fei Xu, Shengzhou Wang, Di Liu, Huan Zhang, Jun Zhang, Min Shi, Chao Yan and Zhenggang Zhu in Therapeutic Advances in Medical Oncology
Supplemental Material
sj-tif-4-tam-10.1177_17588359231225038 – Supplemental material for Analysis of circulating tumor DNA identifies distinct therapeutic response to intraperitoneal and intravenous paclitaxel plus S-1 in gastric cancer patients with peritoneal metastasis
Supplemental material, sj-tif-4-tam-10.1177_17588359231225038 for Analysis of circulating tumor DNA identifies distinct therapeutic response to intraperitoneal and intravenous paclitaxel plus S-1 in gastric cancer patients with peritoneal metastasis by Hong Yuan, Fei Xu, Shengzhou Wang, Di Liu, Huan Zhang, Jun Zhang, Min Shi, Chao Yan and Zhenggang Zhu in Therapeutic Advances in Medical Oncology
Supplemental Material
sj-tif-6-tam-10.1177_17588359231225038 – Supplemental material for Analysis of circulating tumor DNA identifies distinct therapeutic response to intraperitoneal and intravenous paclitaxel plus S-1 in gastric cancer patients with peritoneal metastasis
Supplemental material, sj-tif-6-tam-10.1177_17588359231225038 for Analysis of circulating tumor DNA identifies distinct therapeutic response to intraperitoneal and intravenous paclitaxel plus S-1 in gastric cancer patients with peritoneal metastasis by Hong Yuan, Fei Xu, Shengzhou Wang, Di Liu, Huan Zhang, Jun Zhang, Min Shi, Chao Yan and Zhenggang Zhu in Therapeutic Advances in Medical Oncology
Supplemental Material
sj-tif-7-tam-10.1177_17588359231225038 – Supplemental material for Analysis of circulating tumor DNA identifies distinct therapeutic response to intraperitoneal and intravenous paclitaxel plus S-1 in gastric cancer patients with peritoneal metastasis
Supplemental material, sj-tif-7-tam-10.1177_17588359231225038 for Analysis of circulating tumor DNA identifies distinct therapeutic response to intraperitoneal and intravenous paclitaxel plus S-1 in gastric cancer patients with peritoneal metastasis by Hong Yuan, Fei Xu, Shengzhou Wang, Di Liu, Huan Zhang, Jun Zhang, Min Shi, Chao Yan and Zhenggang Zhu in Therapeutic Advances in Medical Oncology
Footnotes
References
Supplementary Material
Please find the following supplemental material available below.
For Open Access articles published under a Creative Commons License, all supplemental material carries the same license as the article it is associated with.
For non-Open Access articles published, all supplemental material carries a non-exclusive license, and permission requests for re-use of supplemental material or any part of supplemental material shall be sent directly to the copyright owner as specified in the copyright notice associated with the article.