Histological subtypes of lung cancer are crucial for making treatment decisions. However, multi-subtype classifications including adenocarcinoma (AC), squamous cell carcinoma (SqCC) and small cell carcinoma (SCLC) were rare in the previous studies. This study aimed at identifying and screening potential serum biomarkers for the simultaneous classification of AC, SqCC and SCLC.
PATIENTS AND METHODS:
A total of 143 serum samples of AC, SqCC and SCLC were analyzed by HNMR and UPLC-MS/MS. The stepwise discriminant analysis (DA) and multilayer perceptron (MLP) were employed to screen the most efficient combinations of markers for classification.
RESULTS:
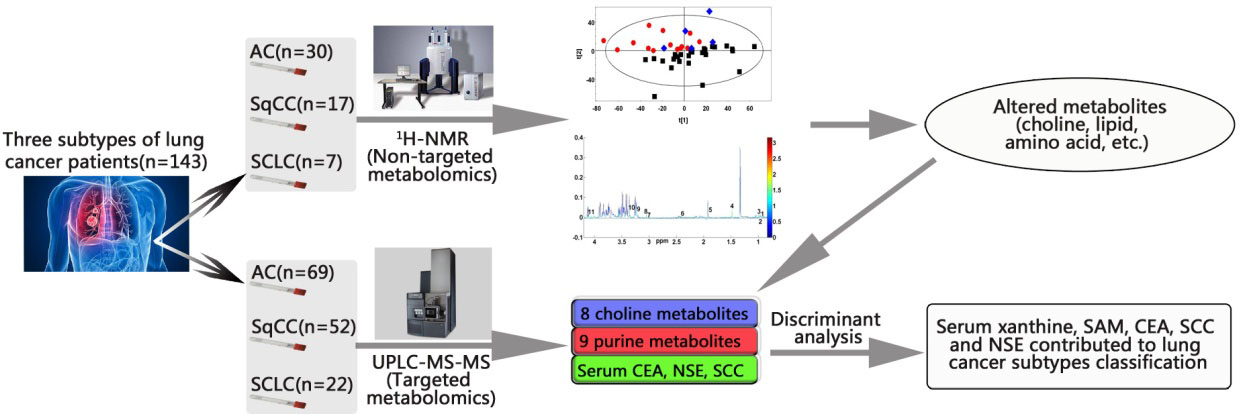
The results of non-targeted metabolomics analysis showed that the changes of metabolites of choline, lipid or amino acid might contribute to the classification of lung cancer subtypes. 17 metabolites in those pathways were further quantified by UPLC-MS/MS. DA screened out that serum xanthine, S-adenosyl methionine (SAM), carcinoembryonic antigen (CEA), neuron-specific enolase (NSE) and squamous cell carcinoma antigen (SCC) contributed significantly to the classification of AC, SqCC and SCLC. The average accuracy of 92.3% and the area under the receiver operating characteristic curve of 0.97 would be achieved by MLP model when a combination of those five variables as input parameters.
CONCLUSION:
Our findings suggested that metabolomics was helpful in screening potential serum markers for lung cancer classification. The MLP model established can be used for the simultaneous diagnosis of AC, SqCC and SCLC with high accuracy, which is worthy of further study.
Lung cancer is the most common malignant tumor in the world, with high mortality. In China, the death rate of lung cancer has surpassed all kinds of tumors such as gastric cancer and liver cancer, becoming the leading cause of malignant tumors-related death [1, 2, 3]. According to reports, lung cancer is closely related to smoking [4, 5]. Long-term exposure to polluted environment, malnutrition and genetic factors can all lead to the occurrence or progress of lung cancer [6, 7, 8, 9]. Lung cancer can be divided into two types of small cell lung cancer (SCLC) and non-small cell lung cancer (NSCLC)according to the degree of cell differentiation and morphological characteristics. NSCLC accounts for about 80% of the total number of lung cancer [10], with a high incidence, mainly including squamous cell carcinoma (SqCC) and adenocarcinoma (AC), which are characterized by the mutation of epidermal growth factor receptor (EGFR) [11, 12].
Early screening is the key to the prevention and treatment of lung cancer. At present, some non-invasive examinations, such as low-dose CT (LDCT), can reduce the mortality of lung cancer, but LDCT is difficult to detect all early lung cancer, and cannot distinguish the subtypes of lung cancer, and its false positive results may lead to overdiagnosis, unnecessary intervention and excessive anxiety, which may result in potential harm to patients [13, 14]. NSCLC, as the main type of lung cancer, is usually heterogeneous [15], showing more malignant characteristics. It is usually diagnosed as advanced lung cancer, and the patients have a lower 5-year survival [16, 17]. The classification of lung cancer subtypes can contribute to determine better treatment and therapy strategies. However, in routine clinical practice, biopsy or lung tissues after surgeries were generally employed to analyze the histological subtypes of the tumor, which are limited by the risk and possibility of delayed diagnosis [18]. To date, the studies on classifying multi-subtype lung cancers based on serum biomarkers are very rare, which has more clinical value than the two-subtype classification studies.
Metabolomics is a comprehensive and systematic study describing all small molecular metabolites in biological samples, such as blood, urine and saliva. Metabolic phenotypic differences in different disease states can be distinguished by metabolomics studies, the detection techniques of which are represented by high resolution nuclear magnetic resonance (H-NMR) and mass spectrometry (MS). Xiaoli Zhang et al. [19] applied untargeted H-NMR and targeted serum metabolic profiling strategy based on rapid resolution liquid chromatography to identify 25 differential metabolites between lung cancer patients and the control group. The metabolic pathway includes glycolysis, lipid metabolism, cholinephosphatide metabolism, one-carbon metabolism and amino acid metabolism. Belén Callejón-Leblic et al. [20] studied bronchoalveolar lavage fluid of lung cancer patients with MS-based metabolomics method, and found that choline, adenine, carnitine, phosphoric acid and glycerin are potential biomarkers for lung cancer diagnosis, with the value of the area under the receiver operating characteristic curve (AUC) higher than 0.75. Rocha et al. [21] found that compared with healthy controls, the levels of plasma lactate and pyruvic acid were increased, and the levels of methanol, glucose, citric acid, formic acid, acetic acid and several kinds of amino acid (alanine, glutamine, histidine, tyrosine and valine) were reduced in lung cancer patients. H-NMR has been used to classify lung cancer tissues (19 cases of AC and 19 cases of SqCC) [22]. However, there is no report on identify potential serum biomarkers classify AC, SqCC, SCLC by metabolomics technology.
In this work, the serum of 30 patients with AC, 17 patients with SqCC and 7 patients with SCLC were firstly analyzed by H-NMR. On this basis, the clinical sample size was expanded and some metabolites were further quantified by UPLC-MS/MS. Integrating serum levels of the carcinoembryonic antigen (CEA), neuron – specific enolase (NSE), squamous cell carcinoma antigen (SCC) and quantitative metabolites as variables, The stepwise discriminant analysis (DA) was employed to screen the best combination of markers for the diagnosis of AC, SqCC, SCLC. A multi-layer perception (MLP) predictive model was also established for classification.
Clinical indicators of serum samples for H-NMR based metabolomics study
AC
SqCC
SCLC
Number
30
17
7
Sex (males/females)
22/8
16/1
5/2
Age (years)
69.47 1.82
65.24 1.55
71.86 1.92
History of smoking (yes/no)
18/12
14/3
3/4
25.00 3.93
28.24 3.76
43.33 3.33
CEA
4.59 0.65
4.41 0.79
3.01 0.70
NSE
22.54 2.32
23.02 2.94
31.56 8.56
SCC
1.50 0.12
4.32 0.85
1.15 0.10
CYFRA21-1
29.89 16.57
17.47 7.24
5.37 1.09
ALT (u/L)
18.47 2.03
19.00 2.12
22.57 6.08
AST (u/L)
23.60 1.68
21.59 1.29
23.57 3.53
STB (umol/L)
13.03 1.38
10.96 1.23
13.31 2.84
ALP (u/L)
141.23 20.99
105.35 8.75
109.29 8.07
UREA (mmol/L)
5.94 0.52
6.01 0.87
4.89 0.52
CRE (mmol/L)
84.33 3.90
94.59 5.95
74.43 4.78
UA (mmol/L)
316.80 21.45
294.00 25.70
211.71 23.59
Primary tumor
T1
6(0.2)
1(0.06)
0(0.0)
T2
9(0.3)
10(0.59)
3(0.43)
T3
5(0.17)
2(0.11)
1(0.14)
T4
10(0.33)
4(0.24)
3(0.43)
Regional lymph node
N0
5(0.17)
2(0.12)
0(0.0)
N1
0(0.0)
2(0.12)
0(0.0)
N2
25(0.83)
13(0.76)
7(1.0)
N3
0(0.0)
0(0.0)
0(0.0)
Metastasis
M0
9(0.3)
11(0.65)
3(0.43)
M1
21(0.7)
6(0.35)
4(0.57)
AC, adenocarcinoma. SqCC, squamous-cell carcinoma. CEA,carcinoembryonic antigen. NSE, neuron-specific enolase. SCC, squamous cell carcinoma antigen. ALT, glutamate pyruvic transaminase. AST, aspartate aminotransferase. STB, serum total bilirubin.ALP alkaline phosphatase. UREA, carbamide. CRE, cretinine. UA,uric acid. Indicates statistical difference between AC and SqCC. Indicates statistical difference between AC and SCLC. Indicates statistical difference between SqCC and SCLC. : Mean SE. : Number (percentage) of patients.
Materials and methods
Chemicals
3-trimethylsilyl-propionic acid (TSP) were purchased from Merck (Darmstadt, Germany). NaHPO 2HO and KHPO3HO were purchased from Tianjin Weiyi Chemical Technology Co., Ltd (Tianjin, China). The following compounds were purchased from Sigma-Aldrich: formic acid of MS grade, betaine, choline chloride, tubercidin, guanine, guanosine, inosine, creatinine, carnitine, SAM, dimethylglycine, acetyl carnitine. And ACH, cystathionine, adenine, adenosine, hypoxanthine, xanthine, xanthosine and uric acid of analytical grade were purchased from Aladdin Reagent Co (Shanghai, China).
Clinical sample collection
The serum samples were collected from the inpatients in First Affiliated Hospital of Nanchang University and the First People’s Hospital of Jingdezhen and validated by clinicians and histopathologists according to the diagnostic criteria of lung cancer. Demographic, clinical, pathologic, and blood biochemical data of samples used in H-NMR experiment were extracted from electronic medical records and are shown in Table 1. This study was carried out with the approval of the Ethics Committee of the First Affiliated Hospital of Nanchang University. The experimental flowchart of this study is shown in Fig. 1.
Experimental flowchart for screening diagnostic biomarkers for simultaneously classifying lung adenocarcinoma, squamous cell carcinoma and small cell carcinoma.
Pretreatment of serum samples for H-NMR analysis
The serum samples of 30 cases of AC, 17 cases of SqCC and 7 cases of SCLC were thawed at room temperature and centrifuged at 8000 rpm for 5 min. 150 L of supernatant was added to 800.0 L of methanol, mixed by vigorous vortexing, and then centrifuged at 14 000 g for 10 min. A 800.0 L of supernatant was concentrated by SpeedVac system at 35C. The residue was redissolved in 450.0 L of distilled water, 50.0 L of phosphate buffer solution (pH 7.4), and 50.0 L of TSP (0.5 mg/ml). After centrifugation with 12000 rpm for 10 min, 500 l supernatant was transferred to the 5 mm NMR tube and stored at 4C for analysis. H-NMR data of samples were collected on Bruker Avance II-600 MHz spectrometer (Germany), and the methods were consistent with those reported in literatures [23, 24].
Metabolomics analysis by H-NMR
After adjusting the H-NMR spectrum for zero, baseline and symmetrical calibration, the signal in the range of 0-10ppm was selected to export the original data. For eliminating the influence of peaks of water and methanol, the data of 3.36 to 3.37 and 4.5 to 5.5 ppm region were deleted. The multivariate statistical analysis was carried out by SIMCA-P (version 14.1, Umetric, Umea, Sweden). Differential metabolites contributing to classification were screened out by variable importance (VIP) values of PLS-DA and independent sample T test (SPSS 19.0, SPSS Inc., Chicago, IL, USA).
Quantification of metabolites in choline and purine pathways by UPLC-MS/MS
Serum samples including 69 cases of AC, 52 cases of SqCC, 22 cases of SCLC were thawed at room temperature. To quantify serum contents of choline, betaine, carnitine, S-adenosyl methionine (SAM), dimethylglycine, acetyl carnitine, acetylcholine, cystathionine. 50 l serum samples were homogeneously mixed with 30 L isotope-labeled choline (choline-D-13 as internal standard), 30 L 80% acetonitrile and 340 L acetonitrile. After centrifugation with 12000 rpm for 5 min, 200 L of supernatant was collected for further UPLC-MS/MS analysis as described in previous study [24]. In addition, serum levels of purine metabolites such as xanthine, xanthosine, guanosine, adenine, adenosine, guanine, uric acid, hypoxanthine, inosine were also determined by the validated method reported in another study [25].
Screening serum potential markers for AC, SqCC and SCLC classification by DA
Three serum biomarkers of lung cancer (CEA, NSE, SCC) combined with UPLC-MS/MS quantitative data of 17 metabolites mentioned above were used as variables for DA. In this study, patients with AC, SqCC and SCLC were set as 1, 2 and 3, respectively. DA was adopted for Wilks’ lambda method. The standard of partial F test value for entered variable was 3.84, and the standard of that for delete variable was 2.71. According to the contribution value of each variable in the function, the discriminant function was established. The reliability and validity of the function were evaluated by misjudgment rate and cross-validation, and the diagnostic value of the screening model was further evaluated by ROC analysis.
Classification of AC, SqCC and SCLC based on MLP
The classification of AC, SqCC and SCLC patients was set as 1, 2, and 3, respectively, and the serum contents of xanthine, SAM, CEA, SCC and NSE were taken as variables. After data normalization, all samples were used as training samples. The scaled conjugate gradient algorithm was used to train the model and established the neural network model. The predictive classifications of samples were further evaluated by ROC analysis. SPSS 19.0 software for Windows (SPSS, Chicago, IL, USA) was used to carry out DA, MLP and ROC analysis.
Information of significant metabolites for classification observed by H-NMR in serum
Metabolites
H
Vip
Integral interval
Relative levels in serum (mean S.E.)
AC ( 30)
SqCC ( 17)
SCLC ( 7)
1
Lipid
0.89 (m)
1.64
0.857–0.906
12.28 1.40
8.51 0.97
29.67 11.24
2
Leucine
0.95 (t)
2.077
0.950–0.980
72.49 4.72
70.35 5.02
90.11 19.02
3
Valine
0.98 (d)
1.64
0.983–1.000
31.53 1.69
40.51 4.40
51.44 8.44
4
Alanine
1.48 (d)
1.71
1.470–1.494
120.45 4.90
136.61 12.00
660.76 278.83
5
Acetate
1.92 (s)
1.03
1.920–1.929
108.16 9.59
172.67 37.07
593.96 292.50
6
Succinic acid
2.41 (s)
1.09
2.404–2.412
22.78 2.31
28.50 4.41
52.58 19.81
7
Creatine
3.0 (s)
1.86
3.036–3.042
11.70 1.53
12.63 2.13
29.24 8.94
8
Creatinine
3.03 (s)
1.417
3.030–3.051
11.85 1.29
11.91 0.69
10.03 2.32
9
Choline
3.20 (s)
1.34
3.202–3.210
15.87 1.01
20.07 2.05
38.31 10.50
10
Betaine
3.23 (s)
1.419
3.259–3.274
201.88 11.16
225.68 18.72
310.94 66.32
11
Lactate
4.11 (q)
1.69
4.100–4.142
202.54 9.71
329.03 59.04
316.33 79.42
12
Hypoxanthine
8.18 (d)
1.54
8.110–8.130
35.51 3.25
42.36 7.31
37.41 9.42
13
Formate
8.45 (s)
1.47
8.456–8.461
10.57 0.91
17.15 2.97
15.21 1.56
*Indicates statistical difference between AC and SqCC (independent sample -test, 0.05).
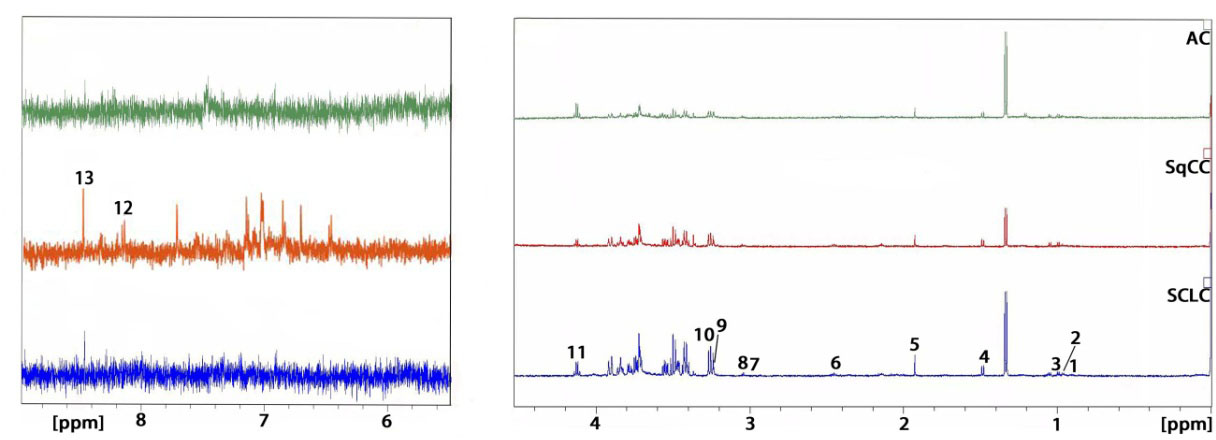
The typical H-NMR spectra of serum in AC, SqCC and SCLC group. 1, Lipid; 2, Leucine; 3, Valine; 4, Alanine; 5, Acetate; 6, Succinic acid; 7, Creatine; 8, Creatinine; 9, Choline; 10, Betaine; 11, Lactate; 12, Hypoxanthine; 13, Formate.
Results
PCA and PLS-DA analysis based on H-NMR data
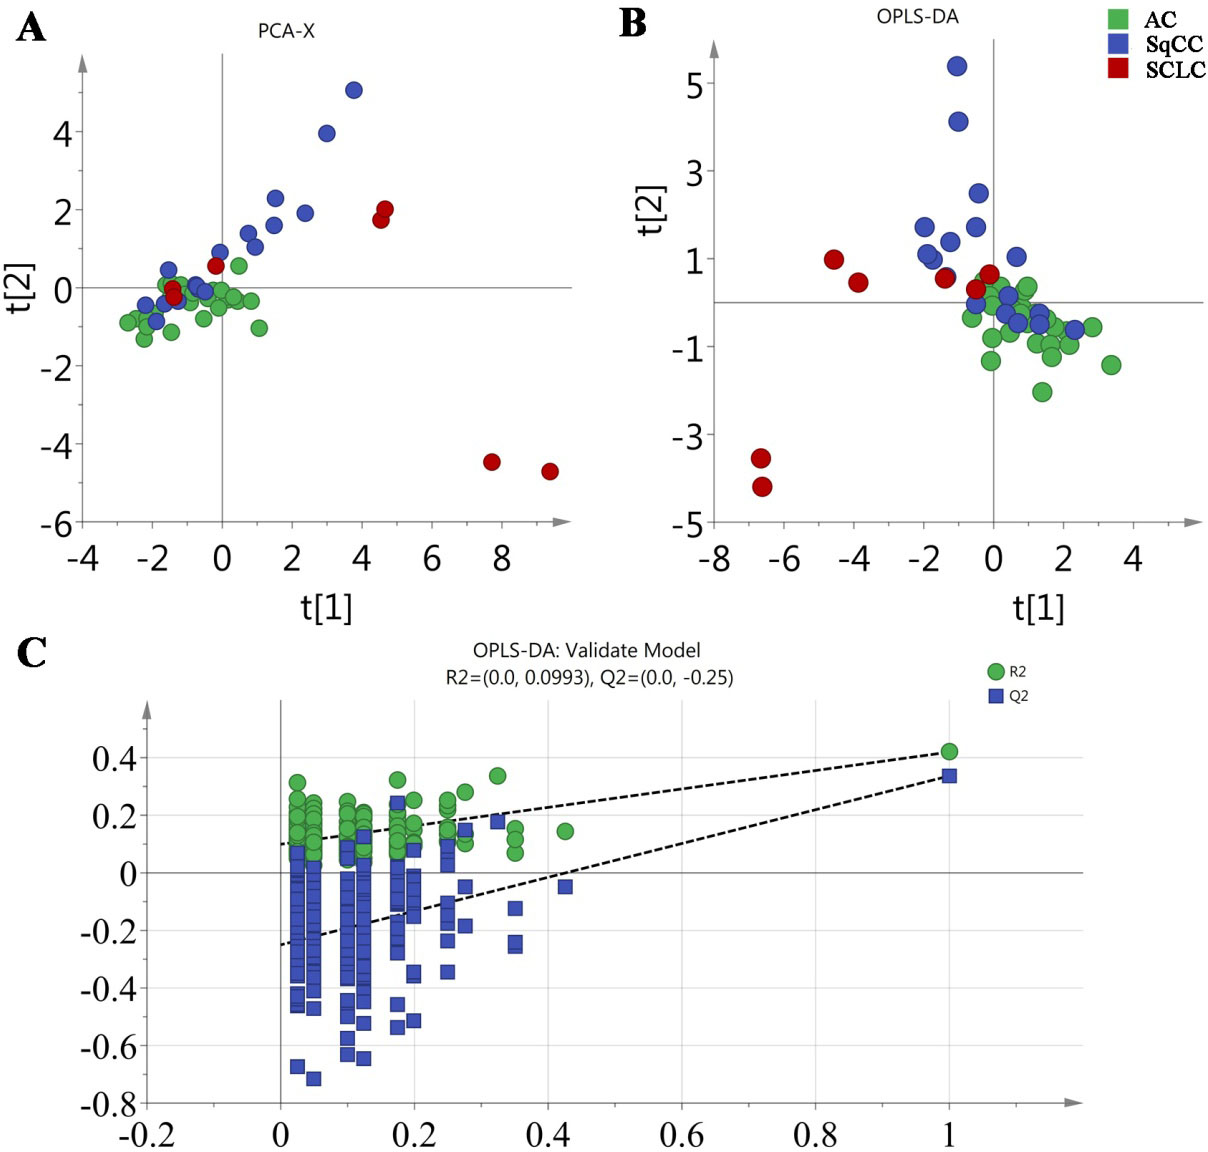
The H-NMR spectra of serum samples were obtained by NMR as shown in Fig. 2. The alterations of peak heights of some metabolites in the H-NMR spectrum were observed, indicating that the concentrations of endogenous metabolites have been changed in different subtypes of lung cancer. From the scores of PCA (Fig. 3A), AC ( 30), SqCC ( 17) and SCLC ( 7) are close to each other, with partial overlap. OPLS-DA analysis combining the data dimension reduction with discriminant analysis could more effectively detect differences between groups and differential metabolites [26, 27]. The OPLS-DA score was shown in Fig. 3B, with the three parameters (RX 0.716, RY 0.391, 0.31), AC and SqCC had a good distinction. The cross validation (CV) tests with 200 permutations were carried out to verify whether the OPLS-DA model is over-fitting, and the results were obtained as shown in Fig. 3C. The value of CV-ANOVA for the model is 0.0015, and the intercept of intercept is 0.25, indicating that the model is not over-fitted and the model is effective [28].
Results of PCA,OPLS-DA generated by data from H NMR spectroscopy and permutation test plots (200 permutations) of the OPLS-DA model. (A) PCA scores plot the variables were scaled by unit variance (UV); (B) OPLS-DA score plot; (C) Permutation test plots (200 permutations) of the OPLS-DA model.
Clinical indicators of serum samples which were employed to UPLC-MS/MS analysis
AC
SqCC
SCLC
Number
69
52
22
Sex (males/females)
42/27
47/5
18/4
Age (years)
67.26 1.151
64.10 1.006
65.00 2.310
History of smoking (yes/no)
38/31
45/7
17/5
38.71 1.953
35.91 1.499
38.82 2.080
CEA
9.23 0.810
3.25 0.230
2.22 0.150
NSE
18.60 0.760
18.78 1.020
50.39 7.150
SCC
1.46 0.060
4.32 0.420
1.50 0.160
CYFRA21-1
20.71 7.479
20.40 4.245
4.55 0.453
ALT (u/L)
17.97 1.315
19.35 2.101
19.59 2.222
AST (u/L)
23.13 1.033
22.87 1.594
22.00 1.650
STB (umol/L)
11.53 0.726
9.91 0.538
13.46 1.218
ALP (u/L)
125.71 11.617
108.37 5.614
108.95 6.127
UREA (mmol/L)
5.51 0.268
5.49 0.384
4.91 0.365
CRE (mmol/L)
80.56 2.614
85.11 3.734
80.64 4.083
UA (mmol/L)
295.59 11.582
321.35 13.832
276.32 26.232
Primary tumor
T1
14(0.2)
4(0.08)
1(0.05)
T2
23(0.33)
23(0.44)
10(0.45)
T3
16(0.23)
9(0.17)
4(0.18)
T4
16(0.23)
16(0.31)
7(0.32)
Regional lymph node
N0
15(0.22)
12(0.23)
0(0.0)
N1
3(0.04)
6(0.12)
0(0.0)
N2
51(0.74)
34(0.65)
19(0.86)
N3
0(0.0)
0(0.0)
3(0.14)
Metastasis
M0
32(0.46)
41(0.79)
10(0.45)
M1
37(0.54)
11(0.21)
12(0.55)
AC, adenocarcinoma. SqCC, squamous-cell carcinoma. CEA, carcinoembryonic antigen. NSE, neuron-specific enolase. SCC, squamous cell carcinoma antigen. ALT, glutamate pyruvic transaminase. AST, aspartate aminotransferase. STB, serum total bilirubin. ALP alkaline phosphatase. UREA, carbamide. CRE, cretinine. UA,uric acid. *Indicates statistical difference between AC and SqCC. Indicates statistical difference between AC and SCLC. indicates statistical difference between SqCC and SCLC. a: Mean SE. b: Number (percentage) of patients.
Differential metabolites and metabolic pathways of subtypes of lung cancer based on H-NMR data
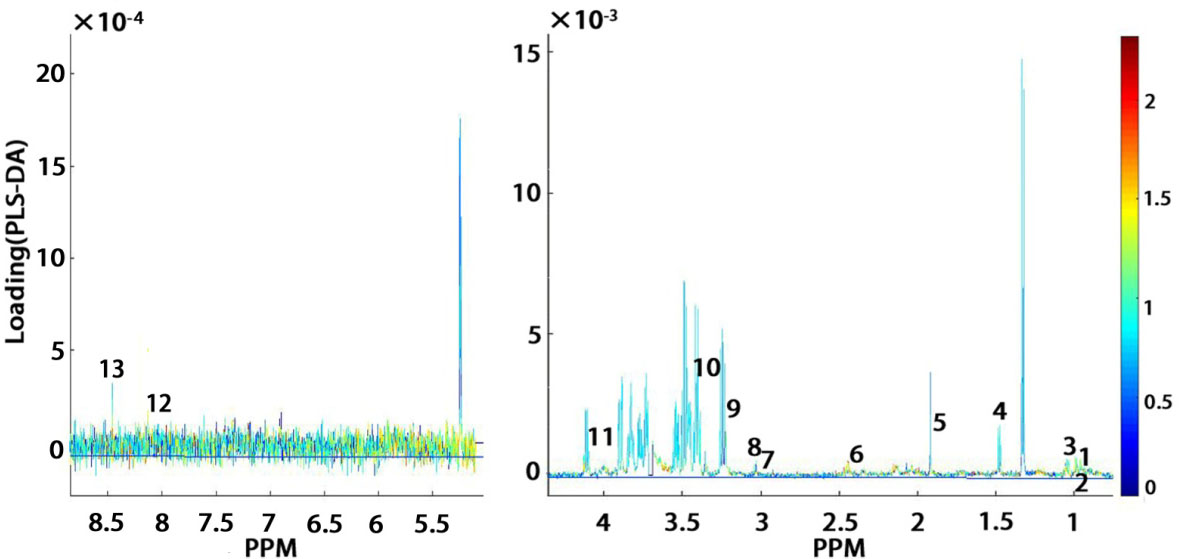
The bivariate plot combining variable importance in the projection (VIP) value and loadings based on OPLS-DA model was shown in Fig. 4. In this plot, VIP of metabolites was coded by color. The darker the color, the greater its importance. The bigger the VIP value of the weight coefficient is, the greater the contribution to the model is [29]. By this method, the metabolites that play an important role in classification were screened out. It is generally believed that VIP value greater than 1.0 plays a certain role in cluster analysis [30]. Meanwhile, the peak area of identified metabolites was integrated. After independent sample T test, the H-NMR data of metabolites in each group were shown in Table 2. Compared with AC, the levels of lipid, choline and formate in the serum of SqCC patients varied greatly. Therefore, we speculate that the change of choline and lipid metabolites may contribute to the classification of lung cancer subtypes.
VIP-coded loadings plot based on OPLS-DA. The color scales (VIP values) show variable importance in the OPLS-DA projection generated by the serum H-NMR data. 1, Lipid; 2, Leucine; 3, Valine; 4, Alanine; 5, Acetate; 6, Succinic acid; 7, Creatine; 8, Creatinine; 9, Choline; 10, Betaine; 11, Lactate; 12, Hypoxanthine; 13, Formate.
Quantification of metabolites in choline and purine pathways by UPLC-MS/MS
The results of H-NMR analysis showed that lipid and choline play a role in the classification of subtypes of lung cancer. In fact, choline is very important for the transport and metabolism of lipid and cholesterol [31]. Studies have shown that both choline and purine metabolism are related to methylation pathway in vivo [32, 33, 34]. However, due to the low sensitivity of H-NMR and the overlap of choline, acetylcholine and betaine in the 3.2 ppm region, it is difficult to accurately quantify these metabolites in serum.
Here, 17 metabolites in choline and purine metabolic pathways were further quantitatively analyzed in serum samples of 69 AC, 52 SqCC and 22 SCLC by the validated UPLC-MS/MS method [24, 25]. The clinical characteristics of these patients are summarized in Table 3. The age of the patients was ranged from 50 to 80 years old and the incidence of male was generally higher than the female. Most of SqCC patients had over a decade of smoking history. The serum levels of CEA, NSE, SCC, and 17 metabolites quantified by UPLC-MS/MS were shown in Table 4. There were significant differences between AC and SqCC in serum levels of SAM, CEA, SCC, xanthine, xanthine nucleoside, and guanosine. Serum levels of SAM, CEA and NSE also showed significant differences in AC and SCLC. And serum levels of xanthine, xanthine nucleoside, guanosine, inosine, CEA, NSE and SCC had significant differences between SqCC and SCLC.
The serum levels of some metabolites quantified by UPLC-MS/MS
Metabolites
Ion transition (m/z)
Retention time (min)
Contents in serum (ng/mlmean S.E.)
AC ( 69)
SqCC ( 52)
SCLC ( 22)
1
Xanthine
153.06 110.05
1.94
1.00 0.07
0.92 0.06
0.53 0.06
2
Xanthosine
285.04 152.03
2.46
1.70 0.16
1.99 0.22
1.27 0.14
3
Guanosine
284.04 152.04
2.48
2.09 0.17
2.55 0.27
1.55 0.13
4
Adenine
136.05 119.03
1.58
5.69 0.29
5.47 0.30
5.26 0.37
5
Adenosine
268.04 136.04
2.04
0.11 0.00
0.12 0.00
0.11 0.01
6
Guanine
152.06 135.05
1.93
0.43 0.02
0.47 0.02
0.49 0.04
7
Uric acid
169.03 141.03
2.83
8331.97 609.40
7441.01 532.69
9254.31 1003.41
8
Hypoxanthine
137.05 110.05
1.60
76.67 3.41
75.07 2.98
76.38 5.20
9
Inosine
269.05 136.02
2.06
0.17 0.00
0.18 0.01
0.16 0.01
10
Choline
104.04 60.08
4.58
241.40 16.15
243.09 20.99
208.94 24.00
11
Betaine
118.14 59.06
4.15
357.73 7.56
362.96 10.55
367.88 15.66
12
Creatinine
114.05 44.02
2.40
872.07 10.81
856.11 11.63
829.27 21.09
13
S-adenosyl methionine
399.14 250.11
5.58
12.51 1.03
7.04 0.50
7.87 0.66
14
Dimethylglycine
104.1 58.07
4.56
195.30 7.94
204.22 10.36
178.48 13.87
15
Acetyl carnitine
204.1 85.05
4.30
132.28 7.85
111.44 7.34
118.22 12.22
16
Acetylcholine
146.05 87.01
4.34
9.84 0.21
9.68 0.23
9.81 0.43
17
Cystathionine
223.05 114.06
2.36
316.75 7.29
307.42 7.79
287.94 13.50
18
CEA
–
–
9.23 0.81
3.25 0.23
2.22 0.15
19
NSE
–
–
18.60 0.76
18.78 1.02
50.39 7.15
20
SCC
–
–
1.46 0.06
4.32 0.42
1.50 0.16
: indicates statistical difference between AC and SqCC. : indicates statistical difference between AC and SCLC. : indicates statistical difference between SqCC and SCLC.
The results of Wilks’ Lambda for validation in discriminant analysis
Input
Wilks’ Lambda
Statistics
Degree of freedom 1
Degree of freedom 2
Degree of freedom 3
Accurate F
Statistics
Degree of freedom 1
Degree of freedom 2
Significant
NSE
0.608
1
2
140.000
45.158
2
140.000
0.000
SCC
0.398
2
2
140.000
40.648
4
278.000
0.000
CEA
0.295
3
2
140.000
38.710
6
276.000
0.000
SAM
0.275
4
2
140.000
31.115
8
274.000
0.000
Xanthine
0.257
5
2
140.000
26.423
10
272.000
0.000
Screening variables for classification of AC, SqCC and SCLC by DA
Considering the small sample size of SCLC in this study and the fact that serum levels of some metabolite did not obey normal distribution, a discriminant model based on Fisher criterion was established. Data of the 20 variables of 143 samples were put into SPSS 19.0 software to establish step-by-step discriminant function. The results showed that xanthine, SAM, CEA, SCC and NSE had significant contribution to classification (Table 5). The linear classification function as follows:
X, X, X, X and X represent the serum levels of xanthine, SAM, CEA, NSE and SCC, respectively. The discriminant function was valid (sig 0.000) to be tested by Wilks’ Lambda. The classification accuracies of AC, SqCC and SCLC predicted by the DA model was 95.7%, 76.9% and 68.2%, respectively, with an average accuracy of 84.6%. The AUROC of AC, SqCC and SCLC classification was 0.904, 0.693 and 0.932, respectively.
In addition, we adopted the cross-validation method to verify the predictive effect of the model. The results showed that the model could correctly classify 82.5% of the cross-validation grouping cases, and the false prediction rates of AC, SqCC and SCLC were 5.9%, 26.9% and 31.8%, respectively, indicating that the model was accurate and reliable.
Classification of AC, SqCC and SCLC by MLP
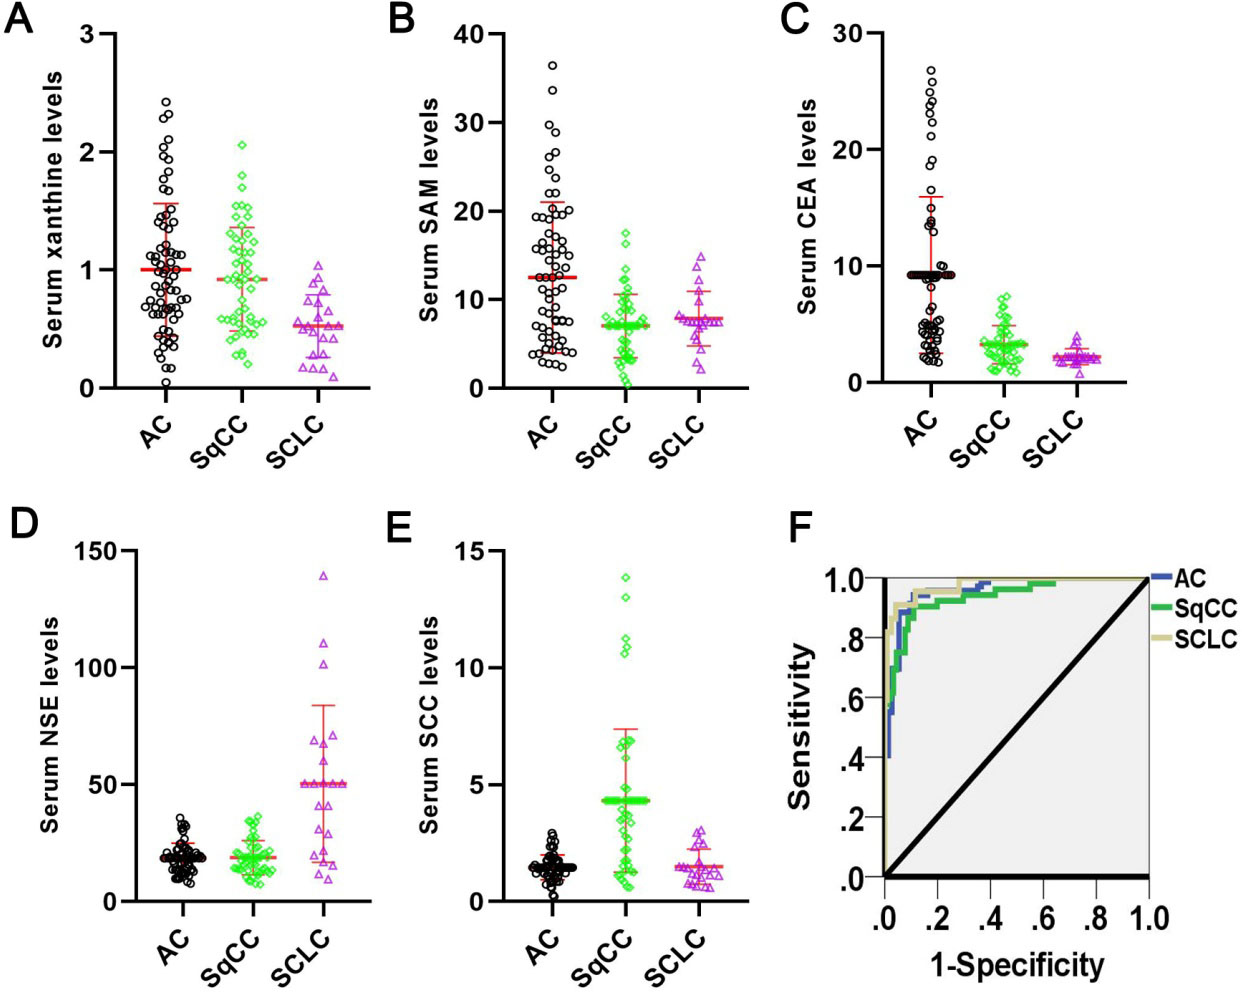
MLP is a kind of artificial neural network. Besides the input and output layer, it can have multiple hidden layers. For the MLP structure, the input layer takes 5 nodes (serum levels of xanthine, SAM, CEA, SCC and NSE, Fig. 5A–E), the output layer takes 3 nodes (subtypes of lung cancer), and the number of hidden layer nodes is determined by the experimental method. The number starts from 1 node, and then increases one by one until the network performance cannot be improved. The simulation results showed that the prediction accuracy of classification of AC, SqCC and SCLC were 97.1%, 86.5% and 90.9%, respectively. The average prediction accuracy of the three types of samples was 92.3%, and the corresponding AUROC were 0.976, 0.975 and 0.990 (Fig. 5F), significantly higher than that predicted by the DA model.
A-E Serum levels of 5 biomarkers in AC, SqCC, and SCLC. F: ROC results for classification of AC, SqCC, and SCLC by MLP.
Discussion
In this study, the age distribution of lung cancer patients for HNMR based metabolomics study is generally large, with an average of more than 60 years old, and most of them have decades of smoking history. Lung cancer can be divided into AC, SqCC and SCLC. AC and SqCC are common types of lung cancer in NSCLCthe proportion of smokers in each group is 60.0% (AC, 18/30), 82.4% (SqCC, 14/17) and 42.8% (SCLC:3/7) respectively. SCLC and NSCLC have different sensitivity to chemotherapy, radiotherapy and surgery [35, 36]. In addition, SCLC tends to metastasize and has a poor prognosis. NSCLC, as the main type of lung cancer, is heterogeneous and often shows more malignant features. Clinically, the early screening of lung cancer, especially the diagnosis of subtypes, are particularly important for improving the survival and quality of life of patients. H-NMR, the most commonly used technology in metabolomics research, is based on the spin characteristics of atoms by applying magnetic fields and radio frequency pulses to the nucleus. NMR is favored by researchers because of its advantages such as non-destructive to samples, diversity of detected substances and untargeting. Compared with SqCC, the contents of serum valine, alanine, acetate, succinic acid, creatine, creatinine, choline, betaine, lactate and formate in AC decreased, and the contents of lipid and leucine increased. By comparison, the amino acid content of AC is generally lower than SqCC, indicating that its protein decomposition is weaker than SqCC. The decrease of lipids in SqCC may be due to the inhibition of the lipid synthesis pathway, or the excessive growth and reproduction of tumor cells that consume large amounts of lipids. Betaine, as a major methyl donor, can be oxidized by choline, and has a high content in SqCC, which may be related to enhanced choline transport [37, 38]. The contents of lipid, leucine, valine, alanine, acetate, succinic acid, creatine, choline and betaine in SCLC were significantly higher than those in AC and SqCC. And the content of lactate in SCLC was higher than that in AC. The increase of glucose and anaerobic glycolysis will lead to the increase of lactate level, which will promote the proliferation of tumor cells by inducing local tissues immunosuppression [39, 40]. The Vip value of hypoxanthine in OPLS-DA model was 1.54 (Table 2). In short, the results of H-NMR suggest that changes in choline, purine, lipid or amino acid metabolites may contribute to the classification of lung cancer subtypes.
Purine is a substance existing in the body, mainly in the form of purine nucleotides, which plays a very important role in energy supply, metabolism regulation and coenzyme composition [41]. Besides, purines are closely related to substances in the cholinergic pathway, and are both involved in one-carbon metabolism and methylation. Up to now, there are very few reports about the differences of purines in different types of lung cancer. Rocha [42] applied H high resolution magic angle spinning NMR spectroscopy to lung cancer and adjacent tissues, and found that the most discriminating metabolites were lactate, PC and GPC (higher in lung cancer), glucose, inositol, inosine/adenosine and acetate (lower in lung cancer). Li et al. [43] applied UPLC/Q-TOF MS to lung cancer serum and found that combination of choline and linoleic acid can be used to distinguish lung cancer patients and controls, with AUC of 1.00, specificity and sensitivity of 96% and 100%. Rocha [22] applied NMR metabolomics to lung cancer tissues (19 AC and 19 SqCC), and found that creatine and glutathione were higher in SqCC, while PC, PE, myo-Inositol and taurine were higher in AC. The classification accuracy of AC and SqCC by PLS-DA was 82.8%.
As a commonly used technology of targeted metabolomics, UPLC-MS-MS can accurately quantify metabolites with high sensitivity and accuracy, which was further employed due to the low sensitivity and the possible overlap of peaks of choline and puring metabolites of H-NMR. On the basis of enlarging clinical samples, 17 metabolites in choline and purine pathway (Table 4) were quantitatively analyzed by the validated UPLC-MS-MS method [25] in this study. DA is a multivariate statistical method to determine the category of objects, which is widely used in the field of medical diagnosis [44]. In this work, the stepwise discriminant method based on Fisher criterion was used to screen the significant variables for the classification of subtypes of lung cancer with 20 covariates, including three serum markers of lung cancer (CEA, NSE, SCC) combined with UPLC-MS/MS quantitative data of 17 metabolites mentioned above. The results showed that the average classification accuracy of AC, SqCC and SCLC models established by linear combination of 5 variables, including xanthine, SAM, CEA, SCC and NSE, was 84.6%. The cross-validation results showed that the established discriminant models were reliable.
The content of SAM in AC (12.51 1.03), SqCC (7.04 0.50) and SCLC (7.87 0.66) groups significantly changed, SAM is the main methyl donor in vivo [45], and its difference of content indicates that different subtypes of lung cancer have different methylation levels. The xanthine content of AC (1.00 0.07) and SqCC (0.92 0.06) was higher than that of SCLC (0.53 0.06), which may be related to the xanthine oxidase activity of different lung cancer types. The content of CEA in lung cancer patients would be increased, especially in AC patients [46]. Compared with SqCC (3.25 0.23) and SCLC (2.22 0.15), the content of CEA in AC (9.23 0.81) was the highest, which was consistent with the literature reports [46]. The content of SCC in SqCC (4.32 0.42) was higher than that in AC (1.46 0.06) and SCLC (1.50 0.16). The highest NSE content was found in SCLC (50.39 7.15), which was significantly different from AC (18.60 0.76) and SqCC (18.78 1.02). NSE was also considered to be a reliable marker in distinguishing SCLC [47].
Artificial neural network (ANN) is a nonlinear data modeling tool, which composes of input layer, output layer, and one or more hidden layers. ANN is constantly adjusted by the training and learning algorithm during the iteration process to minimize the prediction errors and improve the prediction accuracy [48]. ANN’s application has become one of the most active research topics in the medical field [49]. Studies had shown that the results obtained by properly trained ANN model were consistent with those by clinicians, and their sensitivity and specificity were higher [50, 51]. Therefore, we used the five potential serum markers screened by DA as variables for MLP training. The simulation results showed that the average prediction accuracy of AC, SqCC and SCLC classification was 92.3%, AUROC was more than 0.97, and the diagnostic value was higher than that of DA model. It was superior to DA model, which provided a new method for predictive diagnosis of lung cancer classification.
Conclusion
Diagnosis of subtypes of lung cancer based on serum markers is still a difficult problem. Here, based on H-NMR and UPLC-MS/MS, metabolomics techniques and DA were used to identify and screen the significant combination of variables for lung cancer sub-typing. Our results showed that the combination of serum xanthine, SAM, CEA, SCC and NSE could be used for simultaneous classification of AC, SqCC and SCLC with the prediction accuracy of 92.3% and AUROC greater than 0.97 by MLP, which is worthy of further study.
Footnotes
Conflict of interest
The authors have stated that they have no conflict of interest.
Funding
The work was supported by a grant from the Key research and development program of Jiangxi Province (No. 20181BBG70029 and 20171BBG70086), the National Natural Science Foundation of GanSu Province (No. 18JR3RA334). The work also supported by the grant of the Jiaxing University B Key Academic Subject (Pharmaceutical), Zhejiang Province, China.
References
1.
KadariaD.ArchieD.S.SultanAliI.WeimanD.S.FreireA.X. and ZamanM.K., Dual time point positron emission tomography/computed tomography scan in evaluation of intrathoracic lesions in an area endemic for histoplasmosis and with high prevalence of sarcoidosis, Am J Med Sci346 (2013), 358–362.
2.
BulmanW.SaqiA. and PowellC.A., Acquisition and processing of endobronchial ultrasound-guided transbronchial needle aspiration specimens in the era of targeted lung cancer chemotherapy, Am J Respir Crit Care Med185 (2012), 606–611.
3.
ChenW.ZhangS. and ZouX., Evaluation on the incidence, mortality and tendency of lung cancer in China, Thorac Cancer1 (2010), 35–40.
4.
VineisP.AiroldiL.VegliaF.OlgiatiL.PastorelliR.AutrupH.DunningA.GarteS.GormallyE.HainautP.MalaveilleC.MatulloG.PelusoM.OvervadK.TjonnelandA.Clavel-ChapelonF.BoeingH.KroghV.PalliD.PanicoS.TuminoR.Bueno-De-MesquitaB.PeetersP.BerglundG.HallmansG.SaracciR. and RiboliE., Environmental tobacco smoke and risk of respiratory cancer and chronic obstructive pulmonary disease in former smokers and never smokers in the EPIC prospective study, BMJ330 (2005), 277.
5.
VineisP.AlavanjaM.BufflerP.FonthamE.FranceschiS.GaoY.T.GuptaP.C.HackshawA.MatosE.SametJ.SitasF.SmithJ.StaynerL.StraifK.ThunM.J.WichmannH.E.WuA.H.ZaridzeD.PetoR. and DollR., Tobacco and cancer: Recent epidemiological evidence, J Natl Cancer Inst96 (2004), 99–106.
6.
MinnaJ.D.RothJ.A. and GazdarA.F., Focus on lung cancer, Cancer Cell1 (2002), 49–52.
7.
ZhangG.X.WangN.WangT.ZhuW.X.QuC.X. and XingX.M., Impact of tobacco consumption and air pollution on the mortality of lung cancer in urban residents of Beijing, Journal of Environment and Health26 (2009), 666–669.
8.
SchullerH.M.PorterB.RiechertA.WalkerK. and SchmoyerR., Neuroendocrine lung carcinogenesis in hamsters is inhibited by green tea or theophylline while the development of adenocarcinomas is promoted: Implications for chemoprevention in smokers, Lung Cancer45 (2004), 11–18.
9.
De StefaniE.FonthamE.T.ChenV.CorreaP.Deneo-PellegriniH.RoncoA. and MendilaharsuM., Fatty foods and the risk of lung cancer: A case-control study from Uruguay, International Journal of Cancer71 (1997), 760–766.
10.
HuangL.J. and ChenS.X., Research and development of serum protein markers in lung cancer, Chinese Journal of Lung Cancer (2006), 558–560.
11.
RamalingamS.S.OwonikokoT.K. and KhuriF.R., Lung cancer: New biological insights and recent therapeutic advances, CA Cancer J Clin61 (2011), 91–112.
12.
PamungkasA.D.MedrianoC.A.SimE.LeeS. and ParkY.H., A pilot study identifying a potential plasma biomarker for determining EGFR mutations in exons 19 or 21 in lung cancer patients, Molecular Medicine Reports15 (2017), 4155–4161.
13.
LinY.LengQ.JiangZ.GuarneraM.A.ZhouY.ChenX.WangH.ZhouW.CaiL.FangH.LiJ.JinH.WangL.YiS.LuW.EversD.FowleC.B.SuY. and JiangF., A classifier integrating plasma biomarkers and radiological characteristics for distinguishing malignant from benign pulmonary nodules, International Journal of Cancer141 (2017), 1240–1248.
14.
JacobsonF.L.AustinJ.H.FieldJ.K.JettJ.R.KeshavjeeS.MacMahonH.MulshineJ.L.MundenR.F.SalgiaR.StraussG.M.SugarbakerD.J.SwansonS.J.TravisW.D. and JaklitschM.T., Development of The American Association for Thoracic Surgery guidelines for low-dose computed tomography scans to screen for lung cancer in North America: Recommendations of The American Association for Thoracic Surgery Task Force for Lung Cancer Screening and Surveillance, J Thorac Cardiovasc Surg144 (2012), 25–32.
15.
LuS.KongH.HouY.GeD.HuangW.OuJ.YangD.ZhangL.WuG.SongY.ZhangX.ZhaiC.WangQ.ZhuH.WuY. and BaiC., Two plasma microRNA panels for diagnosis and subtype discrimination of lung cancer, Lung Cancer123 (2018), 44–51.
16.
Ros-MazurczykM.JelonekK.MarczykM.BinczykF.PietrowskaM.PolanskaJ.DziadziuszkoR.JassemJ.RzymanW. and WidlakP., Serum lipid profile discriminates patients with early lung cancer from healthy controls, Lung Cancer112 (2017), 69–74.
17.
GhosalR.KloerP. and LewisK.E., A review of novel biological tools used in screening for the early detection of lung cancer, Postgraduate Medical Journal85 (2009), 358–363.
18.
LiuJ.CuiJ.LiuF.YuanY.GuoF. and ZhangG., Multi-subtype classification model for non-small cell lung cancer based on radiomics: SLS model, Med Phys46 (2019), 3091–3100.
19.
ZhangX.ZhuX.WangC.ZhangH. and CaiZ., Non-targeted and targeted metabolomics approaches to diagnosing lung cancer and predicting patient prognosis, Oncotarget7 (2016), 63437–63448.
20.
Callejon-LeblicB.Garcia-BarreraT.Gravalos-GuzmanJ.Pereira-VegaA. and Gomez-ArizaJ.L., Metabolic profiling of potential lung cancer biomarkers using bronchoalveolar lavage fluid and the integrated direct infusion/gas chromatography mass spectrometry platform, Journal of Proteomics145 (2016), 197–206.
21.
RochaC.M.CarrolaJ.BarrosA.S.GilA.M.GoodfellowB.J.CarreiraI.M.BernardoJ.GomesA.SousaV.CarvalhoL. and DuarteI.F., Metabolic signatures of lung cancer in biofluids: NMR-based metabonomics of blood plasma, J Proteome Res10 (2011), 4314–4324.
22.
RochaC.M.BarrosA.S.GoodfellowB.J.CarreiraI.M.GomesA.SousaV.BernardoJ.CarvalhoL.GilA.M. and DuarteI.F., NMR metabolomics of human lung tumours reveals distinct metabolic signatures for adenocarcinoma and squamous cell carcinoma, Carcinogenesis36 (2015), 68–75.
23.
XieB.LiuA.ZhanX.YeX. and WeiJ., Alteration of gut bacteria and metabolomes after glucaro-1, 4-lactone treatment contributes to the prevention of hypercholesterolemia, J Agric Food Chem62 (2014), 7444–7451.
24.
YuM.SunS.YuJ.DuF.ZhangS.YangW.XiaoJ. and XieB., Discovery and validation of potential serum biomarkers for pediatric patients with congenital heart diseases by metabolomics, J Proteome Res17 (2018), 3517–3525.
25.
ZhangY.YangJ.WangJ.ChenL.HuangH.XiongY. and XieB., Quantification of serum purine metabolites for distinguishing patients with hepatitis B from hepatocellular carcinoma, Bioanalysis11 (2019), 1003–1013.
26.
SmithR.M., Before the injection-modern methods of sample preparation for separation techniques, Journal of Chromatography A1000 (2003), 3–27.
27.
BeckonertO.KeunH.C.EbbelsT.M.BundyJ.HolmesE.LindonJ.C. and NicholsonJ.K., Metabolic profiling, metabolomic and metabonomic procedures for NMR spectroscopy of urine, plasma, serum and tissue extracts, Nature Protocols2 (2007), 2692–2703.
28.
ZhengP.GaoH.C.LiQ.ShaoW.H.ZhangM.L.ChengK.YangD.Y.FanS.H.ChenL.FangL. and XieP., Plasma metabonomics as a novel diagnostic approach for major depressive disorder, Journal of Proteome Research11 (2012), 1741–1748.
29.
HuangH.J.LiJ.SunS.J.FangJ.W.WangY.ZhangY.Y. and MaoW.W., The pharmacodynamic effect and mechanism of baicalein on human lung adenocarcinoma A549 cells, Chinese Journal of Experimental Formulaology23 (2017), 98–103.
30.
YangQ.J.ZhaoJ.R.HaoJ.LiB.HuoY.HanY.L.WanL.L.LiJ.HuangJ.LuJ.YangG.J. and GuoC., Serum and urine metabolomics study reveals a distinct diagnostic model for cancer cachexia, J Cachexia Sarcopenia Muscle9 (2018), 71–85.
31.
ZeiselS.H. and BlusztajnJ.K., Choline and human nutrition, Annu Rev Nutr14 (1994), 269–296.
32.
DeLongC.J.HicksA.M. and CuiZ., Disruption of choline methyl group donation for phosphatidylethanolamine methylation in hepatocarcinoma cells, J Biol Chem277 (2002), 17217–17225.
33.
BauerleM.R.SchwalmE.L. and BookerS.J., Mechanistic diversity of radical S-adenosylmethionine (SAM)-dependent methylation, J Biol Chem290 (2015), 3995–4002.
34.
SeidlM.F., Adenine N6-methylation in diverse fungi, Nat Genet49 (2017), 823–824.
35.
SpiraA. and EttingerD.S., Multidisciplinary management of lung cancer, N Engl J Med350 (2004), 379–392.
36.
StuppR.MonneratC.TurrisiA.T., 3rdPerryM.C. and LeyvrazS., Small cell lung cancer: State of the art and future perspectives, Lung Cancer45 (2004), 105–117.
37.
YangQ.ShiX.WangY.WangW.HeH.LuX. and XuG., Urinary metabonomic study of lung cancer by a fully automatic hyphenated hydrophilic interaction/RPLC-MS system, J Sep Sci33 (2010), 1495–1503.
38.
Katz-BrullR.SegerD.Rivenson-SegalD.RushkinE. and DeganiH., Metabolic markers of breast cancer: Enhanced choline metabolism and reduced choline-ether-phospholipid synthesis, Cancer Res62 (2002), 1966–1970.
39.
ChoiS.Y.CollinsC.C.GoutP.W. and WangY., Cancer-generated lactic acid: A regulatory, immunosuppressive metabolite, J Pathol230 (2013), 350–355.
40.
GilliesR.J. and GatenbyR.A., Metabolism and its sequelae in cancer evolution and therapy, Cancer J21 (2015), 88–96.
41.
LiuL. and RenG., Research progress on detection methods of cockroaches in food, Practical Preventive Medicine25 (2018), 1146–1149.
42.
RochaC.M.BarrosA.S.GilA.M.GoodfellowB.J.HumpferE.SpraulM.CarreiraI.M.MeloJ.B.BernardoJ.GomesA.SousaV.CarvalhoL. and DuarteI.F., Metabolic profiling of human lung cancer tissue by 1H high resolution magic angle spinning (HRMAS) NMR spectroscopy, J Proteome Res9 (2010), 319–332.
43.
LiY.J.SongX.ZhaoX.J.ZouL.J. and XuG.W., Serum metabolic profiling study of lung cancer using ultra high performance liquid chromatography/quadrupole time-of-flight mass spectrometry, Journal of Chromatography B-Analytical Technologies in the Biomedical and Life Sciences966 (2014), 147–153.
44.
HuangD.QuanY.HeM. and ZhouB., Comparison of linear discriminant analysis methods for the classification of cancer based on gene expression data, J Exp Clin Cancer Res28 (2009), 149.
45.
Karas KuzelickiN., S-adenosyl methionine in the therapy of depression and other psychiatric disorders, Drug Dev Res77 (2016), 346–356.
46.
MatsuokaK.SumitomoS.NakashimaN.NakajimaD. and MisakiN., Prognostic value of carcinoembryonic antigen and CYFRA21-1 in patients with pathological stage I non-small cell lung cancer, Eur J Cardiothorac Surg32 (2007), 435–439.
47.
QuoixE.PurohitA.Faller-BeauM.MoreauL.OsterJ.P. and PauliG., Comparative prognostic value of lactate dehydrogenase and neuron-specific enolase in small-cell lung cancer patients treated with platinum-based chemotherapy, Lung Cancer30 (2000), 127–134.
48.
Agatonovic-KustrinS. and BeresfordR., Basic concepts of artificial neural network (ANN) modeling and its application in pharmaceutical research, J Pharm Biomed Anal22 (2000), 717–727.
49.
YuJ.YangM.JiangT. and ZhengS., Application of optimized combination of serum tumor markers and artificial neural network model in diagnosis of colorectal cancer, Journal of Zhejiang University (Medical Edition) (2004), 36–39.
50.
ChoW.C., Potentially useful biomarkers for the diagnosis, treatment and prognosis of lung cancer, Biomed Pharmacother61 (2007), 515–519.
51.
MolinaR.FilellaX.AugeJ.M.FuentesR.BoverI.RifaJ.MorenoV.CanalsE.VinolasN.MarquezA.BarreiroE.BorrasJ. and ViladiucP., Tumor markers (CEA, CA 125, CYFRA 21-1, SCC and NSE) in patients with non-small cell lung cancer as an aid in histological diagnosis and prognosis – Comparison with the main clinical and pathological prognostic factors, Tumor Biology24 (2003), 209–218.