
Abstract
Objectives
Non-small cell lung cancer (NSCLC) is a leading type of lung cancer with a high mortality rate worldwide. Although many procedures for the diagnosis and prognosis assessment of lung cancer exist, they are often laborious, expensive, and invasive. This study aimed to develop an ultra-high performance liquid chromatography-tandem mass spectrometry (UPLC–MS/MS)-based analysis method for the plasma biomarkers of NSCLC with the potential to indicate the stages and progression of this malignancy conveniently and reliably.
Methods
A total of 53 patients with NSCLC in early stages (I–III) and advanced stage (IV) were classified into the early and advanced groups based on the tumor node metastasis staging system. A comprehensive metabolomic analysis of plasma from patients with NSCLC was performed via UPLC–MS/MS. Principal component analysis and partial least squares–discriminant analysis were conducted for statistical analysis. Potential biomarkers were evaluated and screened through receiver operating characteristic analyses and correlation analysis. Main differential metabolic pathways were also identified by utilizing metaboanalyst.
Results
A total of 129 differential metabolites were detected in accordance with the criteria of VIP ≥ 1 and a P-value of ≤ 0.05. The receiver operating characteristic curves indicated that 11 of these metabolites have the potential to be promising markers of disease progression. Apparent correlated metabolites were also filtered out. Furthermore, the 11 most predominant metabolic pathways with alterations involved in NSCLC were identified.
Conclusion
Our study focused on the plasma metabolomic changes in patients with NSCLC. These changes may be used for the prediction of the stage and progression of NSCLC. Moreover, we discussed the metabolic pathways wherein the altered metabolites were mainly enriched.
Introduction
Men with lung cancer have the highest morbidity and mortality rates.1,2 Primary lung cancer can be divided into two major types, namely, small-cell lung cancer and non-small cell lung cancer (NSCLC), with the latter accounting for 80–85% of all lung cancer cases. 3 The tumor node metastasis (TNM) staging system is of great value for clinical NSCLC evaluation4,5 and is closely associated with the prognosis of NSCLC. One study reported that the 5-year survival rate of stage IA is 73%, whereas stage IV is only 13%. 6 Various methods for the diagnosis and progression assessment of this malignancy include bronchoscopy, 7 positron-emission tomography, low-dose computed tomography, 8 and histopathology. Additionally, based on plasma samples, circulating tumor DNA is a minimally invasive genotyping method for NSCLC. 9 Although efforts have been made to increase the perfection of the diagnosis and progression assessment methods for NSCLC, the accuracy of traditional diagnostic methods depends heavily on the ability of the diagnosticians. Also, traditional methods still have certain limitations in the specificity, sensitivity, and applicability in the assessment of NSCLC. Therefore, minimal, or even non-invasive, economical, and accurate evaluation methods are urgently needed. Blood samples are readily available and disease diagnosis based on blood-related research will be the future direction. One of the characteristic features of cancers is metabolic changes in the body. 10 In recent years, many studies have found metabolomic features that are associated with cancer diagnosis and assessment. For example, Rocha revealed that the nuclear magnetic resonance-based metabolomic analysis of blood plasma can distinguish patients with cancer from normal people sensitively and specifically. 11 The reduction in hydroxylated, polyunsaturated ultralong-chain fatty acids in the serum of patients with colorectal cancer may play an important role in diagnosis and screening. 12 Histidine, tryptophan, and phenylacetylglutamine can be used to discriminate between non-gastric cancer and gastric cancer groups on the basis of liquid chromatography–mass spectrometry (LC–MS). 13 Although numerous studies have demonstrated that the metabolic patterns of patients with cancer are different from those of patients without cancer, studies on the associations of metabolomics with tumor stages are scarce. Rather than distinguishing between the healthy and the sick, oncologists prefer to assess each patient as thoroughly and conveniently as possible. Thus, in this work, patients were assigned into the early (I–III) and advanced (IV) groups to investigate and analyze the correlation between serum metabolic alterations and the TNM stage of patients with NSCLC. An ultra-high performance liquid chromatography-tandem mass spectrometry (UPLC–MS/MS)-based metabolomic analysis was performed to identify NSCLC metabolite signatures that may have the potential to be disease biomarkers. The metabolic pathways that were related to NSCLC were also investigated.
Materials and methods
Patient population and sample collection
This study was approved by the Second Affiliated Hospital of Soochow University Ethics Committee (ethics approval number ECSU-2015-0002). Written informed consent was obtained from all the patients prior to their participation. Data were collected by using a predesigned questionnaire. The patients were classified into the early and advanced groups based on their TNM stage (Supplementary Tables 1 and 2). All of the enrolled patients only received chemotherapy, although their chemotherapy regimens differed based on the pathological classification. None of the patients had previously undergone radiotherapy, radical surgery, or palliative operations. Except for the criteria mentioned above, no other restrictions for inclusion criteria were specified. From 2016 to 2018, information of 369 patients with NSCLC was collected at the Second Affiliated Hospital of Soochow University; 53 patients met the inclusion criteria for this study.
Whole blood was drawn from each patient and transferred into a tube with ethylenediaminetetraacetic acid. Plasma was obtained via centrifugation (3500 rpm for 10 min at 4°C). All samples were numbered and stored at − 80°C for subsequent experiments.
Plasma pretreatment
A total of 100 μL of each sample was transferred into a new EP tube, and then 400 μL of − 20°C methanol was added. The mixtures were vortexed for 1 min and subsequently centrifuged for 10 min at 12,000 rpm and 4°C. The supernatant was transferred into new tubes and evaporated to dryness under vacuum at room temperature. The samples were redissolved by adding − 20°C methanol and filtered through a 0.22 μm membrane for UPLC–MS/MS analysis.
UPLC-MS/MS analysis conditions
Plasma samples were analyzed on an Ultimate 3000 Ultra High-Performance Chromatography system coupled with a Q Exactive mass spectrometer (Thermo Fisher Scientific, Waltham, MA, USA). Chromatographic separation was conducted with a Waters ACQUITY UPLC HSS T3 1.8 μm (2.1 mm × 150 mm; Waters, Milford, MA, USA). The temperatures of column oven and autosampler were set at 40 and 8°C, respectively. In the electrospray ionization positive (ESI + ) mode, elution was performed by solvent C (water with 0.1% formic acid) and D (acetonitrile with 0.1% formic acid). Solvent A (water with 5 mmol/L ammonium formate) and B (acetonitrile) were applied in the electrospray ionization negative (ESI − ) mode. The flow rate of gradient elution was 0.25 mL/min as follows: 0–1 min, 2% D (ESI + ) or B (ESI − ); 1–10 min, 2–50% D (or B); 10–13 min, 50–98% D (or B); 13–14.5 min, 98% D (or B); 14.5–15 min, 98–2% D (or B); 15–21 min, 2% D (or B). The following mass spectrometer condition was applied: spray voltage, + 3.5 kV (ESI + mode) and − 2.5 kV (ESI − mode); collision voltage, 30 eV; sheath gas flow, 30 (arbitrary units); auxiliary gas flow, 10 (arbitrary units); and capillary temperature, 325°C. The full scan was performed at a resolution of 70,000, with a mass range from 81 to 1000 m/z.
A quality control (QC) sample—the mixture of 10 μL of each sample—was run at five-sample intervals to maintain the stability of the UPLC-MS/MS system.
Data preprocessing and statistical analysis
Raw data were converted into mzXML format with Proteowizard software (V3.0.8789). 14 The XCMS program was used for peak identification, peak filtration, and peak alignment, and to acquire the data matrix, which included the mass-to-charge ratio, retention time, and intensity. Data missing may occur during data preprocessing. Missing values were replaced by a simulation method with half of the minimum value. The precursor molecules that were obtained in the positive and negative ion modes were exported to Excel for subsequent analysis. Peak areas were normalized by those of the QC samples.
QC samples were adopted for QC and quality assurance (QA). QC samples with poorly repeatable characteristic peaks with the relative standard deviation (RSD) >30% (QA) were excluded.15,16
Normalized data were subjected to mean centering and scaled to unit variance. Multivariate statistical analysis was conducted via principal component analysis (PCA) and partial least squares-discriminate analysis (PLS–DA). Meanwhile, a permutation plot was used to evaluate whether the PLS–DA model was overfitting. The quality of the models was assessed by using the parameters R2 and Q2. Specifically, the PCA models were regarded as valid when R2X > 0.4, and the PLS–DA models were valid only if R2 and Q2 > 0.5.
Differential analysis
The variable importance in the projection (VIP) of the first principal component along with P-value (Mann–Whitney test) were applied to identify differential metabolites, in accordance with the criteria of VIP ≥ 1 and P-value ≤ 0.05. The differential metabolites were further determined through molecular mass comparison and by searching online databases, such as the Human Metabolome Database (HMDB), METLIN, MassBank, LIPID MAPS, and mzCloud. Moreover, the potential of each metabolite to be useful as an assessment tool was evaluated by means of the area under the receiver operating characteristic (ROC) curve (AUC). A biomarker was considered to have a high diagnostic value when AUC > 0.7.
Correlation analysis within all differential metabolites was measured using Pearson's correlation coefficient. The cor () function in R(v3.1.3) was used to calculate the correlation coefficient. When the linear relationship between the two metabolites was enhanced, the correlation coefficient tended to 1 for positive correlation and −1 for negative correlation. The cor.test () function in R(v3.1.3) was used for statistical test of metabolite association analysis, the correlation was considered as statistically significant with the correlation coefficient (r) ≤ − 0.8 or ≥ 0.8, and P < 0.05. 17
Additionally, the metabolic pathways of the biomarkers were analyzed by metaboanalyst (MetPA) including pathway enrichment analysis and pathway topology analysis, mainly based on the Kyoto Encyclopedia of Genes and Genomes (KEGG) database.
Results
Base peak chromatogram
A total of 7389 precursor molecules were obtained in positive ion mode, and 16,777 precursor molecules were obtained in negative ion mode (Supplementary Figure 1).
QC and QA
QC and QA were performed to ensure the reliability of the data. The QC samples were densely distributed in contrast to the experimental samples (Supplementary Figure 2). This distribution pattern indicated that the data were favorable for follow-up analysis. The RSD of the potential characteristic peaks in QC samples should not exceed 30% to detect candidate biomarkers. In positive ion mode, the number of eligible variables was 5978 (RSD ˂ 30%), which accounted for 80.9% of the total variables. In negative ion mode, 14,640 variables, or 87.2% of the variables, had RSDs < 30%. The overall proportion of characteristic peak ratios with RSD < 30% was >70%, demonstrating that the sample dataset in the present study was of reliable quality.
Multivariate statistical analysis
The PCA score plots are shown in Figure 1. Ten principal components in the positive and negative ion modes with R2 values of 0.459 and 0.436 were found for the two groups. Figure 1 indicates that the separation between groups was significant and that intragroup differences were not apparent.
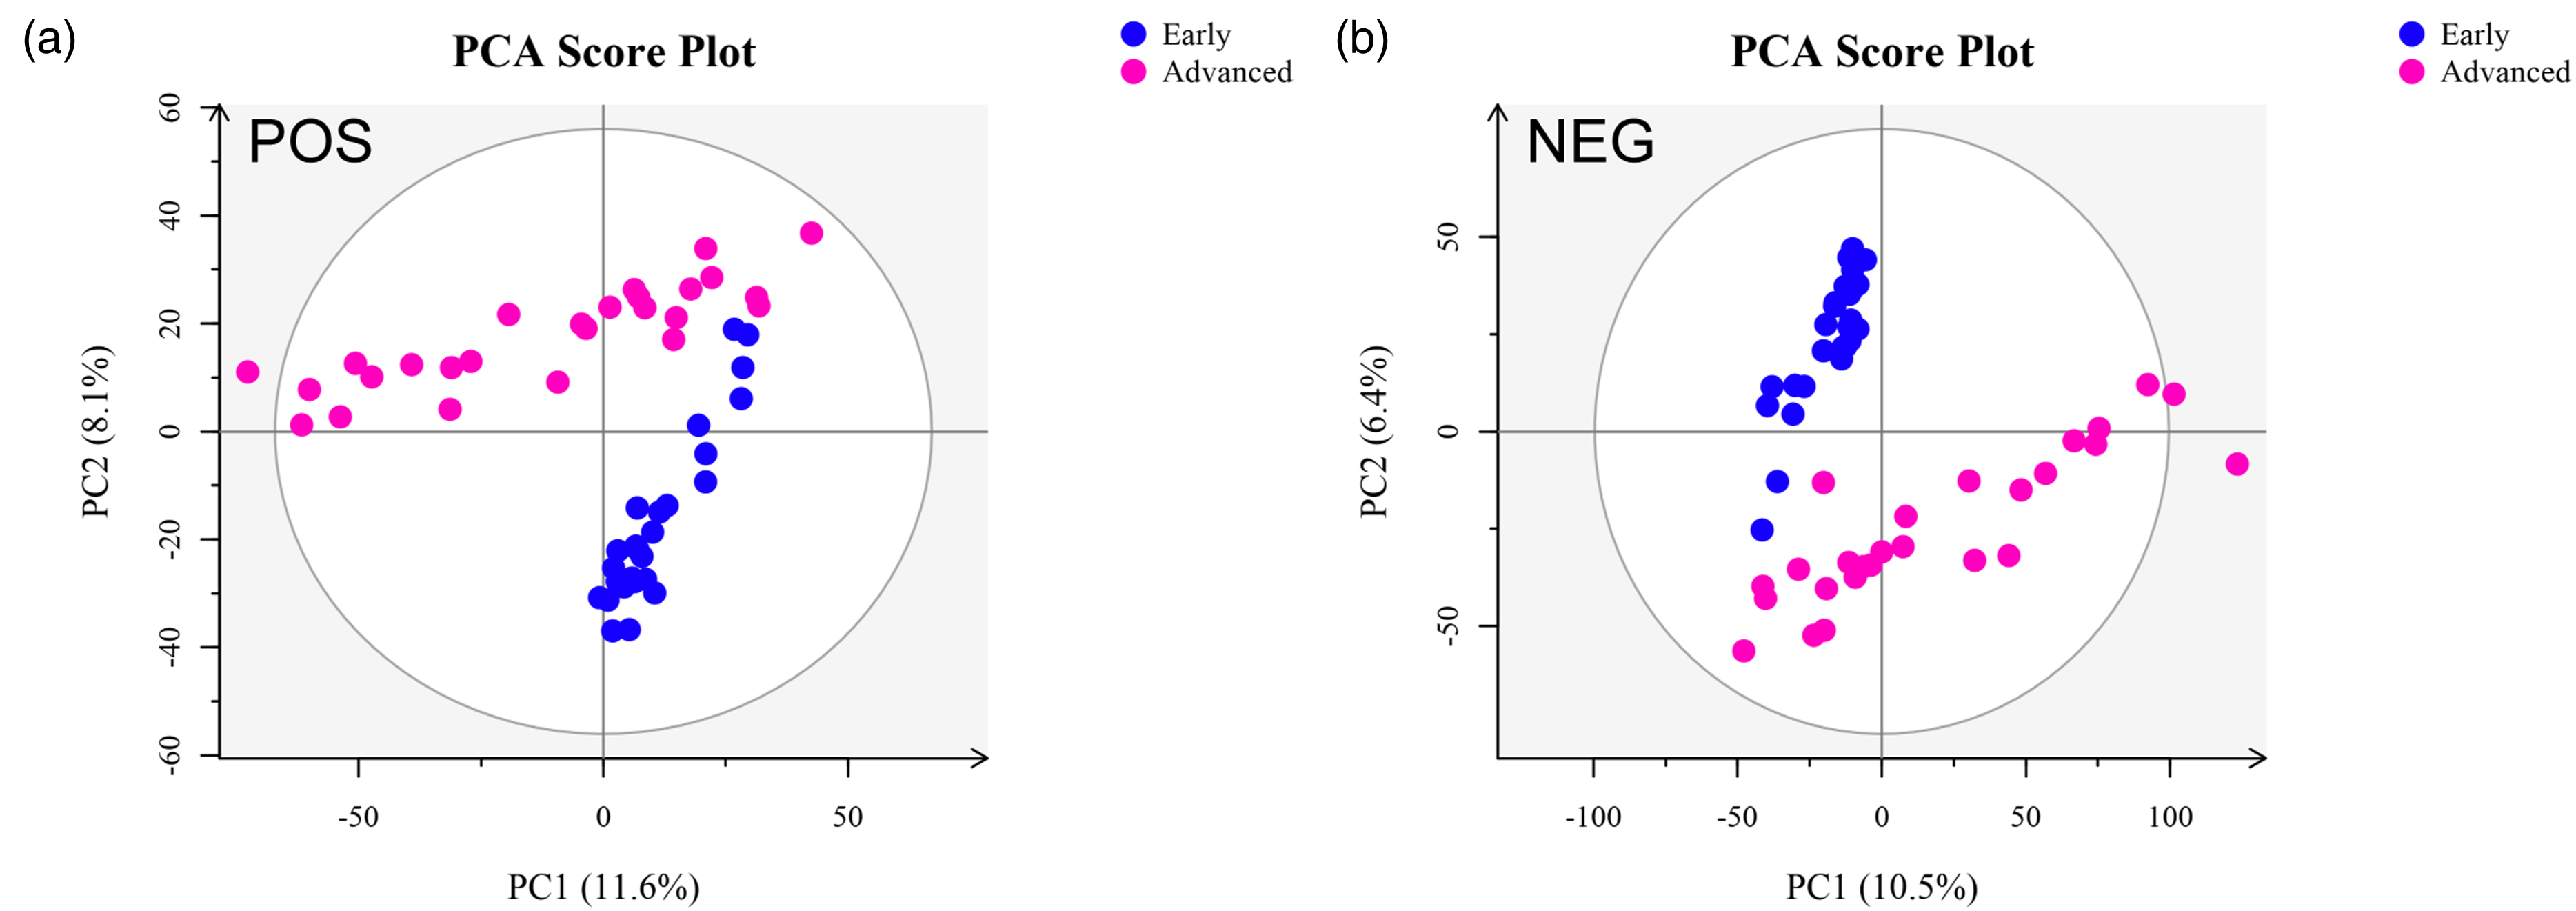
PCA of the early and advanced groups in positive and negative ion modes. PCA plots were generated from the plasma sample datasets of the early and advanced groups. (a) PCA score plot in positive ion mode. (b) PCA score plot in negative ion mode.
PLS–DA was performed for supervised analysis to highlight the differences between the groups further. The positive and negative ion models had three principal components. The model evaluation parameter was obtained (positive ion mode: R2Y = 0.992, Q2 = 0.931; negative ion mode: R2Y = 0.994, Q2 = 0.918). Compared with those in PCA, the separation between groups was more evident and the clustering of samples from the same group was closer in PLS–DA (Figure 2). Moreover, the values of R2Y and Q2 exceeded 0.5, indicating that the model had high reliability. The permutation test was performed to evaluate if the PLS–DA model was overfitting. In positive and negative modes, all blue Q2 points were below the original blue Q2 point, indicating that the established models were stable and reliable and could be utilized for the further screening of differential metabolites (Figure 2).
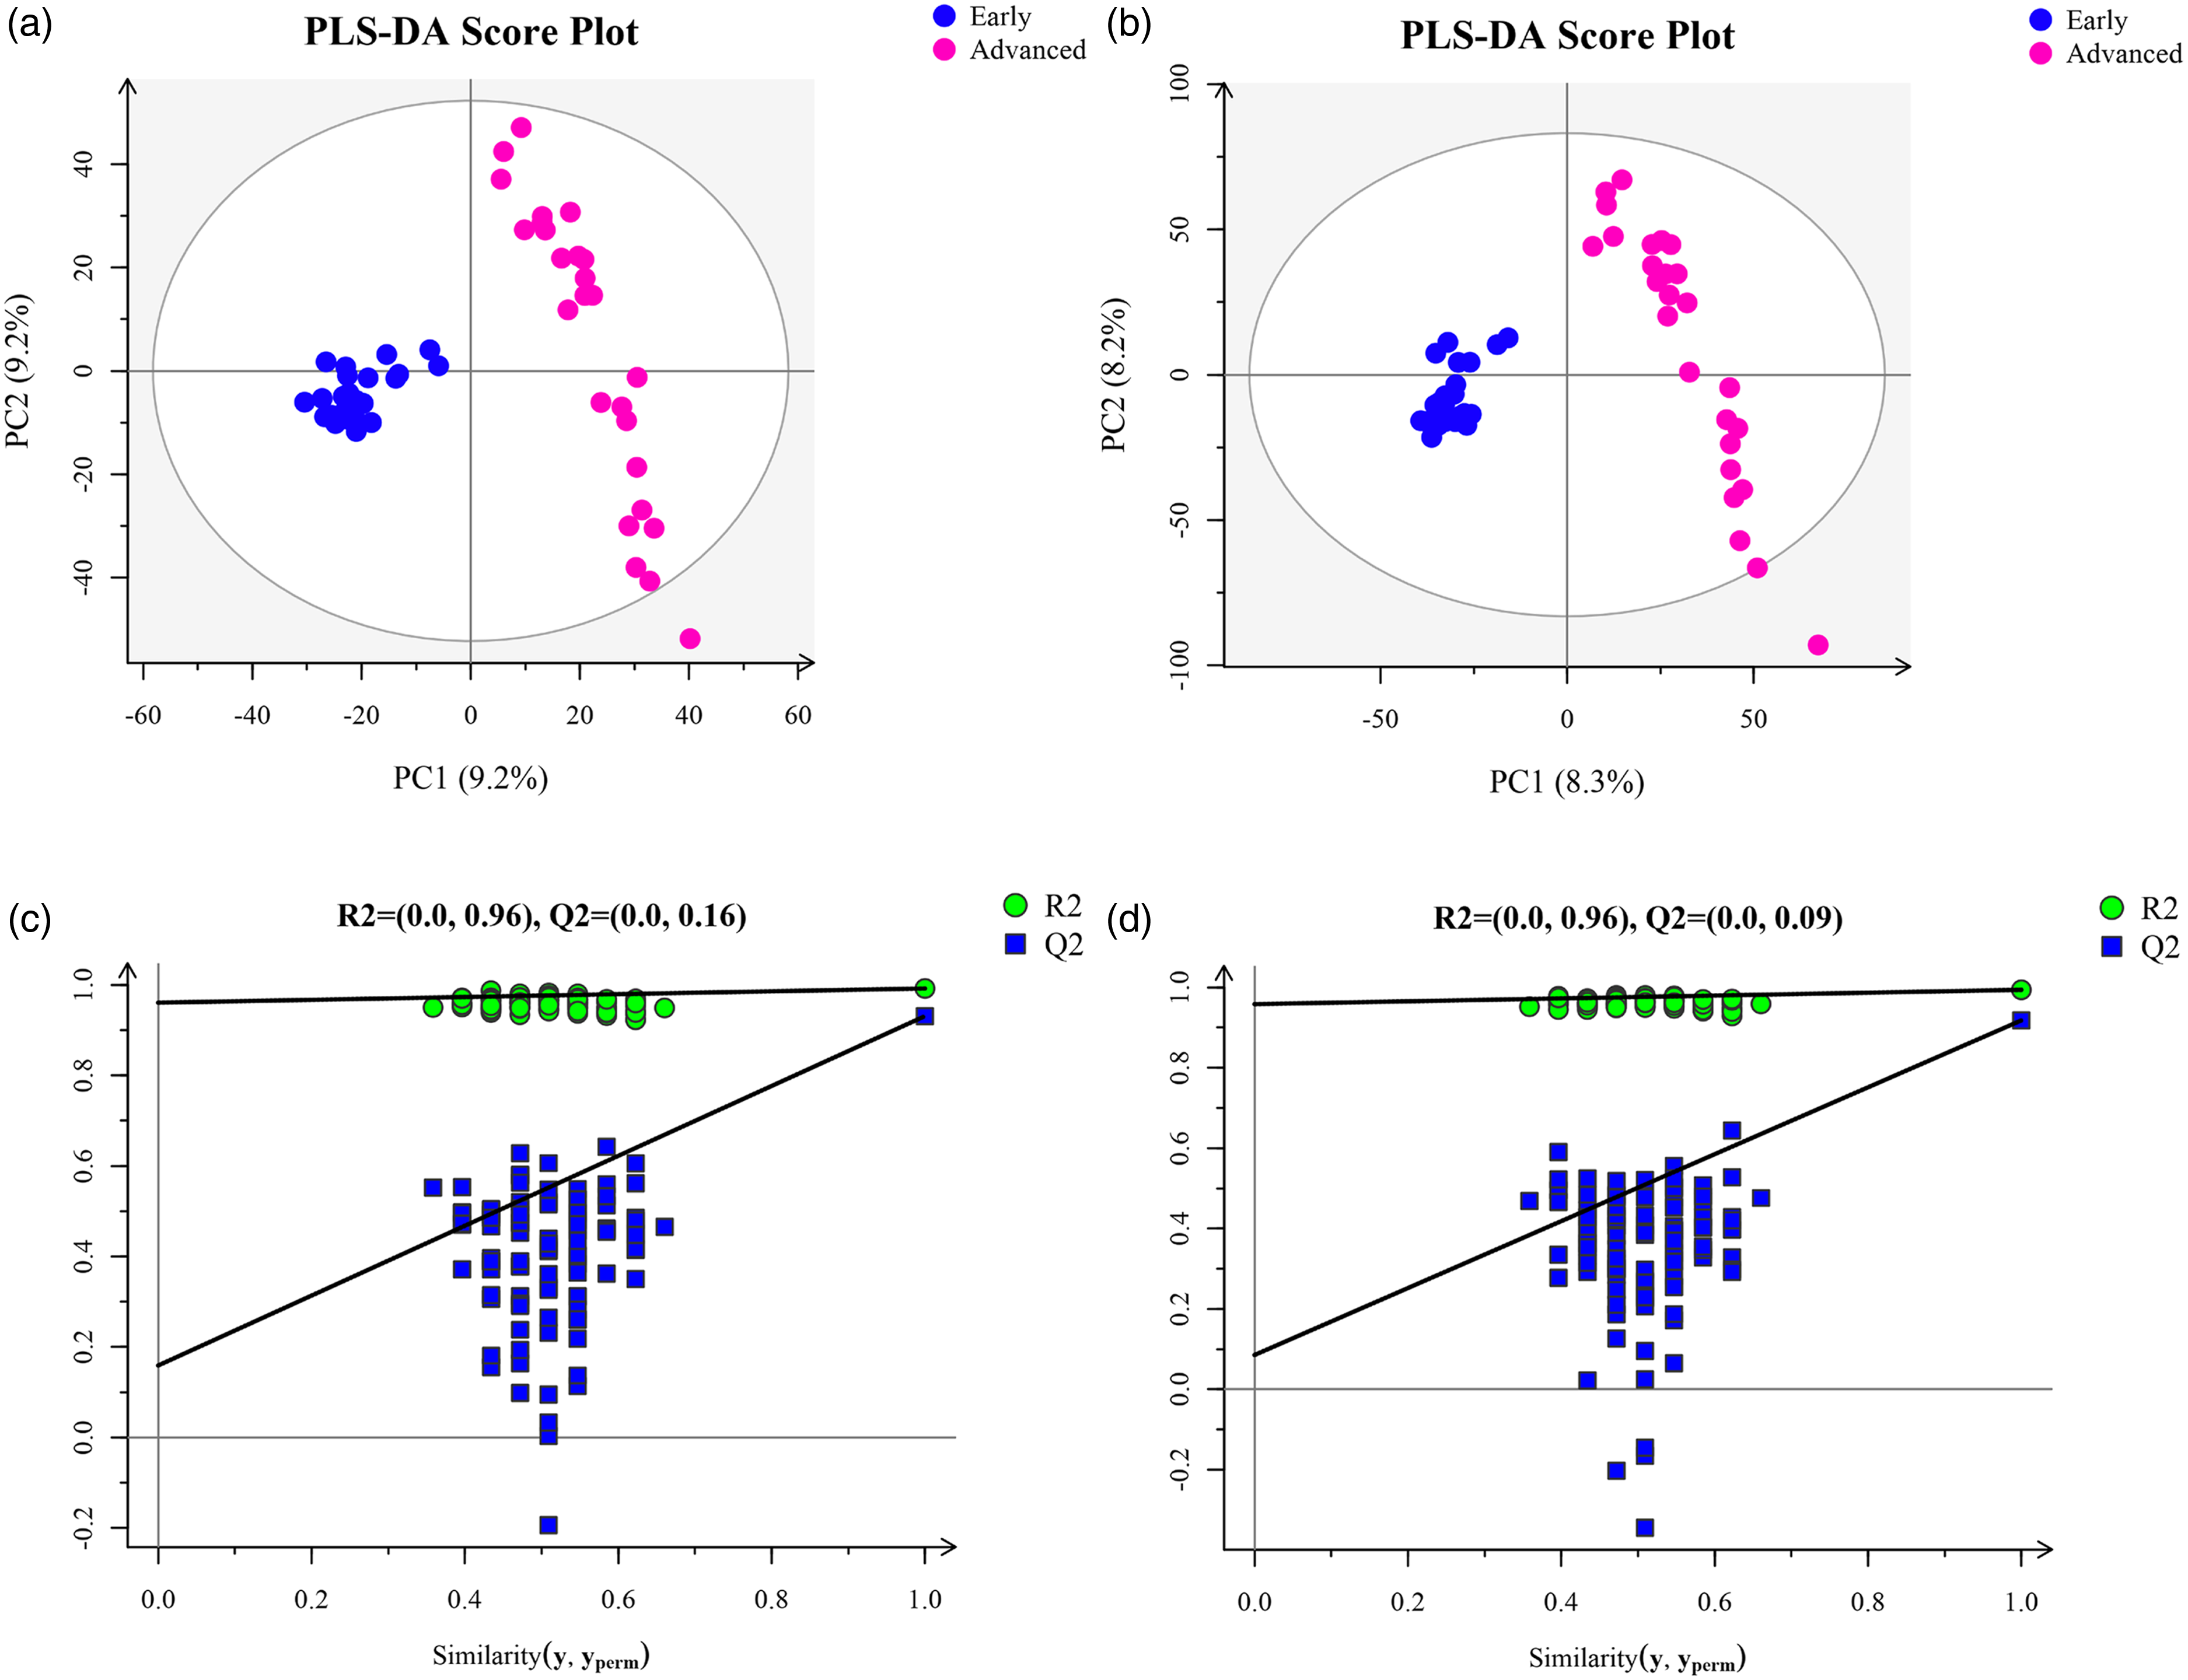
(a) PLS–DA score plot in positive ion mode. (b) PLS–DA score plot in negative ion mode. (c) Permutation plot in positive ion mode. (d) Permutation plot in negative ion mode.
Potential biomarker identification
In this experiment, PLS–DA, together with the criteria of VIP ≥ 1 and P ≤ 0.05 (Mann–Whitney test), was used to screen for potential differential metabolites. By searching the METLIN, HMDB, MassBank, LIPID MAPS, and mzCloud databases, 129 metabolites were tentatively identified based on accurate mass fragments.
The levels of 12 metabolites in the early group were dramatically enhanced relative to those in the advanced group. These metabolites included D-fructose, alpha-D-glucose, alpha-ketoisovaleric acid, selenomethionine, D-4-hydroxy2-oxoglutarate, sucrose, L-valine, allocholic acid, p-hydroxyphenylacetic acid, benzoate, phenylacetic acid, and 5-aminopentanoic acid (Supplementary Table 3).
Thirteen upregulated metabolites in the advanced group were also sorted out. They consisted of S-adenosylhomocysteine, phosphoglycolic acid, maleic acid, o-phosphoethanolamine, dehydroepiandrosterone (DHEA), norepinephrine, 3-hydroxyanthranilic acid, 1-pyrroline-2-carboxylic acid, threonic acid, L-2-hydroxyglutaric acid, xanthosine, D-phenylalanine and uric acid (Supplementary Table 4).
A ROC analysis was performed, and the AUC was used to estimate whether these potential biomarkers exhibited assessment significance for NSCLC. A biomarker was considered to have a high diagnostic value when AUC > 0.7. In accordance with this criterion, 11 biomarkers were screened out as follows: D-phenylalanine, phenylacetic acid, o-phosphoethanolamine, dehydroepiandrosterone, alpha-D-glucose, D-4-hydroxy-2-oxoglutarate, xanthosine, allocholic acid, 5-aminopentanoic acid, D-fructose and uric acid (Figure 3).
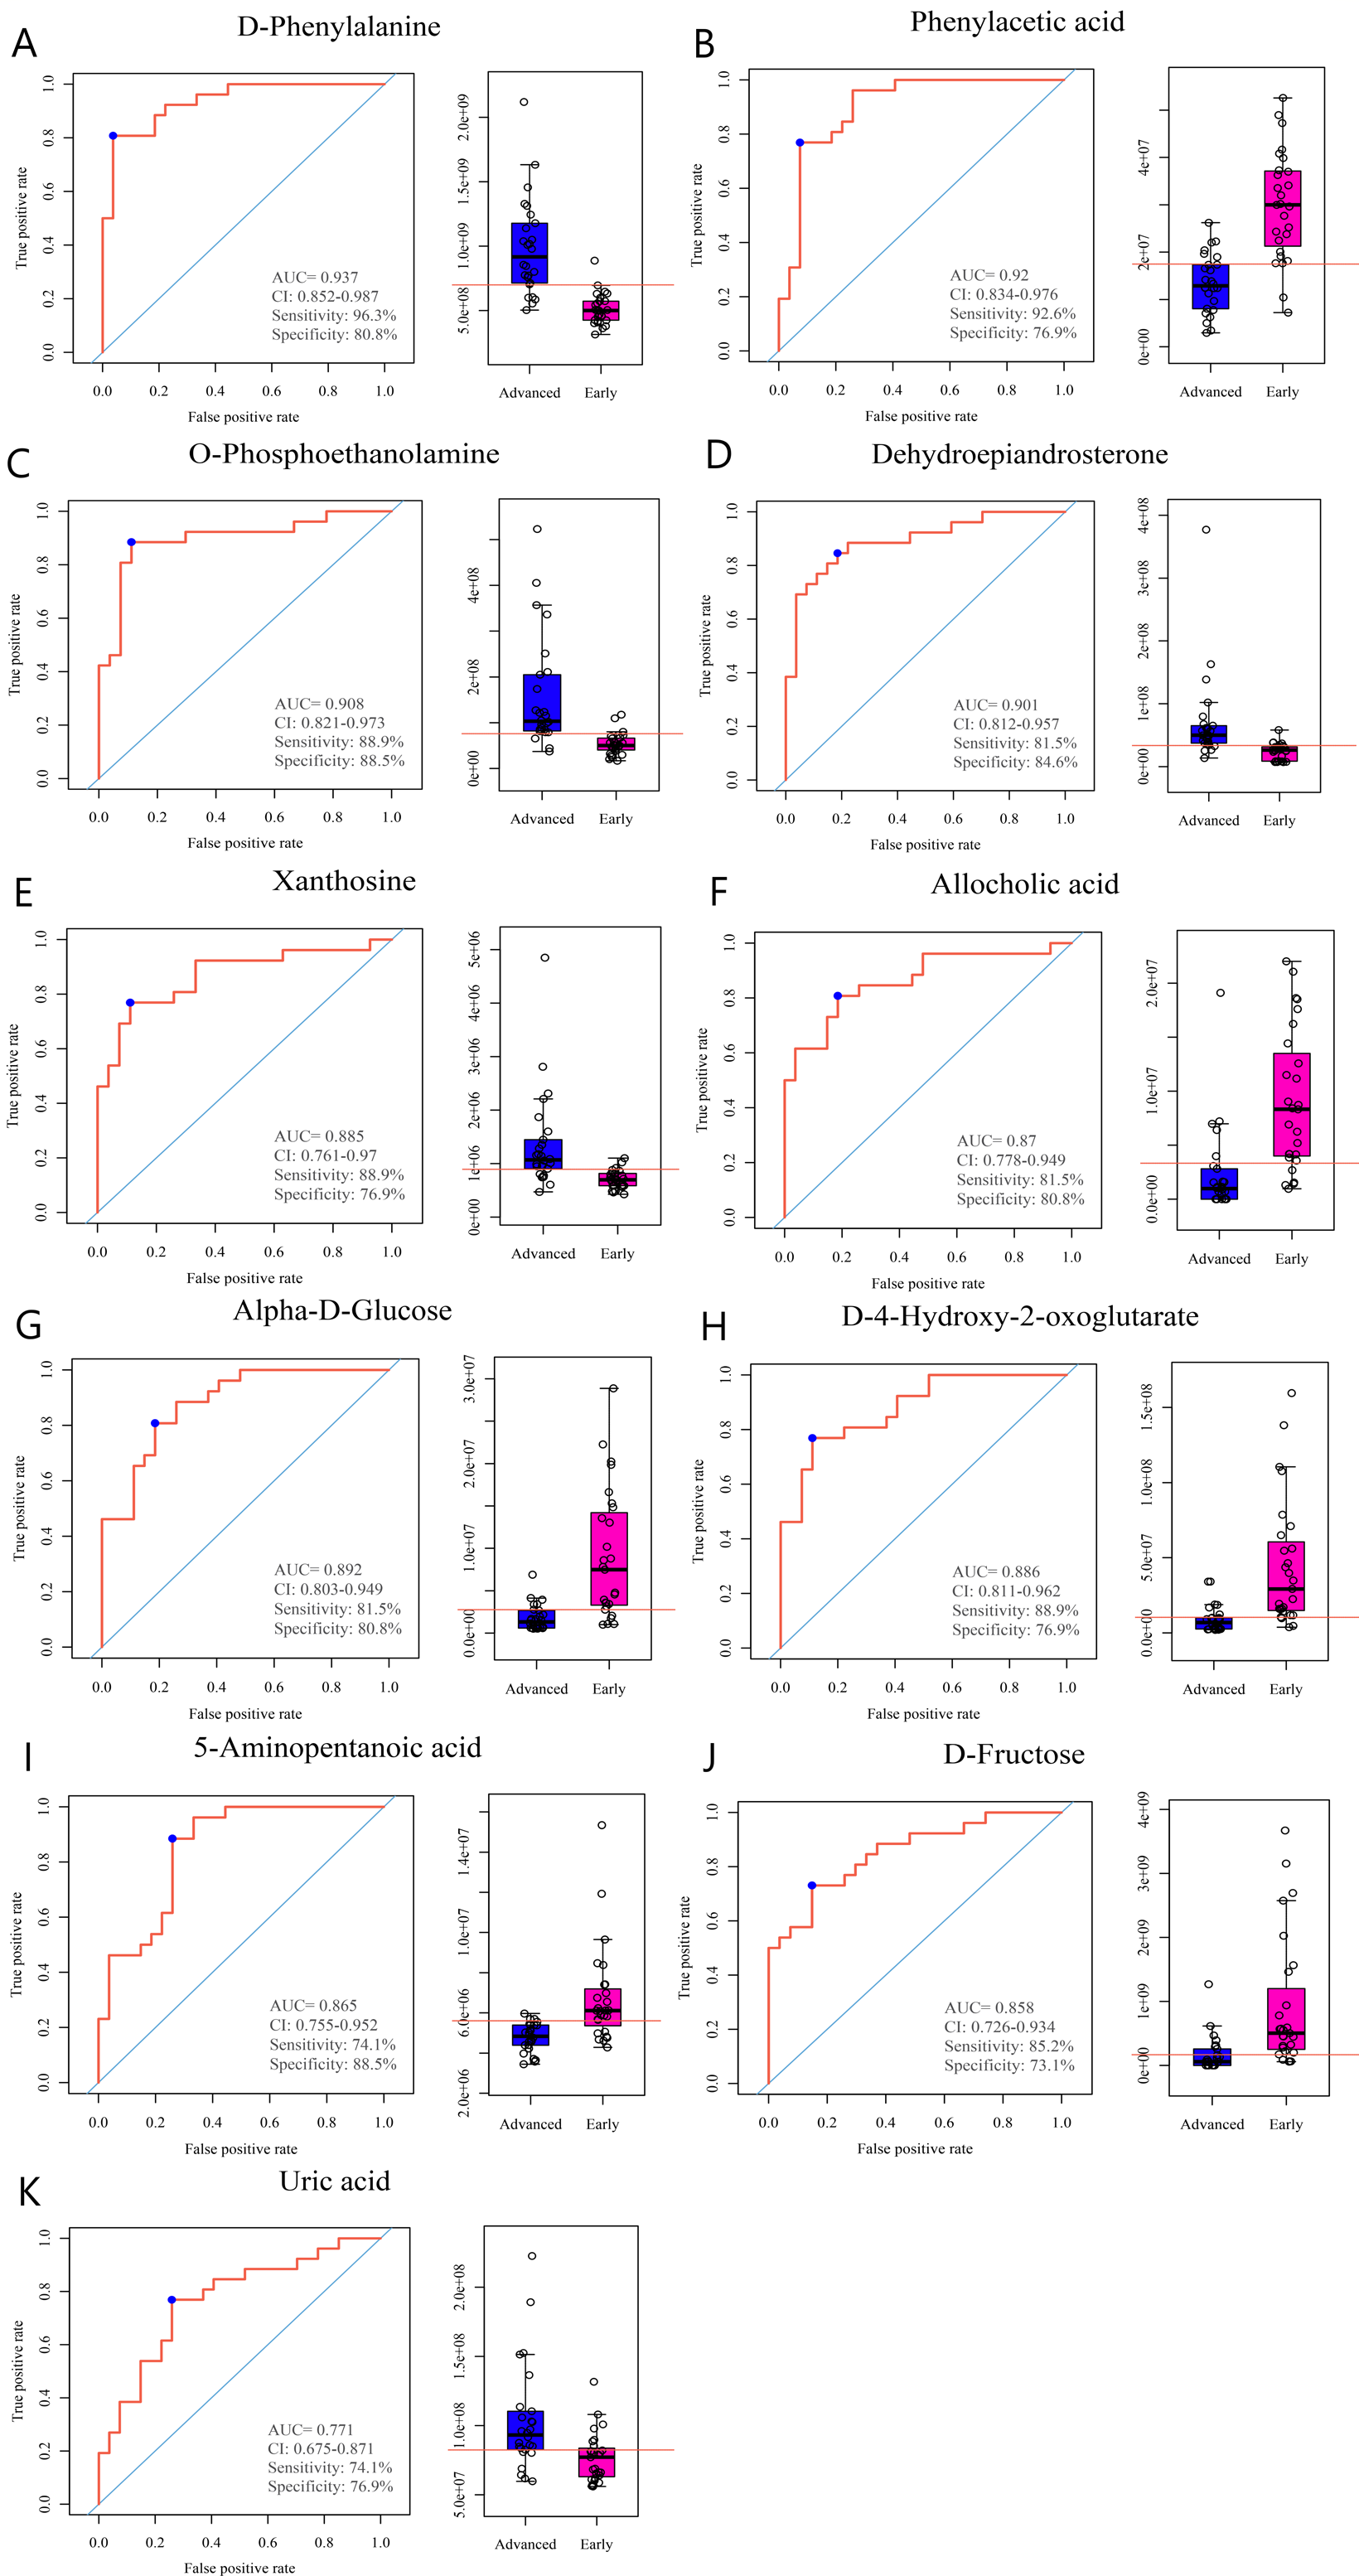
Biomarkers screened out with AUC > 0.7. (a) D-phenylalanine. (b) Phenylacetic acid. (c) o-Phosphoethanolamine. (d) Dehydroepiandrosterone. (e) Alpha-D-glucose. (f) D-4-gydroxy-2-oxoglutarate. (g) Xanthosine. (h) Allocholic acid. (i) 5-Aminopentanoic acid. (j) D-fructose. (k) Uric acid.
Pearson correlation analysis for the correlations within all differential metabolites were calculated, and a heatmap was drawn (Supplementary Figure 3). Additionally, in accordance with the criteria of the correlation coefficient (r) ≤ − 0.8 or ≥ 0.8, and P < 0.05, some differential metabolites showed apparent positive correlations. However, no significant negative correlations were identified. Among them, xanthosine and D-phenylalanine (r = 0.84, P = 2.22 × 10⁻¹⁵), and xanthosine and dehydroepiandrosterone (r = 0.90, P = 0) had apparent positive correlations with each other (Supplementary Table 5).
Biomarker metabolic pathway analysis
In this study, 59 metabolic pathways in the early and advanced groups (wherein all the differential metabolites were enriched) were analyzed by using KEGG and the MetPA database (Supplementary Figure 4). As shown in Table 1, 11 main influential metabolic pathways were identified: alanine, aspartate, and glutamate metabolism; arachidonic acid metabolism; arginine and proline metabolism; pantothenate and CoA biosynthesis; biotin metabolism; lysine degradation; cysteine and methionine metabolism; sulfur metabolism, tryptophan metabolism, and sphingolipid metabolism; and phenylalanine metabolism.
Metabolic pathways of biomarkers.
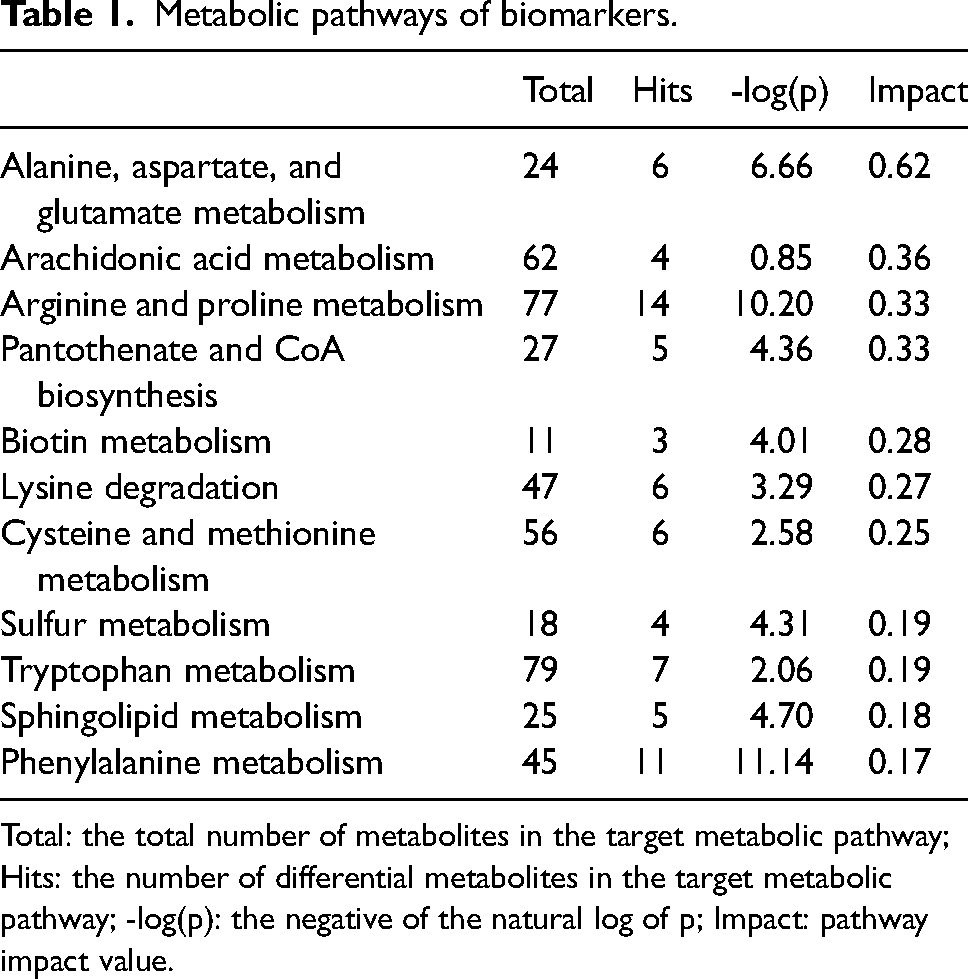
Total: the total number of metabolites in the target metabolic pathway; Hits: the number of differential metabolites in the target metabolic pathway; -log(p): the negative of the natural log of p; Impact: pathway impact value.
These results revealed that the differential metabolites mainly participated in amino acid, glucose, purine, and hormone metabolism.
Discussion
We identified 11 potential biomarkers via UPLC–MS/MS-based plasma metabolomic analysis. These biomarkers are expected to be clinically valuable tools for the diagnosis and assessment of NSCLC staging and progression. In addition, we analyzed the metabolic pathways in which these differential metabolites were mainly involved.
Amino acid metabolism
In the progression of NSCLC, tumor cells rapidly proliferate and require abundant nutrition, resulting in metabolic disturbances that inevitably cause the further progression of this disease. Numerous studies have reported significant changes in the amino acid metabolism of patients with cancer. 18 In patients with lung cancer, the concentrations of five amino acids (tryptophan, glycine, citrulline, ornithine, and proline) were obviously decreased, whereas those of phenylalanine increased.19,20 The elevated level of phenylalanine in ovarian carcinoma patients was related with cancer-related inflammation and immune activation, which lower the activity of phenylalanine (4)-hydroxylase, thus resulting in the accumulation. 21 In correspondence with similar studies, the concentration of phenylalanine was higher in the advanced group than in the early group in our study. 22 Additionally, another study demonstrated that elevated phenylalanine level was correlated with poor response in NSCLC patients treated with chemotherapy. 23 Phenylalanine is an essential amino acid 24 that cannot be synthesized by the human body and thus must be supplied via diet. In mice, a low phenylalanine-restricted diet inhibited tumor growth by decreasing oxidative phosphorylation. 25 When combined with the above results, the elevated plasma levels of phenylalanine may be associated with poor response to chemotherapy and thus result in NSCLC progression.
Simultaneously, the disorder of amino acid metabolism influences related amino acid metabolism pathways, such as alanine, aspartate, and glutamate metabolism; arginine and proline metabolism; lysine degradation; cysteine and methionine metabolism; and tryptophan metabolism. Additional investigations are needed to study the correlations between NSCLC and the preceding metabolic pathways.
Glucose metabolism
The abnormal energy metabolism of cancer cells is one of the characteristics of malignancies. 26 Warburg proposed that malignant tumor cells exhibit high levels of glycolysis despite the presence of sufficient oxygen. This metabolic phenomenon was termed “the Warburg effect,” which is manifested by high glucose uptake rates and active glycolysis.27,28 Numerous studies have shown that glucose uptake is adjusted by the facilitative glucose transporter (GLUT) family. 29 In contrast to normal lung tissues, lung tumors overexpress GLUT1, and metastatic lesions express GLUT5, a fructose-specific transporter, at high levels. 30 Glucose and fructose have a dose-dependent synergy that may support the growth of malignancies. 31 Our study discovered similar variations in glucose metabolism between the early and advanced groups.
Specifically, alpha-D-glucose and D-fructose were higher in the early group than in the advanced group. Based on the ROC analysis, the AUCs of alpha-D-glucose and D-fructose were both greater than 0.7. Combining the above conclusions, alpha-D-glucose and D-fructose were likely to be indicators for the assessment of disease progression.
A growing body of evidence has demonstrated the critical role of aerobic glycolysis in the proliferation and prognosis of NSCLC.32,33 Nevertheless, the precise mechanism of glucose metabolic alterations remains unclear. 34 Therefore, we will further investigate the key enzymes that were correlated with biomarkers in glucose metabolism.
Purine metabolism
Purine mainly exists in the form of nucleotides, which participate in energy supply, metabolism, and coenzyme composition. 35 In patients with NSCLC, rapid tumor proliferation significantly influences purine metabolism. Purine metabolism includes the conversion of hypoxanthine into xanthosine and xanthosine into uric acid by xanthosine oxidase. 36 Thus, uric acid—the final breakdown product of purine—may have a prognostic significance in NSCLC. One study found that uric acid levels were inversely related to breast cancer risk and cancer mortality but not to the risks of lung cancer. 37 Another meta-analysis revealed that the elevated levels of serum uric acid were associated with the increased risk of cancers, including lung and colon. 38 In this research, xanthosine and uric acid were both upregulated in the advanced group and had important implication for NSCLC assessment on the basis of the ROC curves.
The correlation analysis revealed that xanthosine had positive correlations with both D-phenylalanine and dehydroepiandrosterone. Therefore, we deduced that purine metabolism was positively correlated with amino acid and hormone metabolism. Additionally, the above three differential metabolites were all upregulated in the advanced group, likely suggesting their positive correlation with cancer progression. Nevertheless, further research is required for this hypothesis.
Hormone metabolism
DHEA is an androgen precursor that is synthesized and mainly secreted by the adrenal gland, plus it participates in the hypothalamic–pituitary–adrenal axis. 39 The decline in serum DHEA concentrations with increasing age has been proposed as a biomarker of aging. 40 Previous experiments have revealed that the oral administration of DHEA to mice could inhibit chemically induced lung tumors.41,42 In contrast to other studies, our study found that patients in the advanced group had a high level of DHEA. Therefore, we attributed the level difference to the following possible reasons: comorbidities that may affect hormones in patients with NSCLC; the toxicity of chemotherapy; the lack of a limitation on the patients’ ages; the relatively small sample size; and the use of a single analysis method. Thus, additional studies should be conducted on this particular result.
There were several limitations in this study. First, because this was a single-center study with rigorous inclusion criteria, the sample size was relatively small, which may result in some bias in the results. Second, we only detected and analyzed differential metabolites as indicators of NSCLC progress assessment. There were no functional trials performed for further metabolic mechanism. Third, chemotherapy may transform the metabolomic profile; while limited by the current study design, we failed to analyze this aspect. Thus, additional studies are needed to refine and further elaborate our findings.
Conclusion
Our study investigated the metabolomic changes in NSCLC patients, which have expected applications in the prediction of NSCLC progression. Our results may have implications for the future clinical management and treatment of NSCLC.
Supplemental Material
sj-docx-1-jbm-10.1177_03936155221137359 - Supplemental material for Plasma metabolomics for the assessment of the progression of non-small cell lung cancer
Supplemental material, sj-docx-1-jbm-10.1177_03936155221137359 for Plasma metabolomics for the assessment of the progression of non-small cell lung cancer by Yingtian Zhang, Yaping Cheng, Liqiang Qin, Yuanliang Liu, Sijia Huang, Liya Dai, Jialong Tao, Jie Pan, Cunjin Su and Yusong Zhang in The International Journal of Biological Markers
Supplemental Material
sj-docx-2-jbm-10.1177_03936155221137359 - Supplemental material for Plasma metabolomics for the assessment of the progression of non-small cell lung cancer
Supplemental material, sj-docx-2-jbm-10.1177_03936155221137359 for Plasma metabolomics for the assessment of the progression of non-small cell lung cancer by Yingtian Zhang, Yaping Cheng, Liqiang Qin, Yuanliang Liu, Sijia Huang, Liya Dai, Jialong Tao, Jie Pan, Cunjin Su and Yusong Zhang in The International Journal of Biological Markers
Supplemental Material
sj-docx-3-jbm-10.1177_03936155221137359 - Supplemental material for Plasma metabolomics for the assessment of the progression of non-small cell lung cancer
Supplemental material, sj-docx-3-jbm-10.1177_03936155221137359 for Plasma metabolomics for the assessment of the progression of non-small cell lung cancer by Yingtian Zhang, Yaping Cheng, Liqiang Qin, Yuanliang Liu, Sijia Huang, Liya Dai, Jialong Tao, Jie Pan, Cunjin Su and Yusong Zhang in The International Journal of Biological Markers
Supplemental Material
sj-docx-4-jbm-10.1177_03936155221137359 - Supplemental material for Plasma metabolomics for the assessment of the progression of non-small cell lung cancer
Supplemental material, sj-docx-4-jbm-10.1177_03936155221137359 for Plasma metabolomics for the assessment of the progression of non-small cell lung cancer by Yingtian Zhang, Yaping Cheng, Liqiang Qin, Yuanliang Liu, Sijia Huang, Liya Dai, Jialong Tao, Jie Pan, Cunjin Su and Yusong Zhang in The International Journal of Biological Markers
Supplemental Material
sj-docx-5-jbm-10.1177_03936155221137359 - Supplemental material for Plasma metabolomics for the assessment of the progression of non-small cell lung cancer
Supplemental material, sj-docx-5-jbm-10.1177_03936155221137359 for Plasma metabolomics for the assessment of the progression of non-small cell lung cancer by Yingtian Zhang, Yaping Cheng, Liqiang Qin, Yuanliang Liu, Sijia Huang, Liya Dai, Jialong Tao, Jie Pan, Cunjin Su and Yusong Zhang in The International Journal of Biological Markers
Supplemental Material
sj-docx-6-jbm-10.1177_03936155221137359 - Supplemental material for Plasma metabolomics for the assessment of the progression of non-small cell lung cancer
Supplemental material, sj-docx-6-jbm-10.1177_03936155221137359 for Plasma metabolomics for the assessment of the progression of non-small cell lung cancer by Yingtian Zhang, Yaping Cheng, Liqiang Qin, Yuanliang Liu, Sijia Huang, Liya Dai, Jialong Tao, Jie Pan, Cunjin Su and Yusong Zhang in The International Journal of Biological Markers
Supplemental Material
sj-docx-7-jbm-10.1177_03936155221137359 - Supplemental material for Plasma metabolomics for the assessment of the progression of non-small cell lung cancer
Supplemental material, sj-docx-7-jbm-10.1177_03936155221137359 for Plasma metabolomics for the assessment of the progression of non-small cell lung cancer by Yingtian Zhang, Yaping Cheng, Liqiang Qin, Yuanliang Liu, Sijia Huang, Liya Dai, Jialong Tao, Jie Pan, Cunjin Su and Yusong Zhang in The International Journal of Biological Markers
Supplemental Material
sj-pdf-8-jbm-10.1177_03936155221137359 - Supplemental material for Plasma metabolomics for the assessment of the progression of non-small cell lung cancer
Supplemental material, sj-pdf-8-jbm-10.1177_03936155221137359 for Plasma metabolomics for the assessment of the progression of non-small cell lung cancer by Yingtian Zhang, Yaping Cheng, Liqiang Qin, Yuanliang Liu, Sijia Huang, Liya Dai, Jialong Tao, Jie Pan, Cunjin Su and Yusong Zhang in The International Journal of Biological Markers
Footnotes
Author contributions
Yingtian Zhang: data curation, writing—original draft. Yaping Cheng: project administration, investigation. Liqiang Qin: resources, project administration. Yuanliang Liu: data curation, formal analysis. Sijia Huang: formal analysis, validation. Jialong Tao: resources, visualization. Liya Dai: resources, software. Jie Pan: methodology, writing—review and editing. Cunjin Su: conceptualization, methodology, writing—review and editing, supervision. Yusong Zhang: investigation, conceptualization, project administration, funding acquisition. Yingtian Zhang and Yaping Cheng contributed equally to this work.
Ethics approval
Ethical approval to report this case was obtained from the Second Affiliated Hospital of Soochow University Ethics Committee (ethics approval number ECSU-2015-0002).
Informed consent
Written informed consent was obtained from the patients for their anonymized information to be published in this article.
Data availability statement
Raw data are available by contact to the corresponding authors. (panzy1122@163.com (J. Pan), sucjgh@vip.163.com (CJ. Su), zhangyusong19@163.com (YS. Zhang)).
Declaration of conflicting interests
The author(s) declared no potential conflicts of interest with respect to the research, authorship, and/or publication of this article.
Funding
The author(s) disclosed receipt of the following financial support for the research, authorship, and/or publication of this article: This work was supported by the Natural Science Foundation of the Jiangsu Higher Education Institutions of China, the second affiliate hospital of Soochow university science and technology innovation team project funding, import team of hepatobiliary and pancreatic surgery project funding, the project of State key laboratory of radiation medicine and protection, (grant number 21KJB310006, XKTJ-TD202009, XKTJ-RC202013, XKTJ-XK202010, SZYJTD201803, GZK1202007)
Supplemental material
Supplemental material for this article is available online.
References
Supplementary Material
Please find the following supplemental material available below.
For Open Access articles published under a Creative Commons License, all supplemental material carries the same license as the article it is associated with.
For non-Open Access articles published, all supplemental material carries a non-exclusive license, and permission requests for re-use of supplemental material or any part of supplemental material shall be sent directly to the copyright owner as specified in the copyright notice associated with the article.