
Abstract
Motivation:
The precise diagnosis of the major subtypes, lung adenocarcinoma and lung squamous cell carcinoma, of non-small-cell lung cancer is of practical importance as some treatments are subtype-specific. However, in some cases diagnosis via the commonly-used method, that is staining the specimen using immunohistochemical markers, may be challenging. Hence, having a computational method that complements the diagnosis is desirable. In this paper, we propose a gene signature for this purpose.
Results:
We developed an expression-based method that systematically suggests a huge set of candidate gene signatures and finds the best candidate. By applying this method to a training set, the optimal gene signature was found by considering close to 765 billion candidate signatures. The 8-gene signature found for classifying the 2 aforementioned subtypes comprises TP63, CALML3, KRT5, PKP1, TESC, SPINK1, C9orf152, and KRT7. The signature achieved a high overall prediction accuracy of 0.936 when tested using 34 independent gene expression datasets obtained using different technologies and comprising 2556 adenocarcinoma and 1630 squamous cell carcinoma samples. Additionally, the signature performed well in clinically challenging cases, that is poorly differentiated tumors and specimens obtained from biopsies. In comparison with 2 previously reported signatures, our signature performed better in terms of overall accuracy and especially accuracy of classifying lung squamous cell carcinoma.
Conclusions:
Our signature is easy to use and accurate regardless of the technology used to obtain the gene expression profiles. It performs well even in clinically challenging cases and thus can assist pathologists in diagnosis of the ambiguous cases.
Introduction
Lung cancer has been historically divided into 2 main types: small-cell lung carcinoma and non-small-cell lung carcinoma (NSCLC), which accounts for approximately 80% of lung cancers. 1 NSCLC has 2 major subtypes, that are lung adenocarcinoma (LUAD) and squamous cell carcinoma (LUSC). 2 Over the past decade or so several therapeutic options have been discovered that can only be used to treat patients with specific NSCLC subtypes. 3 This has elevated the importance of precise diagnosis of LUAD and LUSC. Such diagnoses are usually done using immunohistochemistry.3,4 However, since in most cases a small specimen obtained using a biopsy is used for diagnosis, 2 precise classification of these subtypes may be difficult in some patients, especially in poorly differentiated cases. 5 Thus, having a computational tool to complement diagnosis through immunohistochemistry can be beneficial. Additionally, such a computational method may be helpful in discovering new markers for immunohistochemical diagnosis of LUAD/LUSC 6 and possibly even shed light on the differences of the 2 subtypes at the molecular level. For these reasons, several expression-based methods have recently been proposed to find gene signatures that can be used to distinguish LUAD and LUSC samples. In the following paragraphs we briefly summarize some of the previously published studies on this topic.
Employing differential gene expression analysis, Hou et al 7 identified a 50-gene signature for LUAD/LUSC classification and tested it on one independent dataset. Using a method based on the nearest shrunken centroid classification algorithm, Charkiewicz et al 8 discovered a 53-gene signature for LUAD/LUSC classification and tested it on a single dataset. Huang et al 9 employed 3 different methods and reported high classification accuracies for the 3 methods. Employing a machine learning algorithm and using microarray data for training, Wu et al 10 discovered a 5-gene signature and tested their method/signature on RNA-Seq data from The Cancer Genome Atlas (TCGA). Su et al 11 used a few machine learning algorithms and discovered different signatures with different numbers of genes. They showed that a 13-gene signature, found using a random forest algorithm, performed best and had a good performance when applied to the TCGA data.
The methods mentioned above tested their signatures on 1 or 2 independent datasets. However, a signature obtained using a particular dataset may not perform well when applied to others. This is because, due to batch effects, the expression data obtained using different platforms/technologies are generally not comparable to each other. Fortunately, the within-sample relative gene expression orderings are not expected to be affected by the batch effects. 6 Thus, one can discover a gene signature with a robust performance consisting of a pair of genes whose expression levels switch ordering between LUAD and LUSC. Using this idea, Li et al 6 found a signature comprising 2 genes KRT5 and AGR2, and classified a sample as LUAD (LUSC) if the expression level of KRT5 was lower (higher) than that of AGR2. Li et al discovered their signature by considering sets of 2 oppositely regulated genes, that is 1 significantly up- and 1 significantly down-regulated genes. (Here, and in the rest of the paper, down/up-regulated means lower/higher expression level in LUAD in comparison with LUSC). Girard et al 5 also proposed a signature consisting of 21 pairs of oppositely regulated genes. However, they used a correlation-based scoring system to classify LUAD versus LUSC, that is they classified a sample as LUAD if its 42-gene expression profile had a higher correlation with the mean expression profile of LUAD than with that of LUSC (a nearest neighbor approach). The 42-gene signature of Girard et al performed well when tested on many datasets.
Some of the aforementioned methods have achieved high classification accuracy (ACC), defined as the number of correct diagnoses divided by the total number of patients. However, improvement is still desirable and helpful as even a modest increase in diagnosis accuracy could have major implications for some patients in terms of treatment. On the other hand, signatures with fewer genes (but with the same high accuracy) are more helpful for finding new drug targets because they narrow down the candidate genes. Therefore, it is desirable to find a new signature with high accuracy and a smaller number of genes.
In this paper we report a simple gene selection approach for discovering a more accurate signature that comprises the same number of highly up- and down-regulated genes. The method of discovery, which is explained in detail in Methods, is summarized as follows. First, using a training set, we identified the list of highly differentially expressed genes (HDEGs) between LUAD and LUSC. We then ranked the
We tested our 8-gene signature using 34 additional datasets (including the TCGA data; see Table 1) comprising 2556 (1630) LUAD (LUSC) samples and observed an overall high classification accuracy of 0.936. The signature performed well in cases that might be clinically difficult to classify, that is poorly differentiated samples and specimens obtained from biopsies. A comparison between our signature with those of Girard et al 5 and Li et al, 6 indicated that our signature outperforms both signatures in terms of overall prediction accuracy and especially prediction accuracy of LUSC, while having a smaller number of genes in comparison with the signature of Girard et al. Based on these results we believe our signature can assist pathologists in diagnosis of LUAD/LUSC.
Datasets used in this study.

GSE41271 was used for training.
These datasets include information regarding the degree of differentiation of at least some of the samples.
Samples obtained from biopsies.
Formalin fixed paraffin-embedded (FFPE) samples.
Methods
Experimental data
TCGA12,13 data (raw counts) for LUAD and LUSC primary tumors were downloaded from the data portal of the Genomic Data Commons (https://portal.gdc.cancer.gov/) of the National Cancer Institute. 14 For very rare cases in which multiple tumor samples were available for the same patient, we used only one of the tumor samples. Genes with zero counts across all samples were removed. However, since the data still contained many zeros, a pseudocount of 1 was added to the raw counts before normalization (using DESeq2 15 ) and log-transformation.
Additional LUAD/LUSC datasets were found by either searching the Gene Expression Omnibus (GEO) database
16
directly, or by searching the previously published literature on this topic. Initially, we searched for datasets including at least
The dataset GSE41271 18 was employed for training and the rest of the datasets were used for testing. We chose GSE41271 as the training set because it is the largest dataset (containing both LUAD and LUSC samples) among the GEO datasets we found. Since, among the identified 34 datasets, TCGA is the only one containing samples obtained from RNA-Seq, we did not use it as the training set to be able to test our signature on RNA-Seq as well as microarray data. Consisting of 183 LUAD and 80 LUSC samples, our training set may seem too small compared to the testing set (comprising 2556 LUAD and 1630 LUSC samples). However, classifiers trained on too-small datasets are usually overtrained, that is their prediction accuracy for the testing set is significantly lower than that for the training set. As we show in the Results section, we observed almost equal accuracies for the training and testing sets, indicating the appropriateness of the size of the training set. To provide further support for the suitability of our training set, we also note that the previously published signatures (that have been tested on a large number of samples) have used the same, 5 or a smaller training set. 6
Sample scoring and classification
This section describes how we score and classify samples provided a gene signature is given. The gene selection procedure, that is the method we used for discovering the optimal
The score defined above can be calculated in a simpler manner. To this end, let us also introduce the centered expression vector

where
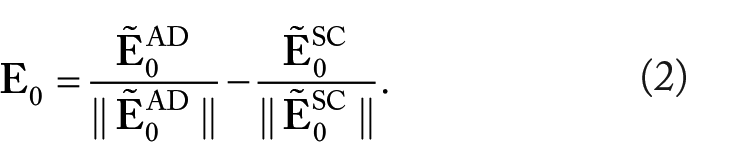
In other words, equation (1) is equivalent to the scoring method of Girard et al.
5
However, it has the advantage of introducing only one reference expression (
Finding the gene signature
A 2-step gene selection procedure was employed to find the optimal gene signature. The required steps, which are explained below, are depicted in Figure 1.

The signature discovery procedure. The steps taken to find the best performing
Identifying and ranking HDEGs
Given the expression profiles of LUAD and LUSC samples in the training dataset, a gene was considered an HDEG if: (1) there was a statistically significant difference between the log-transformed expression levels of the gene in LUAD and LUSC and (2) the absolute value of this difference was larger than 2 (ie, there was a larger than 4 fold change). Specifically, for each gene, we first used the Wilcoxon rank-sum test to assess the statistical significance of differential expression (comparing the log-transformed expression levels of the gene in the LUAD samples with those in LUSC samples). The Benjamini-Hochberg
19
procedure was then employed to correct for multiple hypotheses testing with an FDR cutoff of
Searching for the
-gene signature with the highest ACC
The most statistically significant HDEGs are expected to have the most discriminative power. Thus, we chose the top
Results
Finding the gene signature
We employed the approach described in Methods for discovering a gene signature comprising equal numbers of up- and down-regulated genes. Using GSE41271 dataset as the training set, we first identified
The maximum achieved ACC (for the training dataset) is plotted as a function of
The 8 genes in the signature and their corresponding weights, FDRs, and fold changes.
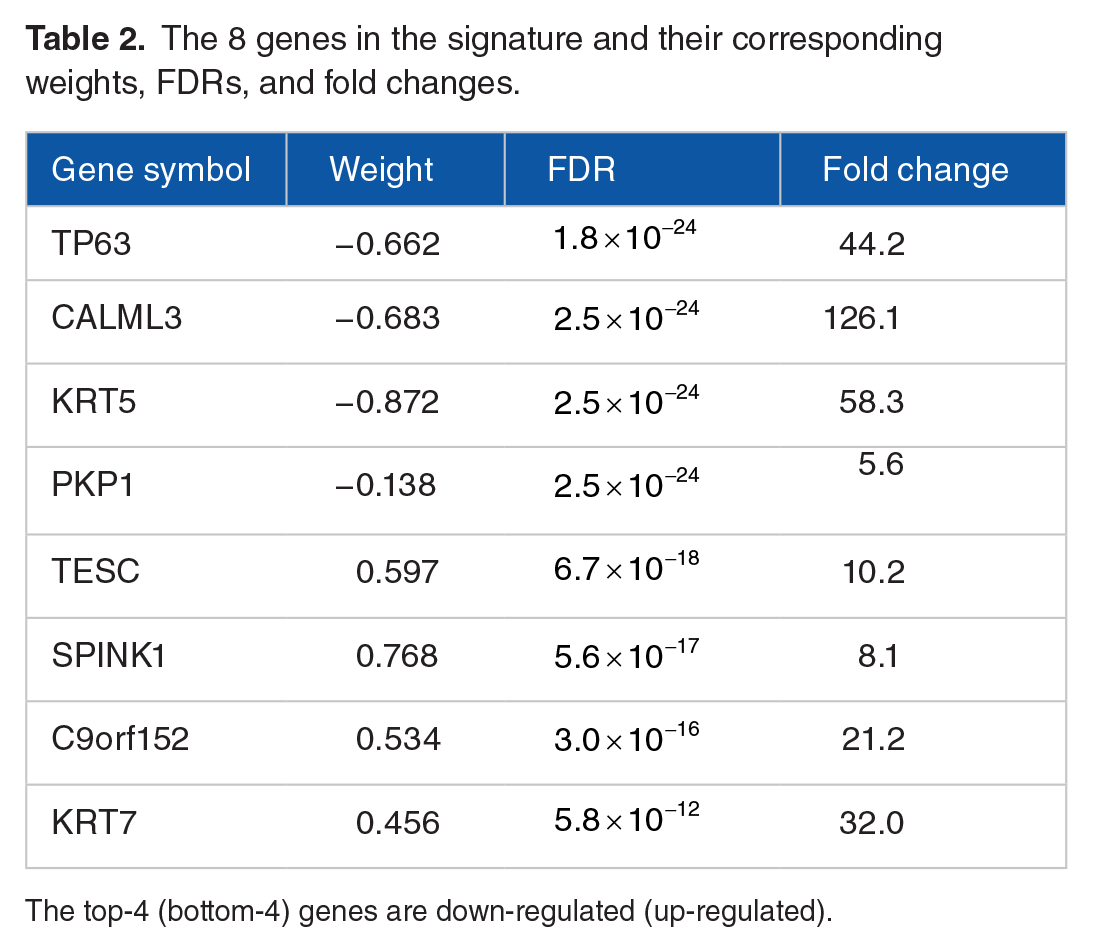
The top-4 (bottom-4) genes are down-regulated (up-regulated).
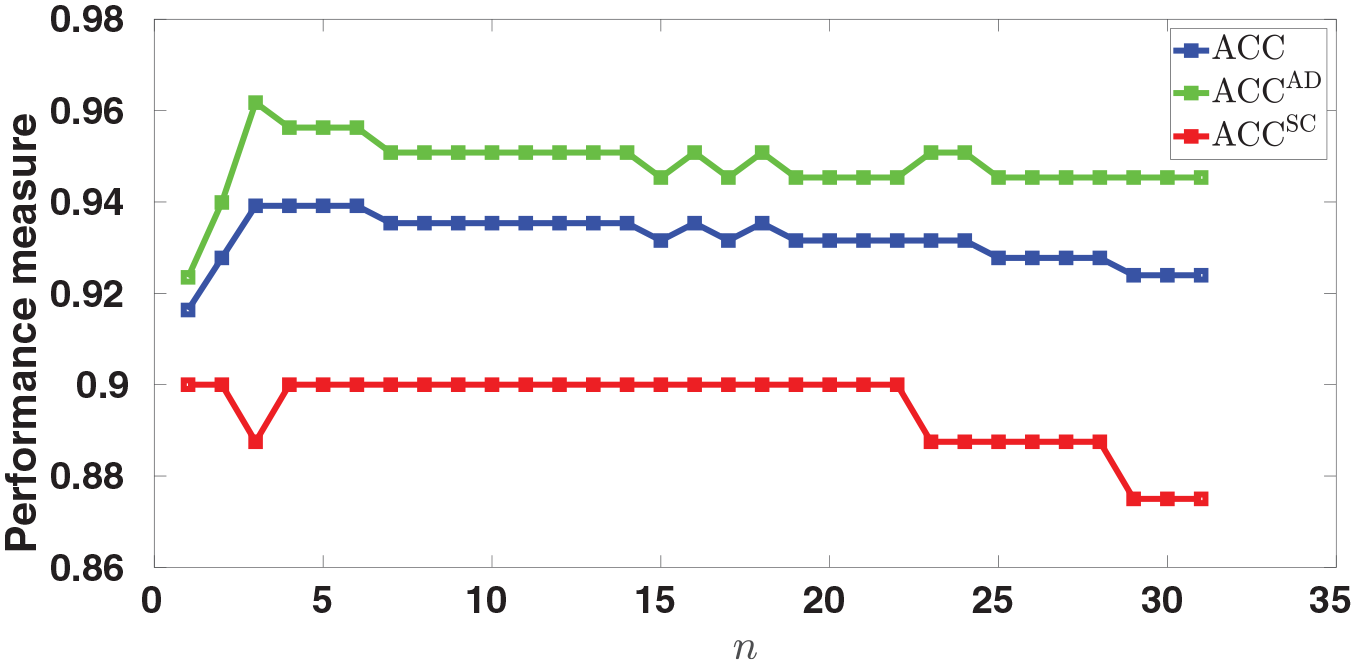
Finding the signature. The maximum achieved ACC is plotted as a function of
Biological relevance of the signature
To provide evidence supporting the relevance of the identified 8 genes to lung cancer, we first conducted a literature search trying to find publications relating these genes to this cancer. We found that 5 out of the 8 genes (TP63, KRT5, CALML3, PKP1, and SPINK1) were among the list of known lung cancer genes reported by Girard et al. 5 On other hand, KRT7 has been found to be a biomarker of LUAD. 20 Additionally, it has been reported that elevation of TESC in NSCLC intensifies cancer stem cell properties and inactivation of TESC has been suggested as a way to improve current therapeutic strategies for lung cancer. 21 Also, 2 of the genes (KRT5 and TP63) are routinely used for immunohistochemical diagnosis of LUAD/LUSC, 5 and CALML3 has been recently shown to perform as well as the commonly used immunohistochemical markers. 4 We did not find literature support for involvement of C9orf152 in NSCLC. However, this does not mean that C9orf152 has no role in this cancer. Our method/signature suggests C9orf152 as a potentially new lung cancer gene to be investigated experimentally.
As an indirect evidence of biological relevance of our signature, we looked at the relation between the scores of the samples and their degrees of differentiation (tumor grades). Among datasets used in this study (Table 1), there are 15 datasets reporting tumor grades for some or all samples. Since these datasets have too few samples with certain grades, to increase statistical power, we pooled the data together and formed 2 combined datasets one for LUAD and one for LUSC. Numerical values were then assigned to the tumors based on their grades, that is 1 for “poorly differentiated,” 2 for “moderate to poorly differentiated,” 3 for “moderately differentiated,” 4 for “moderate to well differentiated,” and 5 for “well differentiated.” For LUAD and LUSC respectively the number of samples in each category is given in Supplemental Tables S2 and S3. We then calculated the rank correlation, measured by Kendall’s
The overlap between our signature and those reported in the literature (see Introduction) was also investigated. We found that our signature shares KRT5/TP63/PKP1/CALML3/TESC/SPINK1 with the 42-gene signature of Girard et al, 5 KRT5 with the 2-gene signature of Li et al, 6 KRT5/TESC/KRT7 with the 53-gene signature proposed by Charkiewicz et al, 8 KRT5 with the 5-gene signature of Wu et al, 10 CALML3 with the 13-gene signature discovered by Su et al, 11 and CALML3/PKP1/TP63 with the 50-gene signature of Hou et al. 7
Testing the gene signature
The 8-gene signature was tested on 34 independent datasets, that is all datasets in Table 1 except for GSE41271 that was used for training. Specifically, we employed our signature (Table 2) in conjunction with equation (1) to score all samples in the 34 testing datasets. In some samples, the expression values for some of the 8 genes were missing. Thus, we ignored such genes when calculating the score of samples with missing expression values. In other words, the correlations were calculated using only genes in the signature that were also present in the sample being classified. The scores were then used to classify the samples and the 3 performance measures, that is ACC,
Overall performance
The 3 performance measures, plotted in Figure 3, and given in Supplemental Tables S4-S6, indicate overall good performance across all datasets, although some variability in the performance measures is observed (we address this issue below). To get a better sense of the overall performance of the signature, we pooled the scores of all samples from all testing datasets. Such integration, which has also been done by Girard et al
5
and Li et al,
6
is possible because the scores are correlation-based, and so they are comparable across different datasets. The distributions of LUAD and LUSC scores of all samples in the testing data are shown in Figure 4. The figure shows that a threshold of zero generally works well although the 2 distributions have long tails. The pooled scores were used to compute the overall performance measures that were

Testing the signature. The performance of the 8-gene signature, measured by ACC,

Distribution of scores. For the 2 subtypes, the distributions of the scores of the samples in the testing set are shown. The cutoff of zero works well for the vast majority of samples.
Although Figure 3 shows good performance across all datasets, some variability in
Variability in the results has also been reported by other studies that have tested their signature on multiple datasets.5,6 In fact, the variability in our results is smaller than those reported in these studies (see Girard et al 5 and Li et al 6 and the “Performance comparison” section).
All
For datasets containing a small number of samples, low accuracy may be just due to chance. For example, GSE21933 contains only 11 LUAD samples. Our signature correctly classified 9 out of 11 resulting in
Poorly differentiated cases
Poorly differentiated samples are sometimes difficult to classify using immunohistochemistry, and so it is particularly important to assess the performance of our signature when these samples are concerned. We used the 15 aforementioned datasets containing tumor grade information for this assessment (see Table 1 and Supplemental Tables S2 and S3). Specifically, we partitioned the samples in these datasets into 2 groups with the poorly differentiated samples in the first group (containing 326 / 174 LUAD/LUSC samples), and the rest of the samples in the second group (containing 560 / 268 LUAD/LUSC samples). The proposed signature was then employed to classify the samples in both groups. The results, shown in Figure 5, indicate lower

Poorly differentiated samples vs. not-poorly differentiated samples. The figure compares the performances of the signature in the 2 cases of poorly and not-poorly differentiated samples. The ACC is slightly lower for the poorly differentiated samples, but is still good.
Among the poorly differentiated samples, the 23 (19 LUAD and 4 LUSC) samples from GSE94601 are of particular interest because they were reclassified (from large cell lung carcinoma) as LUAD/LUSC according to WHO2015 criteria,
22
whereas the rest of the samples were classified using WHO2004 criteria. Thus, the performance of the signature was also assessed specifically for these 23 samples. The signature correctly classified all 19 LUAD samples (
Specimens obtained from biopsies
Specimens obtained from biopsies are sometimes difficult to classify clinically. We found only one publicly available dataset containing such samples that is GSE58661. The rest of datasets have been obtained using surgical resection. As seen from Figure 3 and Supplemental Tables S4-S6, the signature performed well in classifying these samples with
FFPE specimens
Two of the datasets included in this study contain FFPE samples: GSE29013 and GSE44170. Our signature performed very well when applied to GSE29013 with
Discrepant cases
Our 8-gene signature achieved an overall high ACC when applied to the testing set. However, there were some discrepant cases for which classification using our signature did not agree with the reported classification by pathologists. To understand how the discrepant (misclassified) samples differ from the correctly classified ones, we looked at the expression levels of the LUAD markers NKX2-1 and NAPSA as well as those of the LUSC markers KRT5 and TP63. These genes were chosen because they are among the best markers for immunohistochemical diagnosis of LUAD/LUSC.5,22,23 Note that since the expression levels of a gene in different datasets may not be comparable, the samples from different datasets were not pooled for this analysis, that is each dataset was analyzed separately. For each of the 34 testing datasets, the samples were grouped in 4 sets: (1) correctly classified LUAD samples (LUAD-confirmed), (2) misclassified LUAD samples (LUAD-missed), (3) correctly classified LUSC samples (LUSC-confirmed), and (4) misclassified LUSC samples (LUSC-missed). In all datasets (except TCGA) at least one of the misclassified sets included too few (fewer than 10) samples for a reliable analysis. Thus, to have a reliable statistical significance assessment, we limited this analysis to the TCGA data with 20 LUAD and 29 LUSC misclassified samples. Specifically, the expression levels of the aforementioned 4 marker genes were compared in the 4 groups formed from the TCGA data. The results of these comparisons are given in Figure 6 and the corresponding p-values, calculated using the Wilcoxon rank-sum test, are given in Supplemental Table S7.
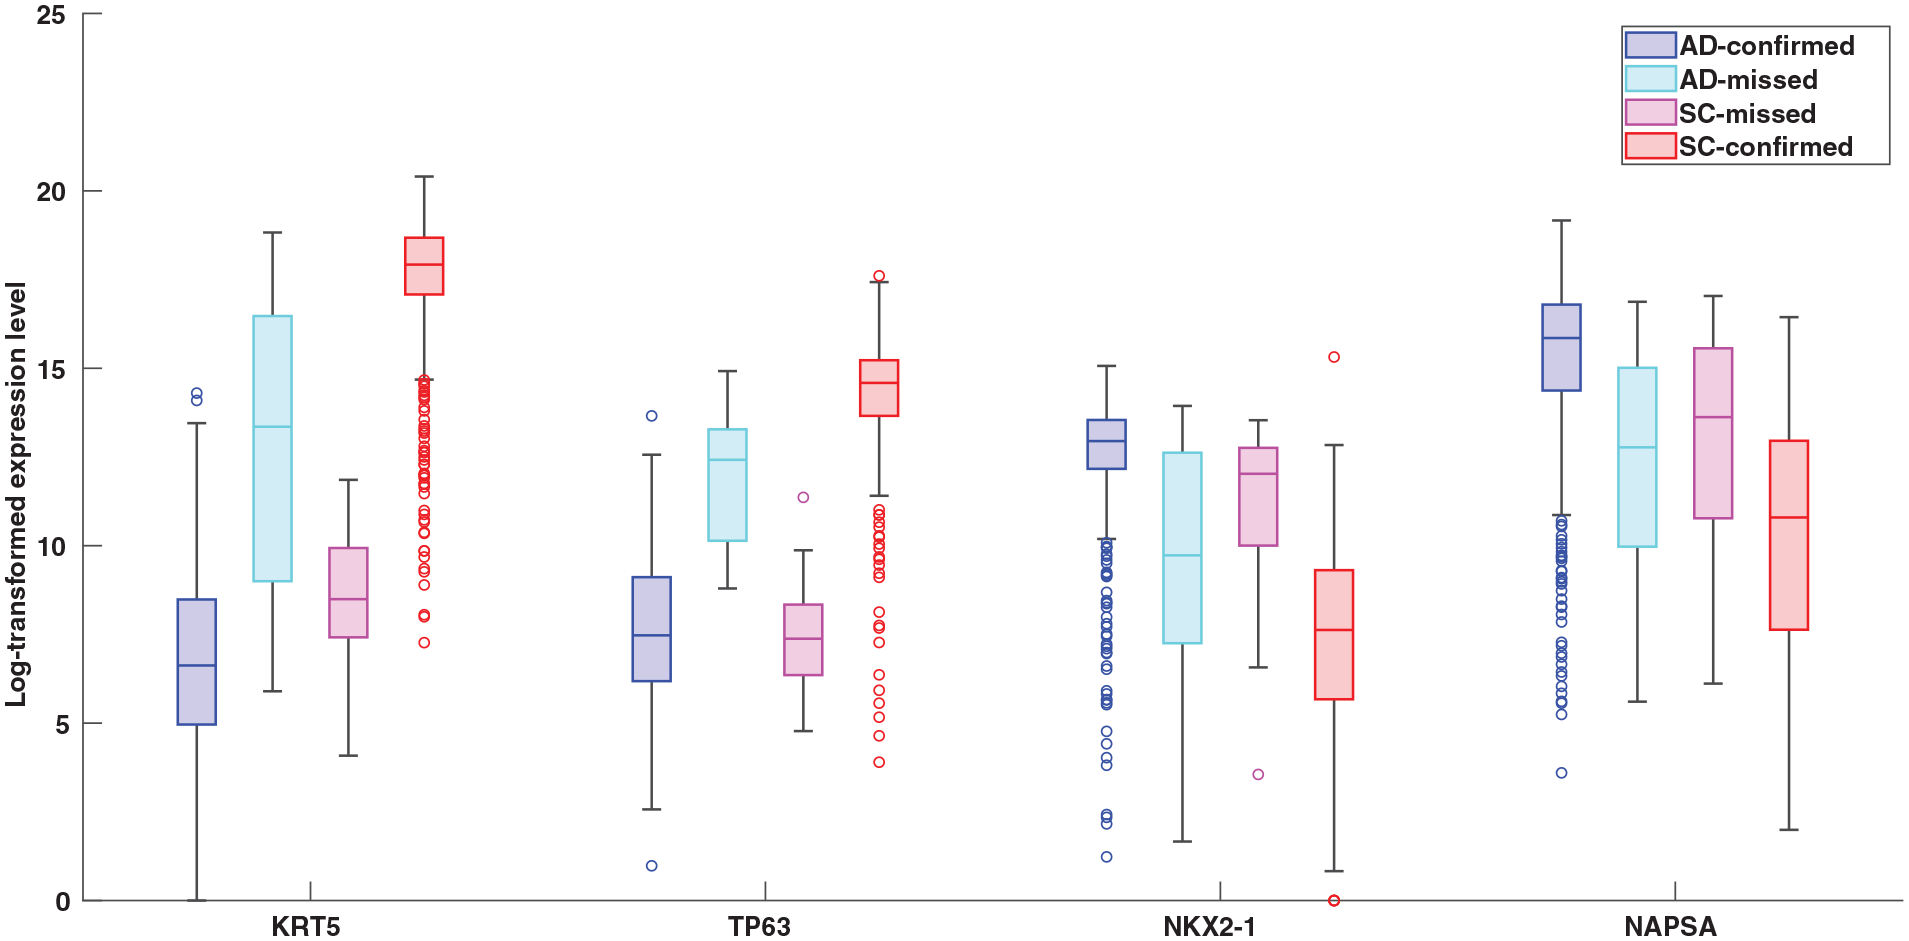
Boxplots comparing the expression levels of LUAD and LUSC markers in the TCGA data. The expression levels of KRT5, TP63, NKX2-1, and NAPSA are compared among 4 sets of samples: LUAD-confirmed, LUAD-missed, LUSC-missed, and LUSC-confirmed. The circles show the outliers.
As expected, Figure 6 shows that the expression levels of LUAD markers (NKX2-1, NAPSP) are higher in the LUAD-confirmed set than those in the LUSC-confirmed set. Conversely, the figure indicates LUSC markers (KRT5, TP63) have higher expression levels in the LUSC-confirmed set compared with those in the LUAD-confirmed set. Expectedly, these differences are highly statistically significant with the P-values being smaller than
It is important to note that, although KRT5, TP63, NKX2-1, and NAPSP are among the best markers for immunohistochemical diagnosis, the expression level of any one of these genes cannot be individually used as a computational tool for reliable classification. This is because: (1) as shown in the figure, there are many outliers (circles in the figure), and more importantly (2) classification requires a cutoff, and a universal cutoff that works well for different datasets is not possible to find because of batch effects. That is why our approach uses a signature comprising multiple pairs of oppositely regulated genes.
Performance comparison
We compared the performance of our 8-gene signature with those of the signatures proposed by Girard et al
5
and Li et al.
6
These 2 signatures were chosen for a couple of reasons. First, they are the only ones among signatures cited in this paper that have been tested on multiple datasets. Second, the signature (and classification method) of Girard et al
5
is the most accurate we have seen and that of Li et al
6
uses the lowest number of genes reported in the literature. Finally, like our signature, these 2 contain the same number of up- and down-regulated genes. We used the 34 testing datasets and computed the ACCs,
Comparison with the signature of Girard et al
The performance measures for both signatures were calculated for all samples as well as all poorly differentiated samples using the pooled scores and the results are given in Table 3. As the table indicates, when considering all samples, our signature performs better than Girard’s in terms of
Comparison with the signature of Girard et al.

Abbreviation: PD, poorly differentiated.
For each category, the number of LUAD and LUSC samples are respectively given in parentheses.
The improvements reported in Table 3 are modest, but one should keep in mind that: (1) given the large number of lung cancer patients, even a modest improvement can help some patients in terms of getting the right treatment, and (2) our signature includes significantly fewer genes than that of Girard’s (8 vs 42). Additionally, when applied to individual datasets, our signature performs more robustly than Girard’s, resulting in less variable
Comparison with the signature of Li et al
We followed the same procedure to compare the performance of our signature with that of Li et al. However, since GSE30219 and GSE18842 were used by Li et al. to train their model, these datasets were excluded. Three additional samples were excluded because Li’s signature was not able to classify them due to missing expression values. The performance comparison results are given in Table 4. As indicated in the table, there are no differences in the performance measures for FFPE and biopsy samples. Considering all samples, however, the signature proposed in this paper outperforms Li’s signature in terms of
Comparison with the signature of Li et al.

Abbreviation: PD, poorly differentiated.
For each category, the number of LUAD and LUSC samples are respectively given in parentheses.
Discussion
Although in most cases pathologists can easily distinguish LUAD from LUSC, the classification is sometimes difficult especially in poorly differentiated tumors and when biopsy is used to obtain the specimen. As a result many patients are not diagnosed with a specific subtype or are misdiagnosed. The fact that re-examination of the specimens sometimes results in re-classification provides evidence for possible misdiagnoses. 5 Since proper treatment depends on precise classification, such misdiagnoses can have important implications for many patients. A computational method to help pathologists better classify the NSCLC subtypes (in challenging cases) is thus beneficial.
To accurately distinguish LUAD from LUSC, in this paper we propose an 8-gene signature identified using a simple gene selection method in conjunction with a correlation-based nearest neighbor classification approach. The approach is based on the observation that the relative orderings of expression levels are not affected by batch effects, which suggests a signature containing both highly up- and down-regulated genes in conjunction with the correlation-based scoring is likely to perform well across different datasets.
6
On the other hand, genes with more statistically significant fold changes are expected to be more discriminative for classifying LUAD versus LUSC. Thus, we devised a discovery method in which the signature has
In this approach the two-halves of the signature are treated differently, that is the first half is fixed while the second half is chosen assuming the first half is present in the signature. To explain why this approach works, we note that the expression level of each high-ranking gene in a ranked list of HDEGs can be used to classify the samples (by ranking the samples using the expression levels, and applying an appropriate cutoff). With this approach even a single high-ranking gene can have a high discriminative power. 4 However, such a 1-gene signature is not ideal, because in practice the cutoff is generally dataset-dependent due to batch effects. The remedy is to add a highly oppositely regulated gene, making a 2-gene signature, and to use correlation-based scores rather than expression levels to rank the samples. However, one should note that in this scenario the second gene has a secondary role of introducing a natural cutoff of zero that is not expected to be dataset-dependent.
The generalization of the approach mentioned in the previous paragraph is to use a
Our signature is easy to use. Given a sample, the correlation between its 8-gene expression profile and the vector
A limitation of this study is that it focuses on only the 2 major subtypes of NSCLC. Of course, there are other NSCLC subtypes and also small-cell lung carcinoma, which have not been considered in this study and cannot be classified using the 8-gene signature. (Any sample from subtypes other than LUAD and LUSC would be classified as either LUAD or LUSC). As an important note, we emphasize that the signature proposed here is not meant to replace pathologists, that is it is to be used as a tool to assist pathologists classify challenging cases that are known to be either LUAD or LUSC. Additionally, it should be noted that all studies cited in this paper have also limited their scope to these subtypes. Given the prevalence of LUAD and LUSC, gene signatures focusing on only these subtypes can still be helpful to pathologists to achieve a more accurate classification. Another limitation of this paper, and others cited here, is that most samples used for testing the signature have been classified according to WHO2004 criteria. This is because few samples classified according to WHO2015 criteria are publicly available. We tested our signature using the samples (19 LUAD and 4 LUSC) in GSE94601 that were reclassified (according to WHO2015) to either LUAD or LUSC. Our signature was 100% accurate in classifying the 19 LUAD samples. However, the number of LUSC samples is just too small to draw a conclusion in the case of the LUSC (only 4 samples). Despite these limitations, which are shared by other studies cited, the good results obtained here suggest our signature can be useful to pathologists.
Supplemental Material
sj-pdf-1-cix-10.1177_11769351221100718 – Supplemental material for An 8-Gene Signature for Classifying Major Subtypes of Non-Small-Cell Lung Cancer
Supplemental material, sj-pdf-1-cix-10.1177_11769351221100718 for An 8-Gene Signature for Classifying Major Subtypes of Non-Small-Cell Lung Cancer by Mehdi Hamaneh and Yi-Kuo Yu in Cancer Informatics
Footnotes
Acknowledgements
This study utilized the computational resources of the Biowulf system at the National Institutes of Health, Bethesda, MD (http://biowulf.nih.gov). The results published here are in part based upon data generated by the TCGA Research Network: ![]() .
.
Funding:
The author(s) disclosed receipt of the following financial support for the research, authorship, and/or publication of this article: This work was supported by the Intramural Research Program of the National Library of Medicine at the National Institutes of Health grant number: ZIA LM092404.
Declaration of conflicting interests:
The author(s) declared no potential conflicts of interest with respect to the research, authorship, and/or publication of this article.
Author Contributions
MH and YKY designed research; MH performed research; MH and YKY analyzed data and wrote the paper.
Supplemental Material
Supplemental material for this article is available online.
References
Supplementary Material
Please find the following supplemental material available below.
For Open Access articles published under a Creative Commons License, all supplemental material carries the same license as the article it is associated with.
For non-Open Access articles published, all supplemental material carries a non-exclusive license, and permission requests for re-use of supplemental material or any part of supplemental material shall be sent directly to the copyright owner as specified in the copyright notice associated with the article.