
Abstract
BACKGROUND:
Lung adenocarcinoma (LUAD) is the most common histological subtype of lung cancer worldwide. Until now, the molecular mechanisms underlying LUAD progression have not been fully explained. This study aimed to construct a competing endogenous RNA (ceRNA) network to predict the progression in LUAD.
METHODS:
Differentially expressed lncRNAs (DELs), miRNAs (DEMs), and mRNAs (DEGs) were identified from The Cancer Genome Atlas (TCGA) database with a
RESULTS:
A total of 340 DELs, 29 DEMs, and 218 DEGs were selected to construct the initial ceRNA network. Functional enrichment analyses indicated that 218 DEGs were associated with the KEGG pathway terms “microRNAs in cancer”, “pathways in cancer”, “cell cycle”, “HTLV-1 infection”, and the “PI3K-Akt signalling pathway”. K-M survival analysis of all differentially expressed genes involved in the ceRNA network identified 24 DELs, 4 DEMs, and 29 DEGs, all of which were significantly correlated with LUAD progression (
CONCLUSIONS:
The lncRNA-miRNA-mRNA ceRNA network plays an essential role in predicting the progression of LUAD. These results may improve our understanding and provide novel mechanistic insights to explore prognosis and therapeutic drugs for LUAD patients.
Abbreviations
Background
Lung cancer remains the most commonly diagnosed cancer and has the highest morbidity among all cancer types worldwide, with approximately 2.1 million new cases and 1.8 million deaths in 2018 [1]. Lung adenocarcinoma (LUAD) is the most common histological subtype of lung cancer. It usually accounts for nearly 40% of cancer cases, and the average 5-year survival rate is less than 20% in most countries [2, 3, 4, 5]. Although we have made great progress in early diagnosis and novel therapy, the majority of lung cancer deaths are related to secondary diseases or metastatic progression [6]. Risk factors, such as age, gender, cigarette smoking, and pollution, are closely associated with the initiation of LUAD [7]. Additionally, genetic factors also contribute to the development of LUAD [7]. However, the underlying mechanisms of genetic factors and LUAD are not well understood. Because of the lack of sensitive and specific biomarkers, most patients with LUAD are diagnosed at a very late stage, which results in poor prognosis [8]. Therefore, more efforts need to be invested in the identification and understanding of novel biomarkers and specific targets of LUAD, which are considered the key to the development of early diagnosis, better treatment and better overall prognosis of LUAD.
Recently, the emergence of high-throughput transcriptome analysis has received much attention and has revealed that many types of noncoding RNAs (ncRNAs) without a protein-coding ability; these ncRNAs mainly consist of microRNAs (miRNAs) and long noncoding RNAs (lncRNAs), which are involved in the malignant behaviours of LUAD [9]. MicroRNAs are usually 19–25 nucleotides in length [10]. They perform transcriptional or post-transcriptional regulatory functions through binding to targeted mRNAs and further influence the degradation and translation of mRNAs [11]. Many studies have also considered miRNAs as diagnostic or prognostic biomarkers in cancer treatment [12]. lncRNAs are longer than 200 nucleotides in length [13]. The latest research illustrates that lncRNAs exert multiple functional roles in lung cancer, such as cancer metastasis, recurrence, and poor prognosis [14]. In addition, lncRNAs have been identified to perform different functions in the cell. For example, they regulate targeted gene expression in either cis or trans by recruiting a chromatin-modifying complex [14].
Salmena and his colleagues first proposed competing endogenous RNA (ceRNA, including lncRNAs, miRNAs, and mRNAs) as a tumour-specific regulatory pathway that affects the protein expression levels [15]. The principal mechanism of ceRNA is that lncRNAs can be used as endogenous molecular sponges harbouring miRNA response elements (MREs) to indirectly regulate mRNA expression levels [16]. Furthermore, numerous experiments have validated the ceRNA hypothesis, which is involved in the occurrence, recurrence, metastasis, and poor prognosis of LUAD [17, 18, 19]. For example, Cai et al. found that the lncRNA HMMR-AS1 can promote proliferation and inhibit apoptosis of human LUAD via the miR-138-SIRT6 axis [19]. Thus, it is essential and necessary to perform in depth integrated and comprehensive analyses to explore the regulatory functions of the lncRNA-miRNA-mRNA ceRNA network in tumourigenesis and prognosis.
The Cancer Genome Atlas (TCGA) dataset publicly provides transcriptome profiles with mRNA, miRNA and lncRNA data spanning 33 cancer types. This platform can contribute to the construction of a ceRNA network for LUAD. In this study, differentially expressed mRNAs (DEGs), lncRNAs (DELs), and miRNAs (DEMs) were first identified by comparing RNA-Seq and miRNA-Seq data from tumour and normal tissues from TCGA. Subsequently, integrated bioinformatics analyses, including Gene Ontology (GO) term analysis, Kyoto Encyclopedia of Genes and Genomes (KEGG) pathway enrichment analysis, and protein-protein interaction (PPI) construction based on intersecting mRNAs were performed. Furthermore, survival analyses were then conducted to screen DELs, DEMs, and DEGs significantly affecting LUAD patient prognosis. Targeted small molecular drugs on the basis of significant DEGs for LUAD were also identified. Finally, lasso-penalized Cox regression analysis, receiver operating characteristic (ROC) curve analysis and correlation analysis were used to construct the final significant ceRNA network according to all the above results. This study might contribute to exploring the mechanisms of LUAD prognosis, candidate biomarkers, and therapeutic drugs.
Materials and methods
Data sources and processing
The RNA-Seq data (including lncRNA and mRNA level 3, Illumina HiSeq RNA-Seq platform), miRNA-Seq data (Illumina HiSeq miRNA-Seq platform), and the corresponding clinical information of LUAD patients were downloaded from TCGA database using The GDC Data Portal (
Identification of DEGs, DELs, and DEMs
The “edgeR” package in R software was used to identify crucial DEGs (cDEGs), DELs (cDELs), and DEMs (cDEMs) between LUAD cases and normal controls [20]. The FDR
Construction of the initial ceRNA network
The miRcode database (
Functional enrichment analysis and PPI network construction of DEGs in the ceRNA network
The Database for Annotation, Visualization and Integrated Discovery (DAVID;
Survival analysis
Patient survival analyses related to expression of each DEG, DEL, and DEM in the ceRNA network were performed via Kaplan-Meier (K-M) survival curve and log-rank test analysis by using the “survival” package in R software. Based on the median expression of each gene in LUAD tissues, patients were classified into a high-expression group and a low-expression group. The overall survival (OS) as the endpoint was compared between the above two groups for each gene among all LUAD patients. Specifically, for the survival analysis of DEGs, Kaplan-Meier Plotter database (
Drug-hub gene interaction
Genetic alterations in above significant DEGs involved in survival analyses were displayed using the cBio Cancer Genomics Portal (
Construction of the risk score system and ROC curve analysis based on DEGs
The above DEGs related to LUAD patient survival were incorporated into lasso-penalized Cox regression to reduce the number of genes and to remove confounding factors. The penalized maximum likelihood method was applied to a Cox model, and the regression coefficients (
Selection of cDEGs, cDELs, and cDEMs. Volcano maps of differentially expressed (a) mRNAs, (b) lncRNAs, and (c) miRNAs were generated to visualise the differences between LUAD cases and normal controls. Compared to the expression levels of these genes in normal controls, red dots indicate upregulation in LUAD, while green dots indicate downregulation in LUAD. FC: fold change; FDR: false discovery rate; LUAD: lung adenocarcinoma.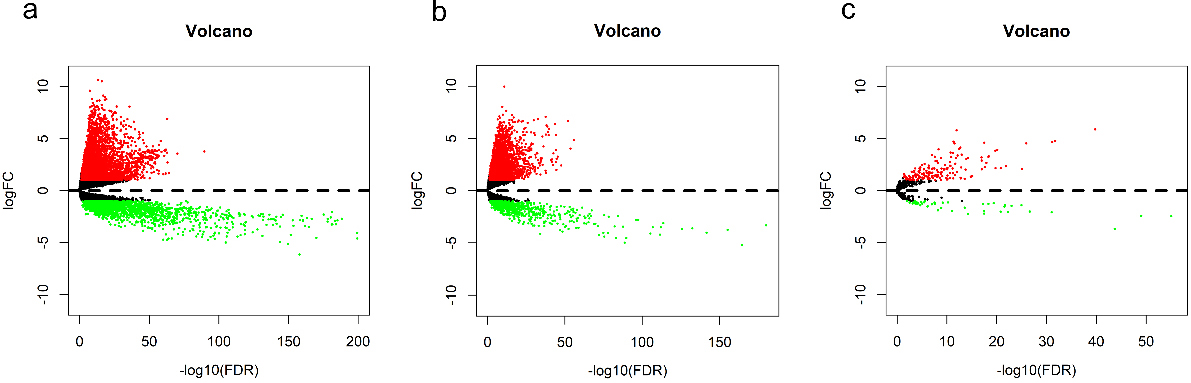
Hierarchical clustering analyses for (a) cDEGs, (b) cDELs, and (c) cDEMs were conducted through the “pheatmap” package in R. Compared to the expression levels of these genes in normal controls, red colours indicate upregulation in LUAD, while green colours indicate downregulation in LUAD. 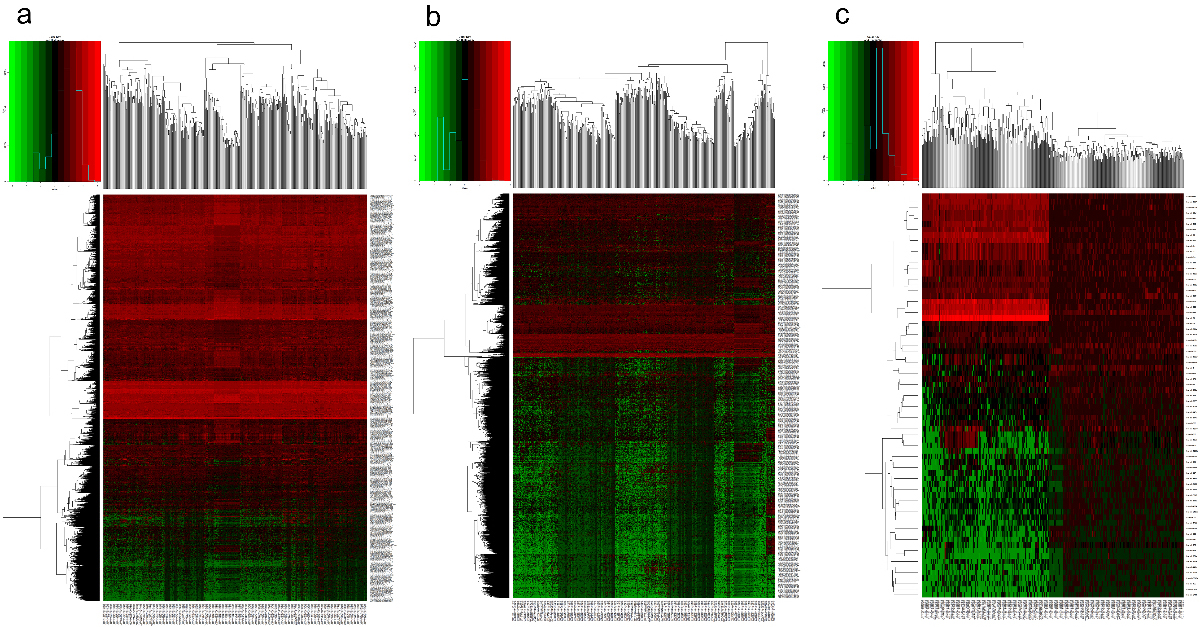
Bubble maps for GO and KEGG analyses of DEGs involved in the ceRNA network. The DAVID database (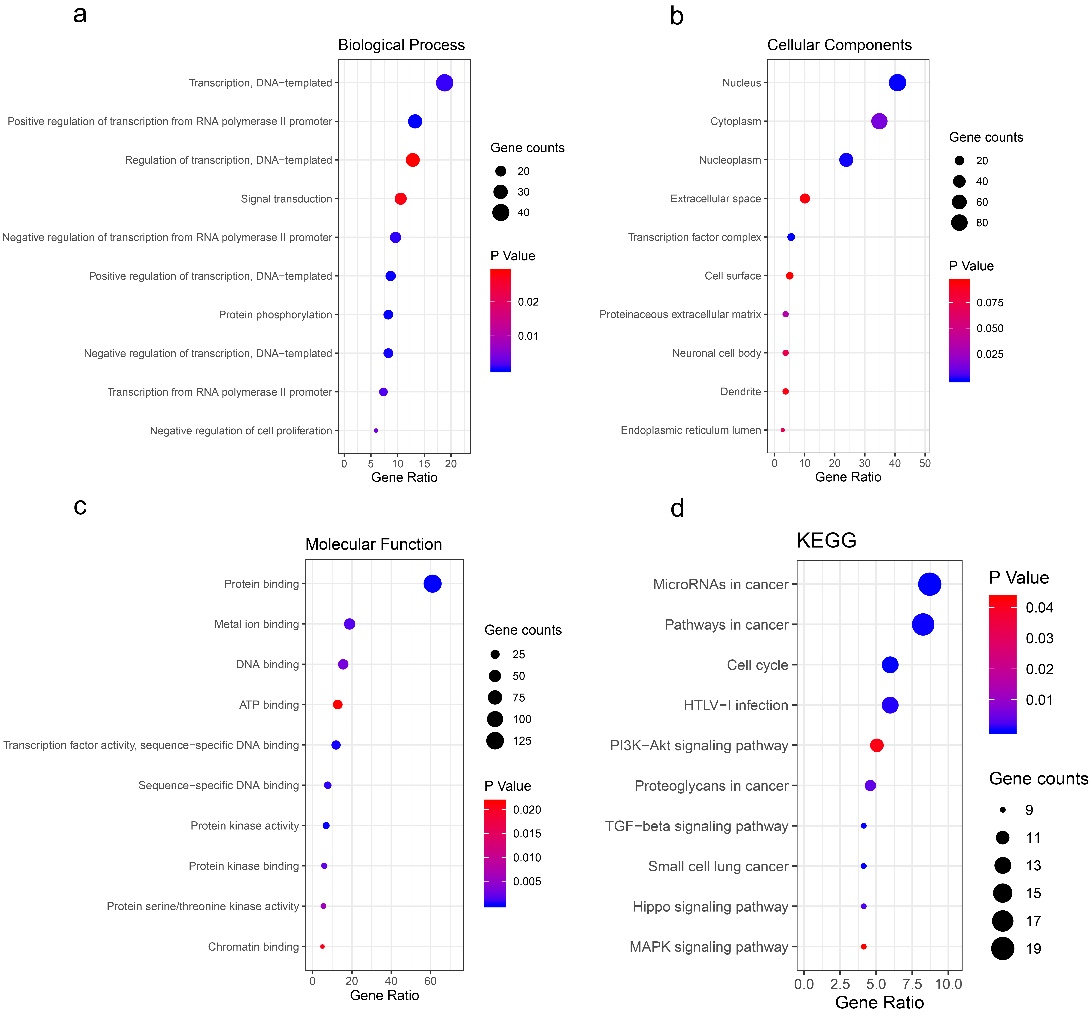
Both univariate and multivariate Cox regression analyses were used to validate whether the constructed risk score system were related to progression in LUAD patients. Only factors including age, gender, pathological stage, TNM classification with a
Correlation analysis between the expression level of DEGs and DELs
Correlation analyses of the expression levels between DEGs involved in the risk score system and their related DELs in the ceRNA network were conducted. These correlation results were visualized by using the “corrplot” package in R software.
Validation of the DEGs
The expression levels of the selected significant DEGs involved in correlation analysis between LUAD cases and normal controls were further validated by Gene Expression Profiling Interactive Analysis (GEPIA2;
The DEGs, DELs, and DEMs related to significant OS in LUAD patients
The DEGs, DELs, and DEMs related to significant OS in LUAD patients
OS analyses of DEGs, DELs, and DEMs in patients with LUAD. The survival analyses for (a) PRKCE and (b) LATS2 are conducted by Kaplan-Meier Plotter database (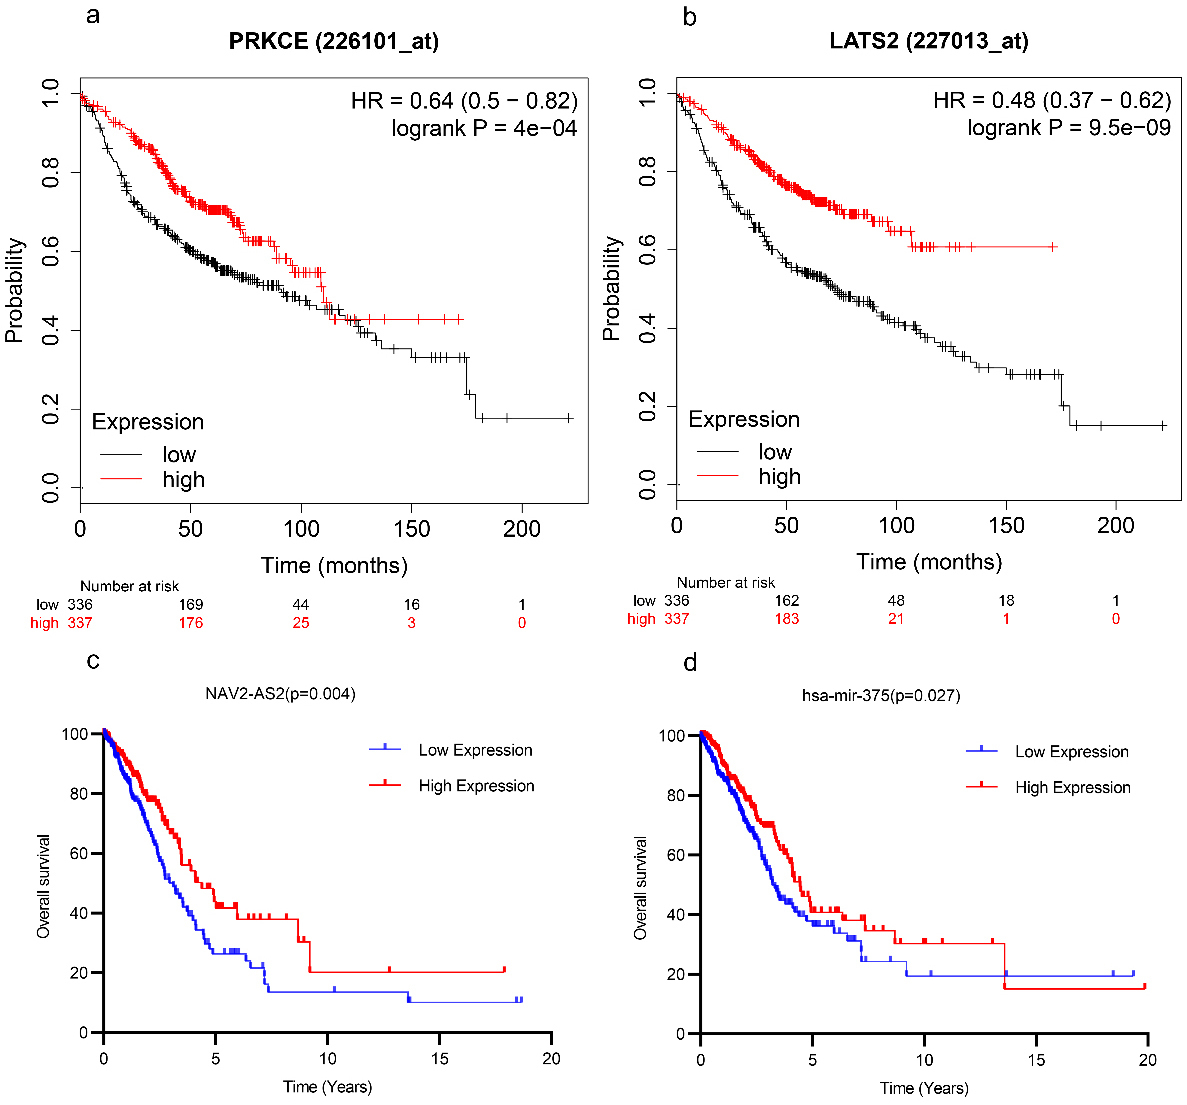
The significant lncRNA-miRNA-mRNA ceRNA network. All DELs, DEMs, and DEGs involved in the significant ceRNA network were validated by survival analysis, and the results were all statistically significant. The diamonds, squares, and circles represent lncRNAs, miRNAs, and mRNAs, respectively. Red indicates upregulated genes, whereas blue indicates downregulated genes. DEGs: differentially expressed mRNAs; DELs: differentially expressed lncRNAs; DEMs: differentially expressed miRNAs; ceRNA: competing endogenous RNA.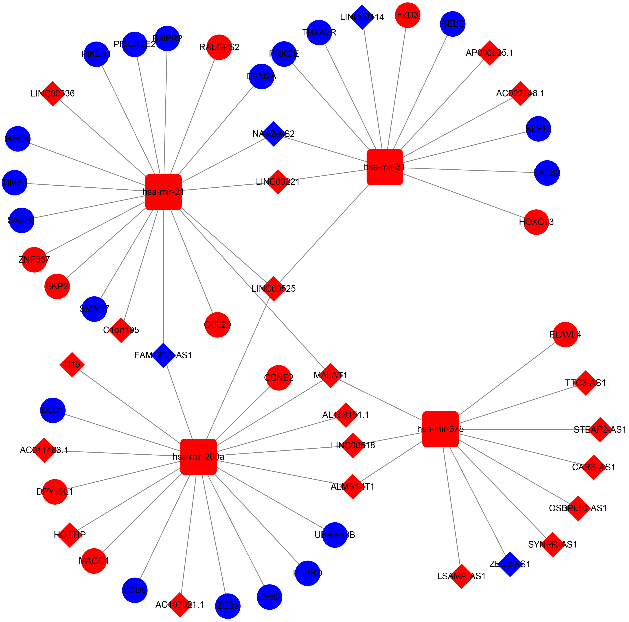
Identification of DEGs, DEMs and DELs in LUAD patients based on TCGA data
A total of 5595 cDEGs were considered in LUAD samples compared with those in normal samples, including 3750 (67.02%) upregulated and 1845 (32.98%) downregulated genes (Fig. 1a). A total of 3942 cDELs were then identified, including 3257 (82.62%) upregulated and 685 (17.38%) downregulated lncRNAs (Fig. 1b). Meanwhile, a total of 265 cDEMs were further screened, including 159 (77.56%) upregulated and 46 (22.44%) downregulated miRNAs (Fig. 1c). Additionally, the expression levels of these above genes are visualized in the form of heatmaps in Fig. 2.
Intersecting lncRNAs and mRNAs and construction of the ceRNA network in LUAD
A flowchart of the ceRNA network construction is shown in Fig. S1. As demonstrated in this flowchart, 34 potential miRNAs that interacted with 340 lncRNAs were first predicted on the basis of the miRcode database (Fig. S1). Then, these 34 miRNAs were applied to the further selection of targeted mRNAs. After using all three databases, including miRDB, miRTarBase, and TargetScan, five miRNAs were removed (namely, hsa-mir-508, hsa-mir-489, hsa-mir-301b, hsa-mir-184, and hsa-mir-187), whereas 943 targeted mRNAs remained (Fig. S1). Subsequently, at the intersection of these 943 targeted mRNAs and 5377 cDEGs (only those genes identified by R), 218 overlapping DEGs were identified (Fig. S2). Then, 340 DELs, 29 DEMs, and 218 DEGs were incorporated into a final LUAD ceRNA network (Fig. S3). The respective genes involved in the ceRNA network are presented in Table S1.
Functional enrichment analysis and PPI network construction on DEGs involved in ceRNA
GO analysis of the above 218 DEGs grouped DEGs into three functional groups, namely, BP, CC, and MF. The top five significant terms from the GO enrichment analysis showed that in the BP category, the DEGs were involved in transcription, DNA-templated (18.81%,
The PPI network of the DEGs involved in the ceRNA network was constructed on the basis of the information from the STRING database. A total of 218 DEGs were mapped to the PPI network (Fig. S4). 218 nodes and 455 edges were included in this PPI network, and its PPI enrichment
Survival analysis of ceRNA network-associated genes
Table 1 shows that 29 DEGs, 24 DELs, and 4 DEMs were considered oncogenes because all of them had statistical significance in the survival analysis of LUAD patients (
Genetic information and drug-gene interactions
Subsequently, cBioPortal was used to determine the genetic alterations of the 29 DEGs (Fig. 6). As presented in Fig. 6a, these queried genes were altered in 300 (59%) queried patients or samples. PTPRD was mutated most often (24%). These mutations included missense mutations, truncating mutations, fusions, amplifications, and deep deletions (Fig. 6a). Among the different kinds of alterations, multiple alterations accounted for the highest percentages, followed by mutation, deep deletion, and amplification (Fig. 6b).
Candidate drugs interacted with the significant DEGs
Candidate drugs interacted with the significant DEGs
These data were based on the DGIdb. These targeted DEGs were all statistically significant in the survival analysis of LUAD patients. DGIdb: drug-gene interaction database; DEGs: differentially expressed mRNAs; LUAD: lung adenocarcinoma.
The alteration information on significant DEGs. (a) The genetic alterations associated with the significant DEGs are presented in a visual summary across a set of LUAD samples (data from TCGA, PanCancer Atlas). (b) An overview of the main types of alteration information on the significant DEGs in the genomics datasets of LUAD in the TCGA database. DEGs: differentially expressed mRNAs.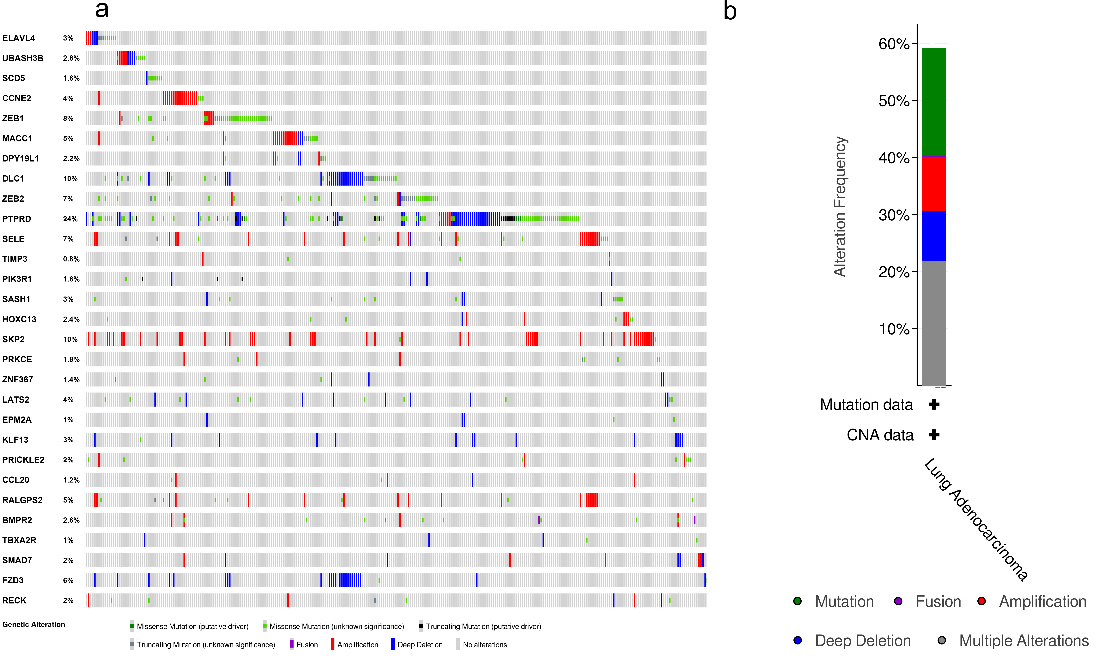
The construction of risk score system. (a) Shows the coefficient values at different levels of allowed error, and each curve represents an mRNA. (b) The best lambda was validated by ten-fold cross-validation to minimize the mean cross-validated error. The red dots and solid vertical lines indicate the partial likelihood deviances and their corresponding 95% CIs, respectively. (c) Presents the K-M survival curve with log-rank test between low- and high-risk groups. (d) Illustrates the time-dependent ROC curve based on the risk score system. (e) Expression levels of the DEGs involved in the risk score system between low- and high-risk groups are shown in the form of a heatmap. The light red and light blue in the above heatmap represent high- and low-risk groups, respectively. The red and green in the main body of the heatmap represent high- and low expression levels of DEGs involved in the risk score system, respectively. K-M: Kaplan-Meier; ROC: receiver operating curve. DEGs: differentially expressed mRNAs.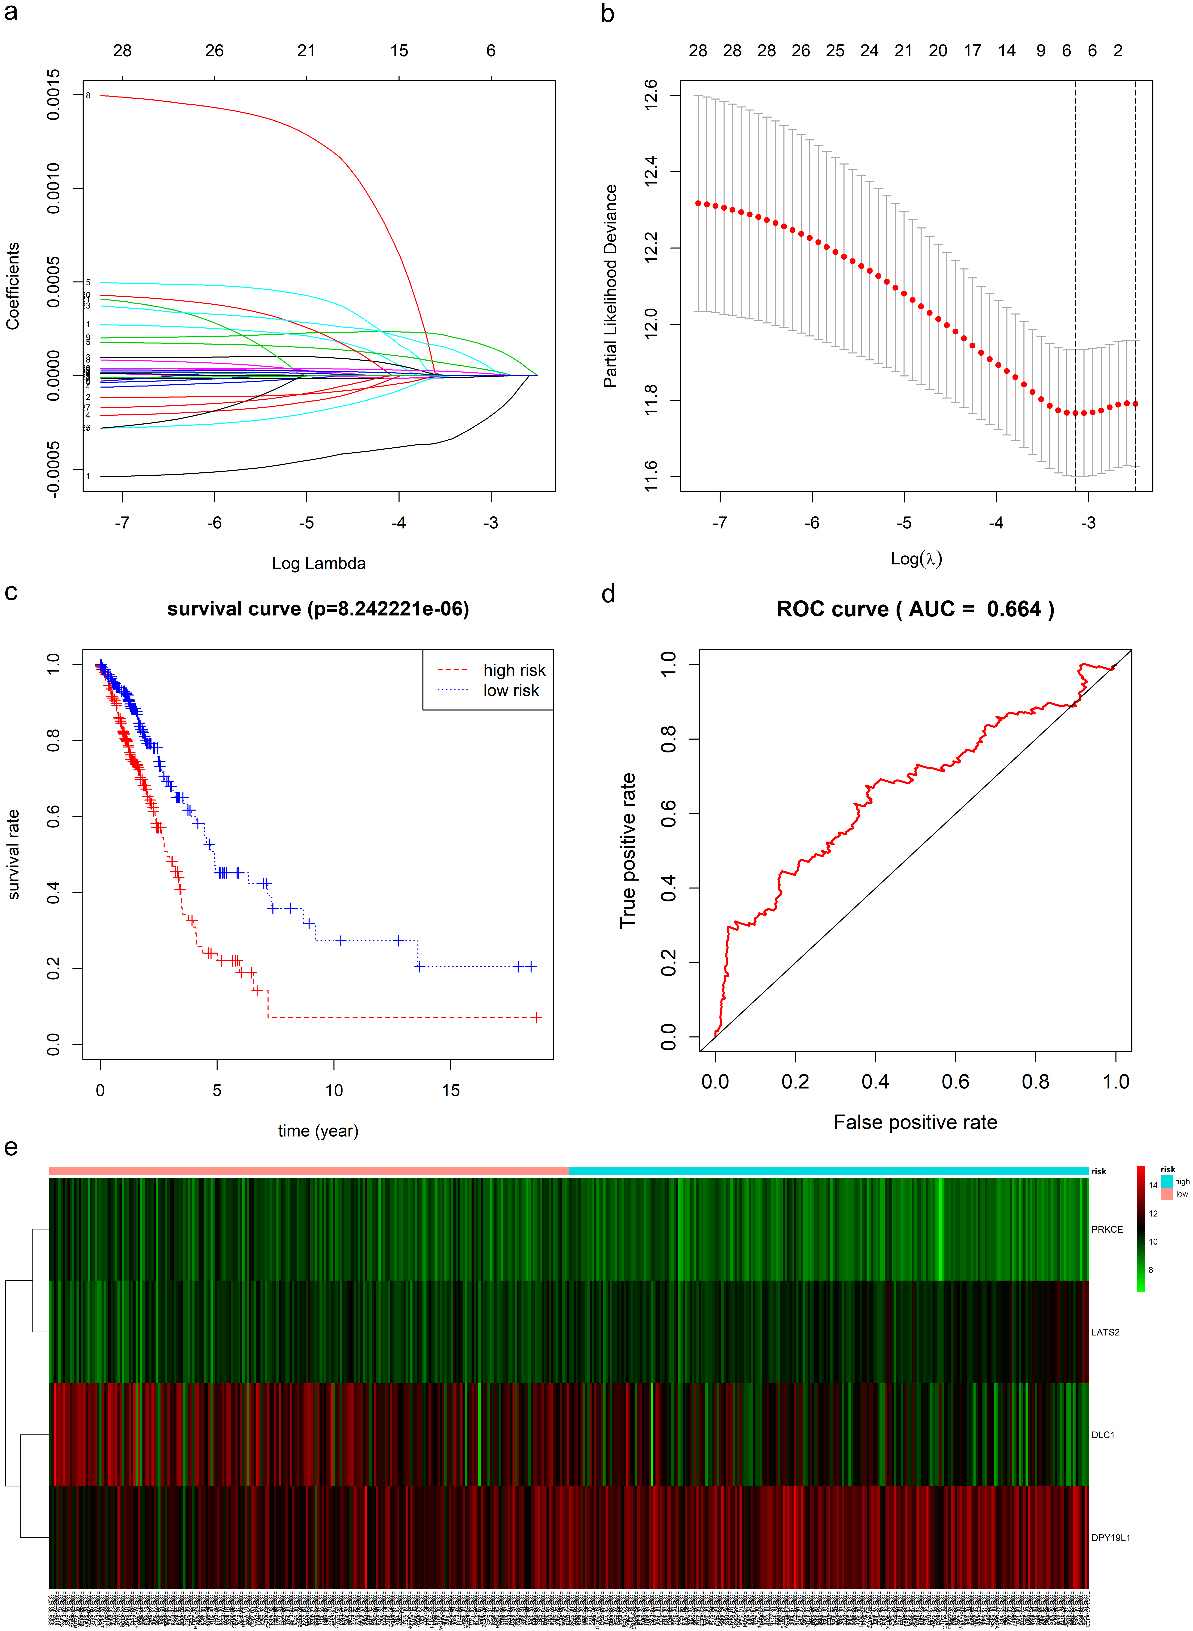
Univariate and multivariate Cox regression analyses in LUAD patients. Survival prognosis forest map of clinical information related to prognosis in lung adenocarcinoma (LUAD) patients. Each point in the forest plot represents the HR of the indicator, and the line on both sides of the point represents the 95% confidence interval (95% CI).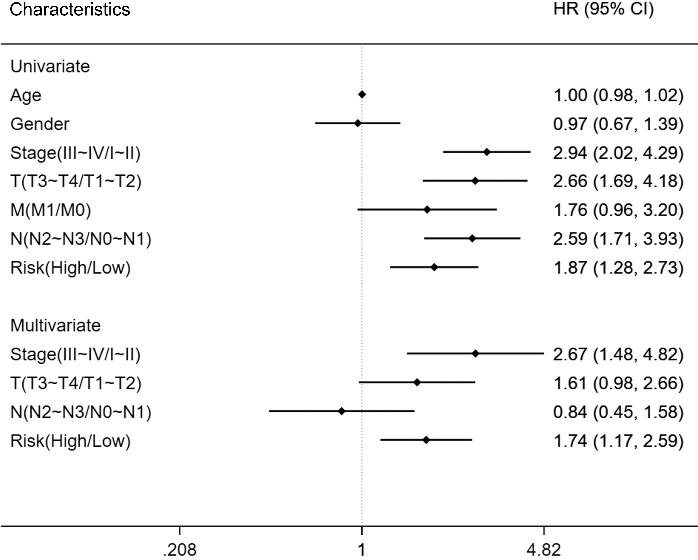
Furthermore, a total of 15 potential drugs approved by the FDA for treating LUAD patients were screened when drug-gene interactions were conducted (Table 2). In this study, DEGs including UBASH3B, ZEB1, SELE, PRKCE, and TBXA2R were selected as the potential targets of the 15 drugs on the basis of the significant results of the above survival analysis (Table 2). Most potential drugs might interact with TBXA2R (10/15) as agonists (ABACAVIR, ILOPROST, DINOPROSTONE, and DINOPROST), antagonists (FELBINAC and ACETAMINOPHEN), or in some unknown manners (CYCLOSPORINE, MORPHINE, FUROSEMIDE, and VINBLASTINE) (Table 2). In addition, protein kinase C epsilon (PRKCE) is always considered an activator that interacts with INGENOL MEBUTATE and MEPROBAMATE (Table 2).
Lasso-penalized Cox regression and multivariate Cox regression analyses were conducted to screen the potential prognosis-related mRNAs based on the 29 DEGs that were significantly associated with OS in the above survival analysis. We also used relative coefficients to weigh the contributions of these DEGs (Fig. 7a and b). Then, according to the minimum of the mean cross-validated error, only six DEGs were left for the follow-up analysis, namely, PRKCE, DLC1, LATS2, RALGPS2, ZNF367, and DPY19L1 (Fig. 7a and b). Next, these six DEGs were further incorporated into the multivariate Cox regression model using “both” directions, and RALGPS2 and ZNF367 were excluded. The mRNA-associated risk score system was finally constructed as follows: PI
Univariate and multivariate analyses
The univariate results indicated that the pathological stage, tumour (T), and lymph node (N) classification were significantly associated with the prognosis of LUAD, similar to the risk score results (Fig. 8). For the multivariate results, the tumour and lymph node classifications were no longer related to the progression of LUAD, whereas the risk score system and pathological stage were still significantly correlated with the survival time of LUAD patients (Fig. 8). Compared to the low-risk patients, the high-risk patients had a hazard ratio (HR) of 1.74 (95% CI 1.17–2.59,
Correlations between DEGs involved in the risk score system and their corresponding DELs. Linear regression and correlation analyses were conducted between the expression levels of (a) PRKCE – NAV2-AS2, (b) LATS2 – NAV2-AS2 and their corresponding DEL (NAV2-AS2), respectively. The blue shadow around the blue line represents the 95% CI. 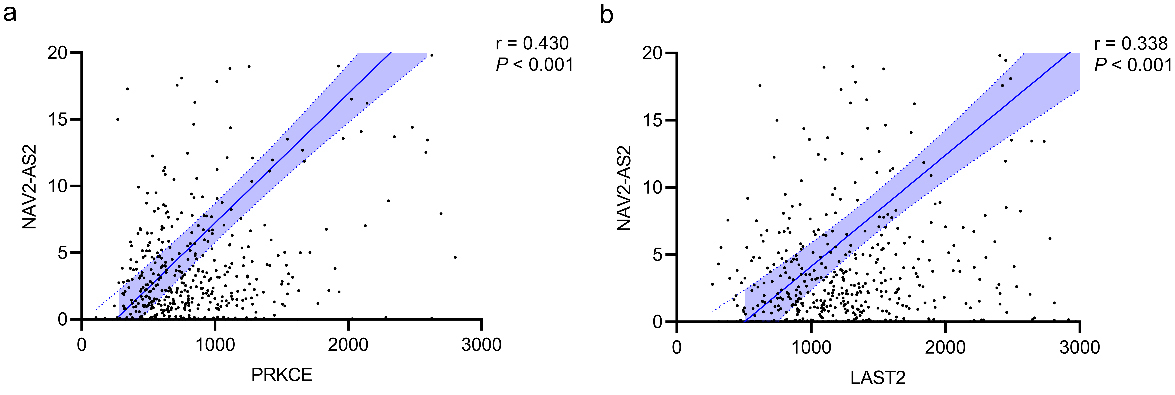
IHC results of LATS2 protein levels in normal lung and LUAD from the Human Protein Atlas. IHC results of LATS2 protein in normal lung (Patient ID: 2268). Staining: medium; Intensity: moderate; Quantity: 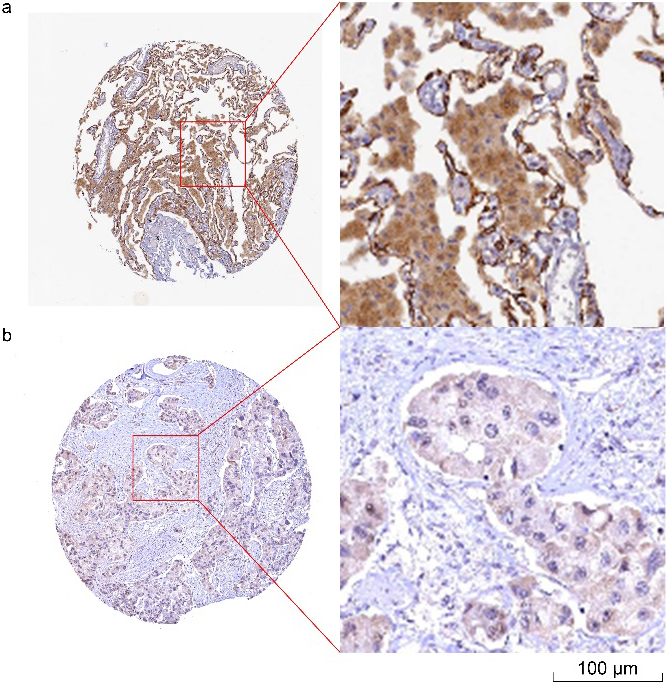
After the construction of the risk score system, four significant DEGs were identified, namely, PRKCE, LATS2, DPY19L1, and DLC1. DEGs are always positively regulated by DELs by directly interacting with DEMs. To verify this hypothesis in LUAD patients, a correlation analysis between these four significant DEGs and their corresponding DELs involved in the ceRNA network (Fig. 5) was performed. As shown in Fig. 9, we identified two significant DEL-DEG pairs, namely, NAV2-AS2 – PRKCE (
Considering the ceRNA network shown in Fig. 5, hsa-mir-31 was selected as the key gene. Finally, in this study, two ceRNA networks were selected, namely, NAV2-AS2 – mir-31 – PRKCE and NAV2-SA2 – mir-31 – LATS2.
Discussion
Although there has been great progress in surgical and medical therapy for lung cancer, the latest global cancer statistics (2018) reported that lung cancer is still the most frequently diagnosed cancer, and its mortality ranks first globally [1]. As LUAD is the most common histological subtype of lung cancer, this low 5-year survival rate is far from satisfactory. LUAD is often diagnosed at an advanced or metastatic stage, which makes early detection and treatment impossible. However, cancer mortality can be vastly reduced if cases are detected or treated early [29]. Therefore, it is urgent and necessary to seek innovative biomarkers and precise molecular mechanisms for the early diagnosis, treatment, and prognosis of LUAD.
In recent years, due to the applications of RNA-Seq data and microarray-based expression profiling data, the ceRNA hypothesis proposes a new RNA interaction mechanism, which further contribute to the better understanding of the tumourigenesis and prognosis of LUAD at the molecular level [20]. In our study, DEGs, DELs, and DEMs were first identified by using the raw sequencing data of LUAD cases and normal controls from the TCGA database. Then, the DEL-DEM-DEG ceRNA network was constructed on the basis of DEL-DEM interactions and DEM-DEG interactions. This initial ceRNA network consisted of 340 DELs, 29 DEMs, and 218 DEGs. Subsequently, GO and KEGG pathway analyses of those 218 DEGs were conducted by DAVID. The GO analysis of DEGs indicated that the DEGs were significantly enriched in “nucleoplasm”, “transcription factor complex”, “protein binding”, and “metal ion binding”, which further suggested that LUAD might be considered a metabolism-related disease. The KEGG pathway results showed that the DEGs involved in the ceRNA network were associated with microRNAs in cancer, pathways in cancer, cell cycle, HTLV-1 infection, and the PI3K-Akt signalling pathway. These results also provide significant clues to explore the molecular mechanisms of tumourigenesis and prognosis in LUAD patients. Indeed, many studies have illustrated that the cell cycle, HTLV-1 infection, and PI3K-Akt signalling pathway are highly related to various types of cancer, especially lung cancer [30, 31, 32, 33]. For example, Li et al. proposed that overexpression of cell cycle-related proteins in tumours is always related to tumour proliferation behaviours and poor prognosis in non-small-cell lung cancer (NSCLC) [30]. Furthermore, Hiromitsu et al. in 1990 validated that human T-cell leukaemia virus type 1 (HTLV-1) is associated with small cell lung cancer [31], while no studies have explored the relationship between HTLV-1 infection and LUAD. In addition, the PI3K-Akt signalling pathway regulates the normal physiological activities of cells. Some evidence has also validated that aberrant activation of the PI3K-Akt signalling pathway always leads to tumourigenesis and metastasis in many types of cancer, such as LUAD [32], gastric carcinoma [34], and bladder carcinoma [35]. For LUAD, the PI3K-Akt pathway may affect cell apoptosis and proliferation [36]. Additionally, the PPI network in this study consisted of 218 nodes and 455 edges. This provides useful information on the PPIs involved in our ceRNA network. All of the above evidence suggests that our ceRNA network might play essential roles in exploring the mechanisms of LUAD.
After conducting these functional analyses and PPI construction, K-M survival analysis of all differentially expressed genes involved in the ceRNA network screened 24 DELs, 4 DEMs, and 29 DEGs, all of which were significantly correlated with progression in LUAD patients (
In addition, lasso-penalized Cox regression and multivariate Cox regression analyses were combined to assist with the construction of the risk score system. Among the remaining four DEGs, namely, PRKCE, DLC1, LATS2, and DPY19L1, three of them have been studied before. For example, deleted in liver cancer-1 (DLC1) is a tumour suppressor gene that has been reported to be involved in the genetic and epigenetic mechanisms of various human cancers, such as lung, colorectum, breast, and prostate carcinomas [45, 46, 47]. Qian et al. indicated that inactivation of DLC1 and downregulation of p15
Then, according to the correlation results among the remaining 4 DEGs and their corresponding DELs, only two ceRNA networks were selected, namely, NAV2-AS2 – mir-31 – PRKCE and NAV2-SA2 – mir-31 – LATS2. Chang and Wang once suggested that miRNAs could cause mRNA degradation by binding to the 3’-untranslated region (3’-UTR) of the target genes [50]. Surprisingly, in this study, the expression level of hsa-mir-31 was upregulated in LUAD patients, whereas the expression levels of PRKCE, LATS2, and NAV2-AS2 were downregulated (Fig. 5). In addition, the online database GEPIA2 was also utilized to further validate the expression level of PRKCE (Fig. S10a) and LATS2 (Fig. S10b) between LUAD and normal tissues based on the TCGA normal and GTEx data. The results from GEPIA2 were consistent with the results of Fig. 5. Furthermore, on the basis of the results of survival analysis, lower expression levels of PRKCE, LATS2, and NAV2-AS2 were always correlated with poorer OS in LUAD patients (Fig. 4). All this evidence in our study improved the reliability of the ceRNA network.
In the above two ceRNA networks, NAV2-AS2, an upstream lncRNA, has never been studied; in contrast, the downstream mRNAs PRKCE and LATS2 related to LUAD have been studied extensively [51, 52, 53]. For example, PRKCE, a phorbol ester receptor, has been validated to be associated with various types of cell functions, such as cell cycle progression [54], ion channel control [55], cytokinesis [56], and regulation of transcription factor activity [57]. The onset and progression of various types of chronic diseases have been indicated to be associated with PRKCE. These diseases include heart failure, obesity, diabetes, neurological diseases, and cancer [58]. Regarding the mechanisms of NSCLC, Ding et al. indicated that PRKCE could keep lung cancer cells from undergoing apoptosis and further promote cell survival through the dysregulation of the mitochondrial caspase pathway [51]. Furthermore, Wu et al. demonstrated that PRKCE regulated cell proliferation and was targeted by hsa-mir-129 [59]. In the above section, we explored the alterations in LATS2. LATS2 is a presumed tumour suppressor gene that encodes a serine or threonine kinase [60]. Dysregulation of the LATS2 functions has been validated to be related to a series of malignancies, including lung cancer [39], breast cancer [61], prostate cancer [62], and malignant mesothelioma [63]. There are multiple mechanisms of action for LATS2 in various kinds of cancers, such as the regulation of the cell cycle by controlling G1/S and G2/M transition [64], induction of apoptosis by downregulating Bcl-2 and Bcl-X
The strength of our study is that we first constructed NAV2-AS2 – mir-31 – PRKCE and NAV2-SA2 – mir-31 – LATS2 ceRNA networks based on a risk score system and explored their potential biological functions in the tumourigenesis and prognosis of LUAD patients. Considering the crucial roles of these genes, further studies might be focused on validating and testing the predicted ceRNA network and exploring their precise mechanisms of LUAD. Indeed, our study has several limitations. One is that all the data used in this study were derived from public databases and were not generated by the authors of this article. The clinical information did not include the family exposure history and other environmental factors, which will bias the results of Cox regression analysis. The other is that future experimental studies and verifications must be conducted to explore the mechanisms in depth. Despite these limitations, this study may provide novel insights into the molecular mechanisms of LUAD and assist with exploring potential and innovative targets and biomarkers of prognosis and therapeutic drugs for LUAD patients.
Conclusions
In summary, two novel ceRNA networks, namely, NAV2-AS2 – mir-31 – PRKCE and NAV2-SA2 – mir-31 – LATS2, were first identified. All these results not only provide a comprehensive analysis network but also narrow the scope of research and enhance the prediction accuracy for ceRNA networks. Our findings will improve our understanding of these candidate biomarkers for the prognosis and therapeutic drugs of LUAD patients.
Supplementary data
The supplementary files are available to download from http://dx.doi.org/10.3233/CBM-200133.
sj-doc-1-cbm-10.3233_CBM-200133.doc - Supplemental material
Supplemental material, sj-doc-1-cbm-10.3233_CBM-200133.doc
Footnotes
Acknowledgments
We thank the TCGA, DAVID, KEGG, STRING, Kaplan-Meier Plotter, DGIdb, cBio Cancer Genomics Portal, and OncomiR databases for providing their platforms and contributors for their valuable data sets.
Conflict of interest
The authors declare that they have no competing interests.