
Abstract
Cholangiocarcinoma (CCA) is a highly malignant and poorly differentiated bile duct cancer with an extremely poor prognosis, but the pathogenesis of CCA remains not well-known. Attention has been increasingly focused on long noncoding RNAs, which plays an important role in tumorigenesis. However, the roles of cancer specific lncRNA and its related competitive endogenous RNAs (ceRNA) network in CCA remain elusive.
In this study, we comprehensively integrated expression profiles, including data on mRNAs, lncRNAs and miRNAs obtained from 36 CCA tissues and 9 normal tissues in The Cancer Genome Atlas. 1434 cancer specific lncRNAs, 68 miRNAs and 3538 mRNAs (
Introduction
Cholangiocarcinoma (CCA) is a highly malignant and poorly differentiated bile duct cancer with an extremely poor prognosis. Currently, there is no effective therapy other than surgical resection for CCA [1]. However, severe local invasion and distant metastases is present early in CCA patients, limiting the surgery option [2, 3]. Moreover, even with complete tumor resection, the majority of CAA patients still develop local recurrence or distant metastasis [4]. Therefore, it is urgently needed to explore novel effective tumor markers for early diagnosis and therapy improvement.
A: The cluster dendrogram of co-expression network modules for differentially expressed mRNAs. The red line represents the cut-off of data filtering in the step of data preprocessing. B: Analysis of network topology for different soft-thresholding powers. The left panel displays the influence of soft-thresholding power (x-axis) on scale-free fit index (y-axis). The right panel shows the influence of soft-thresholding power (x-axis) on the mean connectivity (degree, y-axis).
Long noncoding RNAs (lncRNAs) are defined as RNA transcripts longer than 200 nucleotides without significant protein-coding capacity [5]. Currently, increasing information has shown that lncRNAs involved in the regulation of tumor progression and tumor biological behaviors through interactions with miRNAs or mRNAs [6, 7, 8, 9]. In 2011, Salmena et al. presented a competing endogenous RNA (ceRNA) hypothesis, which described a complex post-transcriptional regulatory network, including lncRNAs, mRNAs, and other types of RNAs [10]. lncRNA can interact with the miRNA by miRNA-binding sites (MREs), thereby regulating gene expression. Several experimental studies have also confirmed this hypothesis [11, 12]. However, there is still little research on ceRNA-related lncRNAs involved in relevant regulatory mechanisms in CCA.
Weighted gene co-expression network analysis (WGCNA) was used to discover the relationship between networks/genes and phenotypes based on RNA sequencing or microarray data in different samples [13, 14]. In WGCNA, gene modules are identified through unsupervised hierarchical clustering. This technique does not depend on a priori defined gene sets or pathways. It can provide more useful and credible information of gene function [15]. WGCNA has been successfully applied to identify candidate biomarkers or therapeutic targets.
In the present study, the RNA sequencing data of 36 bile duct cancer tissues and 9 matched normal tissues were collected from TCGA database. This study is to investigate the cancer specifc lncRNA from large scale sequencing database (TCGA) and ceRNA network constructed. Moreover, in order to identify the potential key genes associated with the prognosis of CCA, weighted co-expression network analysis was performed on the differentially expressed mRNAs. The results may provide novel information for CCA diagnosis and treatment.
Data processing
RNA sequencing data, miRNA sequencing data and clinical information were obtained from TCGA database (
A: Volcano plot of differentially expressed mRNAs. The red dot represents up-regulated mRNA, and green dot represents down-regulated mRNA. B: Volcano plot of differentially expressed lncRNAs. The red dot represents up-regulated lncRNA, and green dot represents down-regulated lncRNA. C: Volcano plot of differentially expressed miRNAs. The red dot represents up-regulated miRNA, and green dot represents down-regulated miRNA.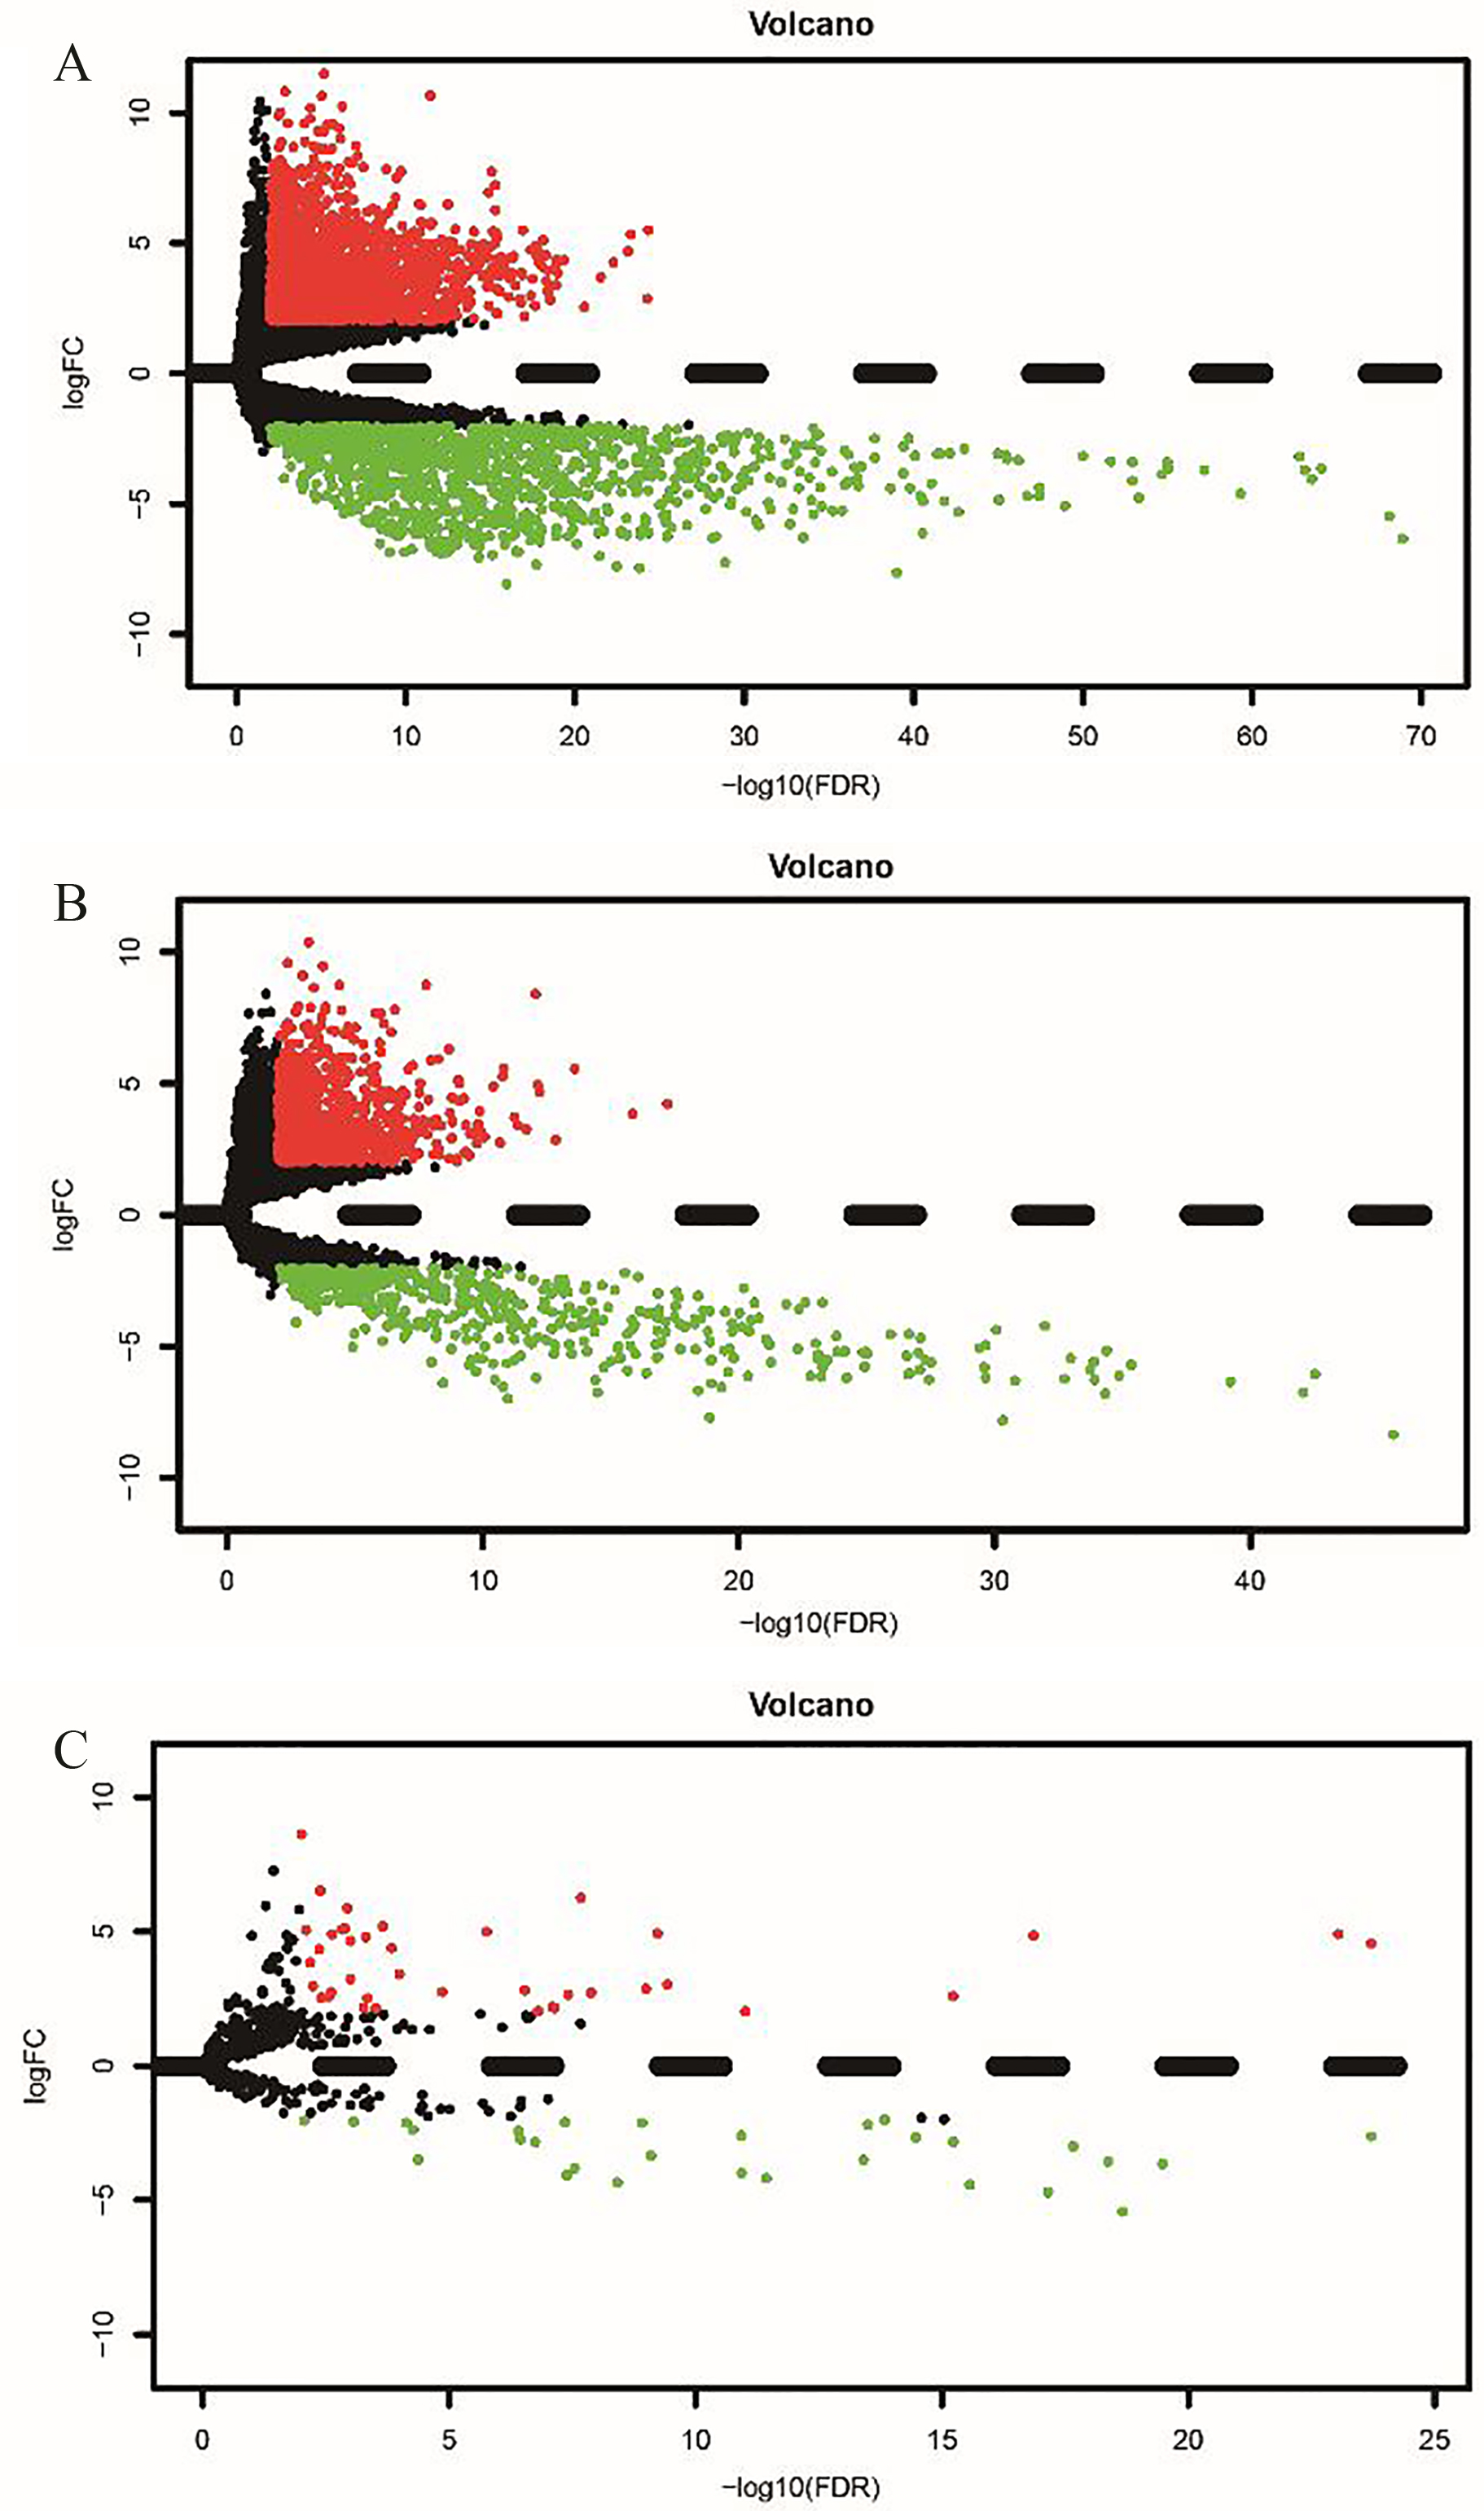
ceRNA network in CCA patients. Red stands for up-regulated genes, blue represents down-regulated genes.
Functional analysis of ceRNA network. A: The enriched KEGG pathways ranked by 
The construction of ceRNA network included two steps: (1) DElncRNA-DEmiRNA interactions were predicted by miRcode (
The code genes involved in ceRNA network were analyzed by The Database for Annotation, Visualization and Integrated Discovery (DAVID) bioinformatics tool for KEEG pathway enrichment analysis and Gene Ontology (
Weighted correlation network analysis of DEmRNAs
Weighted gene co-expression network analysis (WGCNA) was performed to discover the relationship between gene expression pattern and phenotypes. In this co-expression network, weighted gene co-expression network was constructed using differentially expressed mRNAs through WGCNA package of R [14]. We used the function softConnectivity from package WGCNA to analyze the influence of power value on the scale independence and mean connectivity. We chose a power cutoff threshold of 7, which is the lowest power for which the scale-free topology fit index reaches 0.95, to build scale-free topology model (Fig. 1B). Cluster analysis was subsequently performed by flashClust (Fig. 1A). Then, the adjacency matrix was transformed into topology matrix. Static Tree Cut method were applied to construct initial modules with a minimum of 10 genes. The relation between modules and five prognostic factors of bile duct cancer (gender, tumor grade, tumor stage, survival time and age) were analyzed by calculating the Pearson correlation coefficient and visualized by heat map.
A: Clustering dendrogram of genes, with dissimilarity based on topological overlap, together with assigned module colors. B: Topological overlap matrix plot. Genes in the rows and columns are sorted by the clustering tree in (A).
The correlation of mRNA co-expression network modules with clinical prognostic factors of CCA.
In order to evaluate the prognosis of DElncRNA and miRNA signature, by combining the clinical data of bile duct patients in TCGA, we constructed the life curves of these samples with miRNAs and DElncRNAs. R package “survival” was subjected to implement log-rank tests and plot Kaplan-Meier survival curves.
Results
Identifying DEmRNAs, DEmiRNAs, and DElncRNAs
In this study, a total of 45 samples were enrolled, including 36 bile duct cancer tissues and 9 matched normal tissues. A total of 3538 DEmRNAs and 68 DEmiRNAs were confirmed by the “edgeR” package in R software. As a result, there were 2279 (55.44%) up-regulated and 1259 (44.56%) down-regulated DEmRNAs (Fig. 1C). Moreover, a total of 39 (69.05%) up-regulated and 29 (30.95%) down-regulated DEmiRNAs were identified (Fig. 2E). We also identified the significant DElncRNAs using the “edgeR” package in R software. A total of 1434 differentially expressed lncRNAs were identified between bile duct cancer tissues and normal tissues, including 929 up-regulated and 505 down-regulated lncRNAs (Fig. 2D).
DEmiRNA targeting DElncRNAs predicted by miRcode and starBase
In the ceRNA network, miRNAs interact with lncRNAs through miRNA response elements (MREs). Thus we searched for the potential MREs in lncRNAs using miRcode and starBase v2.0. Combined with DEmiRNAs, and DElncRNAs, 380 DElncRNA-DEmiRNA interactions were further extracted, including 15 DEmiRNAs and 127 DElncRNAs.
Gene Ontology enrichment analysis of genes in the five network modules. (A) black module; (B) green module; (C) light green module; (D) red module; (E) yellow.
The KEGG pathways of WGCNA modules
Kaplan-Meier curve analysis of DEmiRNAs and DElncRNAs for the overall survival in CCA patients.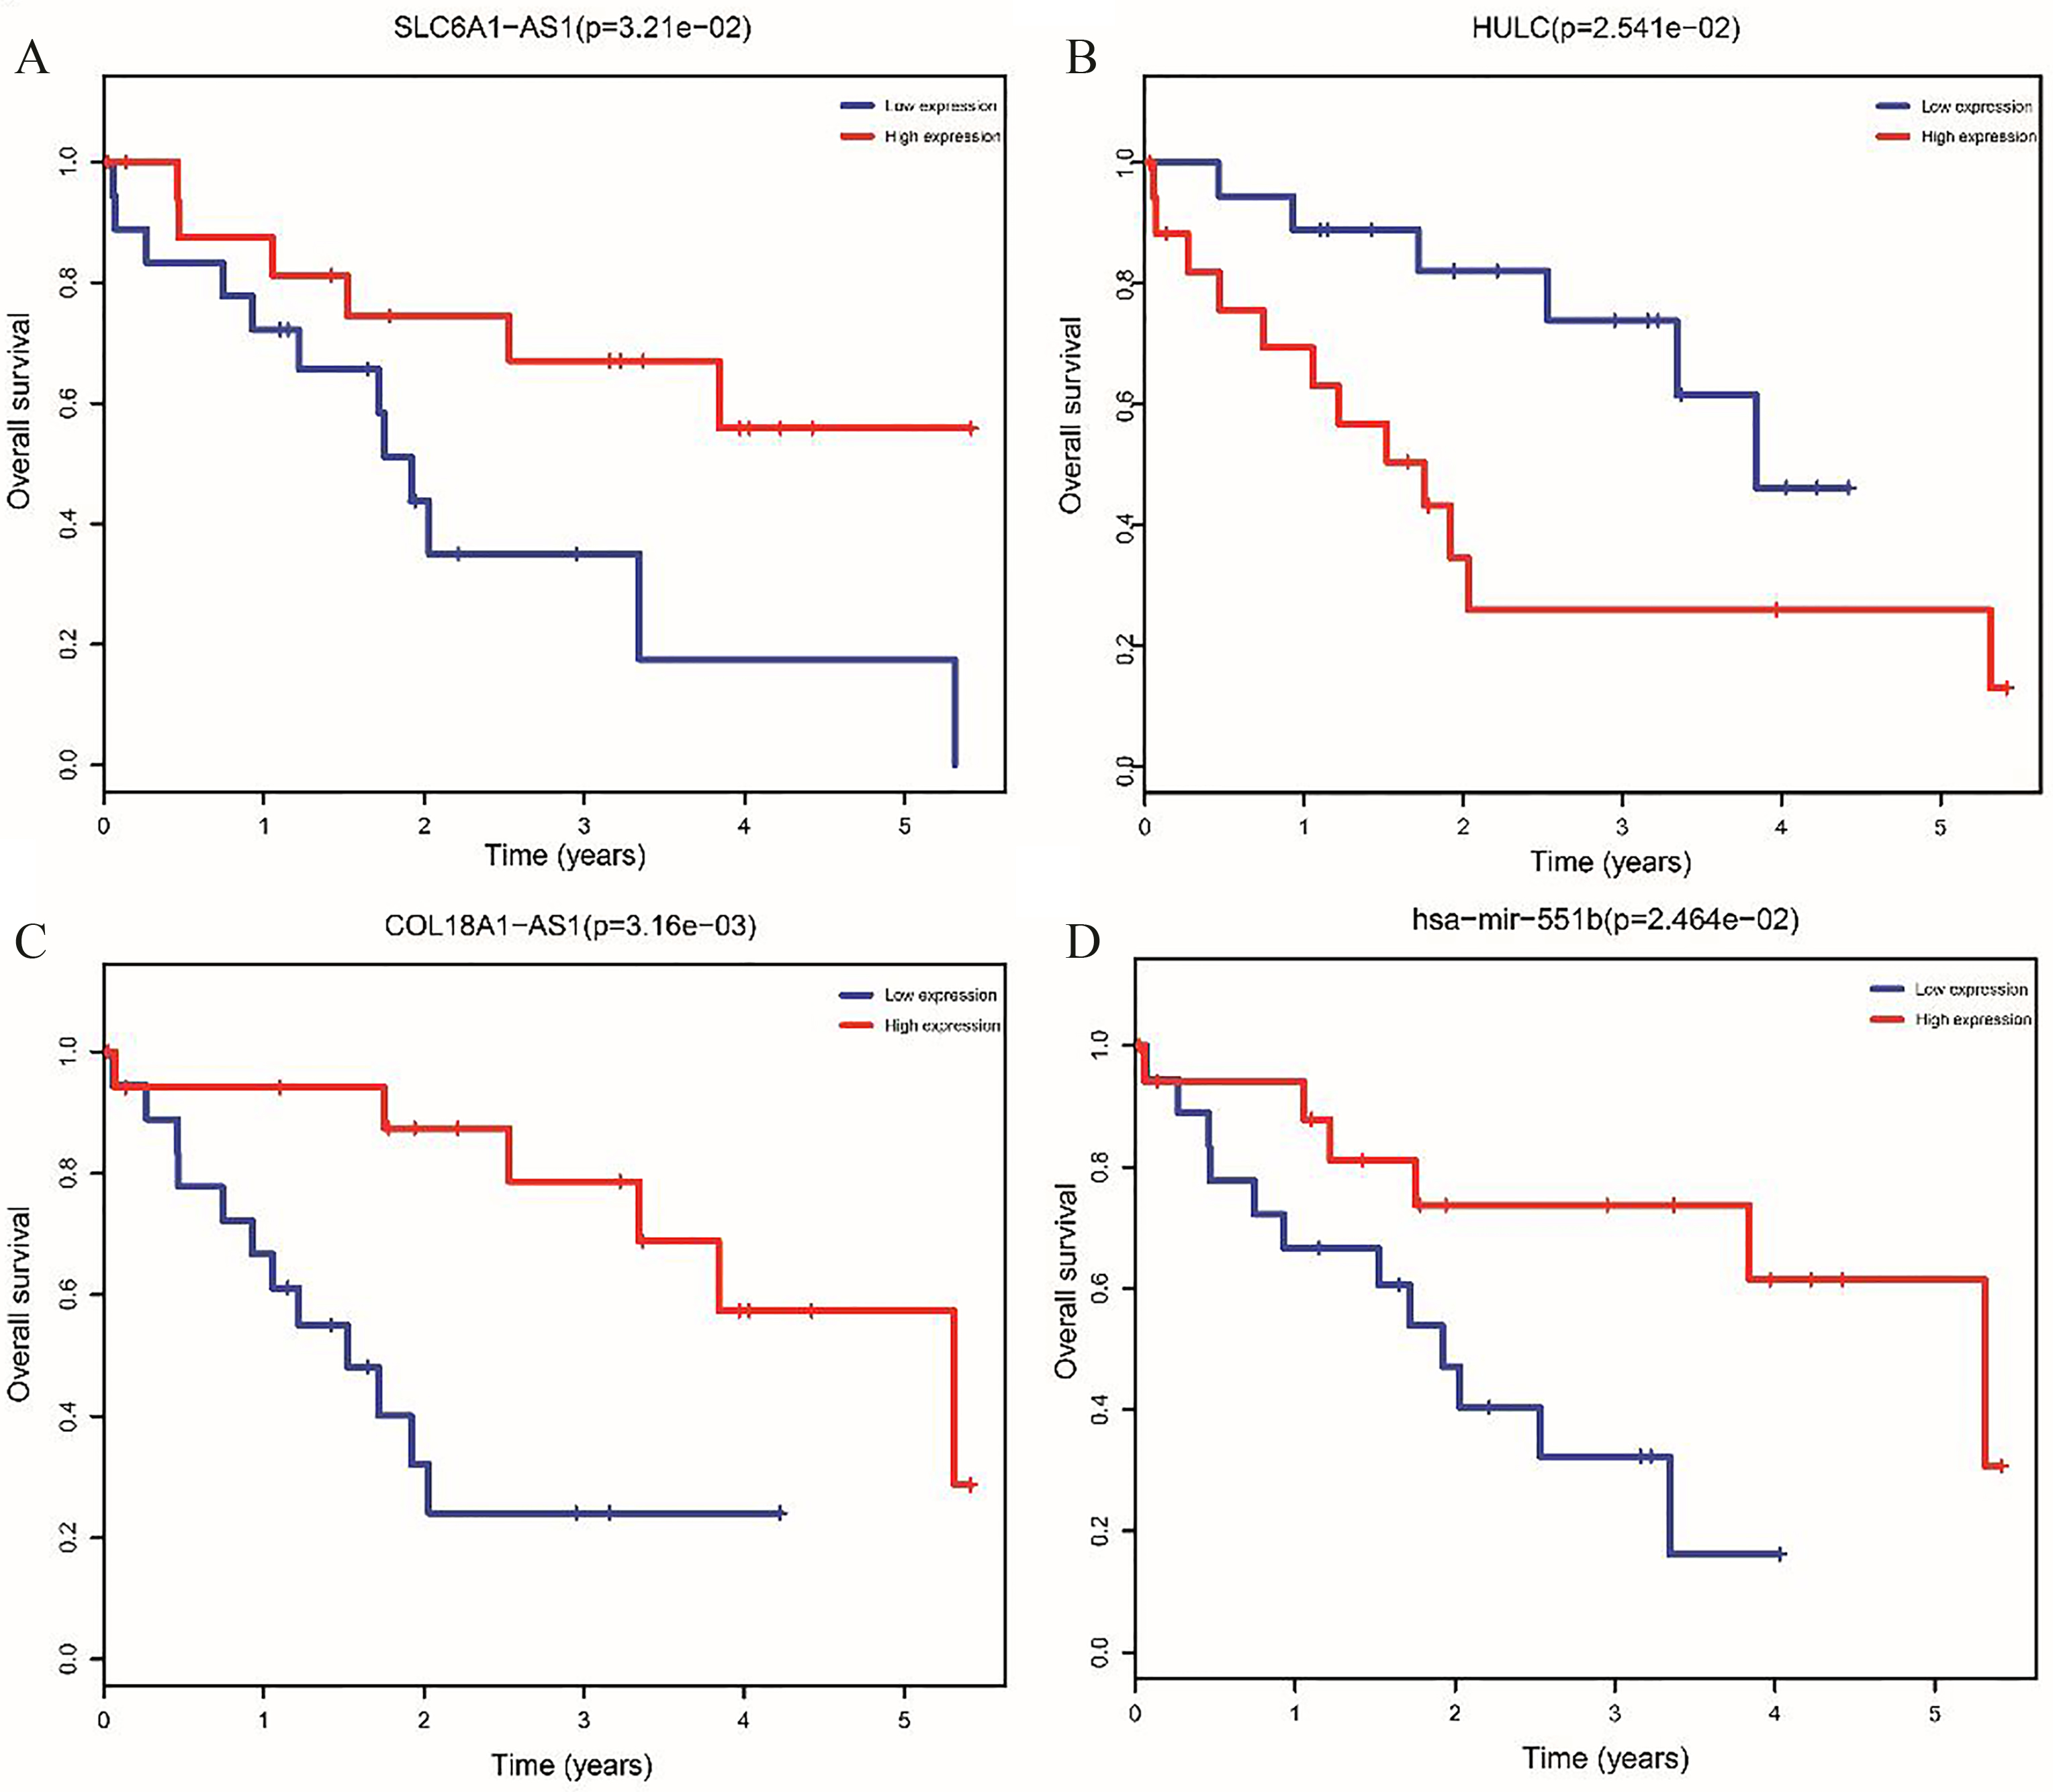
The target genes of 15 DEmiRNAs identified in the above step were predicted using TargetScan, miRDB and miRTarBase. Then, these potential target mRNAs were compared with the DEmRNAs. Finally, we identified 74 possible DEmiRNA-DEmRNA target pairs, including 15 DEmiRNAs and 64 DEmRNAs.
Construction of ceRNA network, GO annotation and KEGG pathway analysis
Combining the DElncRNA-DEmiRNA interactions with the DEmiRNA-DEmRNA interactions, we constructed the lncRNA-miRNA-mRNA ceRNA network consisting of 206 molecules and 454 interactions (Fig. 1F). Based on the KEGG pathway analysis, we found the target genes were predominantly associated with pathways in cancer, MAPK signaling pathway and osteoclast differentiation (Fig. 1G). GO enrichment analysis revealed that the miRNA target genes of the ceRNA network were highly associated sequence-specific DNA binding, growth factor activity and transcription factor activity (Fig. 1H).
Weighted gene co-expression network analysis (WGCNA) of DEmRNAs
The DEmRNAs were tested as input for hierarchical clustering analyses using function flashClust. The main cluster was more than 40%. Thus, we set 2.0E
Survival analysis for the DElncRNAs and DEmiRNAs
Kaplan-Meier curve analysis were performed to obtain the prognostic signature. The survival analysis suggested that high expression of two DElncRNAs, including COL18A1-AS1 and SLC6A1-AS1, was found to have an improved survival (Fig. 3A and C). Conversely, high expression of the other DElncRNA (HULC) was associated with poor prognosis (Fig. 3B). Similar to DElncRNAs, survival analysis indicated that high expression of hsa-mir-551b, was associated with poor prognosis (Fig. 3D).
Discussion
While major improvements in diagnosis, overall survival rates of CCA patients is very poor due to recurrence and metastasis. Therefore, to improve this situation, the identification of novel therapeutic targets by deciphering the critical molecular mechanisms regulating CCA have received increasing attention.
Recently, lncRNAs have been shown to be associated with many functional aspects of cell biology and there has been increasing attention to their role in biological functions of cancers [19, 20]. However, a few studies described interactions between miRNA and lncRNAs or mRNA and lncRNA in CCA, the results of which showed that lncRNAs can function as a key part of ceRNA network, but such ceRNA network is still poorly described. In the present study, we identified tumor-specific lncRNAs, miRNAs and mRNAs constructed a ceRNA network with these genes to clarify the unknown ceRNA regulatory network in CCA. Moreover, we performed WGCNA to discover the relationship between gene expression pattern and phenotypes.
In this study, we identified lncRNAs, miRNAs and mRNAs from TCGA database and constructed the lncRNA-miRNA-mRNA ceRNA network with CCA specific ncRNAs, miRNAs and mRNAs. 127 DElncRNAs, 15 DEmiRNAs and 64 DEmRNAs were involved in this ceRNA network. LncRNAs, defined as non-protein-coding transcripts longer than 200 nucleotide, regulate gene expression through a variety of mechanisms, including transcription, posttranscriptional processing and chromatin modification. In this study, three lncRNAs (COL18A1-AS1, SLC6A1-AS1 and HULC) were found to relate to CCA overall survival. Highly upregulated in liver cancer (HULC) is the first identified lncRNA that is strongly overexpressed in human hepatocellular carcinoma samples [21, 22]. Overexpression of HULC been confirmed to be associated with many types of cancers, such as bladder cancer, gastric cancer and colorectal carcinoma [23, 24, 25]. In our study, high expression levels of HULC were demonstrated to be associated with poor overall survival. It can be suggested that knockdown may prevent cell proliferation in many types of cancers including CCA. Our analysis also found that high expression of COL18A1-AS1 and SLC6A1-AS1 have an improved survival. However, there is little known about these lncRNAs. Therefore, further investigations are needed to clarify the function of these lncRNAs in CCA and other cancers.
Many dysregulated miRNAs could be involved in many molecular pathways associated with tumor evolution and progression. In this ceRNAs network, 15 DEmiRNAs were identified, such as hsa-mir-9, hsa-mir-182, hsa-mir-122, hsa-mir-383, hsa-mir-141, hsa-mir-200a, hsa-mir-183, hsa-mir-21, hsa-mir-31and so on. It was reported that miR-122 overexpression might play pivotal roles in inhibiting proliferation, stimulating apoptosis and suppressing invasion of human cholangiocarcinoma cells [26]. However, hsa-mir-21 overexpression was found to promote the invasion and migration of CCA cells [27].
With respect to the associations between cancer specific miRNAs and patients’ survival, hsa-mir-551b was related to CCA overall survival. Although hsa-mir-551b have been reported that inhibits EMT and metastasis in gastric cancer [28], there is little known about the function of hsa-mir-551b in CCA. Thus, further studies are required to clarify the function of hsa-mir-551b in CCA.
Twenty two DEmRNAs network modules were identified based on the WGCNA of sequencing data of CCA samples, of which five modules were significantly related to tumor grade and survival time. According to correlation study by network heatmap plot (Fig. 4), all the modules have almost no correlation with each other. GO enrichment and KEGG pathways analysis were performed to further study the biological functions of genes enriched in these five modules. It was found that modules were involved in different functions/pathways (Fig. 1 and Table 1). All five modules were involved in translation process and energy synthesis in GO term. The KEGG pathways were significantly enriched in cell cycle, transcriptional misregulation in cancer, pathways in cancer.
Recently, Wan et al. have conducted a similar study based on TCGA database [29]. They constructed a dysregulated ceRNA competitive network to globally characterize the competing difference between CCA and normal tissues. However, there were no combinations with DElncRNAs, DEmiRNAs and DEmRNAs. On the contrary, our research has revealed that these DElncRNAs and DERNAs interact with the DEmRNAs involved in successful construction of the lncRNA-miRNA-mRNA ceRNA network. Moreover, we also Moreover, we performed WGCNA to discover the relationship between gene expression pattern and phenotypes. Because the differences were in methods used for data processing, there is no overlap between our research and Wan et al’s study.
There are several limitations to the current study. First, given small number of patients in this study, our significant finds was underpowered, which have been prone to type II statistical error. Second, due to the matched controls likely represent mainly hepatocytes, this study unavoidably suffers from selection bias. Third, lack of biological confirmation is presented in our study.
In conclusion, we have constructed a ceRNA network to propose a new approach to lncRNA research in CCA. Our findings suggest that cancer specific lncRNAs in CCA may participate in a complex ceRNA network.
Footnotes
Conflict of interest
The authors declare no conflicts of interest.