
Abstract
BACKGROUND:
Previous studies have identified LCP1 as a diagnostic and prognostic marker in several cancers. However, the role of LCP1 in gastric cancer (GC) and its effect on tumor immune infiltration remain unclear.
OBJECTIVE:
The aim was to explore the role of LCP1 in GC and its effect on tumor immune infiltration.
METHODS:
We explored the expression of LCP1 relative to clinicopathology in GC patients by bioinformatics analysis and immunohistochemistry. Using cBioportal database, we analyzed the characteristic genetic variations of LCP1 in GC. In addition, we evaluated the correlation between LCP1 expression and tumor-infiltrating lymphocytes (TILs) using R software, TIMER and TISIDB databases. Finally, we analyzed the biological functions in which LCP1 may participate and the signaling pathways it may regulate.
RESULTS:
Here, we showed that LCP1 expression is significantly correlated with tumor aggressiveness and poor prognosis in GC patients. Additionally, the results indicated that LCP1 was associated with TILs, including both immunosuppressive and immunosupportive cells, and was strongly correlated with various immune marker sets in GC. GSEA analysis demonstrated that LCP1 expression played an important role in lymphocyte formation and immune reaction.
CONCLUSIONS:
LCP1 may be a potential prognostic biomarker for GC patients and a marker for tumor immunotherapy.
Introduction
Gastric cancer (GC) remains the third leading cause of cancer-related deaths, behind lung and liver cancer in males and behind breast and lung cancer in females [1]. The main treatment options for GC include surgery, chemotherapy, radiotherapy, targeted therapy and immunotherapy. However, due to the lack of effective screening methods for early GC, many patients are first diagnosed with advanced GC, leading to a five-year survival rate of approximately 30% [2]. Currently, immunotherapy is considered to be a promising approach for tumor patients, and PD-1/PD-L1 monoclonal antibodies have been proven to increase the overall survival (OS) rate in advanced GC, but only for a portion of patients [3]. Therefore, it is urgent to search for new immune targets and investigate the immune regulatory mechanism of GC tumors [4].
Lymphocyte cytosolic protein 1 (LCP1) is an actin-binding protein which was first isolated from a human fibroblast neoplasm [5]. As subsequent studies showed that this protein was also expressed in activated mouse macrophages, LCP1 is also known as leukocyte-specific plastin or L-plastin [6]. LCP1 protein has the characteristics of highly conserved and calcium-dependent phosphoproteins in the fimbrin family [7, 8]. Researchers also found that activated LCP1 induces cellular adhesion, increased actin binding and actin assembly [9]. LCP1 has been identified as a diagnostic and prognostic marker in oral, colon [10, 11], kidney [12] and lung cancers [13]. In addition, there is a similar effect in breast cancer, and high expression of LCP1 facilitates apoptotic resistance, invasion and metastatic spread in breast cancer cell lines [14]. These studies indicated that LCP1 plays an important role in the progression, invasion and metastasis of tumors. However, until now, the expression of LCP1 and its role in GC remain unclear.
Tumor immunotherapy implies stimulation of the immune system, proliferation of effector cells, infiltration of stimulated effector cells to the tumor microenvironment (TME), and destruction of the tumor cells [15]. Recently, most researchers have focused attention on the importance of tumor-infiltrating lymphocytes (TILs) in the treatment of various tumors. Anti-CTLA-4 (T-lymphocyte-associated antigen 4) mAbs block the CTLA-4 pathway, prolonging T-cell stimulation and restoring T-cell proliferation, thus enhancing their tumor-destructing ability [16]. TILs include various types of immune cells, for example, CD4
In this study, we explored the expression of LCP1 as it relates to clinicopathology in GC patients by bioinformatic analysis and immunohistochemistry (IHC) By analyzing data from the cBioportal database, we demonstrated that LCP1 genetic variations correlate with patient survival in GC. In addition, we evaluated the correlation between LCP1 expression and TILs in the TME using R software, TIMER (the Tumor Immune Estimation Resource) and TISIDB (a web portal for tumor and immune system interaction) databases. Finally, we analyzed the TCGA database using GSEA (Gene Set Enrichment Analysis) software 4.0.3 and explored the biological functions and signaling pathways in which LCP1 may participate.
Materials and methods
Analysis of LCP1 expression in various types of tumors
The expression of LCP1 in various kinds of cancer was analyzed using TIMER and the Gene Expression Profiling Analysis (GEPIA) database [20, 21]. TIMER is a comprehensive resource for systematical analysis of immune infiltrates across diverse cancer types. We used the ‘Correlation’ module of TIMER, which draws expression scatterplots between a pair of user-defined genes in a given cancer type, together with the Spearman’s correlation and estimated statistical significance. GEPIA is a newly developed interactive web server for analyzing RNA sequencing expression data from the TCGA and the GTEx projects. Dot plots profiling gene expression across multiple cancer types and paired normal samples were generated by the Gene Expression Profile website. The threshold was determined as follows: fold change of 1.0,
Immunohistochemistry and evaluation of immunostaining intensity
This study consisted of 140 samples from 90 GC patients (90 GC tissues and 50 gastric mucosal tissues) at the First Affiliated Hospital of Nanchang University from November 2019 to April 2020. These tissue paraffin blocks were sliced into 3.5
Analysis of the correlation between LCP1 expression and patient survival in GC
The correlation between LCP1 mRNA expression and patient survival in GC was analyzed using the Kaplan-Meier plotter, which is capable of assessing the effect of 54,000 genes on survival in 21 cancer types, including the largest datasets of breast cancer (
Analyses of LCP1 gene mutations and copy number alterations (CNA) in GC
Genetic mutations and CNAs of LCP1 in GC were analyzed in three datasets, including the TCGA Firehose Legacy, Nature 2014 and PanCan Atlas, using the cBioPortal database [23, 24]. The genetic variations of LCP1 were evaluated with the default parameter settings. In addition, we used the ‘Survival’ module to analyze overall survival in the genetically altered and unaltered groups.
Analysis of the characteristics of immune cells in GC and expression differences compared with normal tissue
There were 374 RNA-seq gene expression profiles of GC patients included in the FPKM and count format search of the TCGA database. R software (R foundation for Statistical Computing) was used to screen data to obtain the mRNA matrices for subsequent analysis [25]. There were 257 RNA-seq gene expression profiles of patients (including 15 normal counts and 242 tumor counts) filtered by R software. Analyses of the abundance ratio, correlation and expression between GC tissues and normal tissues were then conducted among the 22 immune cells in the 257 samples.
Analysis of the correlation between GC LCP1 expression and immune cell infiltration
TISIDB is a web portal for tumor and immune system interaction that integrates multiple heterogeneous data types [26] and can evaluate correlations between the target genes and lymphocytes. In this study, we employed this website to analyze the correlation between LCP1 expression and lymphocytes in GC. To confirm the significance of the above results, we employed TIMER to infer the abundance of tumor-infiltrating immune cells (TIICs) from gene expression profiles with LCP1 expression. We analyzed the correlation between LCP1 expression and tumor purity and abundance of immune infiltrates, including B cells, CD4
Analysis of function and pathway enrichment
A total of 374 GC RNA-seq gene expression profiles were downloaded from the TCGA database and further processed into the prepared files using R software. These files were composed of the sample expression files (format gct.) and phenotypic classification files (format cls.). GSEA software is a computational method that determines whether an a priori defined set of genes shows statistically significant, concordant differences between two biological states [29]. We employed GSEA software 4.0.3 to analyze these datasets for biological functions and related biological pathways of genes coexpressed with LCP1. A threshold nominal
Statistical analysis
Data analysis was calculated using SPSS 26.0 software (IBM Corporation, Armonk, NY, USA), and diagrams were created using the GraphPad Prism 8.0 software (GraphPad Software, La Jolla, CA, USA). For IHC data, the
LCP1 expression levels in various human cancers. Abbreviations of cancer types are presented in Supplementary Table S1. (a) The expression of LCP1 mRNA in different types of cancer and normal tissue from the TCGA database, analyzed by TIMER (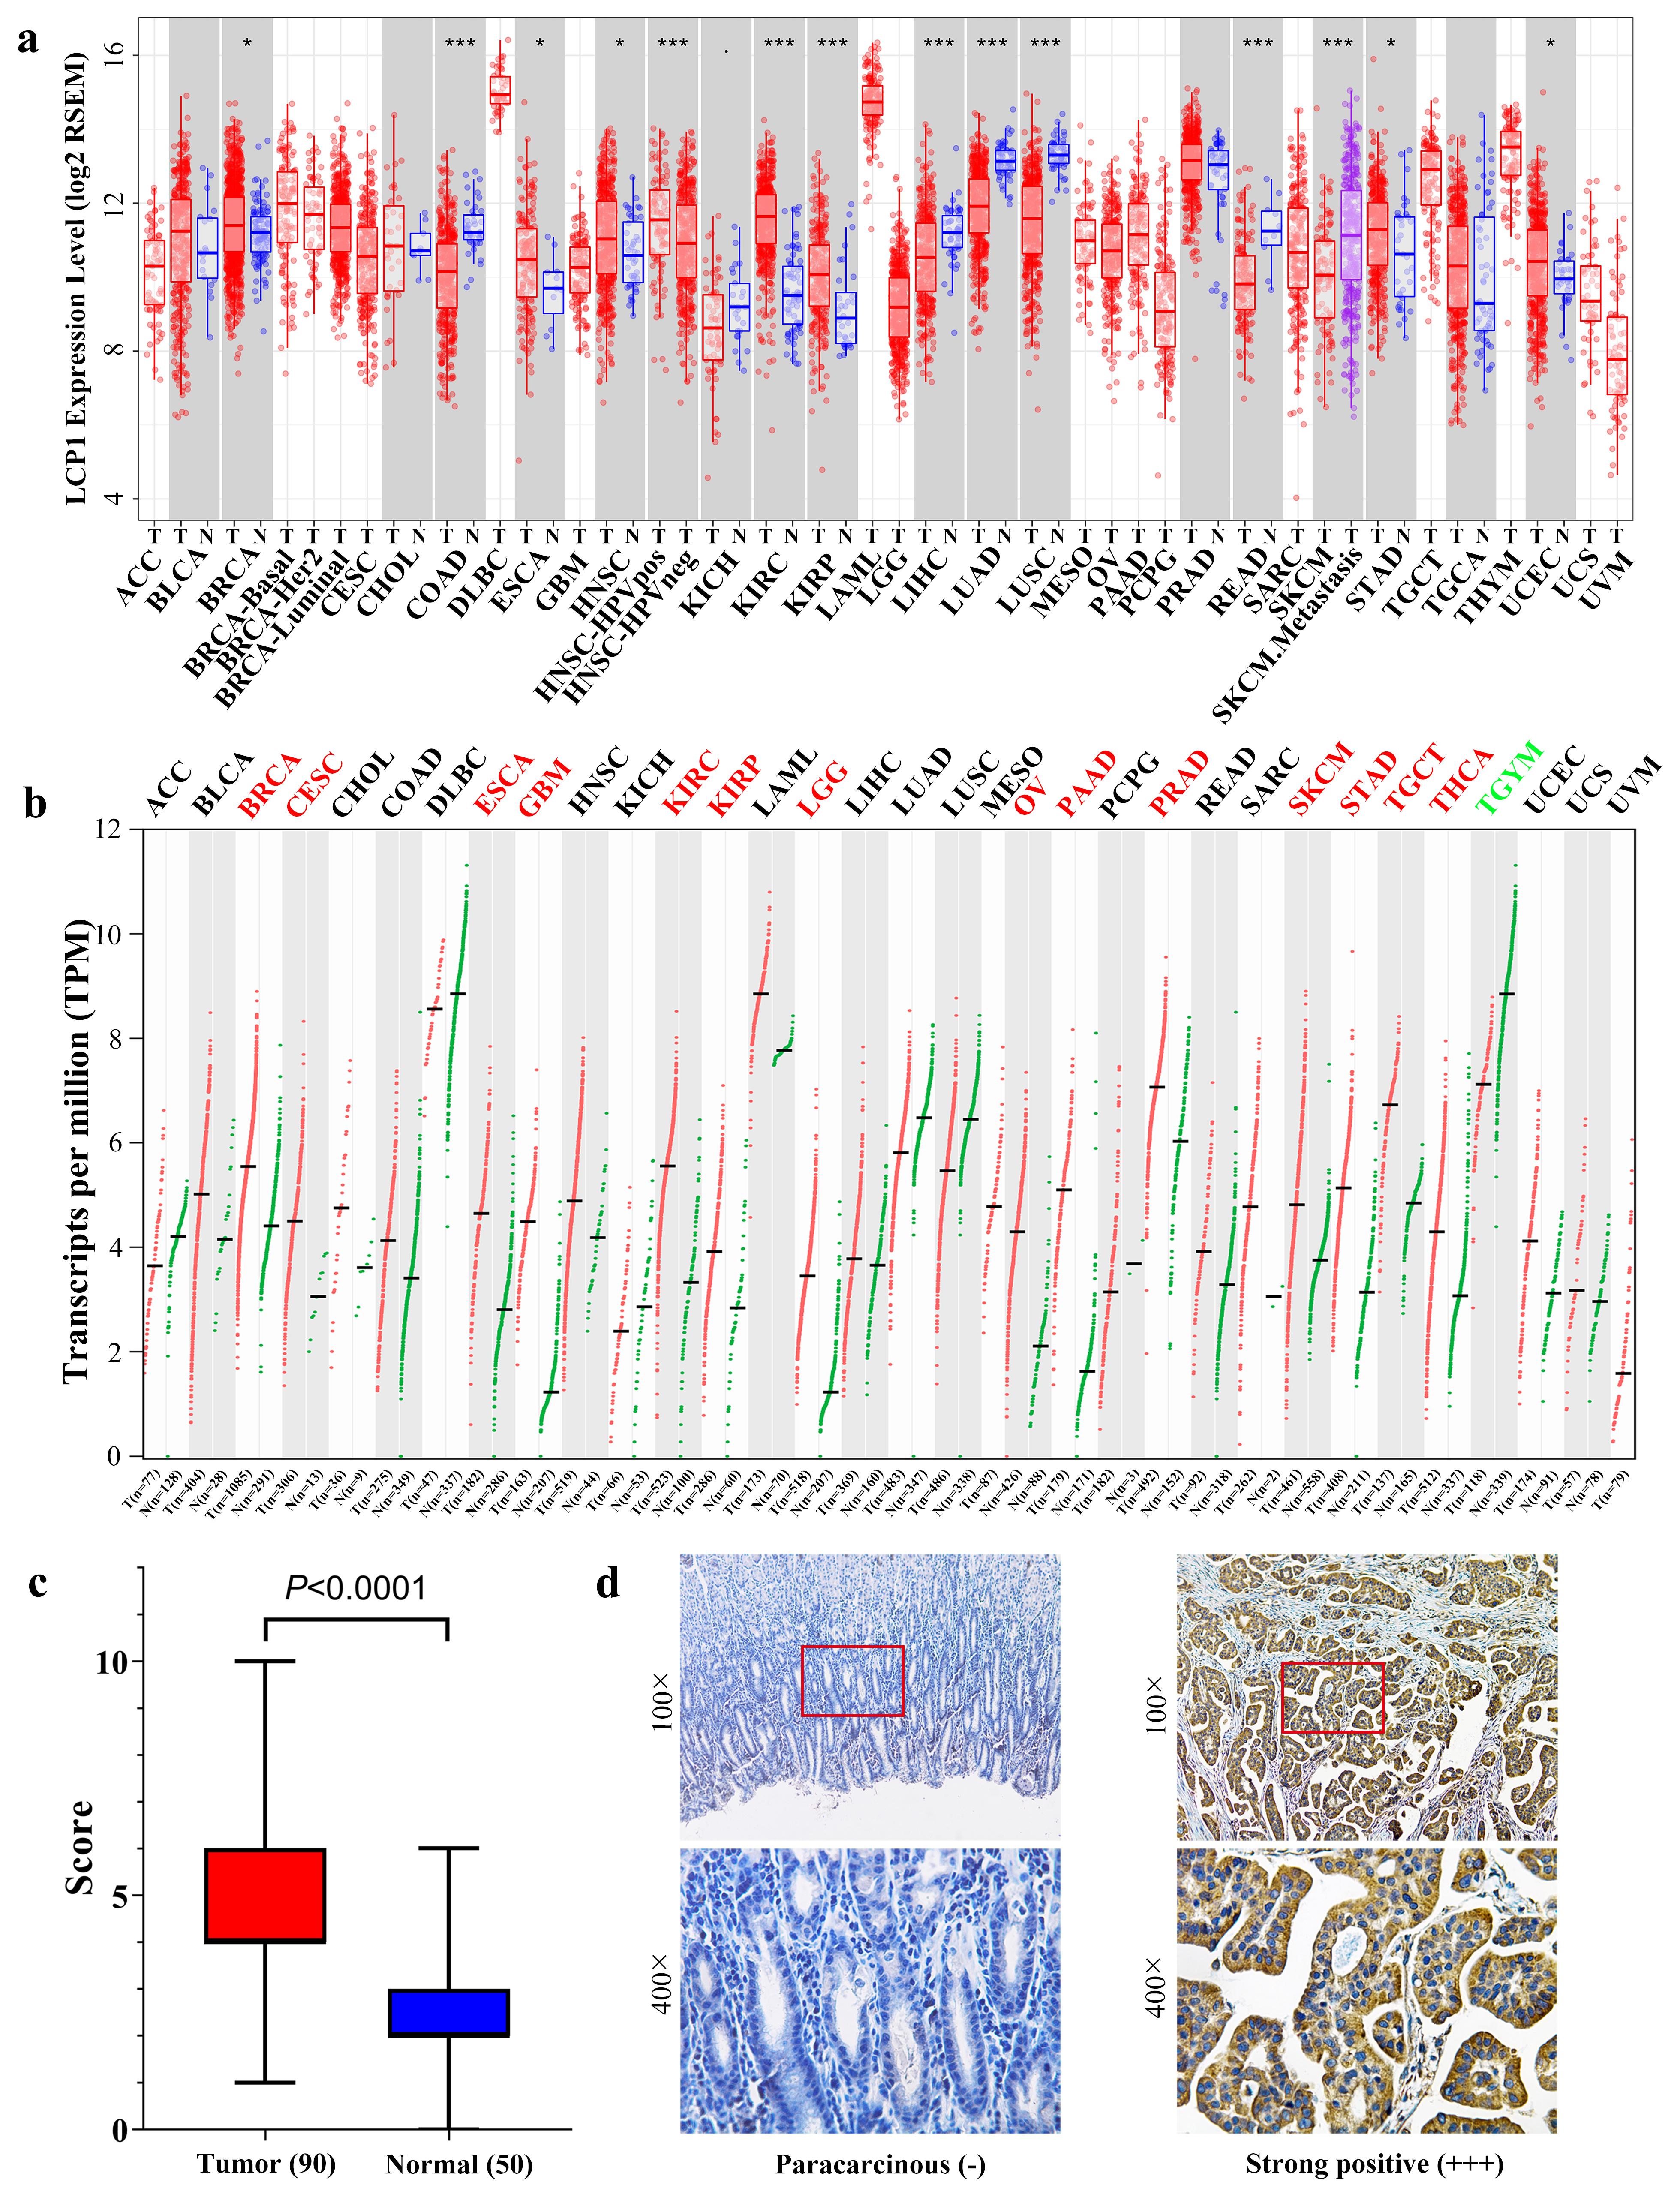
Correlation of LCP1 expression and clinicopathologic features in gastric cancer
The mRNA expression levels of LCP1 in various types of cancer
To explore the expression of LCP1 in tumor and normal tissues, the mRNA levels in different types of cancer and their normal tissues were analyzed using TCGA RNA-seq data in TIMER. As the results show in Fig. 1a, the LCP1 expression levels were higher in most cancer types, including BRCA (breast invasive carcinoma), ESCA (esophageal carcinoma), HNSC (head and neck squamous cell carcinoma), KIRC (kidney renal clear cell carcinoma), KIRP (kidney renal papillary cell carcinoma), STAD (stomach adenocarcinoma) and UCEC (uterine corpus endometrial carcinoma) tumor issues. However, LCP1 expression was significantly lower in COAD (colon adenocarcinoma), LIHC (liver hepatocellular carcinoma), LUAD (lung adenocarcinoma), LUSC (lung squamous cell carcinoma) and READ (rectum adenocarcinoma) tumor issues compared to normal issue counterparts.
To further confirm the expression of LCP1 in tumor and normal tissues analyzed by TIMER, the GEPIA database was used. From Fig. 1b, it is evident that the mRNA expression of LCP1 was different in tumor and normal tissues among various cancers. LCP1 expression was significantly higher in BRCA, CESC (cervical squamous cell carcinoma and endocervical adenocarcinoma), ESCA, KIRC, KIRP, LGG (brain lower grade glioma), OV (ovarian serous cystadenocarcinoma), PAAD (pancreatic adenocarcinoma), PRAD (prostate adenocarcinoma), SKCM (skin cutaneous melanoma), STAD, TGCT (testicular germ cell tumors) and THCA (thyroid carcinoma) compared with adjacent normal tissues. However, a lower expression level of LCP1 was detected only in THYM (Thymoma) compared with adjacent normal tissues. In total, BRCA, ESCA, KIRC, KIRP and STAD had significantly higher LCP1 expression compared to normal tissue in these databases. STAD (GC) was chosen for follow-up study.
We collected 90 GC tissues and 50 gastric mucosal tissues to explore LCP1 protein expression using IHC. Additionally, chi-square and Fisher exact tests were used to detect correlations of LCP1 expression with clinicopathologic features in GC. According to the statistical results of
Kaplan-Meier survival curves comparing the high and low expression of LCP1 in three probe sets in the Kaplan-Meier plotter databases. (a)–(c) OS, PFS and PPS survival curves of GC (201683_s_at). (d)–(f) OS, PFS and PPS survival curves of GC (201684_s_at). (g)–(i) OS, PFS and PPS survival curves of GC (217448_s_at). OS, overall survival; PFS, progression-free survival; PPS, postprogression survival.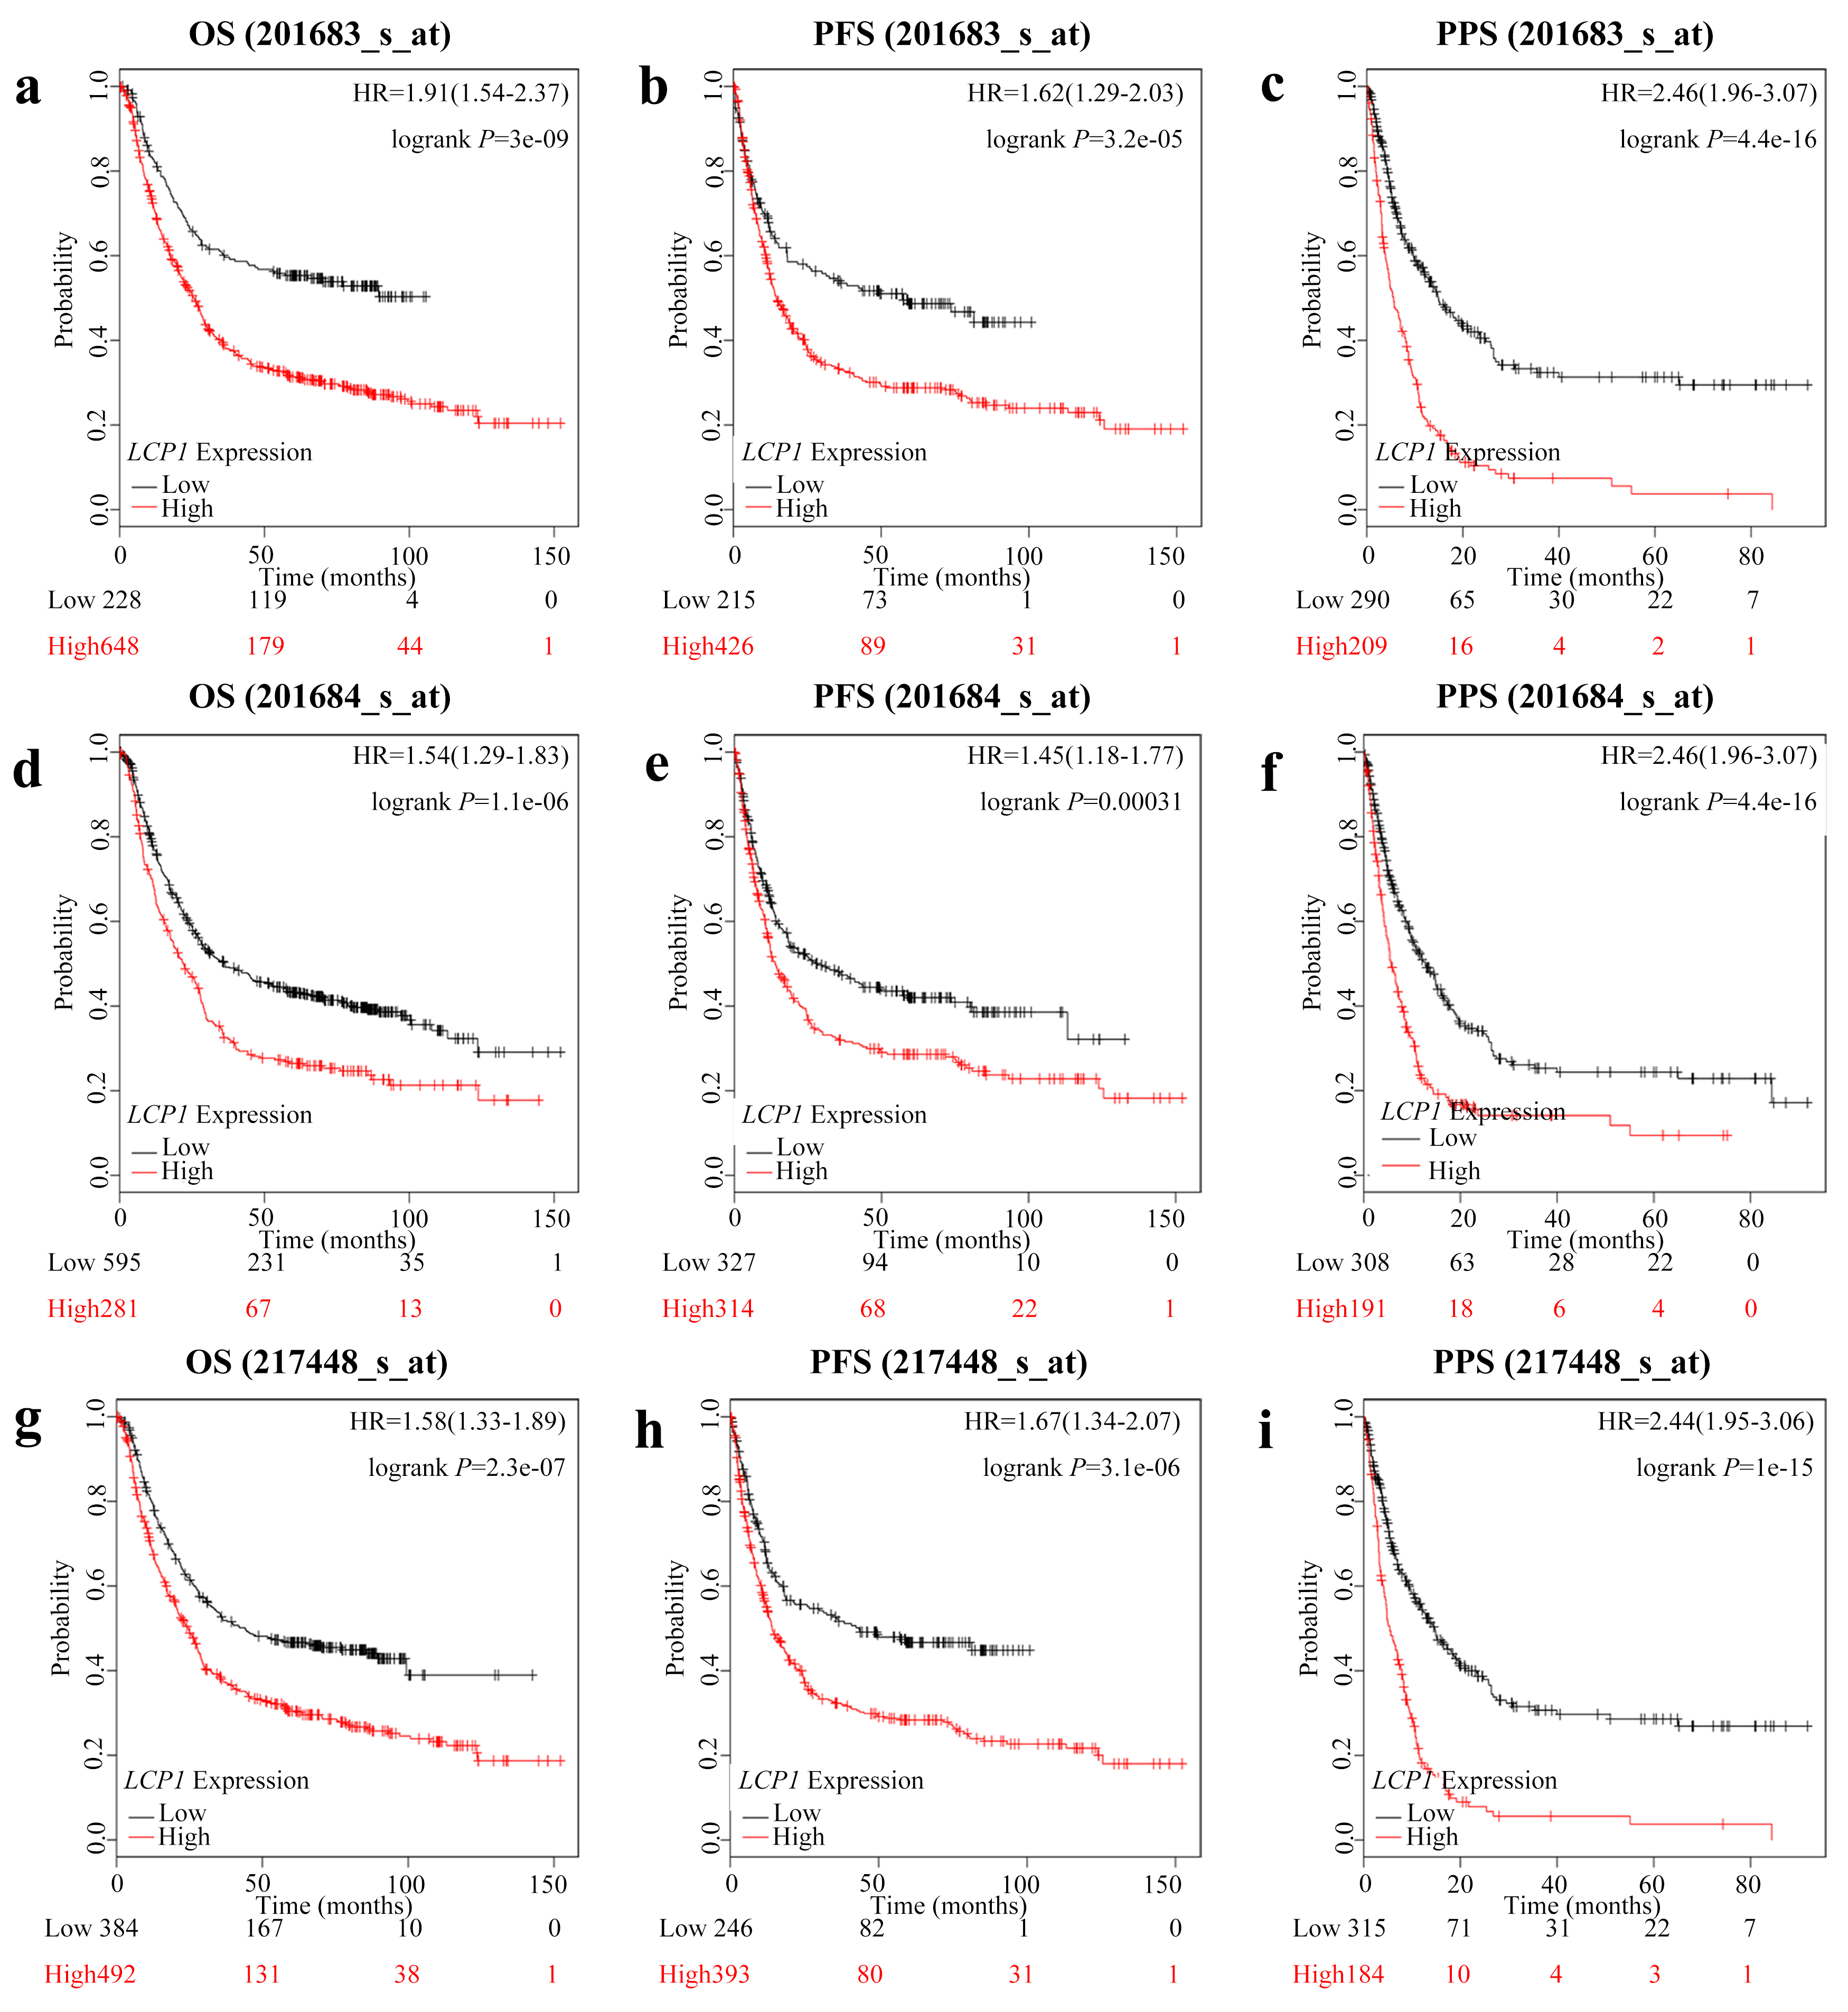
Correlation of LCP1 mRNA expression and clinical prognosis in gastric cancer with different clinicopathological factors by Kaplan-Meier plotter
Bold values indicate
To evaluate the correlation between LCP1 expression levels and patient survival rate in GC patients, we used the Kaplan-Meier plotter database. The overall survival (OS), progression-free survival (PFS) and postprogression survival (PPS) were calculated with the Start KM Plotter for GC module. There were three candidate probe sets (201683_s_at, 201684_s_at and 217448_s_at) for gene symbol LCP1 (Fig. 2). Interestingly, the LCP1 expression levels showed significant negative correlation with patient survival rate in the three probe sets: 201683_s_at (OS HR
Correlation of LCP1 expression with clinicopathological characteristics of GC in kaplan-meier plotter database
To better evaluate the correlation and discover the mechanisms underlying the contribution of LCP1 expression level to GC, we analyzed the impact of LCP1 expression on clinical GC characteristics using the Kaplan-Meier plotter database (Table 2). There were 876, 641 and 499 patients with OS, PFS and PPS, respectively. High LCP1 expression was significantly associated with worse OS, PFS and PPS in almost all subtypes of stage 1–4, stage T2-4, stage M0-1 and HER2 status. However, there were no significant correlations with PFS in stage 1 (HR
LCP1 expression and genetic variations in GC. (a) Correlation analysis of LCP1 expression and clinical stages in gastric cancer through GEPIA. (b) A schematic diagram represents location and frequency of each mutation across the coding sequence of LCP1 in 478 cases from TCGA, Firehose legacy (TCGA); 295 cases from TCGA, nature 2014 (TCGA Pub); and 440 cases from TCGA, PanCancer Atlas (TCGA PanCan) via the cBioPortal database. (c) Frequencies of LCP1 mutations and copy number alterations (CNA) in the three datasets. (d) Kaplan-Meier survival curves comparing patients with or without LCP1 alterations in 393 cases from TCGA, Firehose legacy and 434 cases from TCGA, PanCancer Atlas.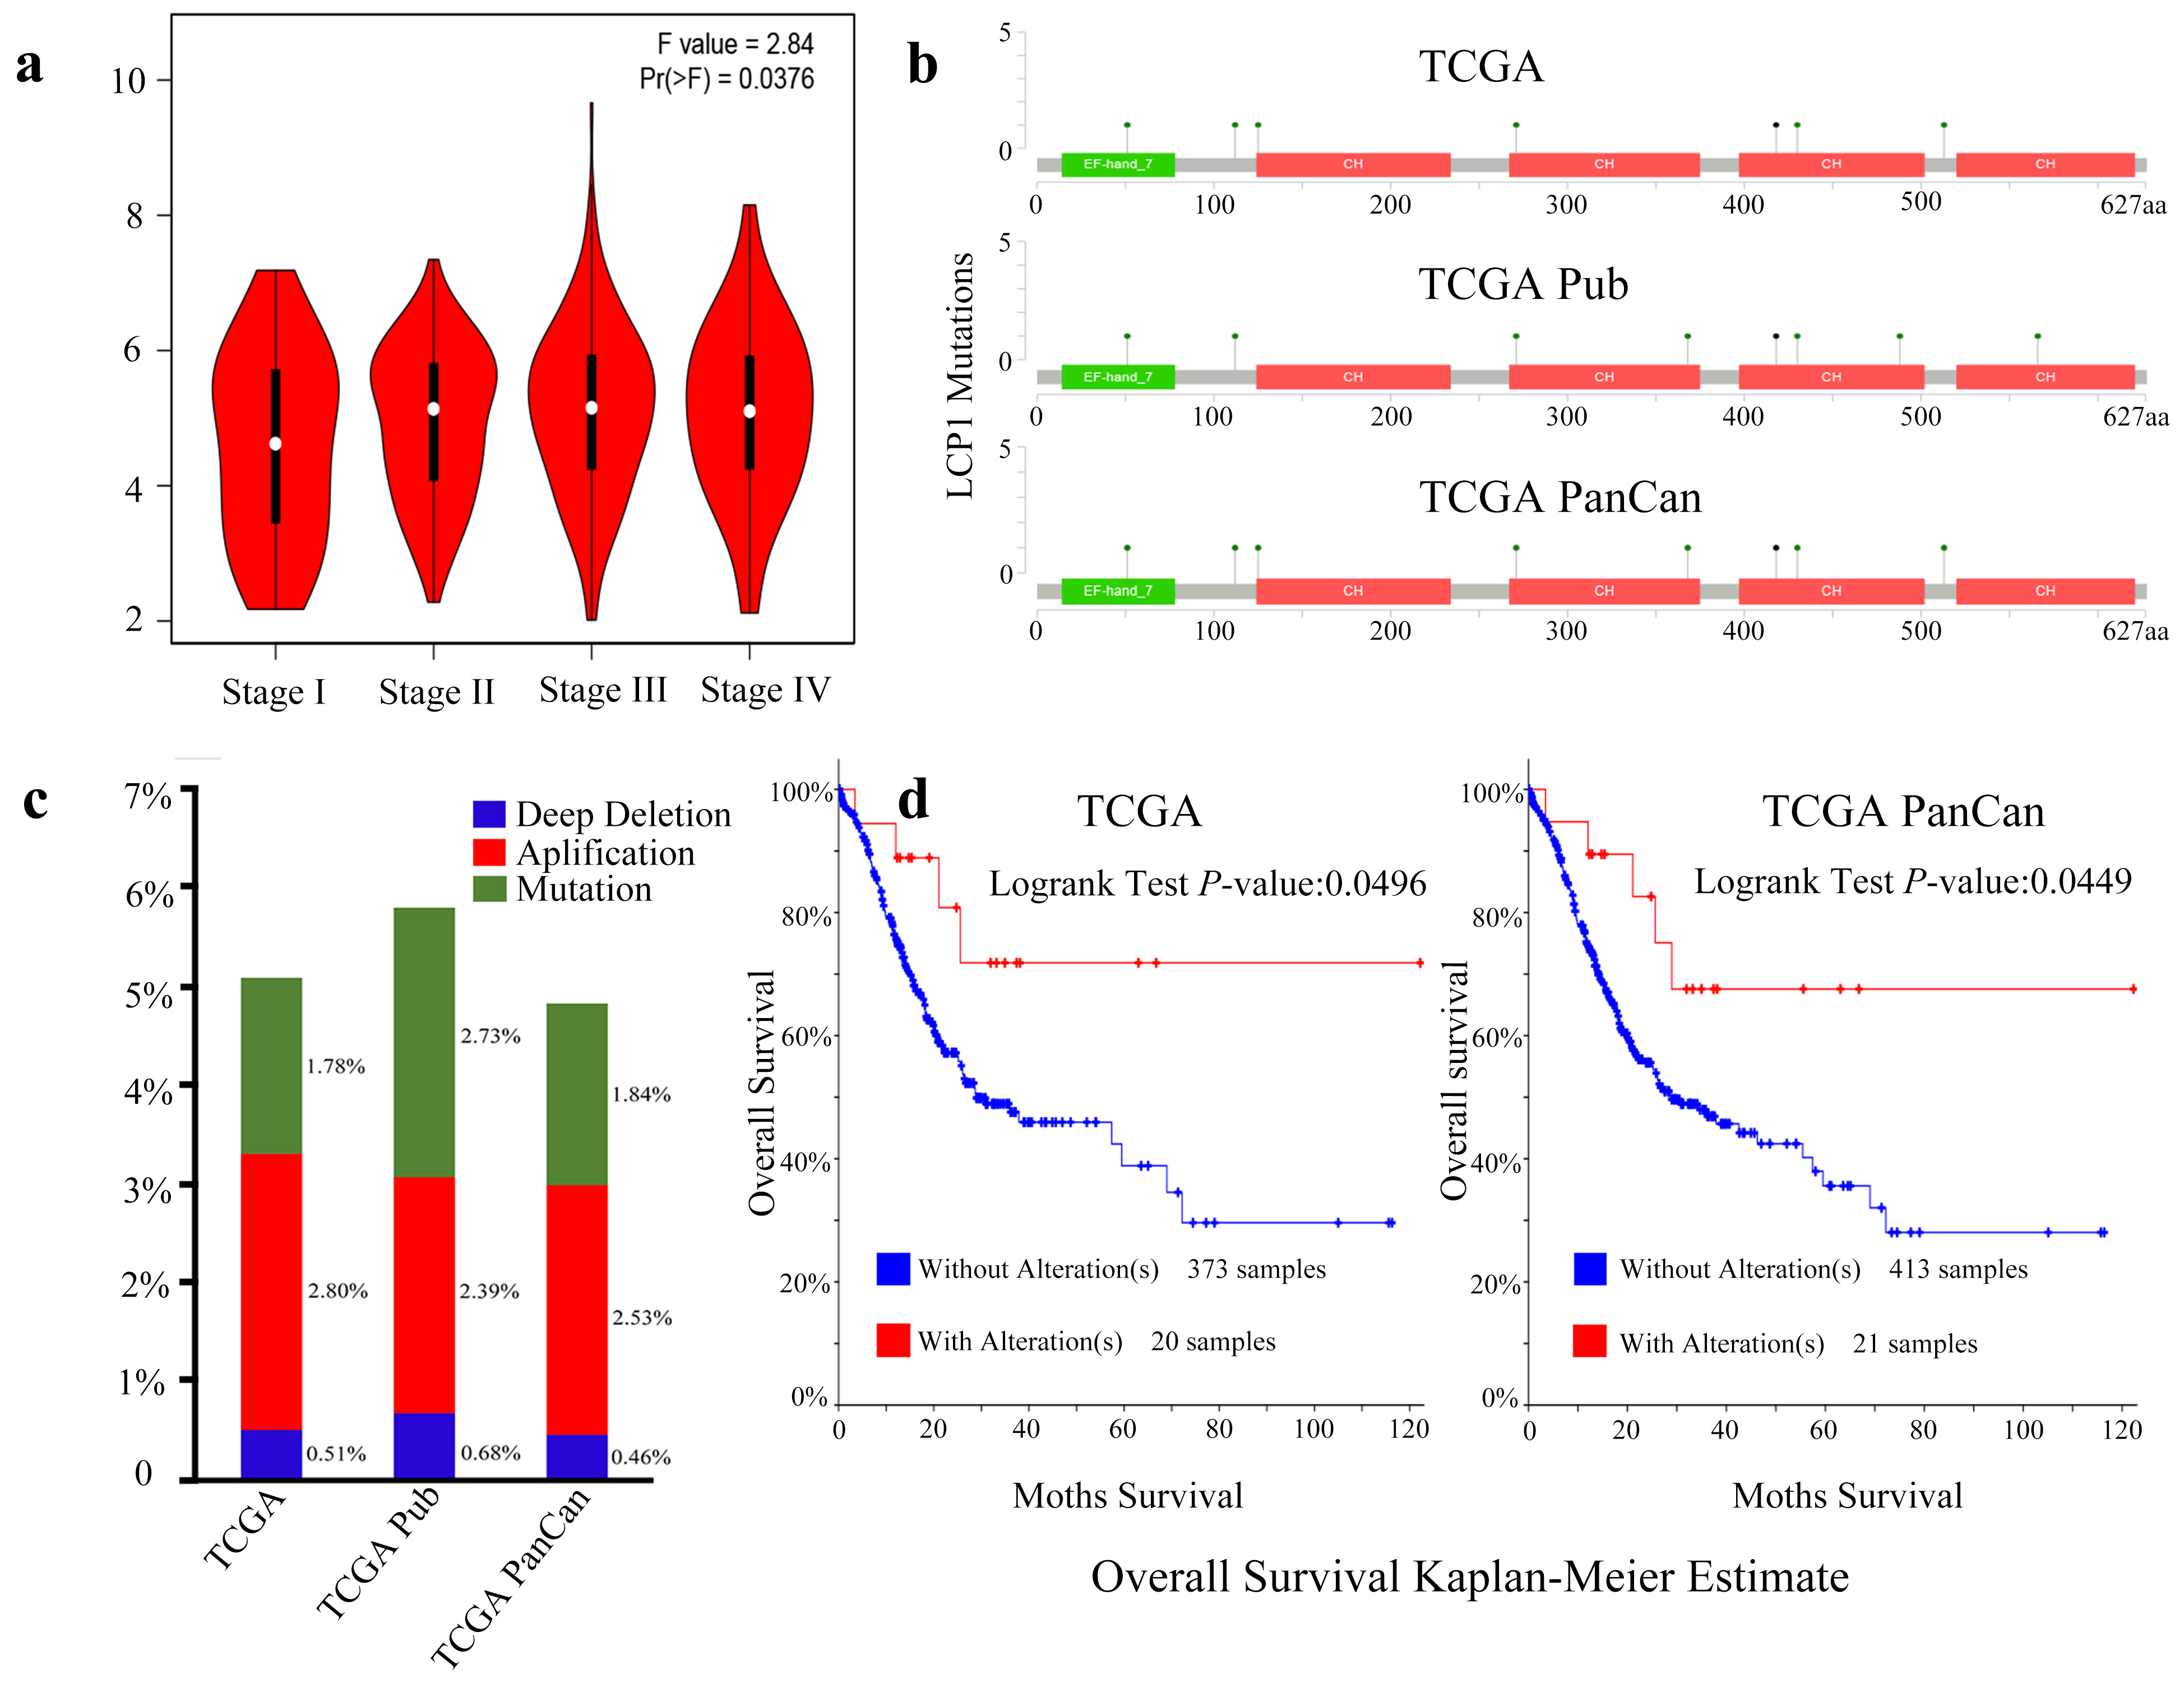
The correlation and expression level of immune cells in GC. (a) The abundance ratio of immune cells in the 257 RNA-seq samples. Each column represents a sample, and each row represents the abundance ratio of immune cells via different colors and heights. (b) The relationship between the abundance ratio of different immune cells. This value represents the correlation value. Red is positive, and blue is negative. (c) The expression differences of immune cells in tumor tissues compared to normal tissues. Red represents tumor tissue, and blue represents normal tissues. 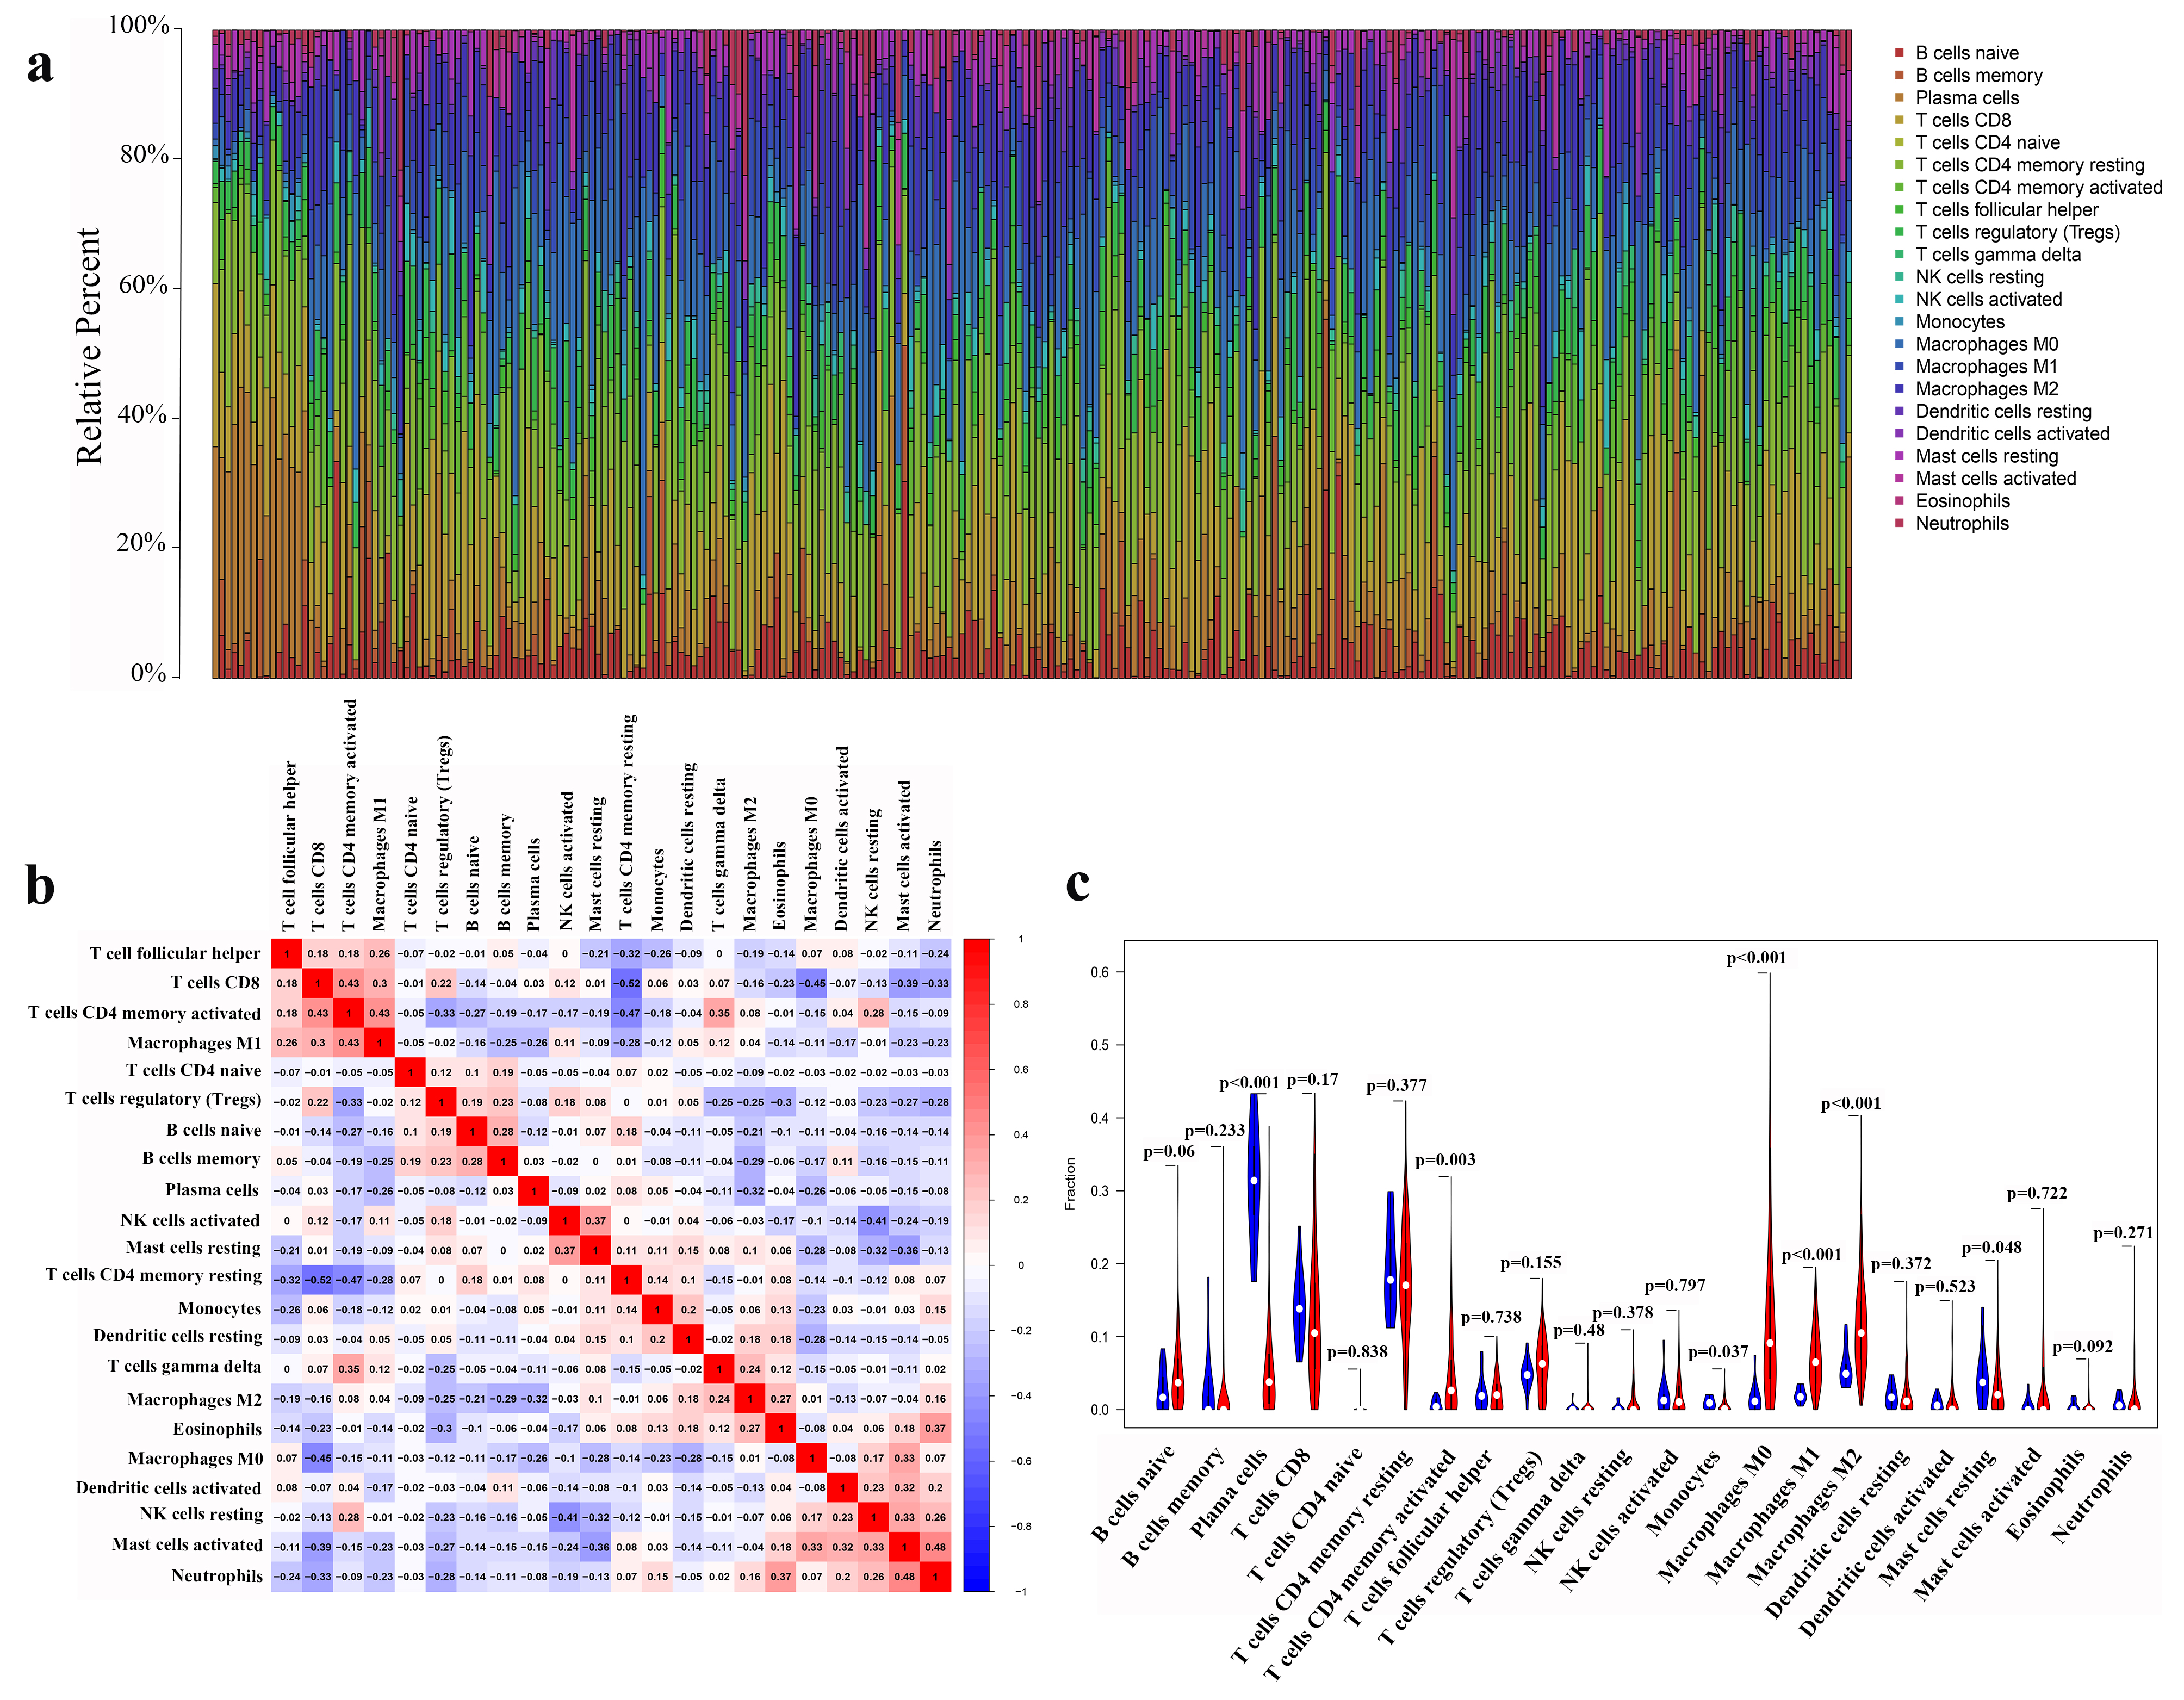
To better understand LCP1 expression levels in the different TNM stages of GC, we employed the GEPIA database. As is shown in Fig. 3a, LCP1 expression level was significantly different from stage I to IV (
Characteristics of immune cells in GC and expression differences compared with normal tissues
We found that there was the abundance ratio of 22 immune cells in the 257 GC RNA-seq samples (Fig. 4a). To further investigate the underlying mechanisms of this immune response, we analyzed the correlation of the 22 immune cells in GC (Fig. 4b). CD8 T cells significantly correlated with activated memory CD4 T cells, which, in contrast, negatively correlated with resting memory CD4 T cells, M0 macrophages, activated mast cells and neutrophils. Activated memory CD4 T cells were positively correlated with M1 macrophages, gamma delta T cells and resting NK cells, while an inverse correlation was determined with regulatory T cells (Tregs) and resting memory CD4 T cells. In addition, activated mast cells showed a positive relationship with M0 macrophages, activated dendritic cells, resting NK cells and neutrophils, which were negatively correlated with resting memory CD4 T cells. Interestingly, there was an obvious negative correlation between Tregs and most effective immune cells. Then, we analyzed the infiltration level of the 22 immune cells in GC tissues compared to normal gastric tissues (Fig. 4c). The infiltration levels of activated memory CD4 T cells and M0, M1 and M2 macrophages were significantly higher in GC tissues, while plasma immune cells, monocytes and resting mast cells infiltrated to lower levels in tumor tissues than normal tissue counterparts.
Spearman’s correlation of LCP1 with lymphocytes via TISIDB and TIMER in GC tissues. (a) The correlation between LCP1 expression and the abundance of TILs by the TISIDB database. (b) Detailed information on the correlation between LCP1 expression and the abundance of CD8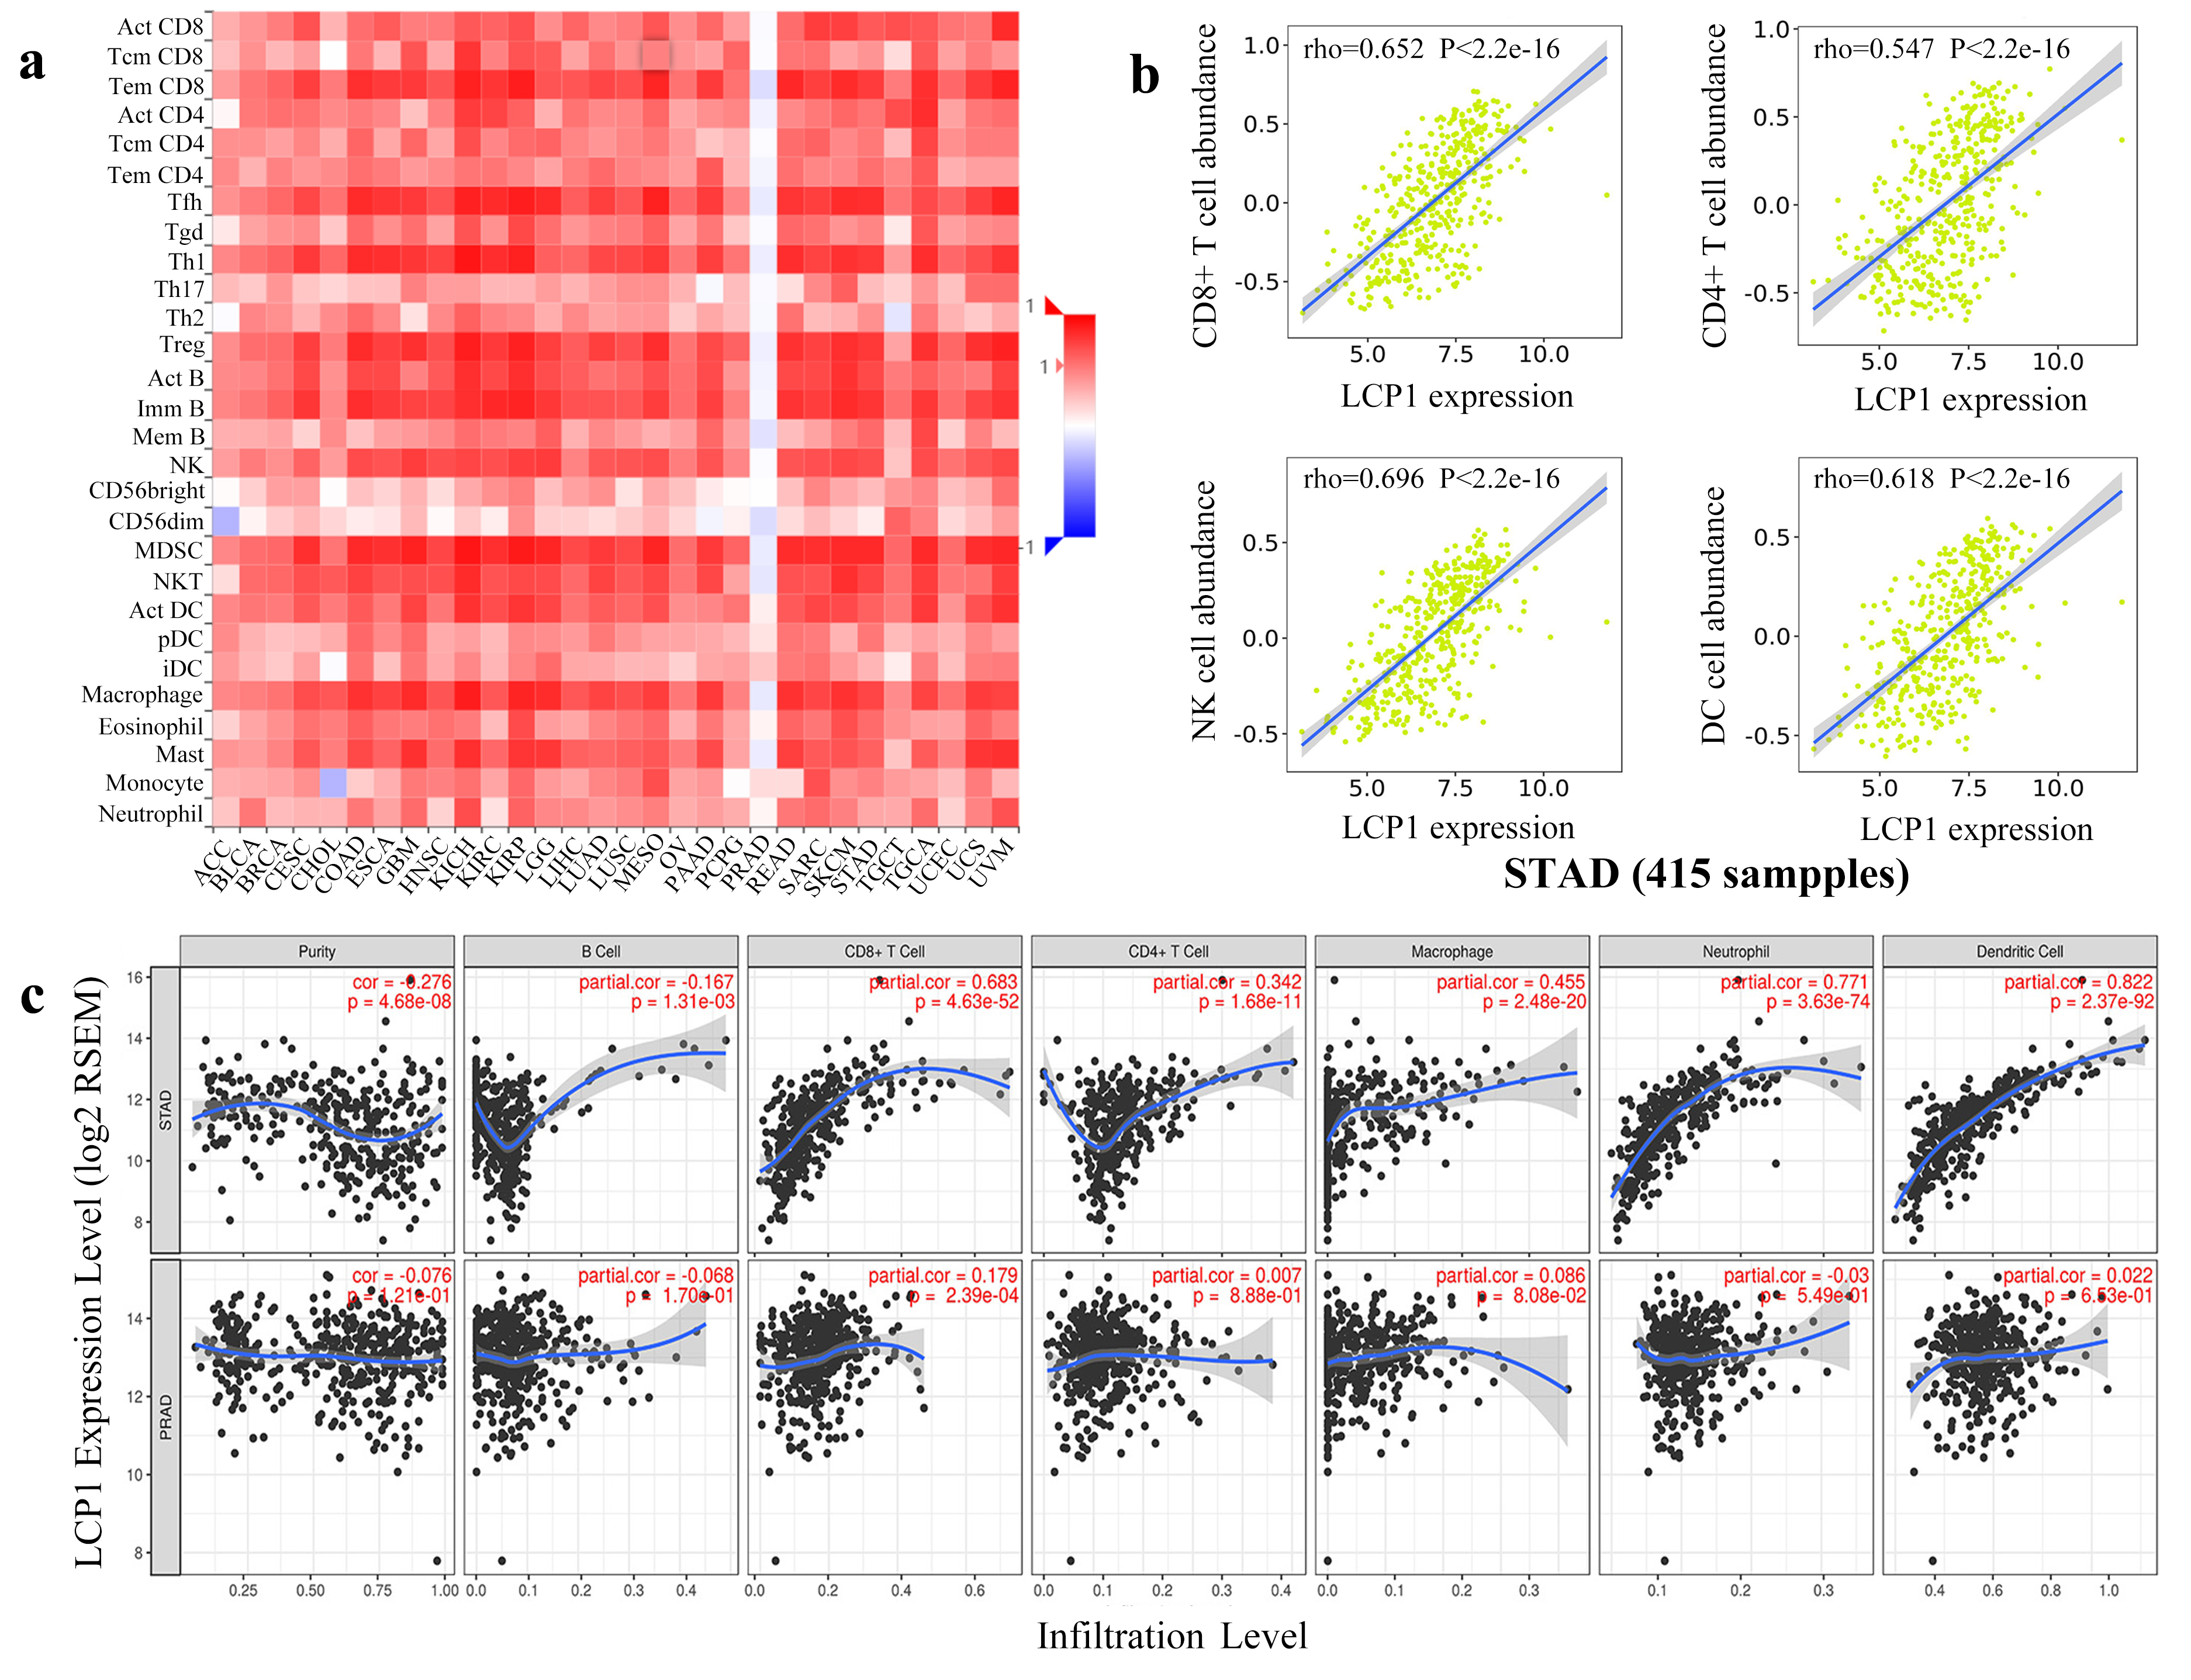
Correlation analysis between LCP1and relate genes and markers of immune cells in TIMER
STAD, stomach adenocarcinoma; PRAD, prostate adenocarcinoma; TAM, tumor-associated macrophage; Th, T helper cell; Tfh, follicular helper T cell; Treg, regulatory T cell; Cor. R value of Spearman’s correlation; None, correlation without adjustment. Purity, correlation adjusted by purity.
Correlation between LCP1 and markers of CD8
STAD, stomach adenocarcinoma; PRAD, prostate adenocarcinoma; TAM, tumor-associated macrophage; R, R value of Spearman’s correlation;
Correlation between LCP1 expression and various subsets of immune cell infiltrates in STAD and PRAD via the TIMER database. Markers include CD8A and CB8B for CD8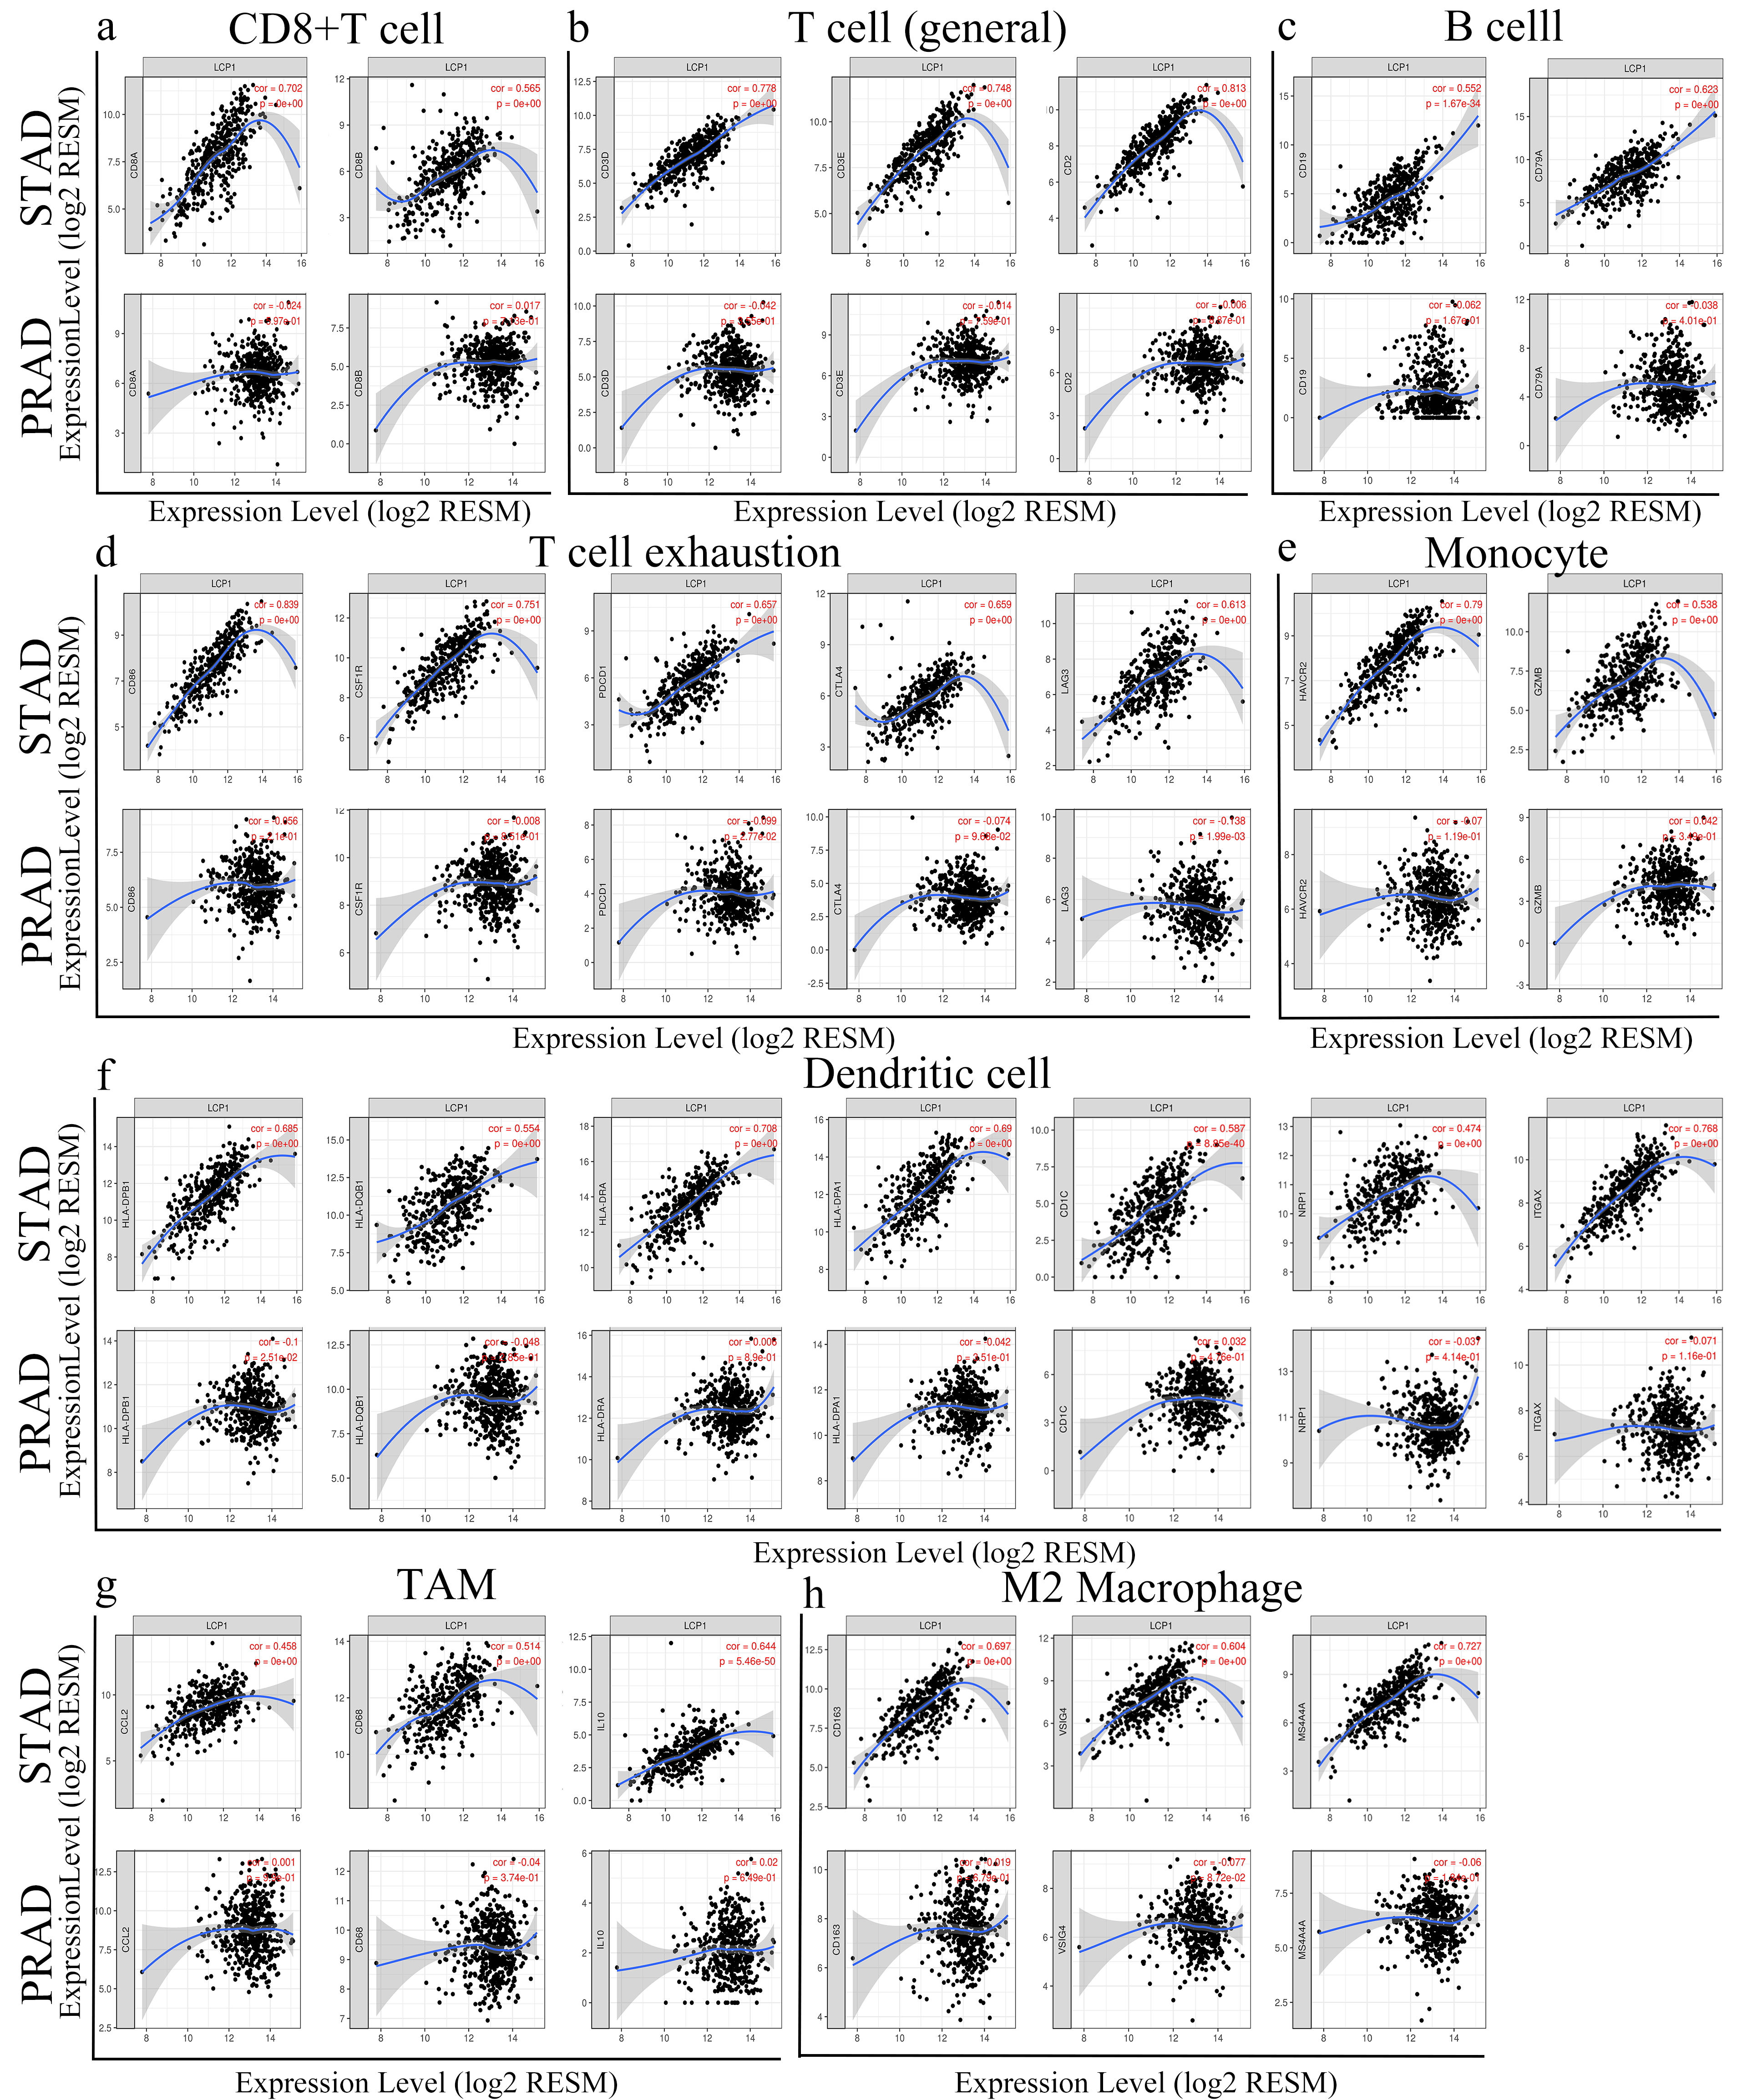
Functional and pathway enrichment analyses of genes coexpressed with LCP1 expression via GSEA software 4.0.3. (a) Graph representing enriched biological functions (GO) of genes coexpressed with LCP1 expression in GC. (b) Graph representing enriched biological pathways (KEGG) of genes coexpressed with LCP1 expression in GC.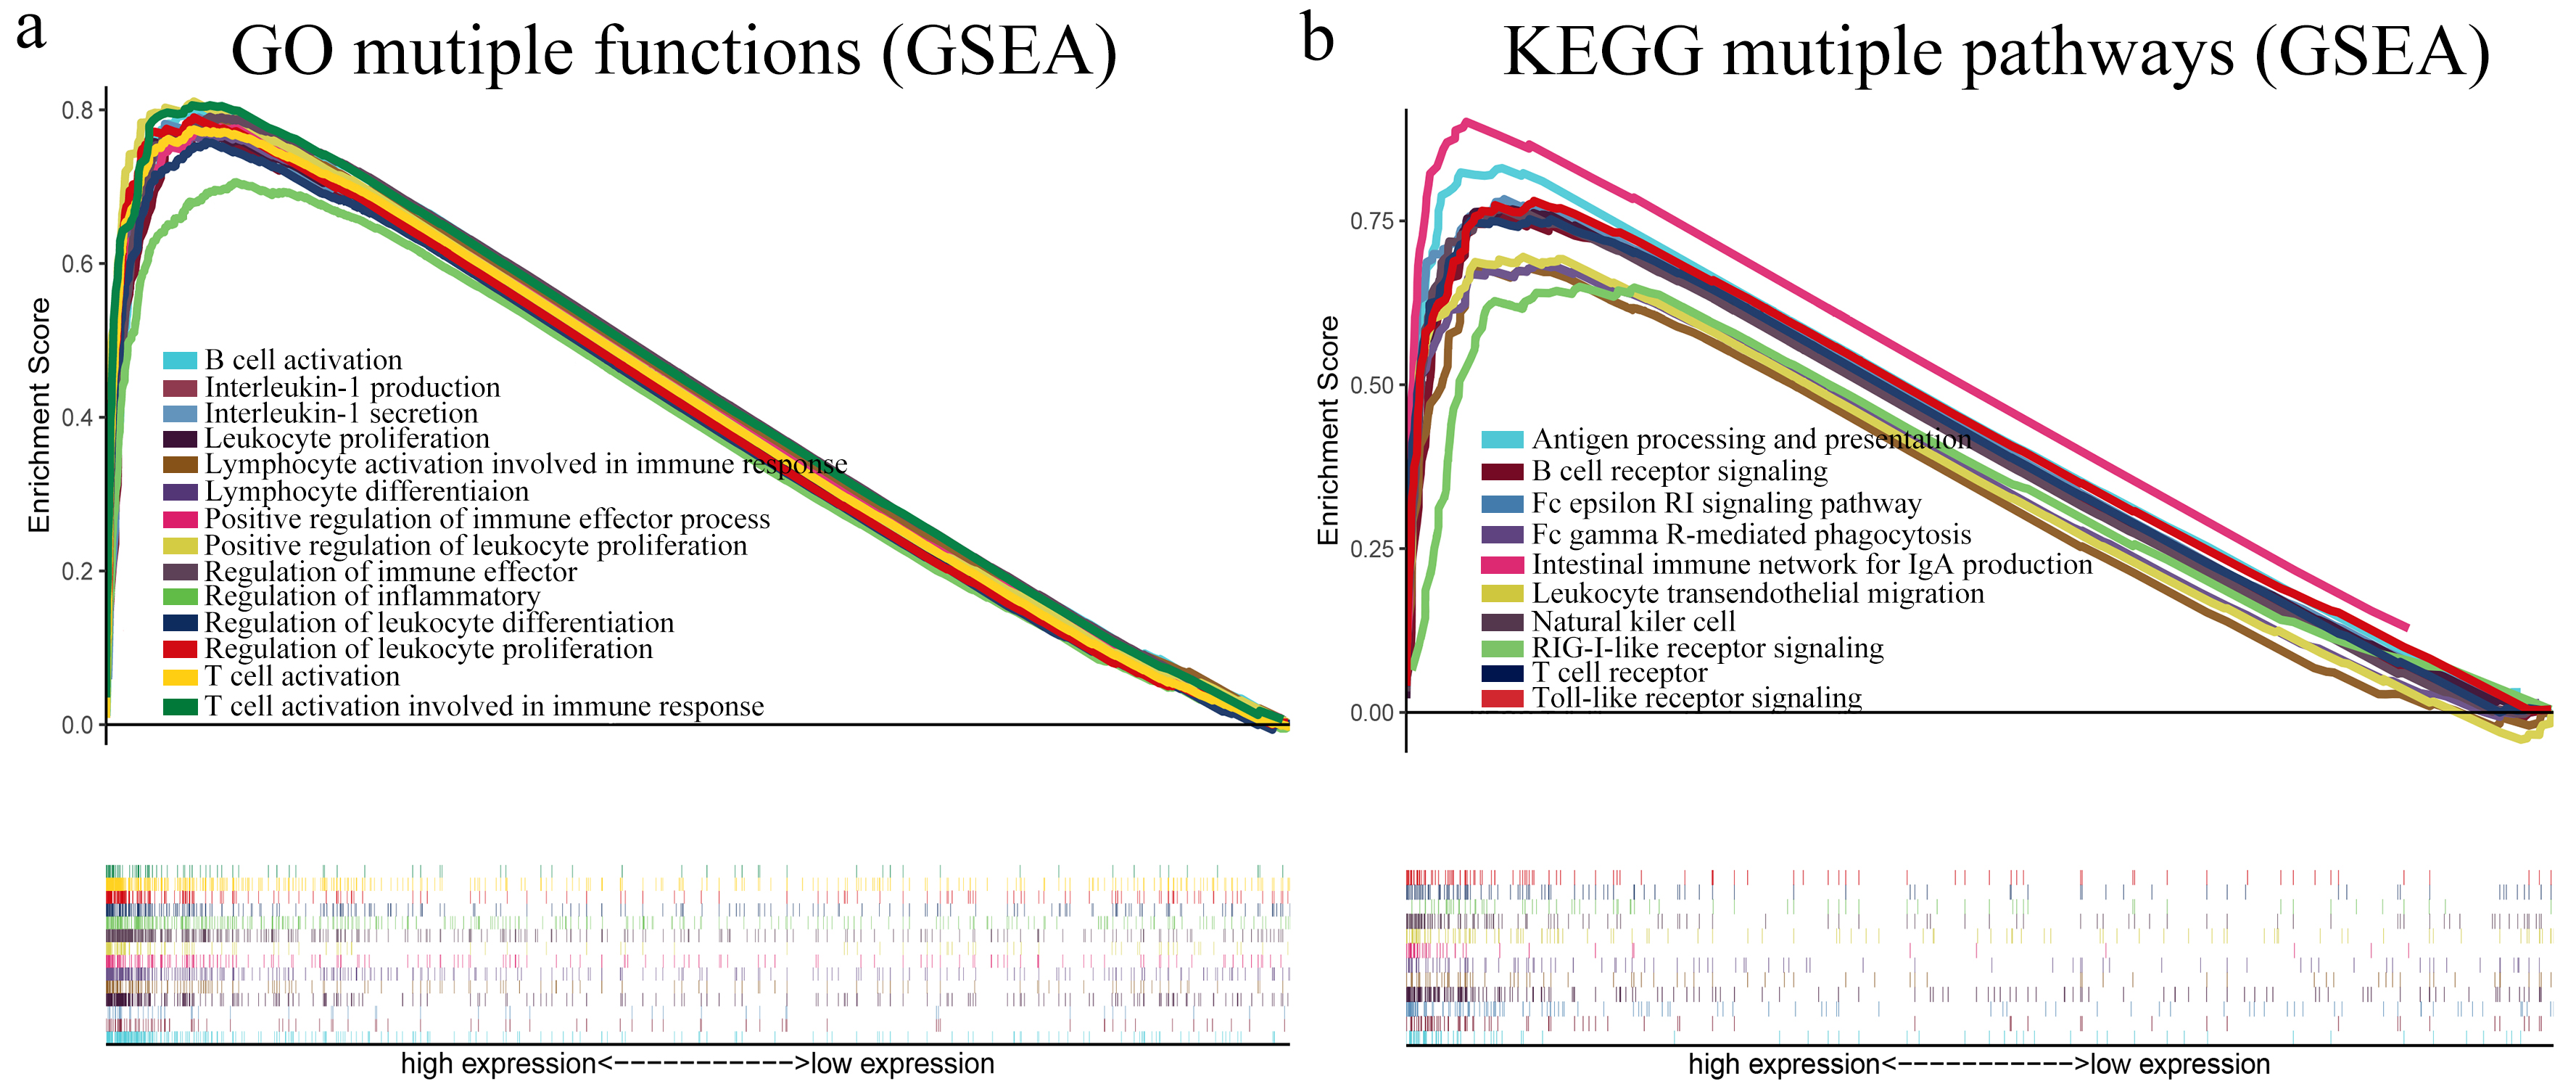
TILs imply that immune cells act as prognostic factors of sentinel lymph node status and survival in various cancers [30, 31]. To investigate whether LCP1 expression was an independent predictor of GC immune cell infiltration, we employed the TISIDB database to analyze the correlation between LCP1 expression and immune cell infiltrates in various types of cancer. Figure 5a shows that LCP1 expression had significant correlations with immune cell infiltrates in most types of cancer, including STAD; in contrast, no significant relationship was found in PRAD. We confirmed that LCP1 expression was strongly correlated with the amounts of infiltrating CD8
Then, to confirm the correlation between LCP1 expression and immune cell infiltration in STAD and PRAD, LCP1 expression was analyzed using the TIMER database. Figure 5c shows that LCP1 expression is significantly inversely correlated with tumor purity (cor.
Correlation between LCP1 expression and immune marker sets
To further investigate the correlation between LCP1 and diverse subsets of immune cell infiltrations in STAD, we employed the TIMER databases to analyze the relationships between LCP1 expression and immune cell markers including T cells, B cells, monocytes, M1 and M2 macrophages, neutrophils, NK cells, Tregs and dendritic cells, using PRAD as the control. Table 3 shows that LCP1 expression level is significantly correlated with most immune cell markers in STAD, whereas LCP1 expression significantly correlated with only 6 gene markers in PRAD.
Obviously, the LCP1 expression level was strongly correlated with the expression levels of most subsets of CD8
Correlation between LCP1 expression and function and pathway enrichment in GC
To analyze biological functions and pathways of genes coexpressed with LCP1 expression, we employed GSEA software 4.0.3 to investigate these datasets. After adjusting the thresholds to a nominal
Discussion
LCP1 has two EF-hand calcium-binding motifs at the N-terminus and two actin-binding domains (ABD1), each of which contains two calponin-homology regions (CH), at the C-terminus [32]. LCP1 was first isolated from neoplastic human fibroblasts and soon identified as significantly over-expressed in many cell lines and solid tumors [33, 34]. Researchers have found that LCP1 is a critical regulator of cell shape and behavior in both the adaptive and innate immune systems, including macrophages, B cells, T cells and NK cells [35, 36, 37, 38, 39]. In this study, we first investigate the expression level of LCP1 in GC, which was more highly expressed in GC than in normal gastric tissues. Overexpression of LCP1 showed negative correlation with GC patient survival. Furthermore, there were significant correlations between the immune cell infiltration levels/immune marker sets and LCP1 expression level. According to enriched biological function and pathway analysis, LCP1 was mainly involved in lymphocyte formation and immune reaction. Therefore, this study explored the role of LCP1 in GC and the underlying mechanism of LCP1 in TILs.
Many studies have reported that LCP1 is a regulator of tumor growth and metastasis, indicating its use as a biomarker indicating poor prognosis in different types of cancer [40, 41, 42]. These studies suggest that LCP1 participates in the progression, invasion and metastasis of tumor cells. Even though oral and colon cancers of the digestive system have been studied, the expression and role of LCP1 in GCs have not been reported [10, 11]. Here, we analyzed the expression levels of LCP1 in various types of cancer using the TIMER and GEPIA databases. According to the TIMER database analysis, we found that LCP1 was significantly overexpressed in breast, esophageal, head and neck, kidney, stomach and uterine cancers, but showed low expression in colon, liver, lung and rectal cancers. Additionally, the GEPIA database showed that LCP1 expression was higher in most cancers, such as BRCA, ESCA, KIRC, KIRP, and STAD; interestingly, only lower expression was in THYM compared to normal tissues. Collectively, the expression of LCP1 was higher in BRCA, ESCA, KIRP, KIRC and STAD compared to the normal tissues. Moreover, the expression of LCP1 was significantly correlated with cancer stage in GC, which was similar to the results in colorectal cancer [40]. We found that LCP1 expression was significantly higher in GC tissues than in gastric mucosal tissues using IHC. In addition, LCP1 expression was significantly correlated with GC tumor differentiation, tumor depth of invasion, lymphatic metastasis and stage TNM.
Higher expression of LCP1 also correlated with poorer prognosis in GC patients, as analyzed by the Kaplan-Meier plotter database. Furthermore, high expression of LCP1 was correlated with poor prognosis of GC patients in the following categories: stage 1–4, stage T2-4, stage M0-1, HER2 status, sex and Lauren classification, and lymph node involvement (stage N categories) had the highest HR. These results differ somewhat with the IHC data, perhaps due to sample size contributing to different conclusions. Mechanisms that may affect gene expression, such as gene mutation, deletion and epigenetic changes [43, 44], we investigated the LCP1 coding region and identified 8 mutations including missense and splice mutations. LCP1 alteration was significantly correlated with GC patient survival. This result suggests that the genetic variation of LCP1 might be beneficial for patients with gastric cancer, warranting further study into its mechanism. Therefore, LCP1 has the potential to be a novel and valuable biomarker for human GC.
LCP1 is highly expressed in normal leukocytes and plays an important role in the organization of the actin cytoskeleton by localizing to actin-rich membrane structures involved in immune defense, locomotion and adhesion [6, 40]. As TILs, NK cells, T cells and dendritic cells induce cell death as anti-tumor effecting cells [15]. Previous studies showed that LCP1 affected NKG2D-mediated regulation of NK cell chemotaxis by participating in NKG2D receptor clustering upon activation [39]. It is also well known that LCP1 is considered an important factor for chemokine-mediated T cell polarization and migration [17]. Considering that LCP1 is related to anti-tumor effector cells, we speculate that LCP1 will also affect GC tumor immune infiltration. First, our results show that immune cells had significant correlation of cell-cell interactions, and infiltration of some immune cells, such as activated memory CD4 T cells and M0 to M2 macrophages, was significantly higher compared to normal gastric tissue. High levels of activated memory CD4 T cells and M1 macrophages in the TME represented a favorable prognosis in colorectal cancer patients [45]. We can hypothesize that these immune cells could also be positive factors for GC patients. Second, this study indicates that LCP1 expression is significantly correlated with immune cell infiltration including CD8
As such, our study represents the first clinical evidence that LCP1 expression is negatively correlated with patient survival in GC. However, this result is not consistent with the notion that high level of TILs in the TME is a favorable prognosis. This study showed that LCP1 expression was significantly correlated with most immune markers in GC. Although there were positive correlations between LCP1 expression and miscellaneous effector cells stimulating markers of CD8
Additionally, to investigate the role of LCP1 in the functions of TILs in GC, we have presented the top 20 enriched biological functions and pathways of genes coexpressed with LCP1 expression, as calculated by GSEA software. Interestingly, the results mainly indicated involvement in cell proliferation, differentiation, activation and immune response. Previous studies showed that LCP1 served as a regulator of the actin cytoskeleton, with cellular functions such as leukocyte function, cell migration, DNA repair and endocytosis by stabilizing the clasped conformation of
In conclusion, this study has identified that overexpression of LCP1 is correlated with poor OS in GC patients and increased infiltrating levels of CD8
Footnotes
Conflict of interest
The authors declare that they have no competing interests.
Funding
This work was supported by the National Natural Science Foundation of China (No. 81860428, 81960503), the Science and Technology Plan of Health Commission of Jiangxi Province (No. 20191026), the spark promotion plan of grassroots health appropriate technology of Health Commission of Jiangxi Province (No. 20198012) and the Graduate Innovation Fund of Jiangxi Province (YC2019-S057).
Supplementary data
Tumor Abbreviations
Abbreviation
Type of cancer
ACC
Adrenocortical carcinoma
BLCA
Bladder Urothelial Carcinoma
BRCA
Breast invasive carcinoma
CESC
Cervical squamous cell carcinoma and endocervical adenocarcinoma
CHOL
Cholangio carcinoma
COAD
Colon adenocarcinoma
DLBC
Lymphoid Neoplasm Diffuse Large B-cell Lymphoma
ESCA
Esophageal carcinoma
GBM
Glioblastoma multiforme
HNSC
Head and Neck squamous cell carcinoma
KICH
Kidney Chromophobe
KIRC
Kidney renal clear cell carcinoma
KIRP
Kidney renal papillary cell carcinoma
LAML
Acute Myeloid Leukemia
LGG
Brain Lower Grade Glioma
LIHC
Liver hepatocellular carcinoma
LUAD
Lung adenocarcinoma
LUSC
Lung squamous cell carcinoma
MESO
Mesothelioma
OV
Ovarian serous cystadenocarcinoma
PAAD
Pancreatic adenocarcinoma
PCPG
Pheochromocytoma and Paraganglioma
PRAD
Prostate adenocarcinoma
READ
Rectum adenocarcinoma
SARC
Sarcoma
SKCM
Skin Cutaneous Melanoma
STAD
Stomach adenocarcinoma
TGCT
Testicular Germ Cell Tumors
THCA
Thyroid carcinoma
THYM
Thymoma
UCEC
Uterine Corpus Endometrial Carcinoma
UCS
Uterine Carcinosarcoma
UVM
Uveal Melanoma
Top 20 enriched biological functions in analysis of genes co-expressed with LCP1 expression in GC via GSEA SIZE, number of genes in the gene set; ES, enrichment score; NES, norminal enrichment score; NOM p-val, nominal
Name
Exact source
Size
ES
NES
NOM p-val
FDR q-val
FWER p-val
RANK AT MAX
Leading edge
GO Lymphocyte activation involved in immune response
0002285
175
0.78709440
2.8459980
0
0
0
4942
tags
50%, list
9%, signal
55%
GO Leukocyte proliferation
0070661
290
0.77899830
2.8044589
0
0
0
4097
tags
48%, list
7%, signal
51%
GO Cytokine secretion
0050663
217
0.76810414
2.7786455
0
0
0
4097
tags
44%, list
7%, signal
48%
GO T cell activation
0042110
457
0.77435970
2.7599480
0
0
0
4097
tags
47%, list
7%, signal
50%
GO T cell activation involved in immune response
0002286
99
0.80587260
2.7523665
0
0
0
4846
tags
55%, list
9%, signal
60%
GO External side of plasma membrane
0009897
372
0.81166350
2.7361288
0
0
0
4057
tags
55%, list
7%, signal
59%
GO Positive regulation of cytokine secretion
0050715
130
0.77925920
2.7356020
0
0
0
4311
tags
45%, list
8%, signal
49%
GO Regulation of inflammatory response
0050727
342
0.70572730
2.7258835
0
0
0
6074
tags
43%, list
11%, signal
48%
GO Positive regulation of immune effector process
0002699
214
0.77734023
2.7128057
0
0
0
5196
tags
51%, list
9%, signal
56%
GO Regulation of immune effector process
0002697
453
0.79083484
2.7102656
0
0
0
4846
tags
54%, list
9%, signal
58%
GO Positive regulation of leukocyte proliferation
0070665
137
0.81084520
2.7081175
0
0
0
4097
tags
53%, list
7%, signal
57%
GO Regulation of leukocyte proliferation
0070663
219
0.79012245
2.7050890
0
0
0
4097
tags
51%, list
7%, signal
55%
GO Positive regulation of response to external stimulus
0032103
305
0.73972710
2.7049177
0
0
0
6114
tags
51%, list
11%, signal
57%
GO Positive regulation of cell activation
0050867
378
0.81305593
2.7021196
0
0
0
4097
tags
56%, list
7%, signal
60%
GO Lymphocyte differentiation
0030098
345
0.76775960
2.7004917
0
0
0
5503
tags
50%, list
10%, signal
55%
GO Positive regulation of cytokine production
0001819
444
0.73692500
2.6926480
0
0
0
5345
tags
46%, list
10%, signal
50%
GO Interleukin-1 production
0032612
94
0.77275900
2.6899457
0
0
0
4311
tags
48%, list
8%, signal
52%
GO Interleukin-1 secretion
0050701
57
0.78996390
2.6871681
0
0
0
4311
tags
49%, list
8%, signal
53%
GO Regulation of leukocyte differentiation
1902105
268
0.75817823
2.6850412
0
0
0
4650
tags
47%, list
8%, signal
51%
GO B cell activation
0042113
296
0.79974720
2.6849854
0
0
0
4942
tags
57%, list
9%, signal
62%
Top 20 enriched biological pathways in analysis of genes co-expressed with LCP1 expression in GC via GSEA SIZE, number of genes in the gene set; ES, enrichment score; NES, norminal enrichment score; NOM p-val, nominal
Name
Exact source
Size
ES
NES
NOM p-val
FDR q-val
FWER p-val
RANK AT MAX
Leading edge
KEGG Cytokine receptor interaction
hsa04060
264
0.77655363
2.8461928
0
0
0
4704
tags
49%, list
9%, signal
54%
KEGG Chemokine signaling pathway
hsa04062
188
0.76826980
2.6687932
0
0
0
4739
tags
49%, list
9%, signal
55%
KEGG JAK-STAT signaling pathway
hsa04630
155
0.71712550
2.6559598
0
0
0
5196
tags
49%, list
9%, signal
56%
KEGG Hematopoietic cell lineage
hsa04640
85
0.85720444
2.6554537
0
0
0
4097
tags
49%, list
9%, signal
57%
KEGG Toll-like receptor signaling pathway
hsa04620
102
0.78043395
2.5938632
0
0
0
6137
tags
49%, list
9%, signal
58%
KEGG Natural killer cell mediated cytotoxicity
hsa04650
132
0.76855070
2.5919600
0
0
0
4605
tags
49%, list
9%, signal
59%
KEGG Cell adhesion molecules (CAMs)
hsa04514
131
0.78309447
2.5152433
0
0
0
4708
tags
49%, list
9%, signal
60%
KEGG Autoimmune thyroid disease
hsa05320
50
0.87039804
2.4829192
0
0
0
4209
tags
49%, list
9%, signal
61%
KEGG Antigen processing and presentation
hsa04612
81
0.83043873
2.4644510
0
0
0
4605
tags
49%, list
9%, signal
62%
KEGG Leukocyte transendothelial migration
hsa04670
116
0.69506377
2.4365847
0
0
0
5620
tags
49%, list
9%, signal
63%
KEGG T cell receptor signaling pathway
hsa04660
108
0.75259000
2.4267507
0
0
0
5929
tags
49%, list
9%, signal
64%
KEGG Viral myocarditis
hsa05416
68
0.77337164
2.4135090
0
0
0
4209
tags
49%, list
9%, signal
65%
KEGG Leishmania infection
hsa05140
70
0.85721195
2.4046340
0
0
0
2302
tags
49%, list
9%, signal
66%
KEGG Intestinal immune network for IgA production
hsa04672
46
0.90114164
2.3957763
0
0
0
2884
tags
49%, list
9%, signal
67%
KEGG Fc epsilon RI signaling pathway
hsa04664
79
0.67757046
2.3811480
0
0
0
5945
tags
49%, list
9%, signal
68%
KEGG B cell receptor signaling pathway
hsa04662
75
0.76037544
2.3644030
0
0
0
4401
tags
49%, list
9%, signal
69%
KEGG Asthma
hsa05310
28
0.90408826
2.3285637
0
0
0
2003
tags
49%, list
9%, signal
70%
KEGG Fc gamma R-mediated phagocytosis
hsa04666
96
0.68339510
2.2934237
0
6.25E-05
0.001
6152
tags
49%, list
9%, signal
71%
KEGG Type I diabetes mellitus
hsa04940
41
0.86884370
2.2838593
0
0.000118
0.002
4209
tags
49%, list
9%, signal
72%
KEGG RIG-I-like receptor signaling pathway
hsa04622
71
0.64933800
2.2598982
0
0.000113
0.002
8335
tags
49%, list
9%, signal
73%