
Abstract
Background
It is unclear whether the long non-coding RNA (lncRNA) OTX2 antisense RNA 1 (OTX2-AS1) plays a pivotal role in gastric cancer (GC). An analysis of The Cancer Genome Atlas (TCGA) database data and bioinformatics was used to explore the relationship between OTX2-AS1 and GC in the current study.
Methods
We evaluated the relationship between clinical features and OTX2-AS1 expression, prognostic factors, and the significant involvement of OTX2-AS1 in function using various statistical methods, such as Kaplan–Meier method, Cox regression analysis, Gene Set Enrichment Analysis (GSEA), and immune infiltration analysis. GC cell lines were tested for OTX2-AS1 expression using qRT-PCR.
Results
A high level of OTX2-AS1 expression was significantly and negatively associated with Helicobacter pylori (H pylori) infection in GC patients (P = .006) and predicted a poorer overall survival (OS) (HR: 1.54; 95% CI: 1.10-2.14; P = .011), progression-free interval (PFI) (HR: 1.75; 95% CI: 1.22-2.51; P = .002) and disease-specific survival (DSS) (HR: 1.85; 95% CI: 1.21-2.85; P = .005) in GC patients. There was an independent correlation between OTX2-AS1 expression (HR: 1.771; 95% CI: 1.164-2.696; P = .008) and OS in patients with GC. There were differential enrichments for the OTX2-AS1 high expression phenotype in the olfactory transduction, G alpha (s) signaling events, keratinization, olfactory signaling pathway, and preimplantation embryo. OTX2-AS1 expression may be related to certain immune-infiltrating cells. Compared to gastric epithelial cells (GES-1), GC cell lines showed a significant increase in OTX2-AS1 expression.
Conclusion
There was a significant association between OTX2-AS1 expression in GC patients and poor survival, suggesting that it may be a useful biomarker for prognosis and immunotherapy outcome of stomach adenocarcinoma (STAD) in GC.
Introduction
Gastric cancer (GC) is a life-threatening cancer with a high incidence in East Asia. 1 GC has a high mortality rate and poor prognosis. 2 GC is insidious and has no special symptoms so it is difficult to be recognized in the early stage. 3 Due to the dietary characteristics and insufficient awareness of screening in China, the disease may have developed to an advanced stage when detected. 4 Previous chemotherapy-based treatment only prolonged the median overall survival of patients with advanced GC by 7 to 11 months. 4 Therefore, the field needs new biomarkers as prognostic indicators to effectively improve prognosis and individualize treatment.
Long non-coding RNAs (lncRNAs) are 200 nucleotides in length and are a series of single-stranded RNA molecules with no protein coding function.5,6 Cancer is primarily caused by lncRNAs.7–10 Therefore, GC should be diagnosed and treated by screening for lncRNAs clinically relevant to GC. OTX2 antisense RNA 1 (OTX2-AS1) is significantly overexpressed in breast cancer. 11 OTX2-AS1 can be used to predict the prognosis of lung squamous cell carcinoma (LSCC) patients. 12 However, it has not been studied if OTX2-AS1 correlates with the clinical characteristics of GC patients and immune infiltration.
On the basis of The Cancer Genome Atlas (TCGA) database and GC RNA-seq data in GTEx, we examined the correlation between OTX2-AS1 expression levels and clinical features of GC and compared the difference in OTX2-AS1 expression between tumor and normal tissues. We evaluated its prognostic value in GC. An analysis of genomic enrichment (Gene Set Enrichment Analysis [GSEA]) revealed OTX2-AS1's function in this study. In this study, we investigated the possible mechanisms by which OTX2-AS1 might regulate the occurrence and development of GC by examining the relationship between its expression and immune infiltration. The findings of this study may lead to new approaches to the development of diagnostic and therapeutic strategies for the treatment of GC.
Materials and Methods
Data for this study was obtained from TCGA database. As data can be downloaded free of charge from TCGA for research and publication, ethical approval and patient consent were not required for our study. The study was validated in cell lines only and did not use human or animal tissues.
Differential Expression of OTX2-AS1
For analytical methods, please refer to the published literature.13–16
Baseline information: The software used was R (version 3.6.3) (statistical analysis and visualization). The R package used was basic R. Molecule was OTX2-AS1 [ENSG00000248550]. Subgroups were median. Data were RNAseq data in level 3 HTSeq-FPKM format from TCGA (https://portal.gdc.cancer.gov/) GC project. RNAseq data in fragments per kilobase of exon per million mapped fragments (FPKM) format were converted to transcripts per million reads (TPM) format and log2 transformed.
Unpaired samples: The software used was R (version 3.6.3). The main R package for visualization was ggplot2 [version 3.3.3]. TCGA GC project provided RNAseq data in level 3 HTSeq-FPKM format. We converted FPKM data to TPM format and log2 transformed it. The data were not filtered.
ROC analysis: The software used was R (version 3.6.3). A pROC package [version 1.17.0.1] was used for the analysis and ggplot2 [version 3.3.3] was used to visualize the results. Clinical variables were normal and tumor. The disease diagnosed was GC. TCGA GC project provided RNAseq data in level 3 HTSeq-FPKM format. We converted FPKM data to TPM format and log2 transformed it. The data were not filtered. The horizontal coordinate was the false positive rate (FPR) and the vertical coordinate was the true positive rate (TPR).
The Relationship Between OTX2-AS1 and Clinical Characteristics
For analytical methods, please refer to the published literature.13,14
Clinical relevance: The software used was R (version 3.6.3). There was mainly ggplot2 [version 3.3.3] in the R package. Clinical variable was Helicobacter pylori (H pylori) infection. TCGA GC project provided RNAseq data and clinical data in level 3 HTSeq-FPKM format. We converted FPKM data to TPM format and log2 transformed it. In order to filter the data, control/normal was removed from all items (control/normal does not appear in all items) and clinical information was retained.
Logistics analysis: The software used was R (version 3.6.3). The R package used was basic R. There was a dichotomous logistic model applied to the data with OTX2-AS1 as the dependent variable. Dependent variable type was low-high dichotomous. The disease diagnosed was GC. TCGA GC project provided RNAseq data and clinical data in level 3 HTSeq-FPKM format. We converted FPKM data to TPM format and log2 transformed it. In order to filter the data, control/normal was removed from all items (control/normal does not appear in all items) and clinical information was retained.
The Relationship Between OTX2-AS1 and Prognosis
For analytical methods, please refer to the published literature.13,14,17,18
The survminer package (version 0.4.9) was used for visualizing survival data, and the survival package (version 3.2-10) allowed statistical analysis of survival data. Molecule was OTX2-AS1. Subgroups included 0 to 50 and 50 to 100. Prognosis type included overall survival (OS), progression-free interval (PFI), and disease-specific survival (DSS). TCGA GC project provided RNAseq data in level 3 HTSeq-FPKM format. We converted FPKM data to TPM format and log2 transformed it. The supplementary data consisted of prognostic data obtained from the literature. 19 In order to filter the data, control/normal was removed from all items (control/normal does not appear in all items) and clinical information was retained.
COX regression: The software used was R (version 3.6.3). The R package used was survivor [version 3.2-10]. The statistical method used was Cox regression. Prognosis type included OS. Included variables were T stage, N stage, M stage, pathologic stage, primary therapy outcome, gender, race, age, histological type, residual tumor, histologic grade, anatomic neoplasm subdivision, reflux history, antireflux treatment, H pylori infection, Barrett’s esophagus, and OTX2-AS1. TCGA GC project provided RNAseq data in level 3 HTSeq-FPKM format. We converted FPKM data to TPM format and log2 transformed it. The supplementary data consisted of prognostic data obtained from the literature. 19 In order to filter the data, control/normal was removed from all items (control/normal does not appear in all items) and clinical information was retained.
Forest plot: The software used was R (version 3.6.3). The ggplot2 package in R (for visualization) was version 3.3.3.
Nomogram plot: The software used was R (version 3.6.3). R packages were rms package [version 6.2-0] and survival package [version 3.2-10]. Prognosis type was overall survival. Included variables were T stage, N stage, M stage, pathologic stage, primary therapy outcome, age, and OTX2-AS1. TCGA GC project provided RNAseq data in level 3 HTSeq-FPKM format. We converted FPKM data to TPM format and log2 transformed it. The supplementary data consisted of prognostic data obtained from the literature. 19 Data were filtered by removing control/normal (not all items have control/normal) and retaining clinical information.
Enrichment of OTX2-AS1 Related Pathways
For analytical methods, please refer to the published literature.13–16
An analysis of single gene differential expression was performed using the R (version 3.6.3) package DESeq2 [version 1.26.0]. 20 We studied OTX2-AS1. A low expression group had 0% to 50% expression, while a high expression group had 50% to 100% expression. TCGA GC project provided RNAseq data in level 3 HTSeq-FPKM format. In order to filter the data, control/normal was removed from all items (control/normal does not appear in all items)
GSEA analysis: The software used was R (version 3.6.3). R package was mainly the clusterProfiler package [version 3.14.3] (for GSEA analysis). The method used was GSEA analysis. The species was Homo sapiens. Reference gene set was c2.cp.v7.2.symbols.gmt [Curated]. Gene set database was MSigDB Collections (database hyperlink) (with a detailed description of each gene set). Generally, a significant enrichment was considered when the false discovery rate (FDR) < 0.25 and P adjust < .05.
Relationship Between Immune-Infiltrating Cells and the Expression of OTX2-AS1
For analytical methods, please refer to the published literature.13,14
The software used was R (version 3.6.3). GSVA package [version 1.34.0] was used. 21 For immuno-infiltration, ssGSEA was used (an algorithm built into GSVA). The molecule used was OTX2-AS1. There were 24 immune cells. TCGA GC project provided RNAseq data in level 3 HTSeq-FPKM format. We converted FPKM data to TPM format and log2 transformed it. Data were filtered by removing control/normal (not all items have control/normal). Markers for 24 immune cells were obtained from the reference. 22
QRT-PCR
AGS and SGC7901 GC cells and human normal gastric epithelial cells (GES-1) were obtained from the laboratory. RPMI 1640 medium supplemented with 100 mg/mL streptomycin, 10% fetal bovine serum, and 100 U/mL penicillin was used to culture the cells. A humidified incubator containing 5% CO2 was used to maintain the cells. The levels of OTX2-AS1 in GES-1, AGS, and SGC7901 cell lines were assessed using qRT-PCR. 23 Primers 24 used in this study were as follows: GAPDH forward: 5’-CTCCTCCACCTTGTAGCGTG-3’, GAPDH reverse: 5’-CATACCAGGAAATGAGCTTGACAA-3’; OTX2-AS1 forward: 5’-GCAGCTTGTTTTCTGGGTGG-3’, OTX2-AS1 reverse: 5’-GCAACAAGAGCCAGGTAAGG-3’.
Statistical Analysis
R (version 3.6.3) was used for all statistical analyses. The relationship between clinical features and OTX2-AS1 was examined using the Wilcoxon rank-sum test, chi-square test, and Fisher’s exact test. We considered statistically significant values below .05.
Results
Clinical Characteristics
The clinical information of 375 GC patients was collected. A median age of 67 years was found for all patients, with a range from 58 to 73 years. The T stage included 19 patients (5.2%) in T1 stage, 80 patients (21.8%) in T2 stage, 168 patients (45.8%) in T3 stage, and 100 patients (27.2%) in T4 stage. The N stage included 111 patients (31.1%) in N0 stage, 97 patients (27.2%) in N1 stage, 75 patients (21%) in N2 stage, and 74 patients (20.7%) in N3 stage. The M stage included 330 patients (93%) in M0 stage and 25 patients (7%) in the M1 stage. The pathologic stage included 53 patients (15.1%) in Stage I, 111 patients (31.5%) in Stage II, 150 patients (42.6%) in Stage III, and 38 patients (10.8%) in Stage IV. The Race included 74 Asian patients (22.9%), 11 Black or African-American patients (3.4%), and 238 White patients (73.7%). The age included 164 patients (< = 65, 44.2%) and 207 patients (>65, 55.8%). The histological types included 63 diffuse type (16.8%), 19 mucinous type (5.1%), 207 not otherwise specified (55.3%), 5 papillary type (1.3%), 11 signet ring type (2.9%), and 69 tubular type (18.4%). The residual tumor included 298 R0 (90.6%), 15 R1 (4.6%), and 16 R2 (4.9%). The histologic grade included 10 G1 (2.7%), 137 G2 (37.4%), and 219 G3 (59.8%). The anatomic neoplasm subdivision included 138 antrum/distal (38.2%), 48 cardia/proximal (13.3%), 130 fundus/body (36%), 41 gastroesophageal junction (11.4%), and 4 other (1.1%). The reflux history included 175 no (81.8%) and 39 yes (18.2%). The antireflux treatment included 142 no (79.3%) and 37 yes (20.7%). The H pylori infection included 145 no (89%) and 18 yes (11%). The Barrett’s esophagus included 193 no (92.8%) and 15 yes (7.2%) (Table 1).
GC Clinical Characteristics and OTX2-AS1 Expression.

Abbreviations: GC: gastric cancer; OTTX2-AS1, OTX2 antisense RNA 1.
OTX2-AS1 Expression is Correlated With the Clinical Characteristics of GC
OTX2-AS1 was expressed higher in GC tissues than in normal gastric tissues (0.108 ± 0.011 vs 0.024 ± 0.013, P < .001) (Figure 1A). The area under the curve (AUC) of OTX2-AS1 was 0.705, suggesting that OTX2-AS1 could be served as an ideal biomarker to distinguish GC from nontumor gastric tissue (Figure 1B). As shown in Figure 2 and Table 2, OTX2-AS1 expression in GC patients showed a significant negative correlation with H pylori infection (P = .006) (Table 3).

A significant difference exists between GC and adjacent normal gastric tissues in terms of OTX2-AS1 expression. (A) There is a difference in the expression of OTX2-AS1 between GC tissues and nearby normal gastric tissues. (B) ROC curves indicating how effectively OTX2-AS1 distinguishes GC tissues from nontumor tissues.

Relationship between OTX2-AS1 expression and clinical features of GC. Relationship between OTX2-AS1 expression and Helicobacter pylori (H pylori) infection.
Logistic Regression Analysis of OTX2-AS1 Expression and Clinical Features of GC.

Abbreviations: GC: gastric cancer; OTTX2-AS1, OTX2 antisense RNA 1.
Clinical Characteristics of GC Patients and their OS (Cox regression analysis).
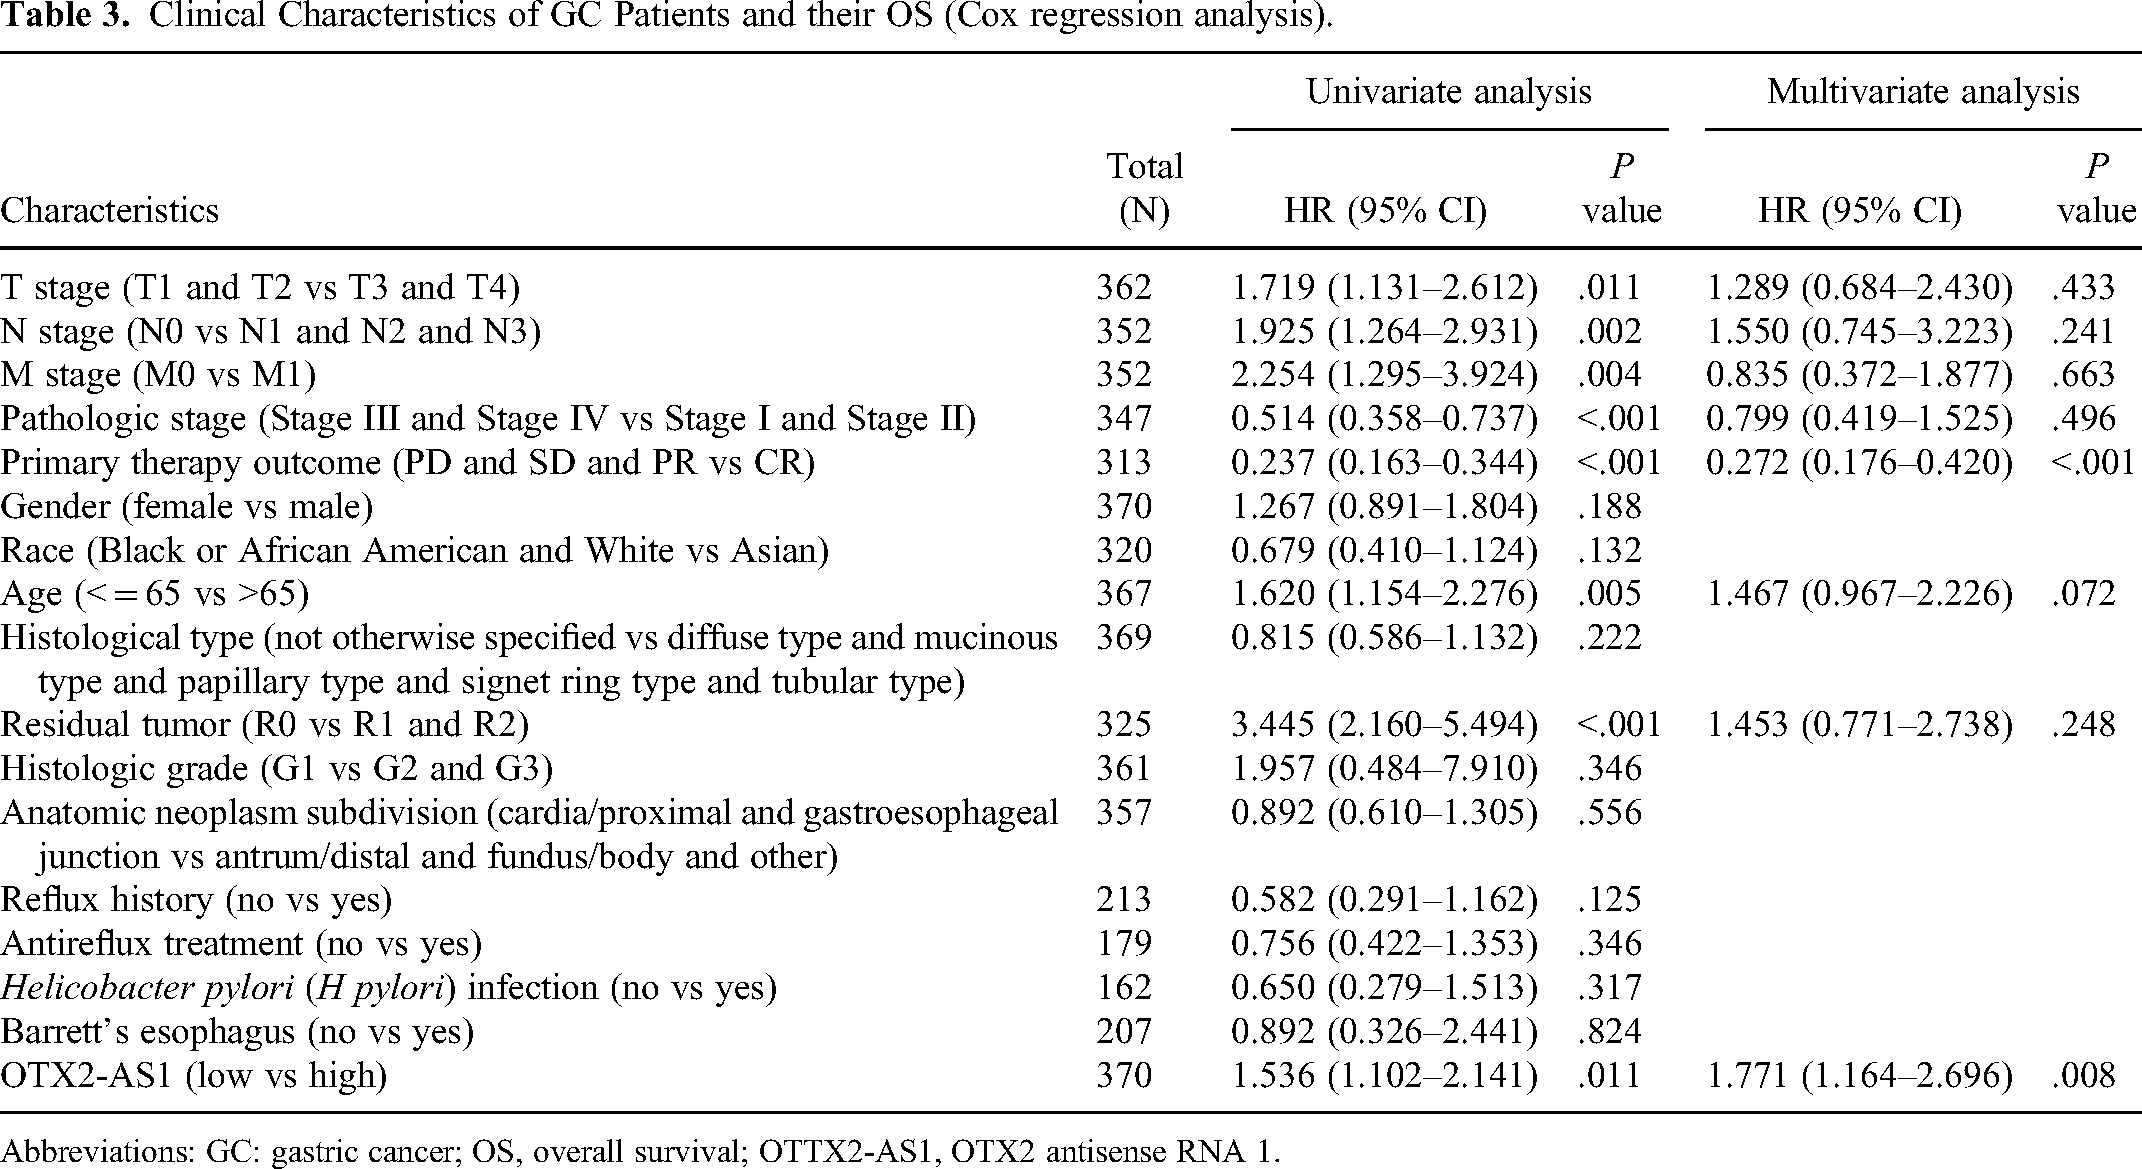
Abbreviations: GC: gastric cancer; OS, overall survival; OTTX2-AS1, OTX2 antisense RNA 1.
Role of OTX2-AS1 in GC Patient Survival
There was a significant association between poor OS (HR: 1.54; 95% CI: 1.10-2.14; P = .011), PFI (HR: 1.75; 95% CI: 1.22-2.51; P = .002), and DSS (HR: 1.85; 95% CI: 1.21-2.85; P = .005), and DSS and OTX2-AS1 expression in Figure 3. A univariate Cox regression analysis of prognostic factors for OS as shown in Table 4 revealed that high OTX2-AS1 expression levels (HR: 1.536; 95% CI: 1.102-2.141; P = .011) were associated with T stage (HR: 1.719; 95% CI: 1.131-2.612; P = .011), N stage (HR: 1.925; 95% CI: 1.264-2.931; P = .002), M stage (HR: 2.254; 95% CI: 1.295-3.924; P = .004), pathologic stage (HR: 0.514; 95% CI: 0.358-0.737; P < .001), primary therapy outcome (HR: 0.237; 95% CI: 0.163-0.344; P < .001), age (HR: 3.445; 95% CI: 2.160-5.494; P < .001), and residual tumor (HR: 3.445; 95% CI: 2.160-5.494; P < .001). A multivariate analysis showed OTX2-AS1 expression (HR: 1.771; 95% CI: 1.164-2.696; P = .008) and primary therapy outcome (HR: 0.272; 95% CI: 0.176-0.420; P < .001) were independently correlated with OS in Table 4 and Figure 4. According to the above data, OTX2-AS1 is a prognostic factor and higher levels are associated with poor overall survival. By combining OTX2-AS1 expression levels with clinical variables, a nomogram was constructed to predict the 1-, 3-, and 5-year survival probability of GC patients (Figure 5).

Patients with GC who express high levels of OTX2-AS1 have lower OS, PFI, and DSS. (A) OS, (B) PFI, and (C) DSS.

Gastric cancer (GC) multivariate Cox regression forest plot.

Nomogram that predicts the probability of patients surviving 1, 3, and 5 years.
The Gene Enrichment Analysis (GSEA) of the High and low Expression Groups of OTX2 antisense RNA 1 (OTX2-AS1).

OTX2-AS1-Related Pathways Based on GSEA
Based on GSEA analysis, 5 datasets had significant differential enrichment for the expression phenotype OTX2-AS1, as shown in Table 4 and Figure 6, including olfactory transduction, G alpha (s) signaling events, keratinization, olfactory signaling pathway, and preimplantation embryo.

An enrichment plot based on GSEA data. (A) Olfactory transduction, (C) G alpha (s) signaling events, (B) keratinization, (D) preimplantation embryo, and (E) olfactory signaling pathway.
The Correlation Between OTX2-AS1 Expression and Immune Infiltration
As shown in Figure 7, Figure 8, and Table 5, the expression of OTX2-AS1 was negatively correlated with infiltration levels of aDC (P = .033), B cells (P = .002), CD8 T cells (P < .001), cytotoxic cells (P < .001), DC (P < .001), eosinophils (P < .001), iDC (P < .001), macrophages (P < .001), mast cells (P < .001), neutrophils (P < .001), NK CD56dim cells (P < .001), NK cells (P = .027), pDC (P = .021), T cells (P = .002), Tem (P < .001), TFH (P < .001), Th1 cells (P < .001), Th17 cells (P < .001), Th2 cells (P = .007), and TReg (P = .028).
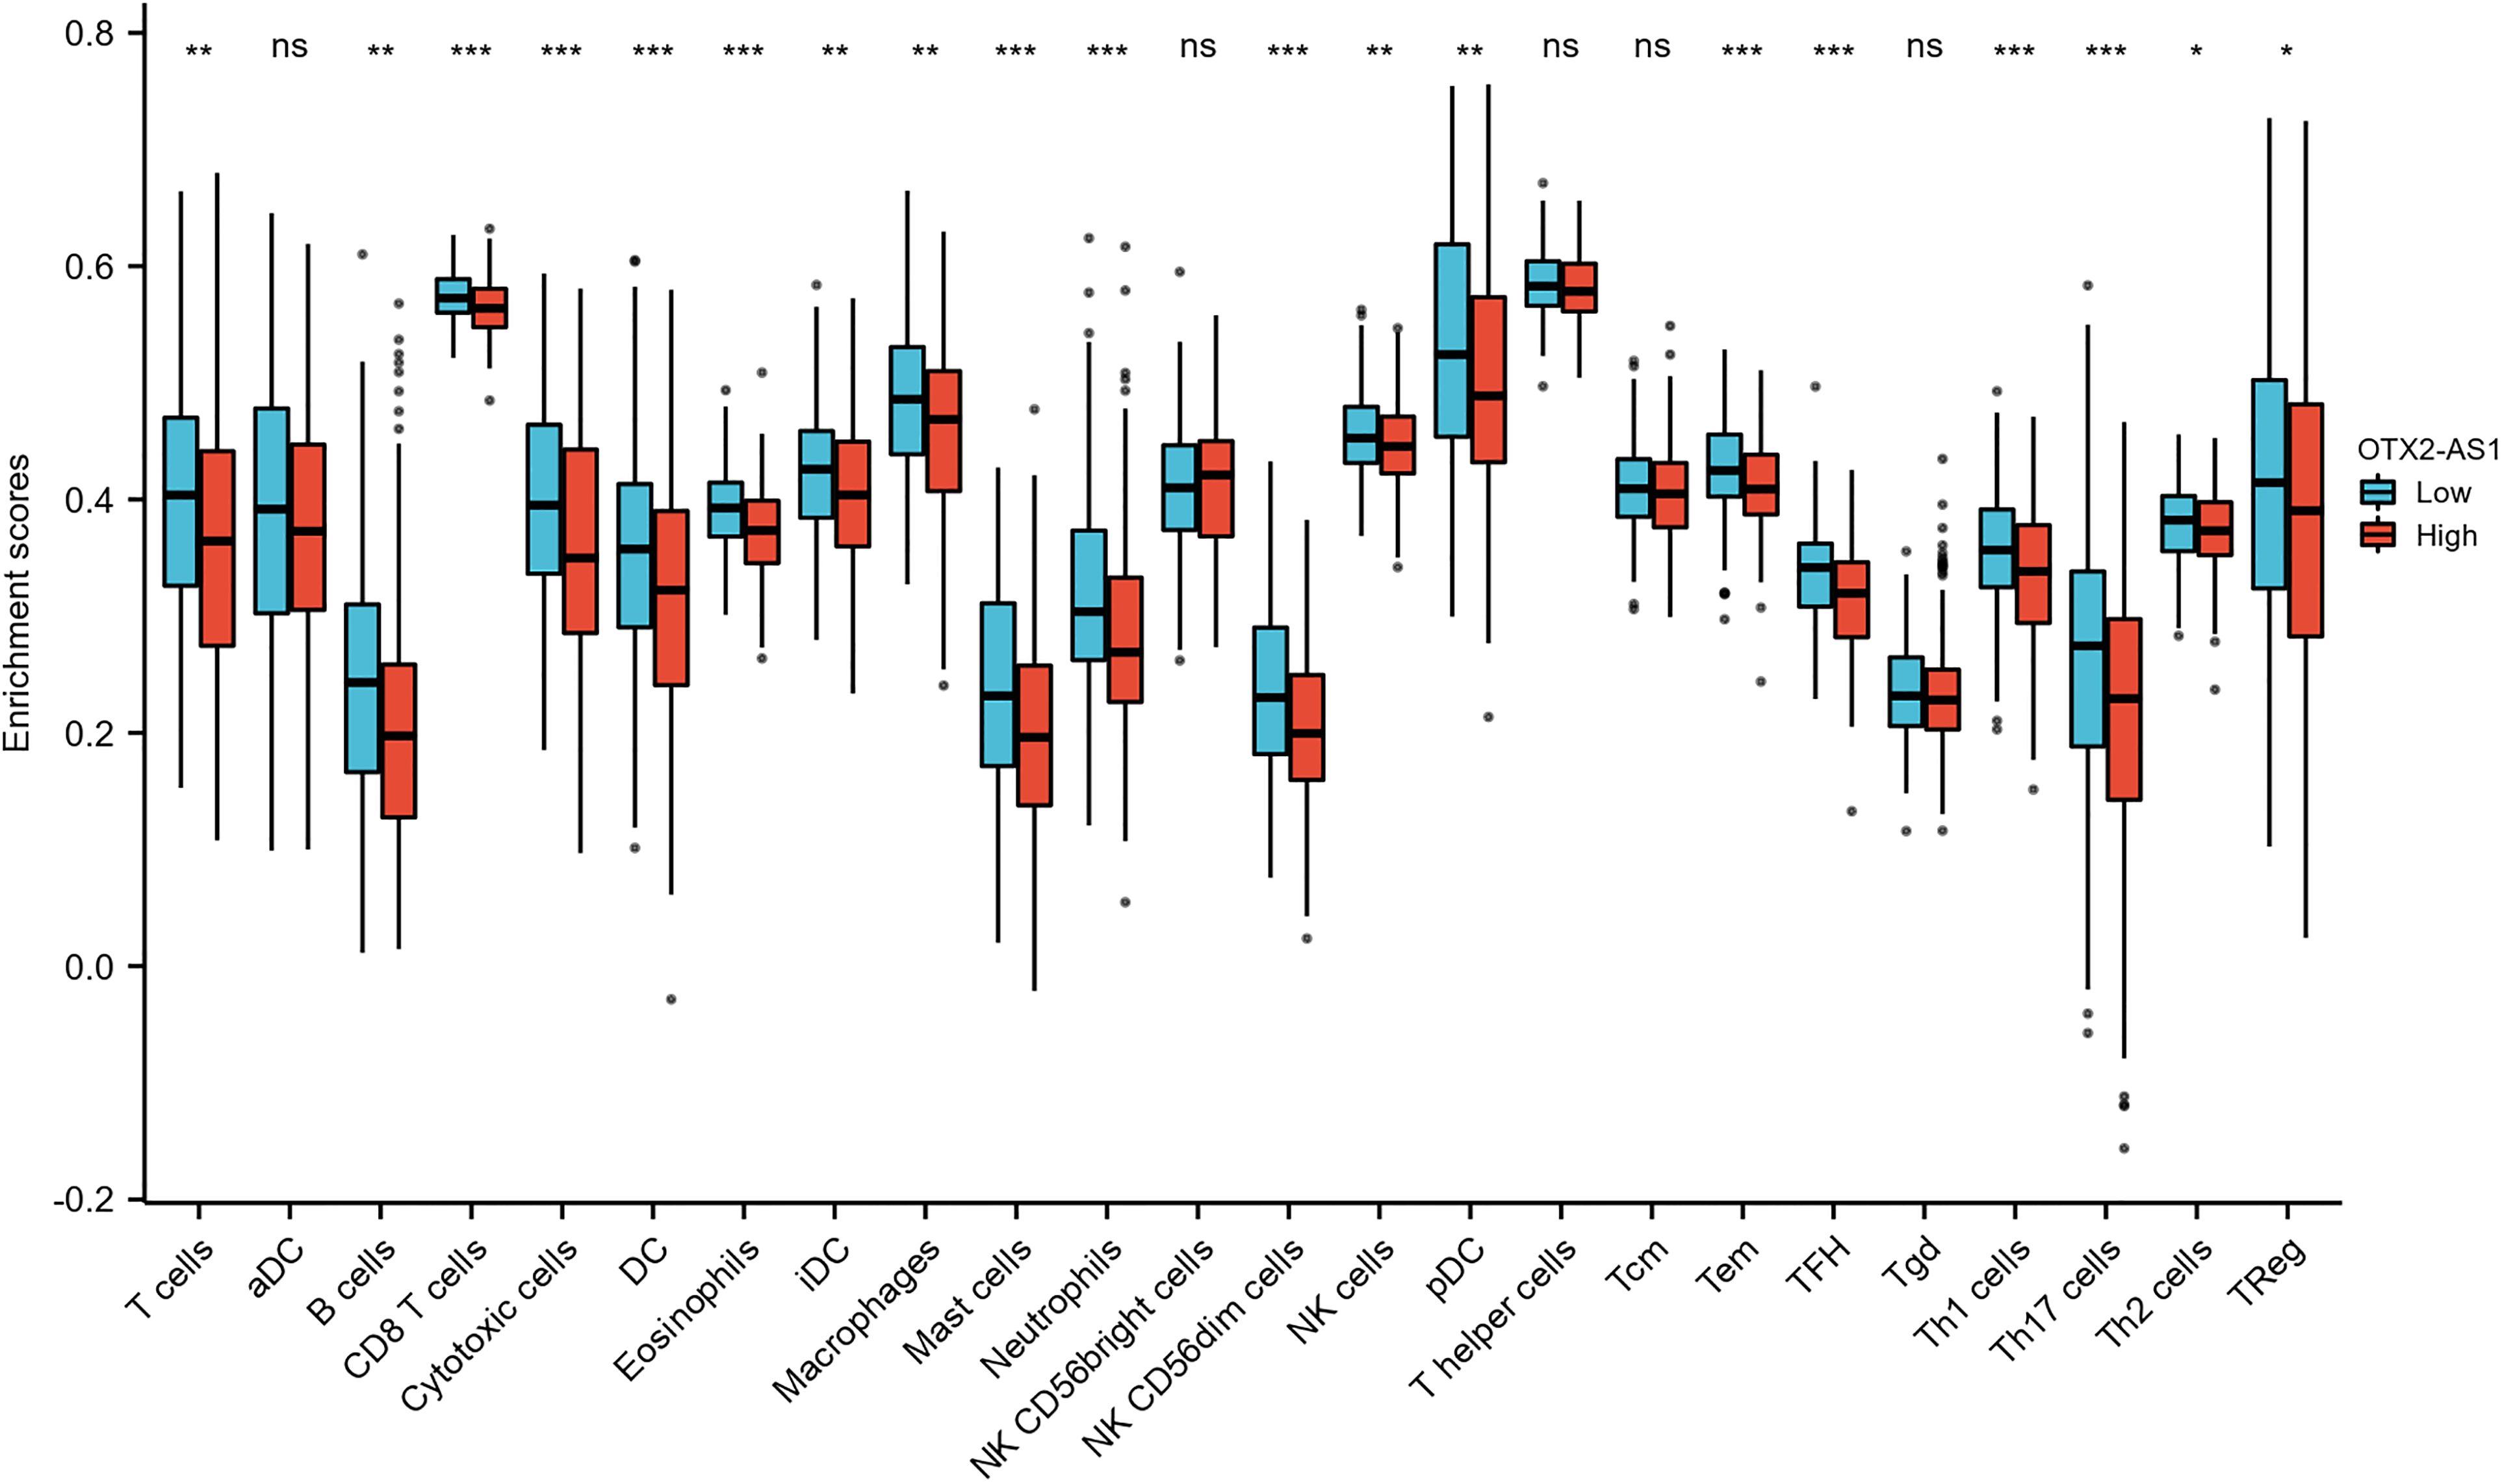
Expression of OTX2-AS1 correlated with immune cells in GC patients (grouped comparison chart).
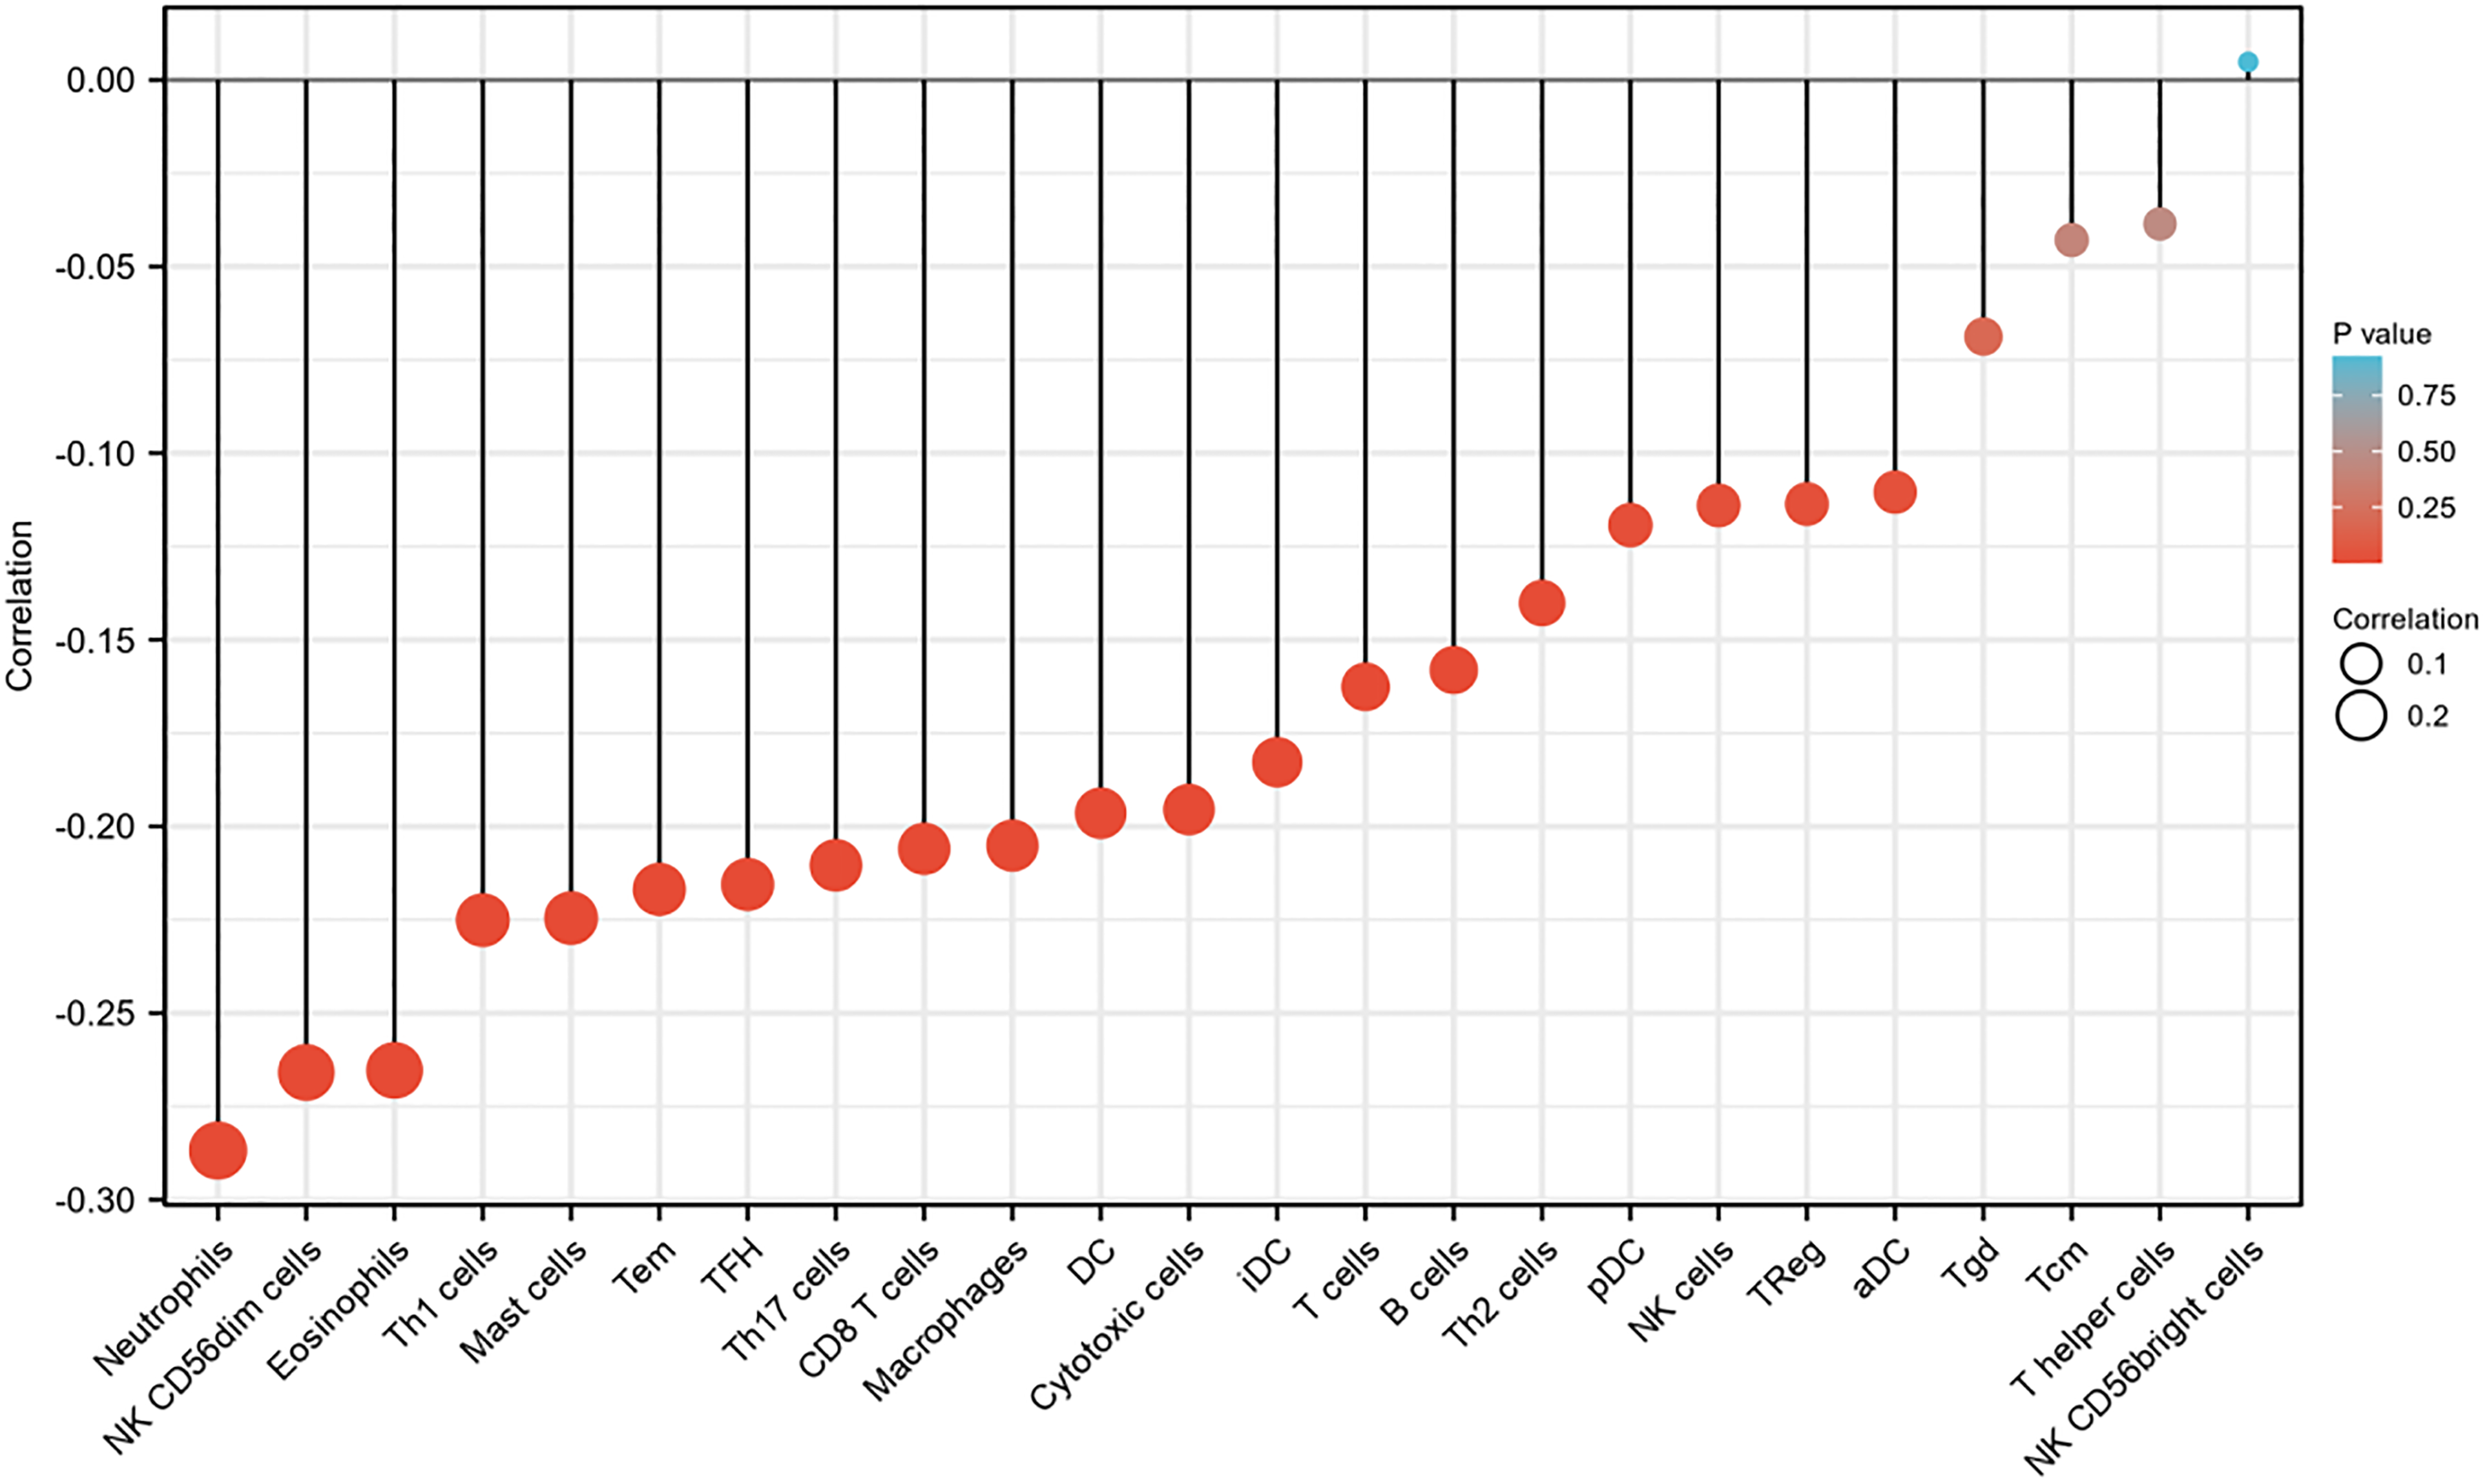
A correlation was found between the expression of the OTX2-AS1 gene and 24 immune cells in GC patients (lollipop chart).
The Correlation Between OTX2 antisense RNA 1 (OTX2-AS1) Expression and Immune Cells Detected by Spearman Correlation Method.

Cell Line Validation of OTX2-AS1 Expression
As far as OTX2-AS1 expression was concerned, AGS and GES-1 showed a significant difference (1.941 ± 0.191 vs 0.878 ± 0.228, P < .05, Figure 9), and SGC7901 and GES-1 showed a significant difference (1.635 ± 0.427 vs 0.878 ± 0.228, P < .05, Figure 9). Based on these findings, OTX2-AS1 expression was significantly higher in GC cells than in GES-1 cells.

Expression of OTX2-AS1 in human gastric epithelial cells (GES-1), GC cell lines AGS and SGC7901.
Discussion
Several GC oncogenes have been identified and reported, including EGFR, HER2, and K-Ras, due to advances in genomic research. 25 Nevertheless, there is still a need to explore novel biomarkers with high specificity, sensitivity, and efficiency for the diagnosis and prognosis of GC. 26 LncRNAs are extensively involved in RNA decoys, epigenetic modifications, selective splicing, and transcriptional or posttranscriptional regulation.27,28 LncRNA MSC-AS1 is an independent predictor of poor OS in GC. 3 GC patients with high LINC00205 expression levels have a poorer prognosis. 29 lncRNA PVT1 may serve as a novel predictive biomarker for poor prognosis and clinicopathological features of GC. 30 As a result, lncRNAs should be studied as potential GC biomarkers and therapeutic targets in the future.
According to the relevant literature we reviewed, there are fewer articles on the relationship between OTX2-AS1 and clinical features of tumors, so the clinical significance and specific regulatory mechanisms of OTX2-AS1 in tumors are unclear. OTX2-AS1 expression was an independent prognostic factor for LSCC. 12 In the present study, a significant association was found between OTX2-AS1 expression and poor prognosis, including OS (HR: 1.54; 95% CI: 1.10-2.14; P = .011), PFI (HR: 1.75; 95% CI: 1.22-2.51; P = .002) and DSS (HR: 1.85; 95% CI: 1.21-2.85; P = .005). OTX2-AS1 expression (HR: 1.771; 95% CI: 1.164-2.696; P = .008) was an independent predictor of OS in multivariate analyses.
H pylori is a Gram-negative motile curved microorganism. 31 H pylori infection and its interaction with epigenetics are strongly associated with the development of GC. 32 lncRNA NEAT1 may regulate the COX-2/BCL9 pathway by sponging miR-30a (miR-30a-3p and miR-30a-5p) and thus act as a promoter of tumorigenesis in H pylori GC. 33 Although H pylori infection is closely associated with the progression of GC, the mechanisms underlying this process are not fully understood. In this study, OTX2-AS1 expression was significantly negatively associated with H pylori infection in GC patients (P = .006). The specific mechanism by which OTX2-AS1 mediates GC in response to H pylori infection needs to be further investigated.
mTORC1 signaling as a downstream effector of OTX2-PAX3 reveals the role of the protein synthesis pathway in regulating the pathogenesis of group 3 medulloblastoma. 34 OTX2 activates cell cycle genes and inhibits the differentiation of medulloblastoma cells. 35 In this study, OTX2-AS1 may be involved in pathways such as olfactory transduction, G alpha (s) signaling events, keratinization, olfactory signaling pathway, and preimplantation embryo. The specific mechanism of OTX2-AS1-mediated gastric carcinogenesis and progression needs to be further investigated.
With the gradual application of tumor immunotherapy in clinical practice, researchers are actively exploring tumor immunotherapy for GC, which is expected to bring hope to GC patients. 36 Tumor immunotherapy aims to reshape the specific immunity against tumors in order to kill them. LncRNAs play a pivotal role in regulating the tumor immune microenvironment. According to the relevant literature we reviewed, there were few articles on OTX2-AS1 and immunity in cancer, so the mechanism of OTX2-AS1 and immune infiltration is unclear. As immunotherapy develops, understanding the immune-infiltrating cells in GC becomes more important. A further innovation in this study was the exploration of how OTX2-AS1 expression related to immune-infiltrating cells in GC. There was a moderate correlation between the expression of OTX2-AS1 and the level of aDC, B cells, CD8 T cells, Cytotoxic cells, DC, eosinophils, iDC, macrophages, mast cells, neutrophils, NK CD56dim cells, NK cells, pDC, T cells, Tem, TFH, Th1 cells, Th17 cells, Th2 cells, and TReg. There may be potential mechanisms by which OTX2-AS1 inhibits aDC, B cells, CD8 T cells, Cytotoxic cells, DC, eosinophils, iDC, macrophages, mast cells, neutrophils, NK CD56dim cells, NK cells, pDC, T cells, Tem, TFH, Th1 cells, Th17 cells, Th2 cells, and TReg.
There are some limitations to this study but it did systematically investigate the relationship between OTX2-AS1 and GC. In this study, we used RNA sequencing from TCGA database. OTX2-AS1 expression was not shown at the protein level, nor could we determine the direct mechanism by which OTX2-AS1 is involved in GC. OTX2-AS1-mediated GC needs further investigation. Additional experiments are needed to confirm the bioinformatics analysis.
Conclusion
The expression of OTX2-AS1 was significantly higher in GC patients than in normal gastric tissue. OTX2-AS1 expression in GC patients showed a significant negative correlation with H pylori infection. High expression of OTX2-AS1 was associated with poor OS, PFI, and DSS in GC. It is possible that OTX2-AS1 participates in the development of GC through pathways such as olfactory transduction, G alpha (s) signaling events, keratinization, olfactory signaling pathway, and preimplantation embryo. It was found that OTX2-AS1 expression was associated with immune-infiltrating cells. Based on the findings of this study, OTX2-AS1 may be a valuable biomarker of prognosis and response to immunotherapy in GC.
Footnotes
Abbreviations
Consent to Participate
Not applicable.
Consent for Publication
Not applicable.
Data Availability Statement
The datasets used and/or analyzed during the present study are available from the corresponding author upon reasonable request.
Declaration of Conflicting Interests
The authors declared the following potential conflicts of interest with respect to the research, authorship, and/or publication of this article: DL and DW were employed by ChosenMed Technology (Beijing) Co., Ltd. The remaining authors declare that the research was conducted in the absence of any commercial or financial relationships that could be construed as a potential conflict of interest.
Ethical Approval
Data for this study was obtained from TCGA database. As data can be downloaded free of charge from TCGA for research and publication, ethical approval and patient consent were not required for our study. The study was validated in cell lines only and did not use human or animal tissues.
Funding
The authors received no financial support for the research, authorship, and/or publication of this article.