Abstract
Glioblastoma is the most common type of malignant brain tumors and the most feared cancer among adults. The poor prognosis among patients affected with this type of cancer is associated with its high-invasiveness and the lack of successful therapies. A comprehensive understanding for the early molecular mechanisms in glioblastoma would definitely enhance the diagnosis and the treatment strategies. Deregulated expression of key genes that are known to be involved in early neurogenesis could be the instigator of brain tumorigenesis. Ras Like Without CAAX 1 (RIT1) gene that encodes an unusual “orphan” GTPase protein belongs to this category of critical genes that are known to be involved in controlling sequential proliferation and differentiation of adult hippocampal neural progenitor cells. In this study, we surveyed RIT1 gene expression by in-silico approaches to determine its spatio-temporal pattern in glioblastoma. Our results revealed a significant and progressive upregulation of RIT1 mRNA levels in various publicly available datasets. RIT1 expression ranked among the top upregulated genes in glioblastoma cohorts and it correlated with poor overall survival. Genetic and epigenetic analysis of RIT1 didn’t reveal any significant aberration that could underlie its deregulated expression. Yet, our results highlighted the possibility of its activity to be transcriptionally controlled by STAT3, one of the main players in the onset of glioblastoma. In conclusion, our study presented for the first time a potential oncogenic role for RIT1 in glioblastoma. Knowing that the RAS superfamily of proteins has created an evolution in the cancer field, RIT1 should be added to this list through further investigations on its possible usage as a biomarker and therapeutic target in glioblastoma.
Introduction
Brain tumor is a significant source of cancer-related morbidity and mortality worldwide. Although the incidence of neurological cancer is rare accounting for less than 2% of the total number of cancer cases, it is considered among the most feared, aggressive and difficult-to-treat malignancies [1]. Due to their heterogeneity, these tumors were categorized into 29 histologic groups according to the World Health Organization’s (WHO) classification of tumors of the central nervous system (CNS) in 2016 [2]. Glioblastoma Multiforme (GBM) falls under the category of malignant astrocytoma (grade IV) and is considered the most aggressive and prevalent type of gliomas [3]. GBM is still almost invariably fatal even after aggressive treatment regimens that incorporate neurosurgery, radio- and chemotherapies [4, 5]. Several properties make GBM incurable despite the tremendous advancements in basic research and clinical practice. Among these factors are: 1-the infiltrative nature of glioma cells making the complete surgical resection impossible even with excessive advancement in neurosurgical techniques, 2-the insufficient delivery of treatments due to pharmacokinetics properties, 3-the existence of the blood–brain barrier (BBB), and 4-the developing resistance to conventional chemotherapy and radiation which spares these cells from eradication [2]. Thus, it is imperative to unravel the detailed mechanisms of brain tumorigenesis in order to develop effective and targeted methods for intervention.
RIT1 belongs to the RAS superfamily of low molecular weight GTP-binding proteins that are known to be implicated in regulating variety of cellular processes, including cell growth, transformation, differentiation, morphogenesis and apoptosis [6]. Despite harboring a GTPase activity like other proteins in this family, RIT1 lacks the prenylation motif (CAAX, XXCC or CXC) required for its association with the plasma membrane [7]. In humans, the corresponding protein is encoded by the RIT1 gene that is located on chromosome 1q22 and it shares approximately 50% sequence homology with the well-studied RAS oncogenes. RIT1 has a widespread occurrence in the human nervous system. RIT1 variants with gain of function mutations are highly associated with Noonan syndrome (NS), an autosomal dominant disorder (OMIM #616564). NS patients develop several partially penetrant developmental anomalies, such as postnatal growth retardation and failure to thrive, congenital heart defects, hypertrophic cardiomyopathy (HCM), hyperkeratosis, and hypotrichosis [8]. Recently, somatic mutations in RIT1 were shown to be implicated in several types of cancer including lung adenocarcinoma, hepatoblastoma, urinary tract carcinoma, and adult myeloid malignancies [7, 9, 10]. In mice, Rit1 is expressed in the neurogenic niches of the CNS, the subgranular zone in the dentate gyrus of the hippocampus, and the subventricular zone of the lateral ventricles. Inactivation of Rit1 doesn’t alter hippocampal development but hippocampal neural cultures derived from Rit1
Although the role of RIT1 in brain development in mammals is well-studied, its expression pattern in human gliomas is still largely unknown. Here, we sought to survey RIT1 expression in various cohorts and within different grades of human gliomas. We report for the first time a significant upregulated pattern of this gene in gliomas which suggested that RIT1 might have a potential role in the progression of the disease. The high expression of RIT1 was positively associated with a decreased survival rate mainly among lower grade glioblastoma patients suggesting its potential prognostic value. Lastly, we demonstrate that RIT1 expression is positively correlated with that of Signal Transducer and Activator of Transcription 3 (STAT3), the critical mediator of tumorigenesis in GBM, and could be one of its direct targets and/or regulators.
Material and methods
mRNA expression analysis, Kaplan-Meier survival plots and correlation studies for RIT1 in TCGA data
The gene expression profiling interactive tool (GEPIA;
Expression profile for RIT1 across cancer types. (A) Expression levels for RIT1 across 33 TCGA tumors compared to TCGA normal and Genotype-Tissue Expression (GTEx) data using the GEPIA webserver. For each TCGA tumor type (red), its matched normal and GTEx data (green) are given; T: tumor; N: normal; n: number. Y axis: transcript per million (log2 (TPM 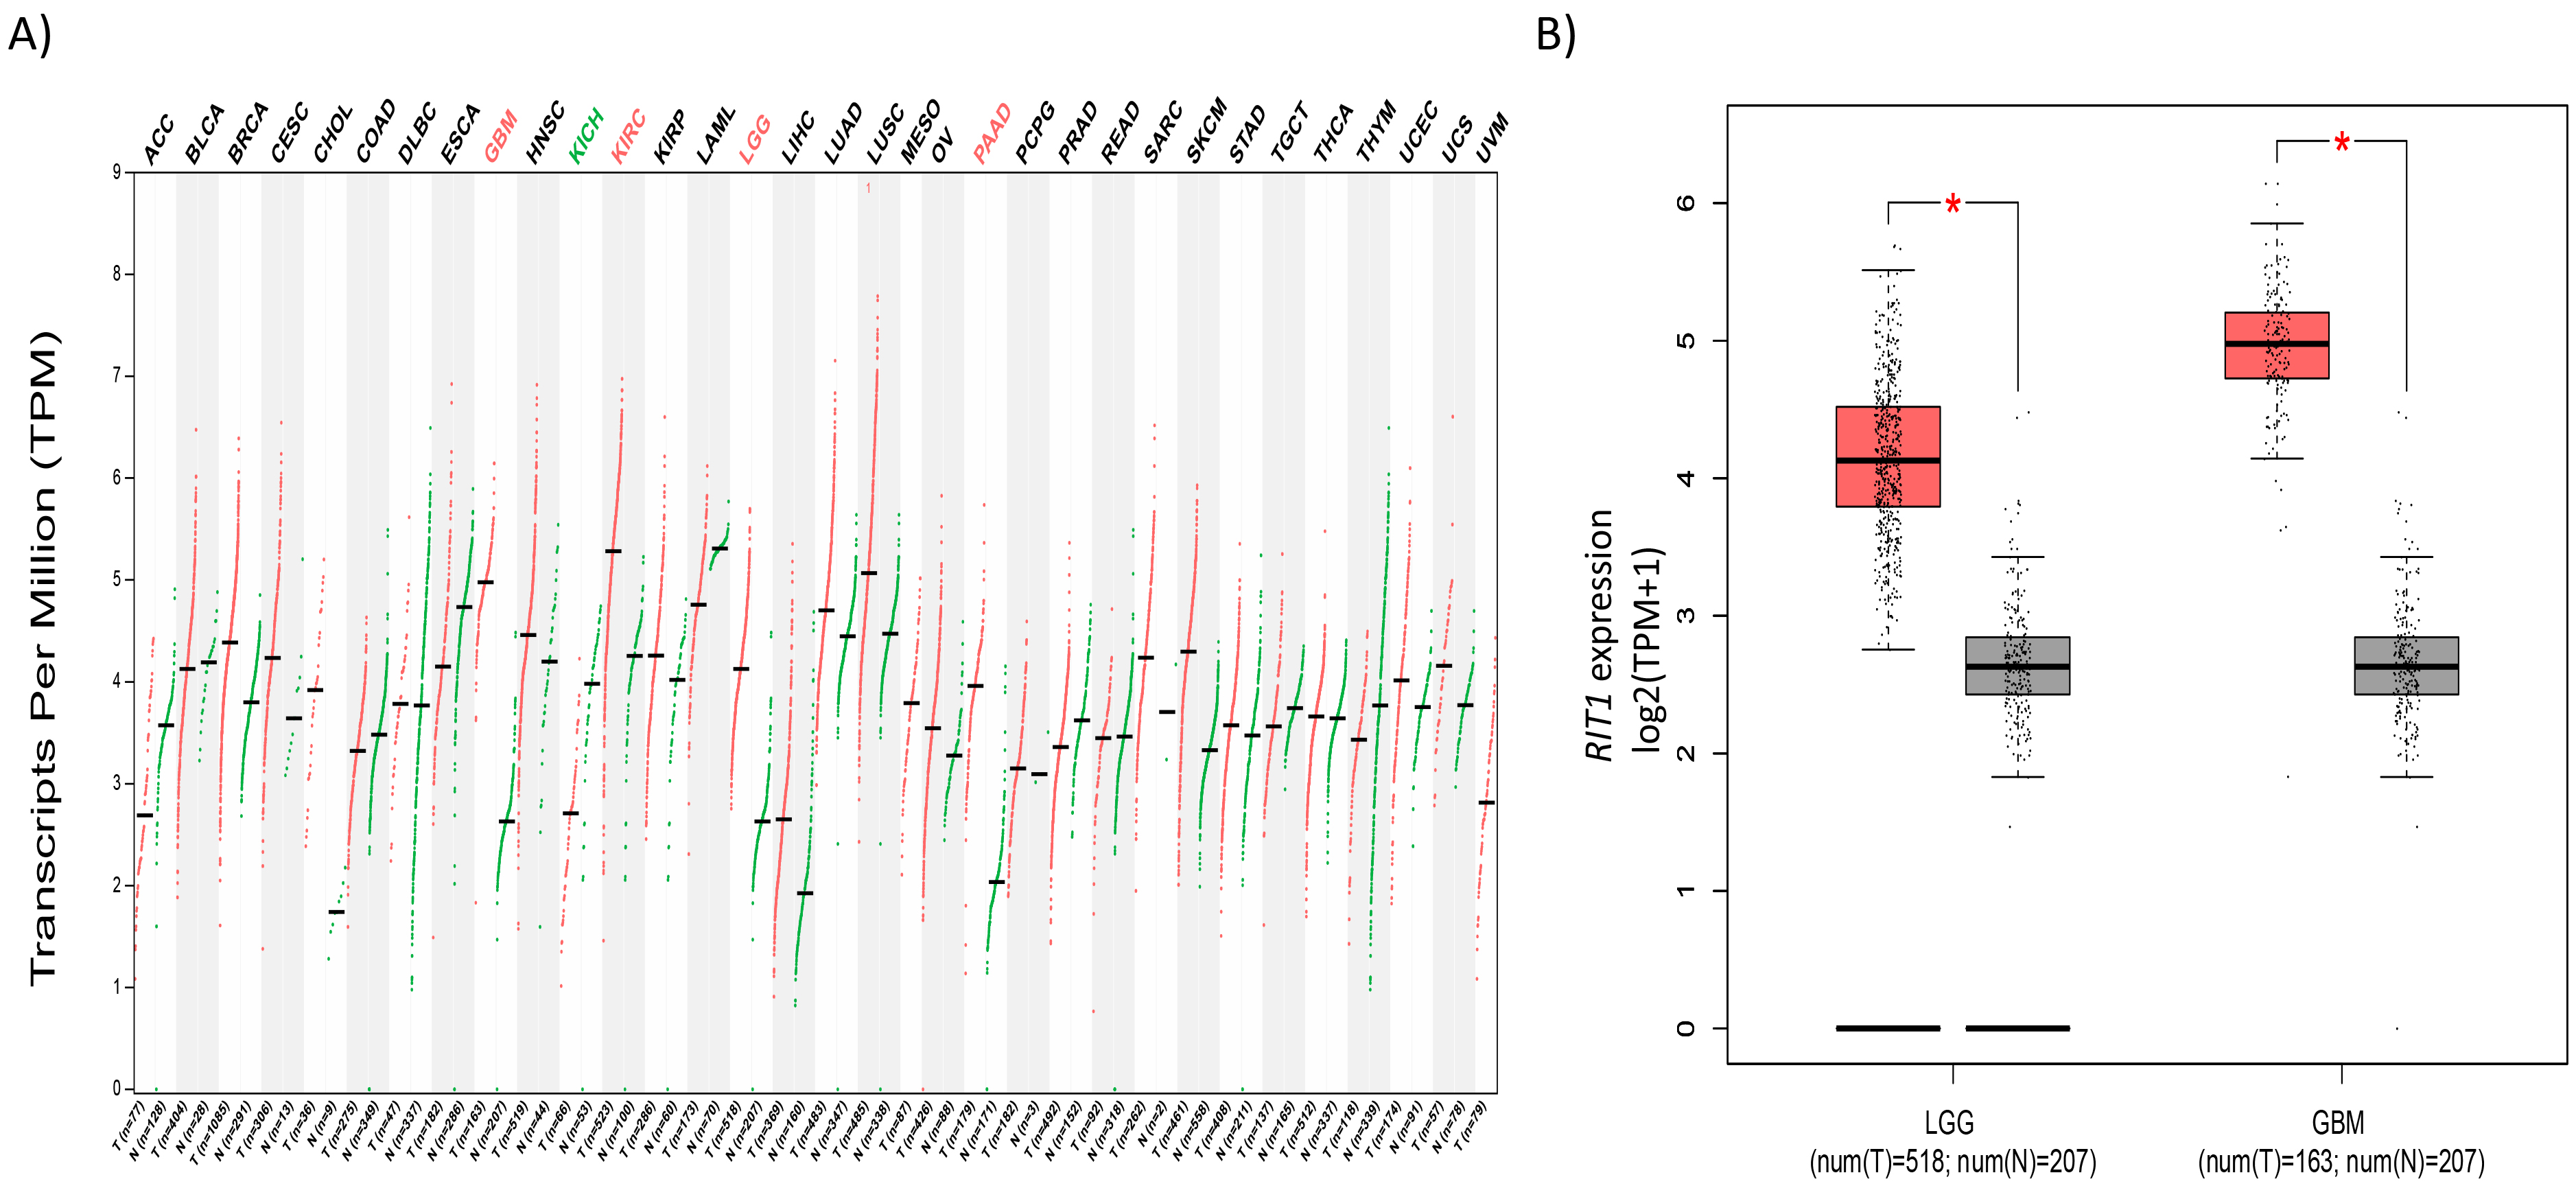
RIT1 analysis in different glioblastoma cohorts. Boxplots comparing RIT1 expression in normal (left plot) and cancer tissue (right plot) that were derived from Oncomine database (A). The fold change of RIT1 in various glioblastoma datasets presented (B) expressed as boxplots for the TCGA, Bredel et al., Sun et al., and Murat et al. datasets. X-axis of the plot represents normal vs cancer group; Y-axis represents mRNA expression in log2 median/mean centered intensity. The line in the middle represents the median value. Differences were examined statistically by two-tailed student’s 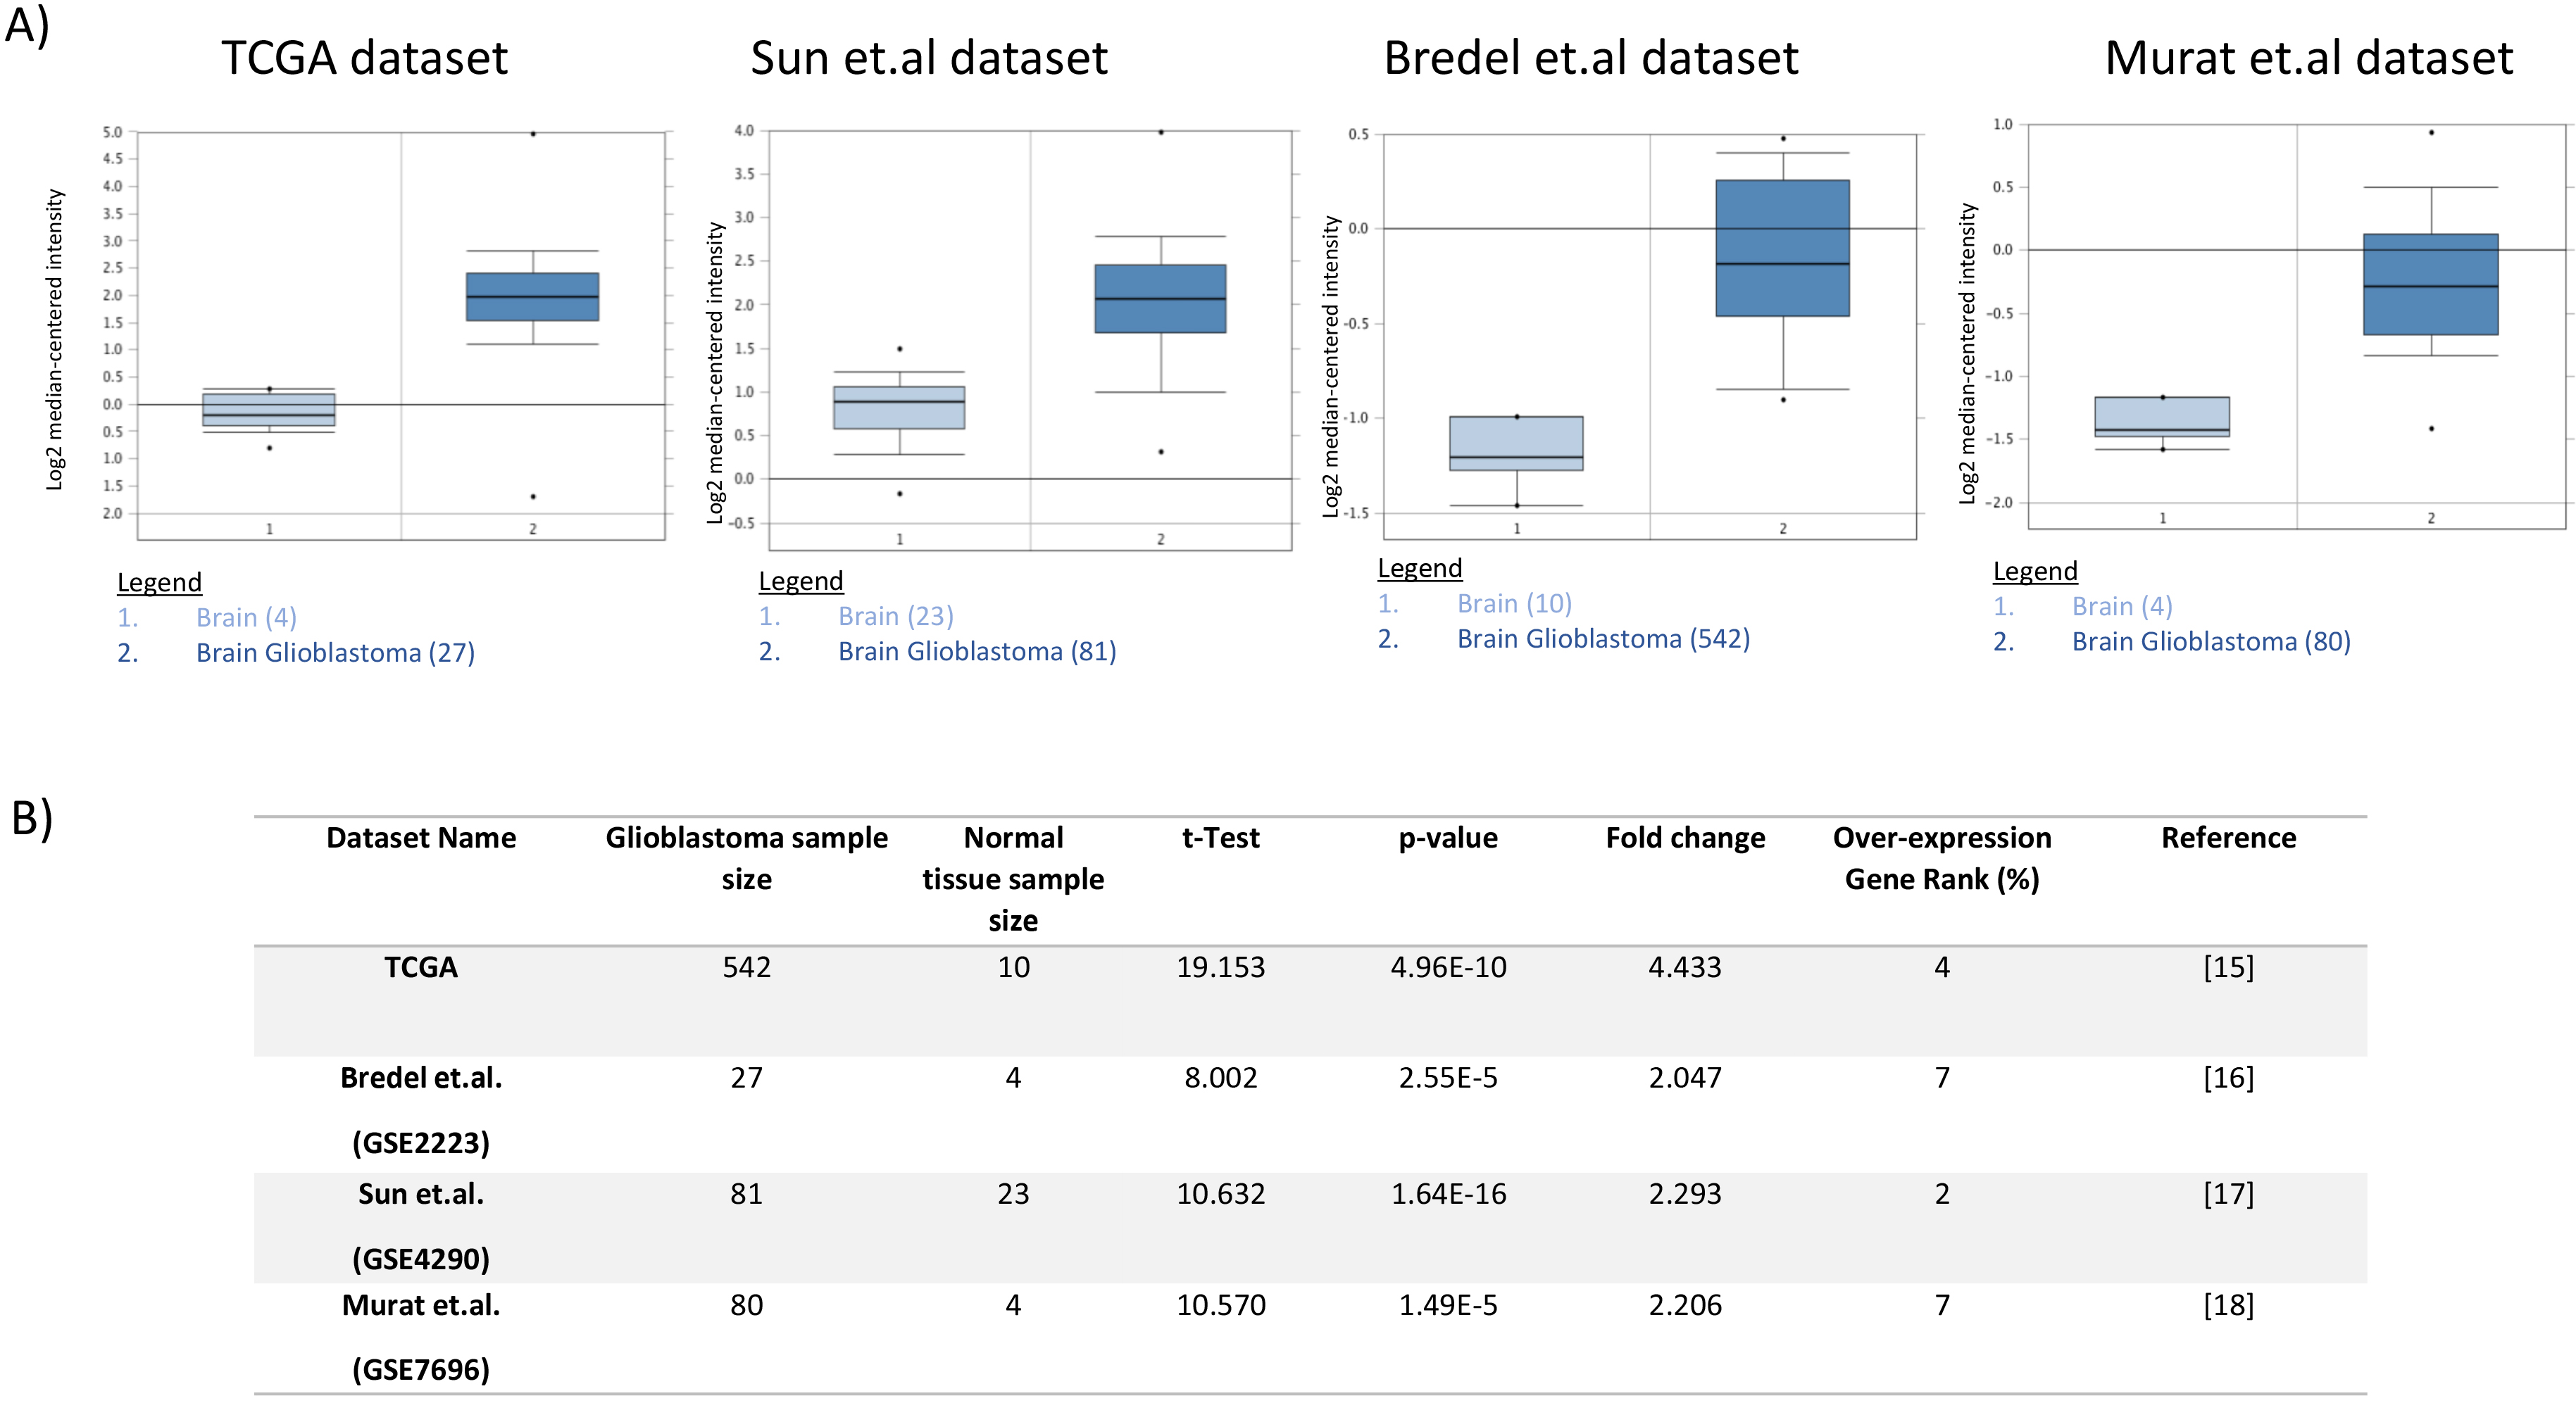
We used the Oncomine web portal to analyze RIT1 mRNA expression in various human glioma cohorts. Oncomine (
Genetic and epigenetic alterations of RIT1 in glioblastoma
The cBioPortal for Cancer genomics is an open-access resource (
Analysis of the RIT1 gene for promoter regulation by STAT3
We used the INSECT2.0 (IN-silico SEarch for Co-occurring Transcription factors, version 2.0) web server for prediction and analysis of the human RIT1 promoter for detecting potential binding sites (
Results
Differential expression studies of RIT1 transcript in pan-cancer
We surveyed the expression pattern of RIT1 amongst different cancer types by in silico analysis of publicly available expression datasets within the gene expression profiling interactive tool (GEPIA) project constituting RNA sequencing data from 9,736 tumors and 8,587 normal samples. Our analysis demonstrated that RIT1 expression was significantly upregulated only in four cancer subtypes amongst which are Glioblastoma Multiforme (GBM) and Lower Grade Glioma (LGG) (Fig. 1A). Studying RIT1 expression in 632 different categories of cancer that are presented in Genevestigator database revealed that those with the highest expression correspond mainly to brain glioma samples (Data is not provided). Among the 5% categories that scored the highest RIT1 expression, 25% showed to be corresponding to gliomas. Furthermore, mRNA expression showed that RIT1 is upregulated by 2 and 2.5-log2 fold change in LGG and GBM, respectively, as compared to matched normal tissues retrieved from TCGA and Gtex (Fig. 1B).
Upregulated expression of RIT1 in human gliomas relative to normal brain tissues
To further explore the differential expression of RIT1 between glioblastoma and non-cancerous brain tissues, the TCGA data as well as three other glioblastoma cohorts were analyzed using the Oncomine online database web portal (Fig. 2A). All four datasets showed a significant increase in the expression of RIT1 in glioblastoma tissues compared to that of normal brain (
Association of RIT1 expression levels with three glioma grades and overall survival time. (A) RIT1 expression stratified by glioblastoma grade versus normal tissues in the Shai glioblastoma dataset derived from Oncomine software. (B) Kaplan-Meier plots of survival were generated by Gepia (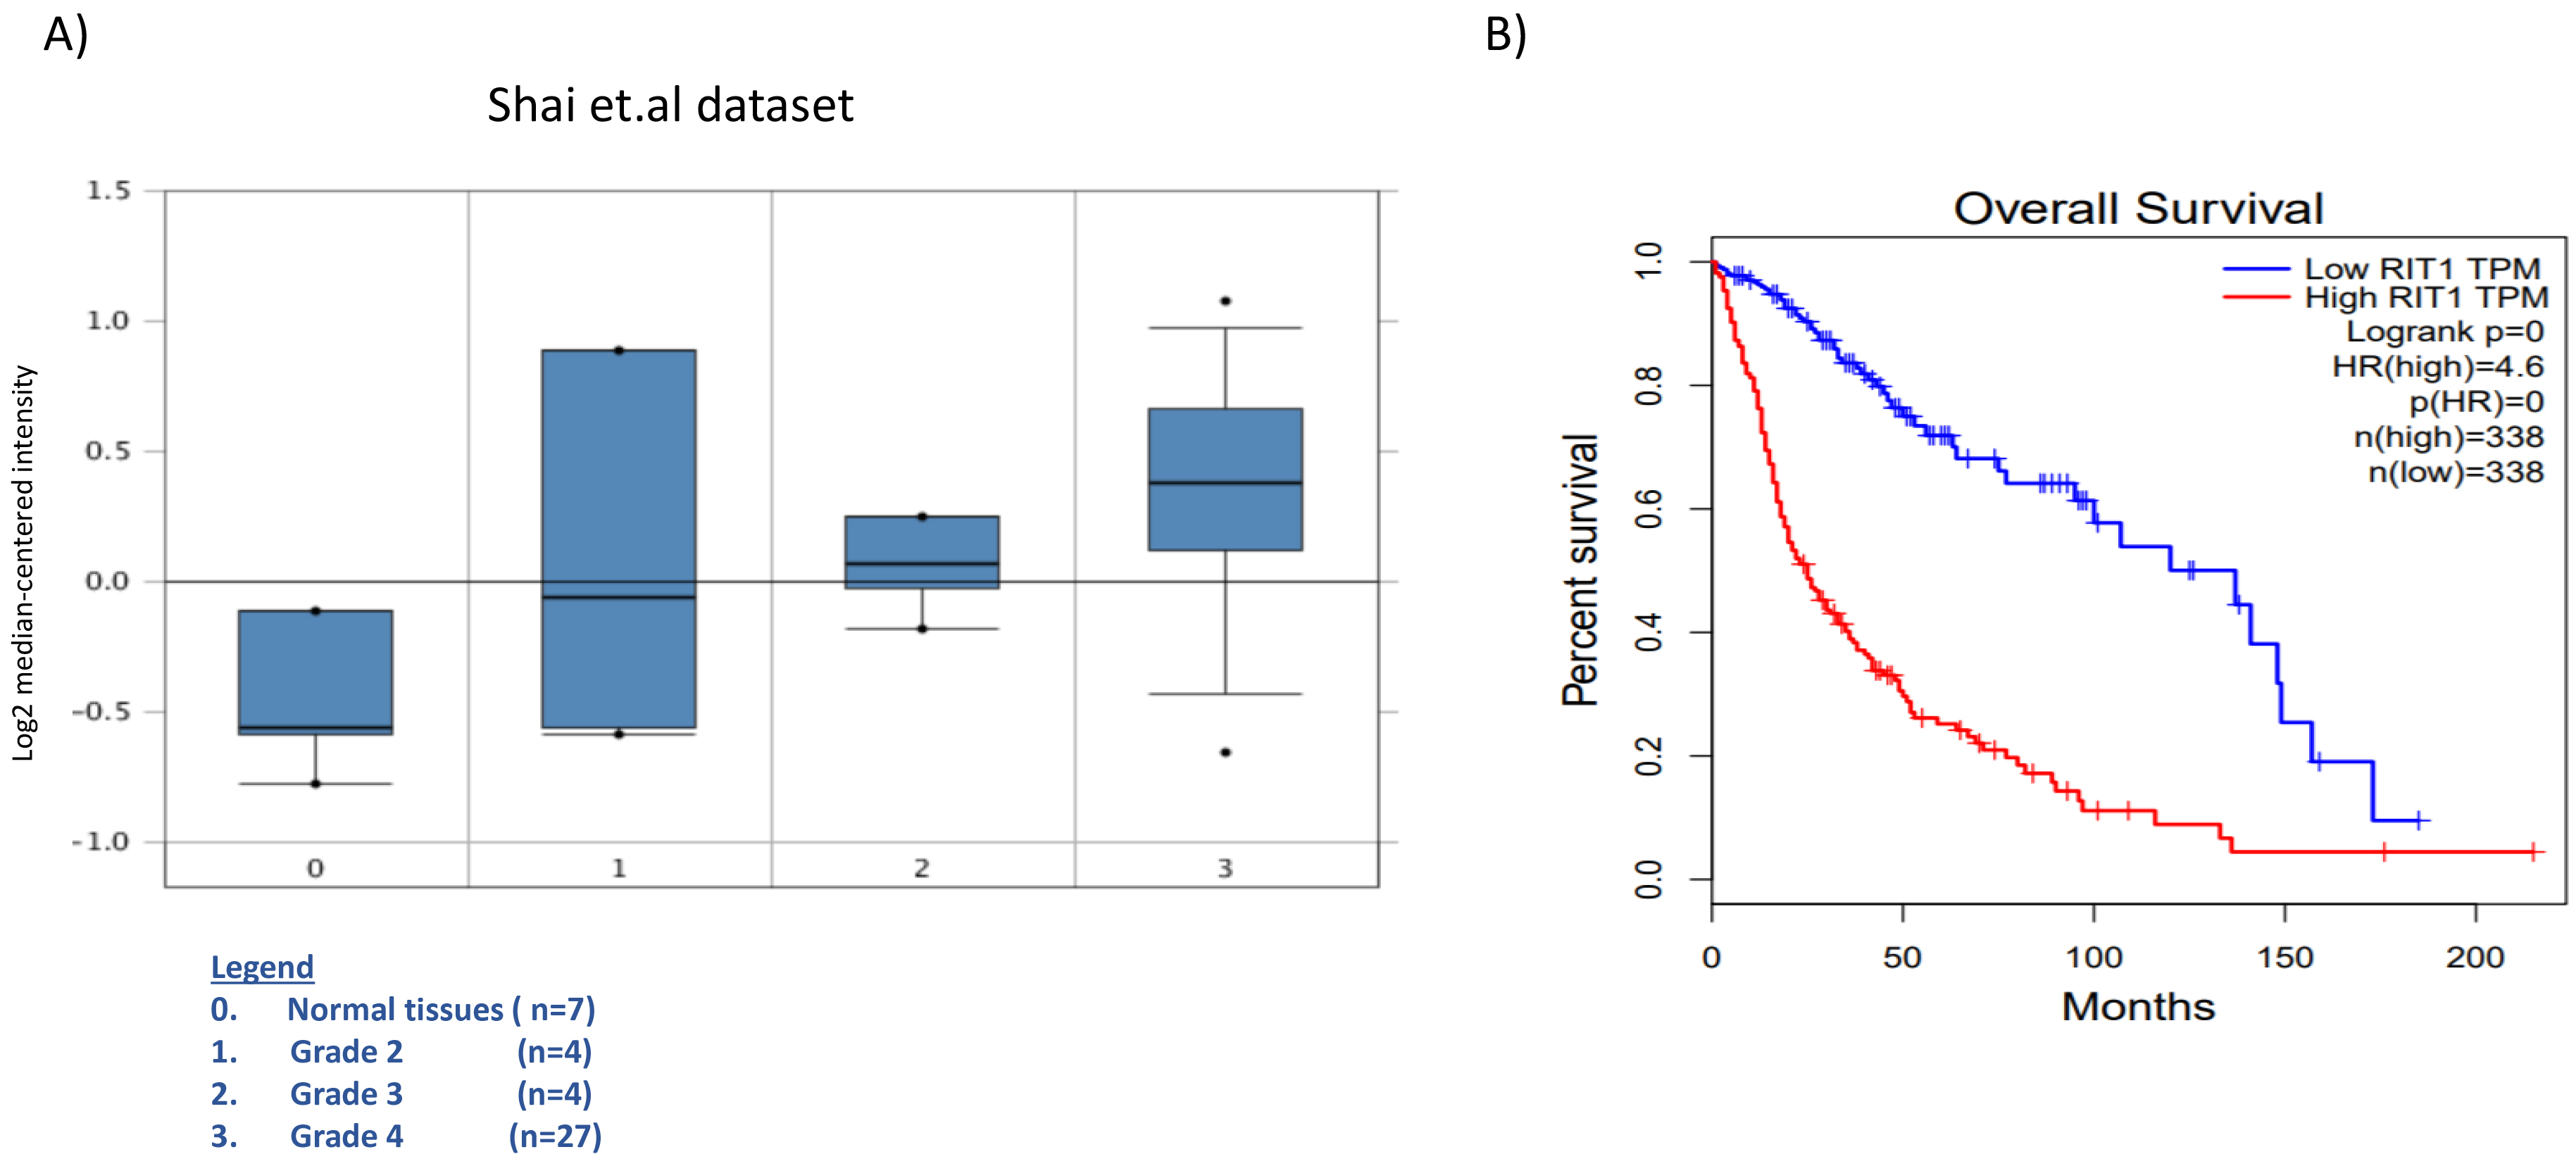
Low RIT1 expression is better correlated with survival in LGG. Kaplan-Meier plots of survival were generated by Gepia (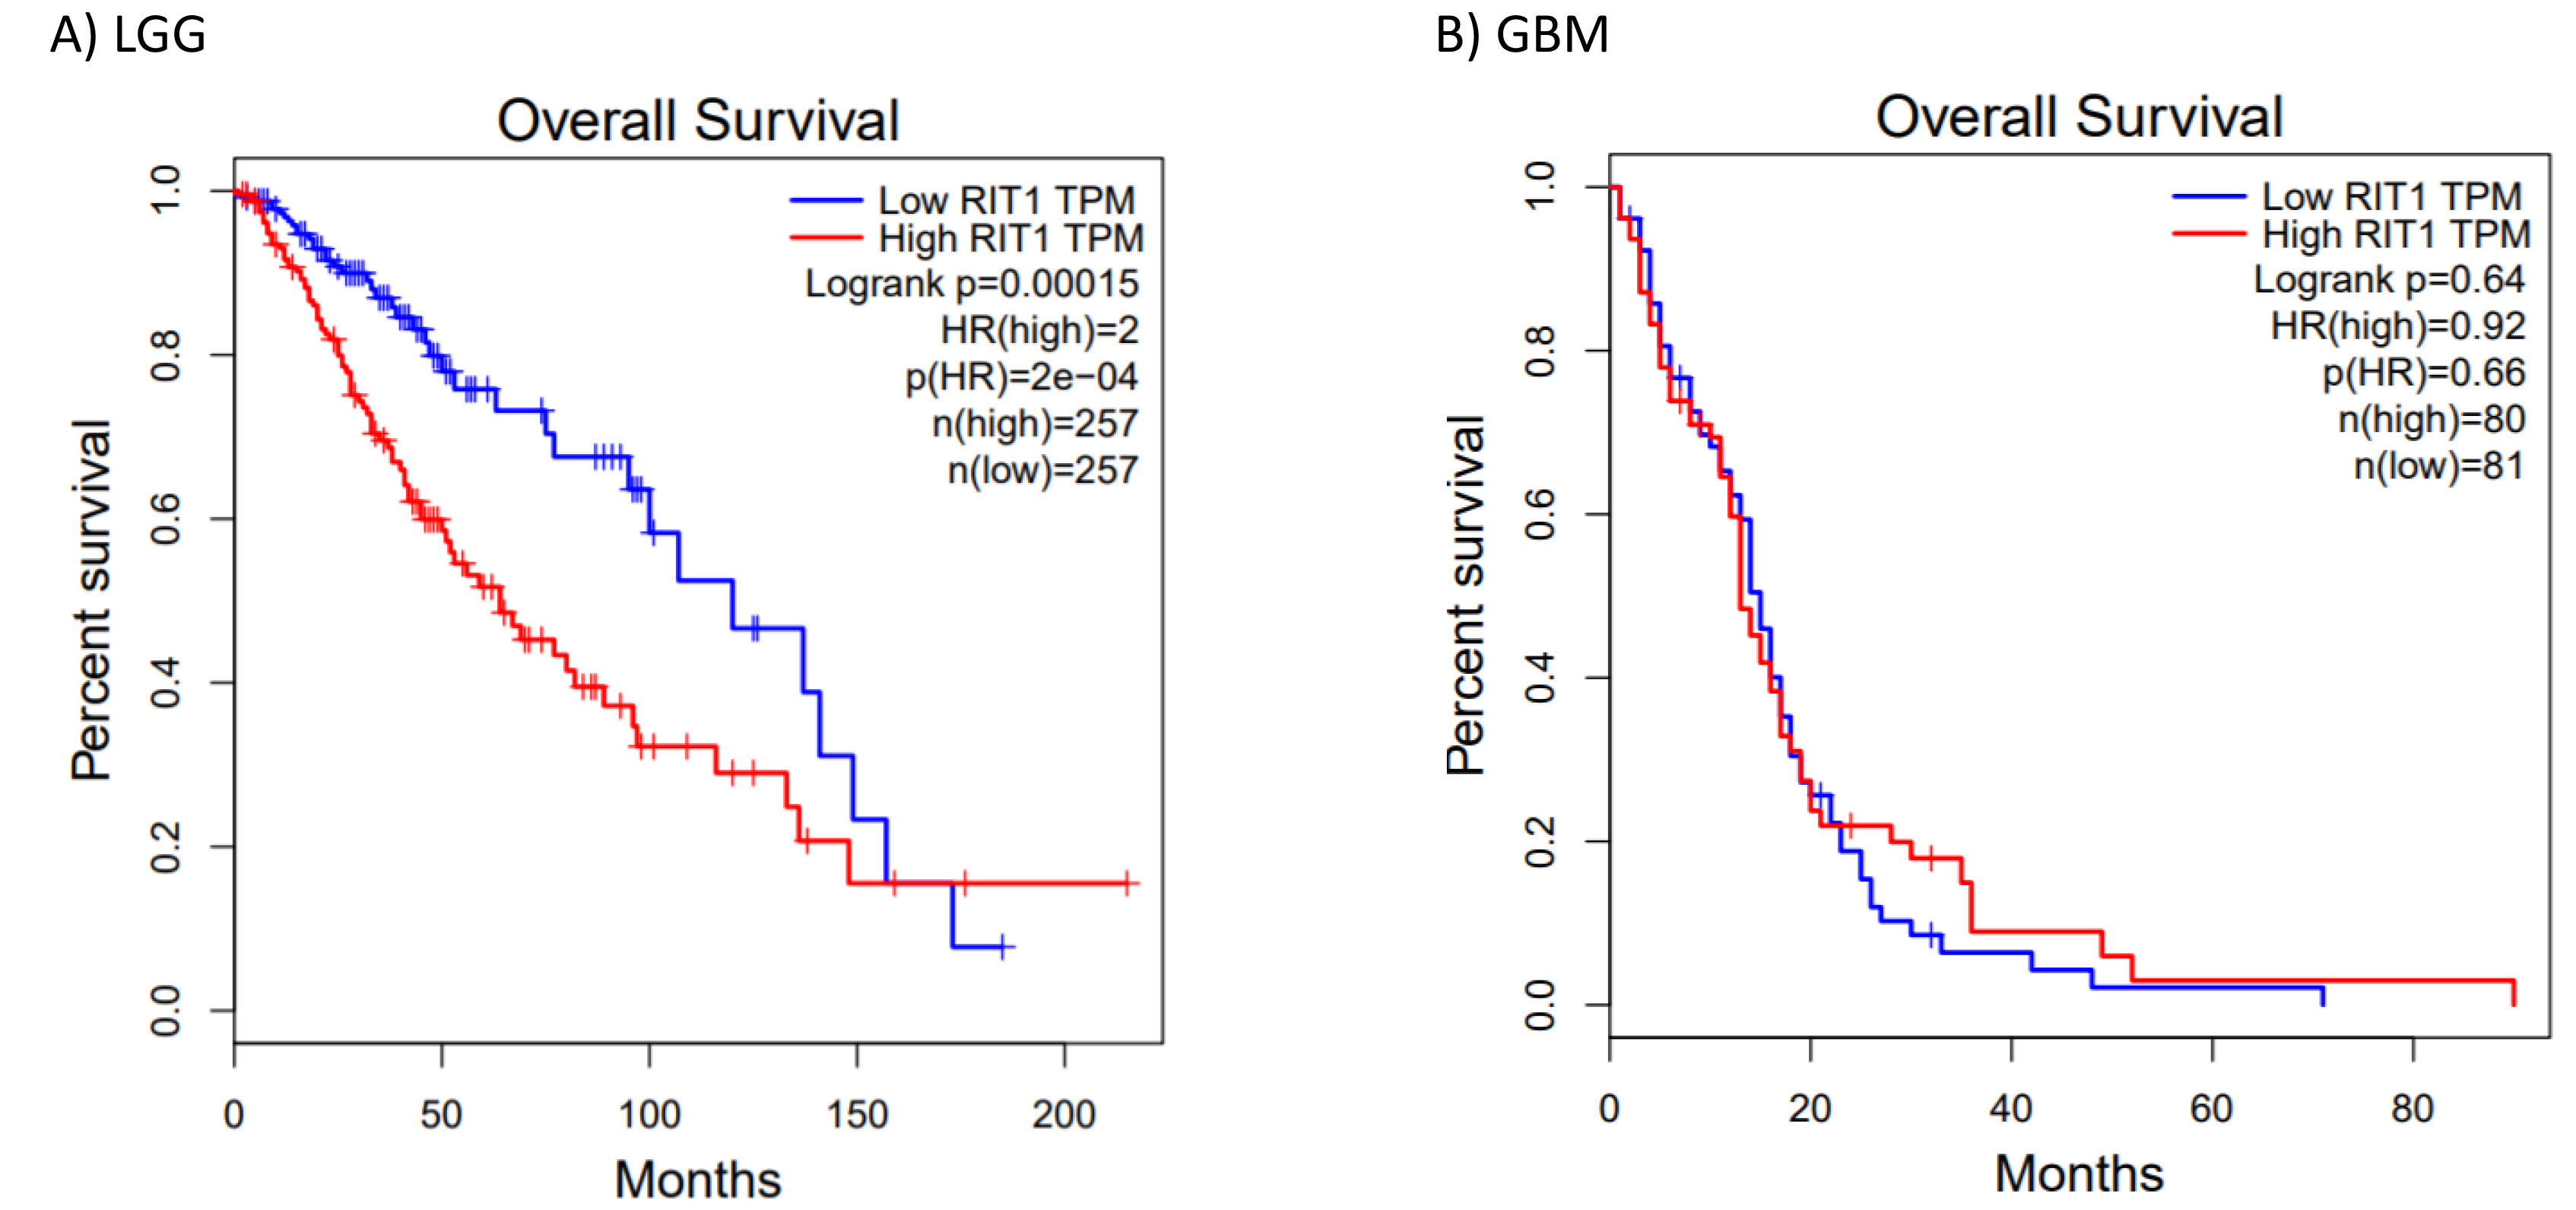
Genetic aberrations of RIT1 in cancer subtypes and its DNA methylation status in GBM. (A) The alteration frequency of a RIT1 gene signature was determined using the cBioPortal (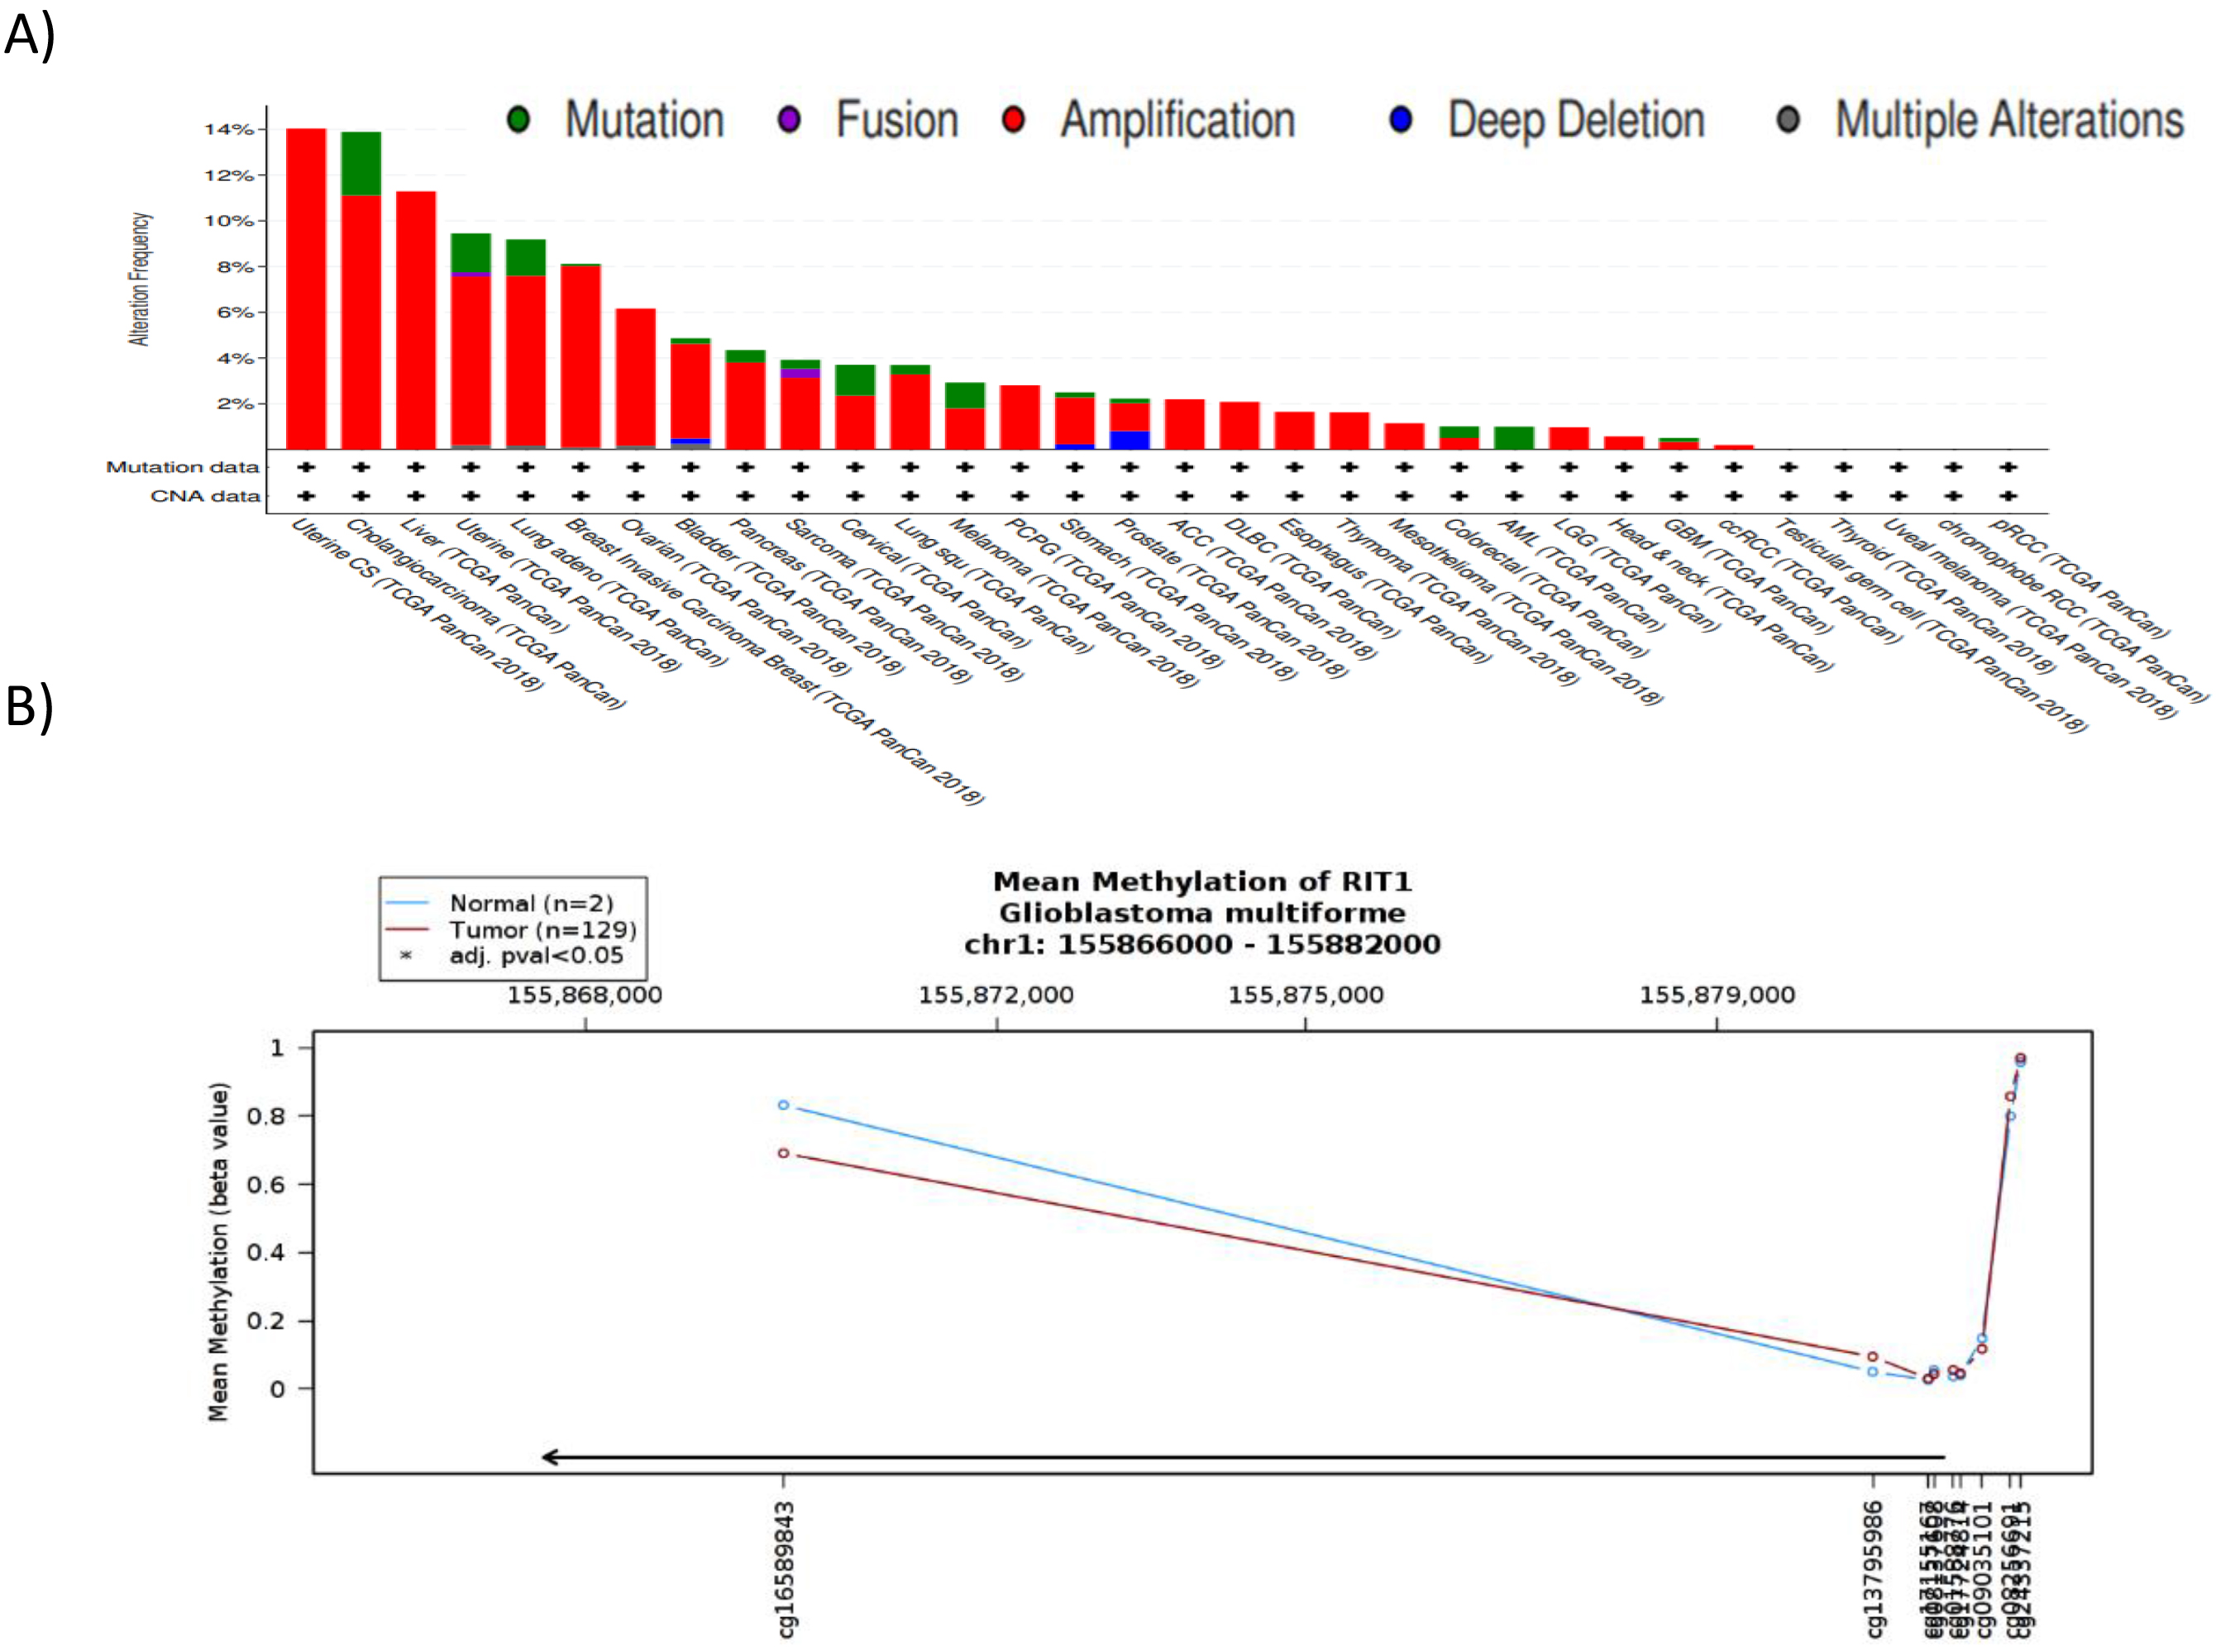
In silico analysis of the RIT1 promoter for potential STAT3 binding sites. The STAT3 potential binding sites with their corresponding position (Start, End) on the human (ENSG00000143622) and murine (ENSMUS00000028057) Rit1 gene (A), are visualized over the intronic/exonic junctions (B). Negative numbers indicate positions in the promoter region whereas positive numbers indicate regions downstream the transcriptional starting site. PWM: position weight matrix.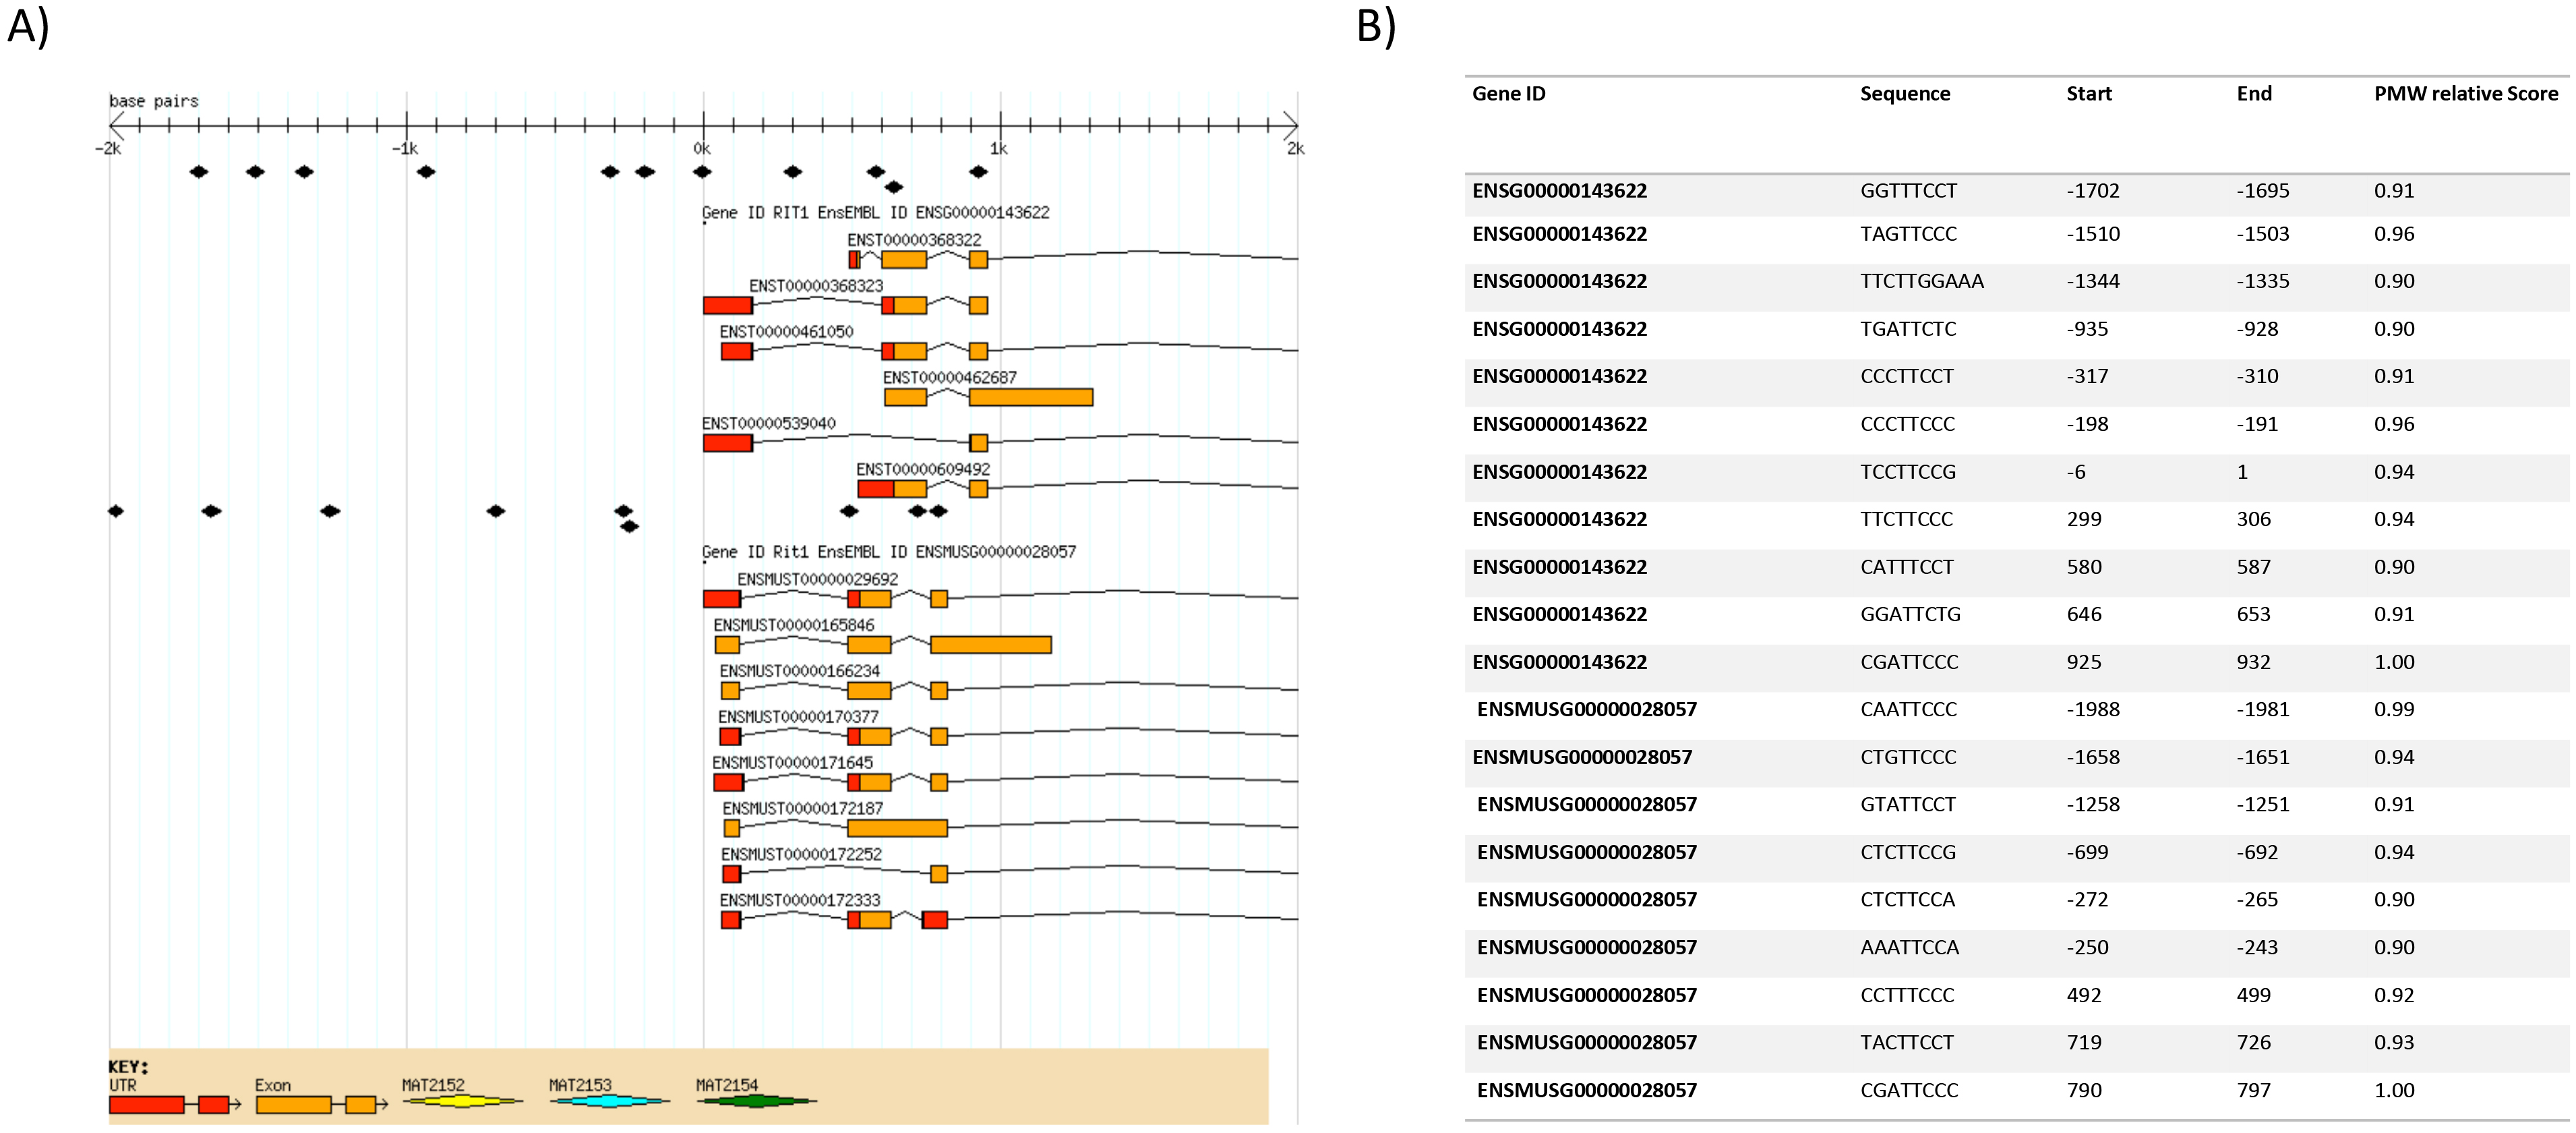
Spearman correlation analysis of RIT1 and STAT3 gene and mRNA expression levels. The expression of RIT1 was positively correlated with STAT3 mRNA expression in (A) normal brain tissues (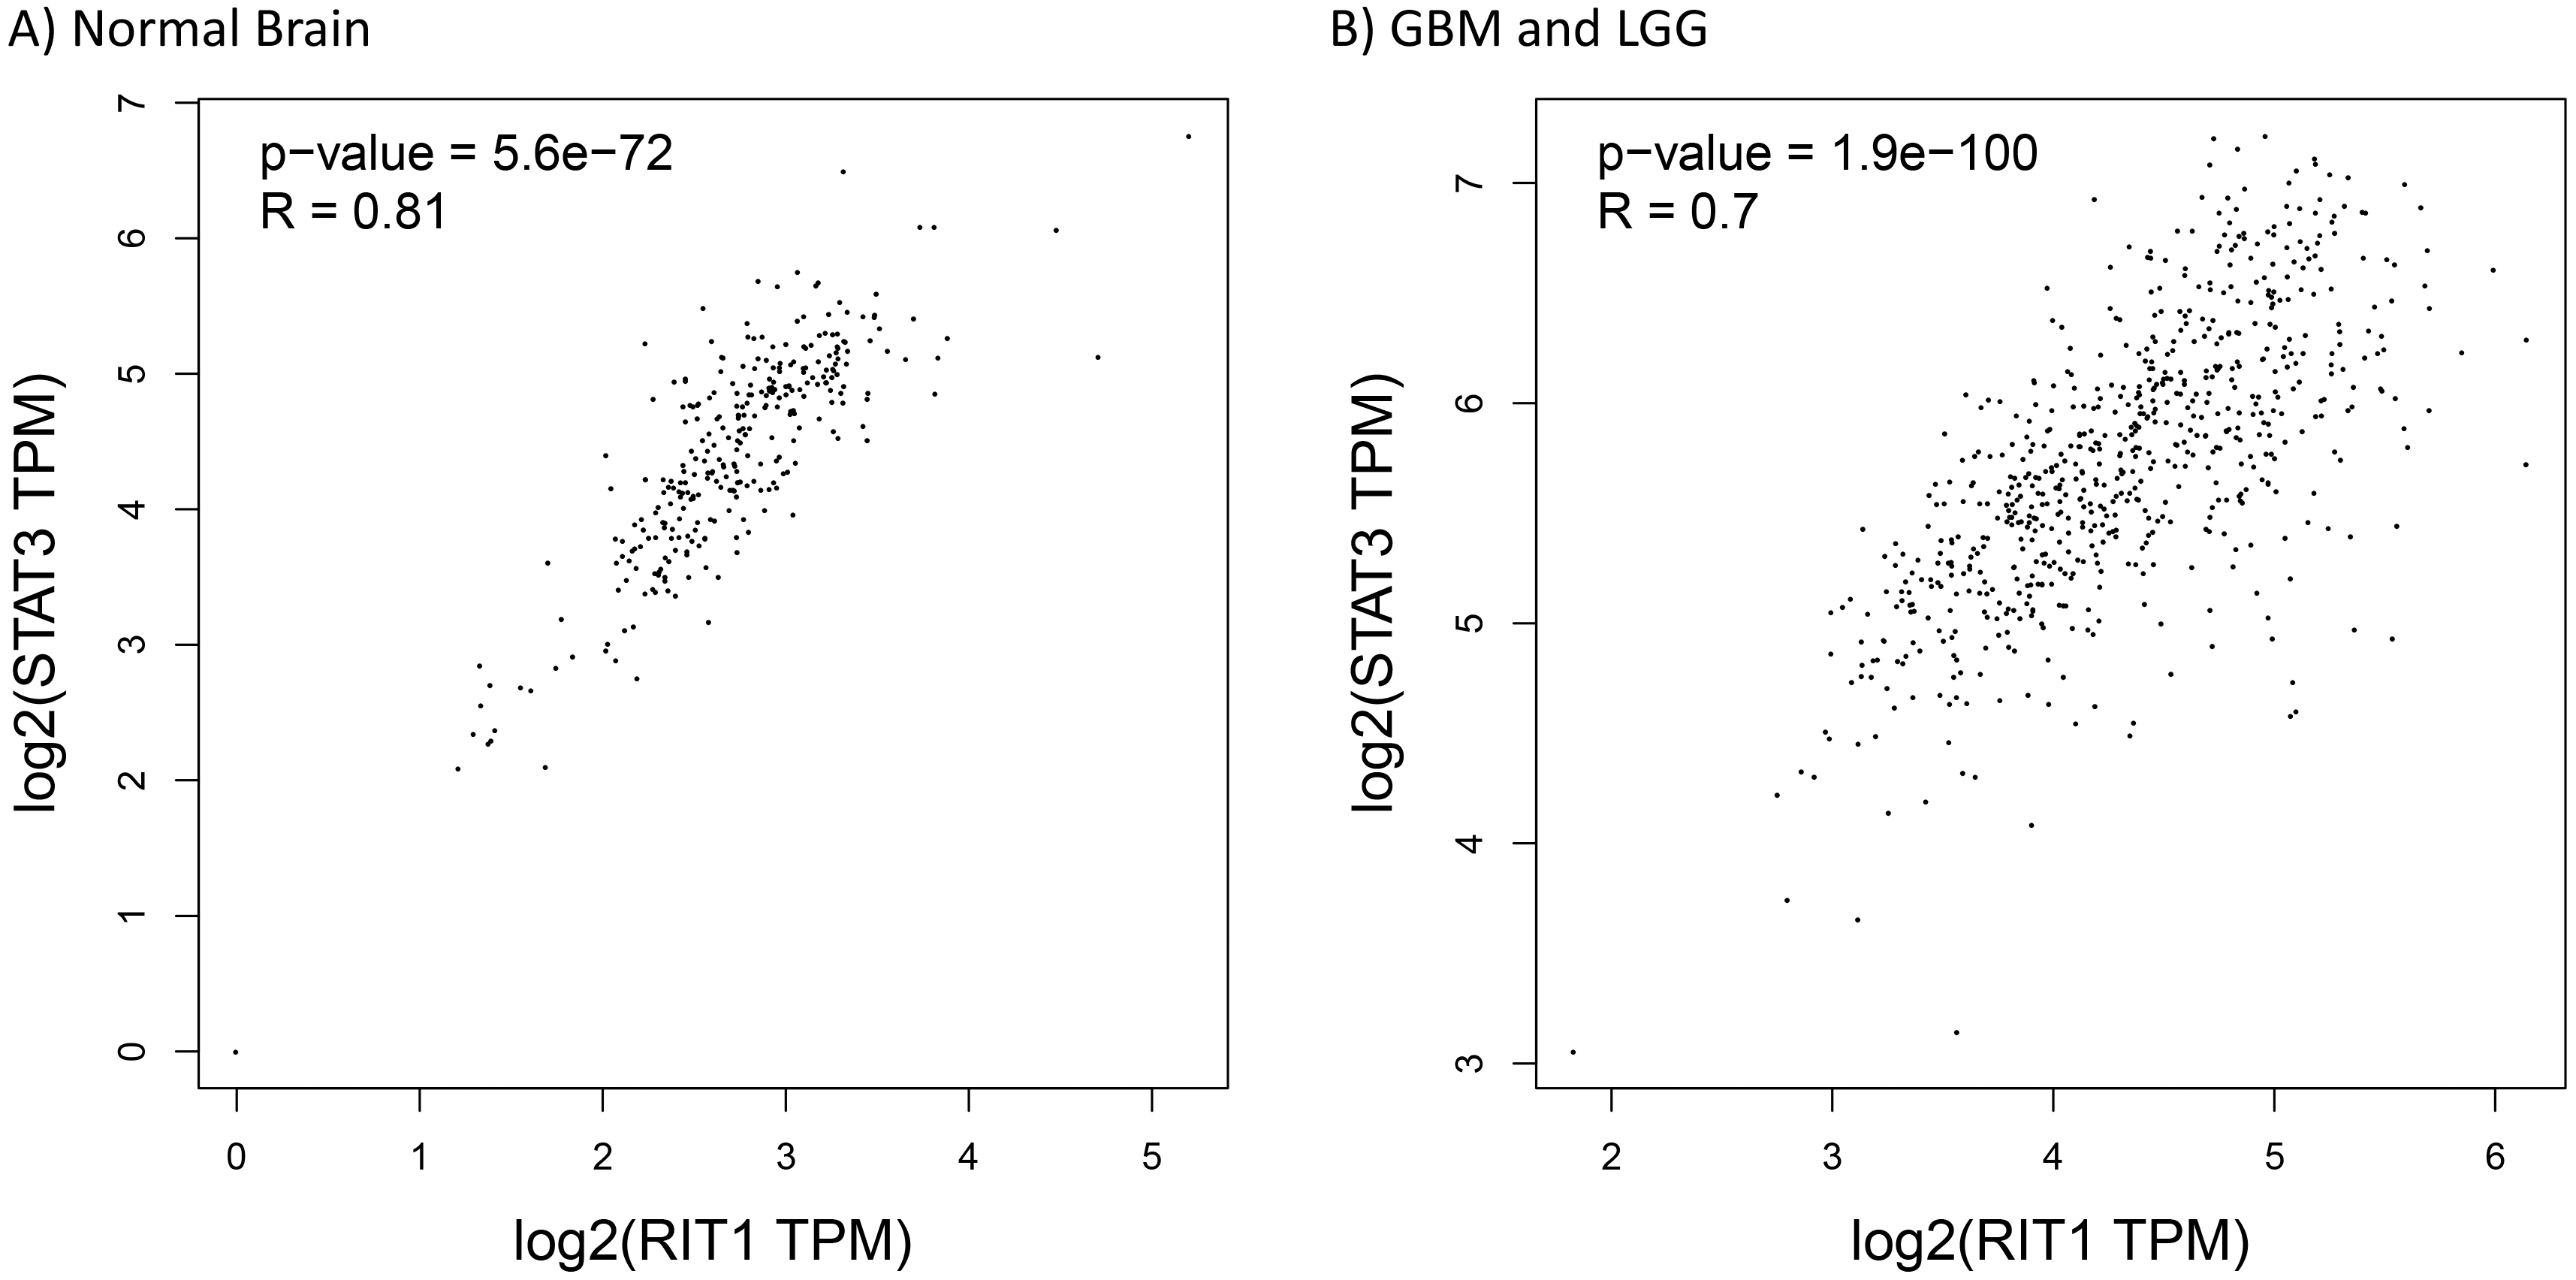
Schematic model of the hypothetical STAT 3-RIT1-SOX2 pathway in glioblastoma. p-STAT3 is a well-documented upregulated active protein in GBM that could enhance RIT1 transcription which in turn upregulates the expression of STAT3 and SOX2 in an AKT dependent manner. SOX2 could exert a positive feedback promoting phosphorylation of AKT and STAT3. The activation of this loop and the upregulation of STAT3, RIT1 and SOX2 will enhance GBM stemness and the tumorigenesis process.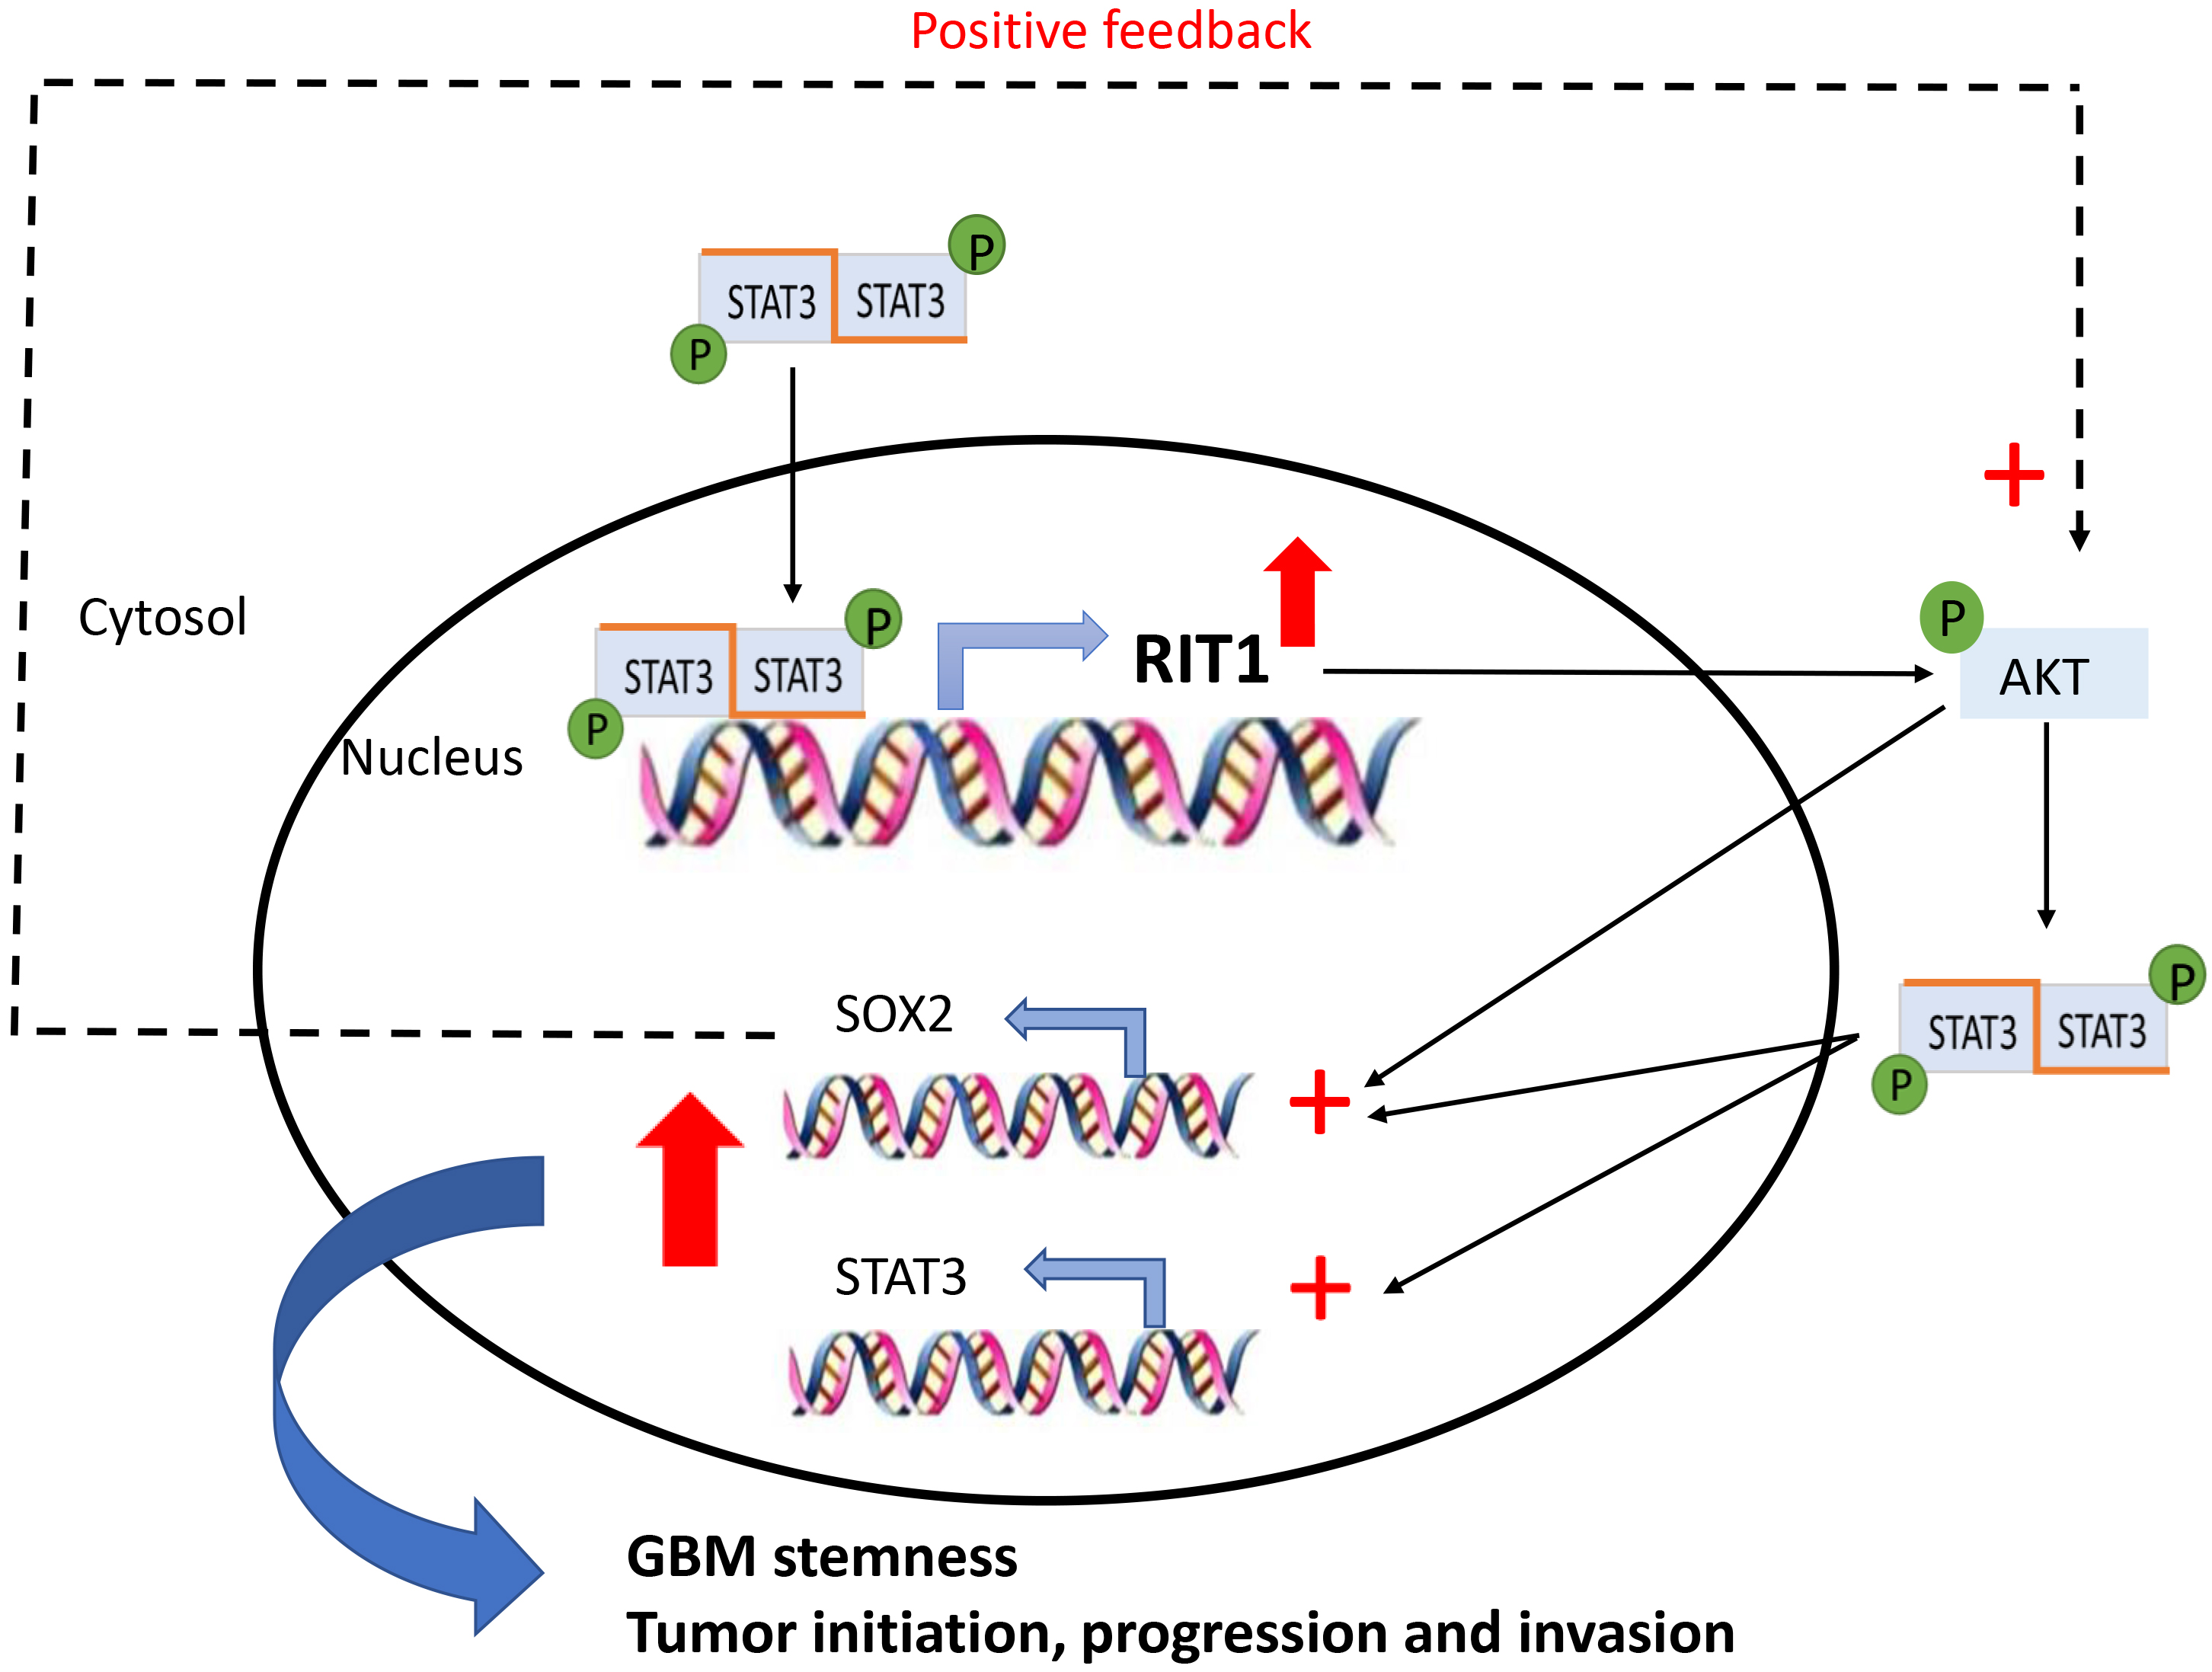
Global transcriptional profiles of different glioma types and grades are distinct from each other and from that of normal brain. Thus, we studied the expression of RIT1 from Shai.et.al dataset in varying pathologic types and grades of gliomas (low-grade astrocytomas (grade II), the anaplastic astrocytomas and oligodendrogliomas (grade III) and the malignant glioblastoma (grade IV)) as well as seven normal brain samples that were taken from the subcortical white matter [15]. The observed up-regulated pattern of RIT1 was progressive as we move from lowest grade to more malignant form of glioblastoma (Fig. 3A). These findings suggest that the up-regulation of RIT1 is possibly implicated in the development of premalignant precursors and in the progression of these lesions to malignant glioblastoma. Additionally, and in order to evaluate the possible prognostic value for RIT1 in different grades of glioblastoma, we performed Kaplan-Meier survival analysis according to the median mRNA expression of RIT1 in both GBM and LGG using the Gepia analysis tool. The results showed that high RIT1 mRNA expression (HR
Unrevealed mechanism of action that might underlie the upregulation of RIT1 in GBM
We sought to understand the molecular mechanism responsible for upregulating RIT1 expression in various glioblastoma stages. For this reason, we surveyed RIT1 alteration frequency of mutations and copy number alterations (CNAs) in all types of cancer using cBioportal database. Our analysis revealed only a minor contribution (0.6% of the cases) of such alterations in glioblastoma (Fig. 5A). We then opted to investigate the methylation status of the promoter region of RIT1 gene using TCGA Wanderer, an interactive web viewer for the visualization of DNA methylation based on TCGA data. The results showed no significant change in the methylation pattern of RIT1 promoter between glioblastoma and normal brain tissues which highlight the need for understanding the mechanism(s) that underlie the observed upregulated pattern of RIT1 in glioblastoma (Fig. 5B).
STAT3: A potential transcriptional regulator for RIT1 in glioblastoma
We used the INSECT2.0 software to assess the potential transcriptional regulation of RIT1 by STAT3 a well-established oncogenic driver of GBM. Based on TRANSFAC and JASPAR databases, we searched for potential binding sites over the upstream 2000 bp promoter and 1000 bp downstream regions (relative to the transcription start site) on the RIT1 human gene and its ortholog in mice. We set the position weight matrix (PWM) at
Discussion
The present study aimed at investigating the expression and the prognostic value of RIT1 in glioblastoma using integrated large databases. Previous in-silico and experimental studies on RIT1 have documented its role in numerous cancer types and in the neurogenesis process, yet its expression and prognostic value in GBM was not assessed. We found that RIT1 mRNA expression level in GBM tissues was significantly higher than that in non-tumor tissues (
By analyzing transcriptomic data, we demonstrated for the first time a significant upregulated expression of RIT1 in glioma that scored among the top upregulated genes in various GBM cohorts. The mechanism responsible for deregulating RIT1 expression in GBM is still poorly understood. Previous studies have shown that gains in chromosome 1, particularly in the region of 1q21-25, is the most frequent finding (29%) among childhood high grade gliomas. This was also accentuated with the finding of a significant association between gains in 1q and decreased survival among these patients. Consequently, in the later study the authors proposed the need for identifying one or more candidate genes specifically on that region to be the key for detecting pathways involved in the biology of these tumors [21]. It is noteworthy to mention that RIT1 maps to 1q22 suggesting that the upregulated expression of this gene in both LGG and GBM might be simply a surrogate of the copy number gain of chromosome 1q. Forthcoming work is warranted to validate the expression of the RIT1 subfamily in LLG and GBM using orthogonal measures (e.g., immunohistochemistry). Other potential mechanisms that could be responsible for RIT1 overexpression are promoter/enhancer activation by highly expressed TFs, or downregulation of miRNAs that normally inhibit RIT1 expression.
The frequency of genetic alterations (mutations, CNVs, deletions… etc.) in RIT1 within GBM was not high enough (
Lastly, our promoter analysis revealed a couple of binding sites that could be implicated in regulating transcription of RIT1. Amongst these transcriptional factors is STAT3, a member of the STAT family of transcription factors, known to drive several pro-oncogenic mechanisms that promote cell proliferation, survival, immune suppression, invasion, and angiogenesis in GBM [26]. The consecutive activation of STAT3 resulting from either gain-of-function mutations or overexpression of upstream growth factor receptors is detected in 90% of human GBM tumors and GBM cell lines [27]. Moreover, the hypomethylated pattern of STAT3 in the acquired recurrent glioma-CpG island methylator phenotype (G-CIMP) is characterized with an unfavorable overall survival [28]. Thus, by combining the detected activation of STAT3 with the potential transcriptional binding activity to RIT1 promoter, one could explain partially the upregulated pattern of RIT1 in glioblastoma. Ultimately, in-vitro studies are warranted to confirm RIT1 as a novel direct downstream target for STAT3.
In parallel, we could also hypothesize that RIT1 can modulate directly or indirectly STAT3 expression and/or transcriptional activity. This hypothesis is based on the fact that the primary identified target for RIT1-kinase function is the serine/threonine kinase (AKT) which is in turn a key stimulator for the transcriptional activity of both STAT3 and SOX2 [12]. SOX2, a member of the Sex-determining region Y (SRY)-box (SOX) factors, is considered as the most enriched gene among the stemness signature in GBM stem cells (GSCs) [29]. This transcriptional factor is overexpressed in malignant glioma from several different and independent cohorts while displaying minimal expression in normal tissues [30]. Additionally, in-vitro and in-vivo studies confirmed that RIT1 activation can enhance hippocampal neural progenitor cells proliferation through activating SOX2 transcriptional activity in an Akt-dependent manner [12]. Thus, RIT1 aberrant expression and its positive correlation with SOX2 pinpoint the critical role of RIT1 in maintaining the self-renewing properties of GBM stem cells. Taken into consideration that SOX2 was recently acknowledged to regulate p-AKT and p-STAT3 in GBM, we could come up with a scenario of three main players RIT1, STAT3, and SOX2 that can commit a positive feedback loop in favor for GBM tumorigenesis (Fig. 8).
Conclusion
This study presented for the first time RIT1 as a potential oncogene in glioblastoma and opened the door for further investigation on its possible use as a therapeutic target and/or a molecular biomarker. The RAS superfamily of GTPases to which RIT1 belongs has created an evolution in the field of cancer. Members of this family are among the most studied oncogenes and are used in the molecular classification of various tumors. Adding RIT1 to this list, doesn’t only expand our knowledge in brain tumoregenesis, but would have a major impact on the health system if targeted by specific inhibitors to successfully cure glioblastoma and/or other genetic diseases where it’s overexpressed like in Noonan syndrome.
Footnotes
Supplementary data
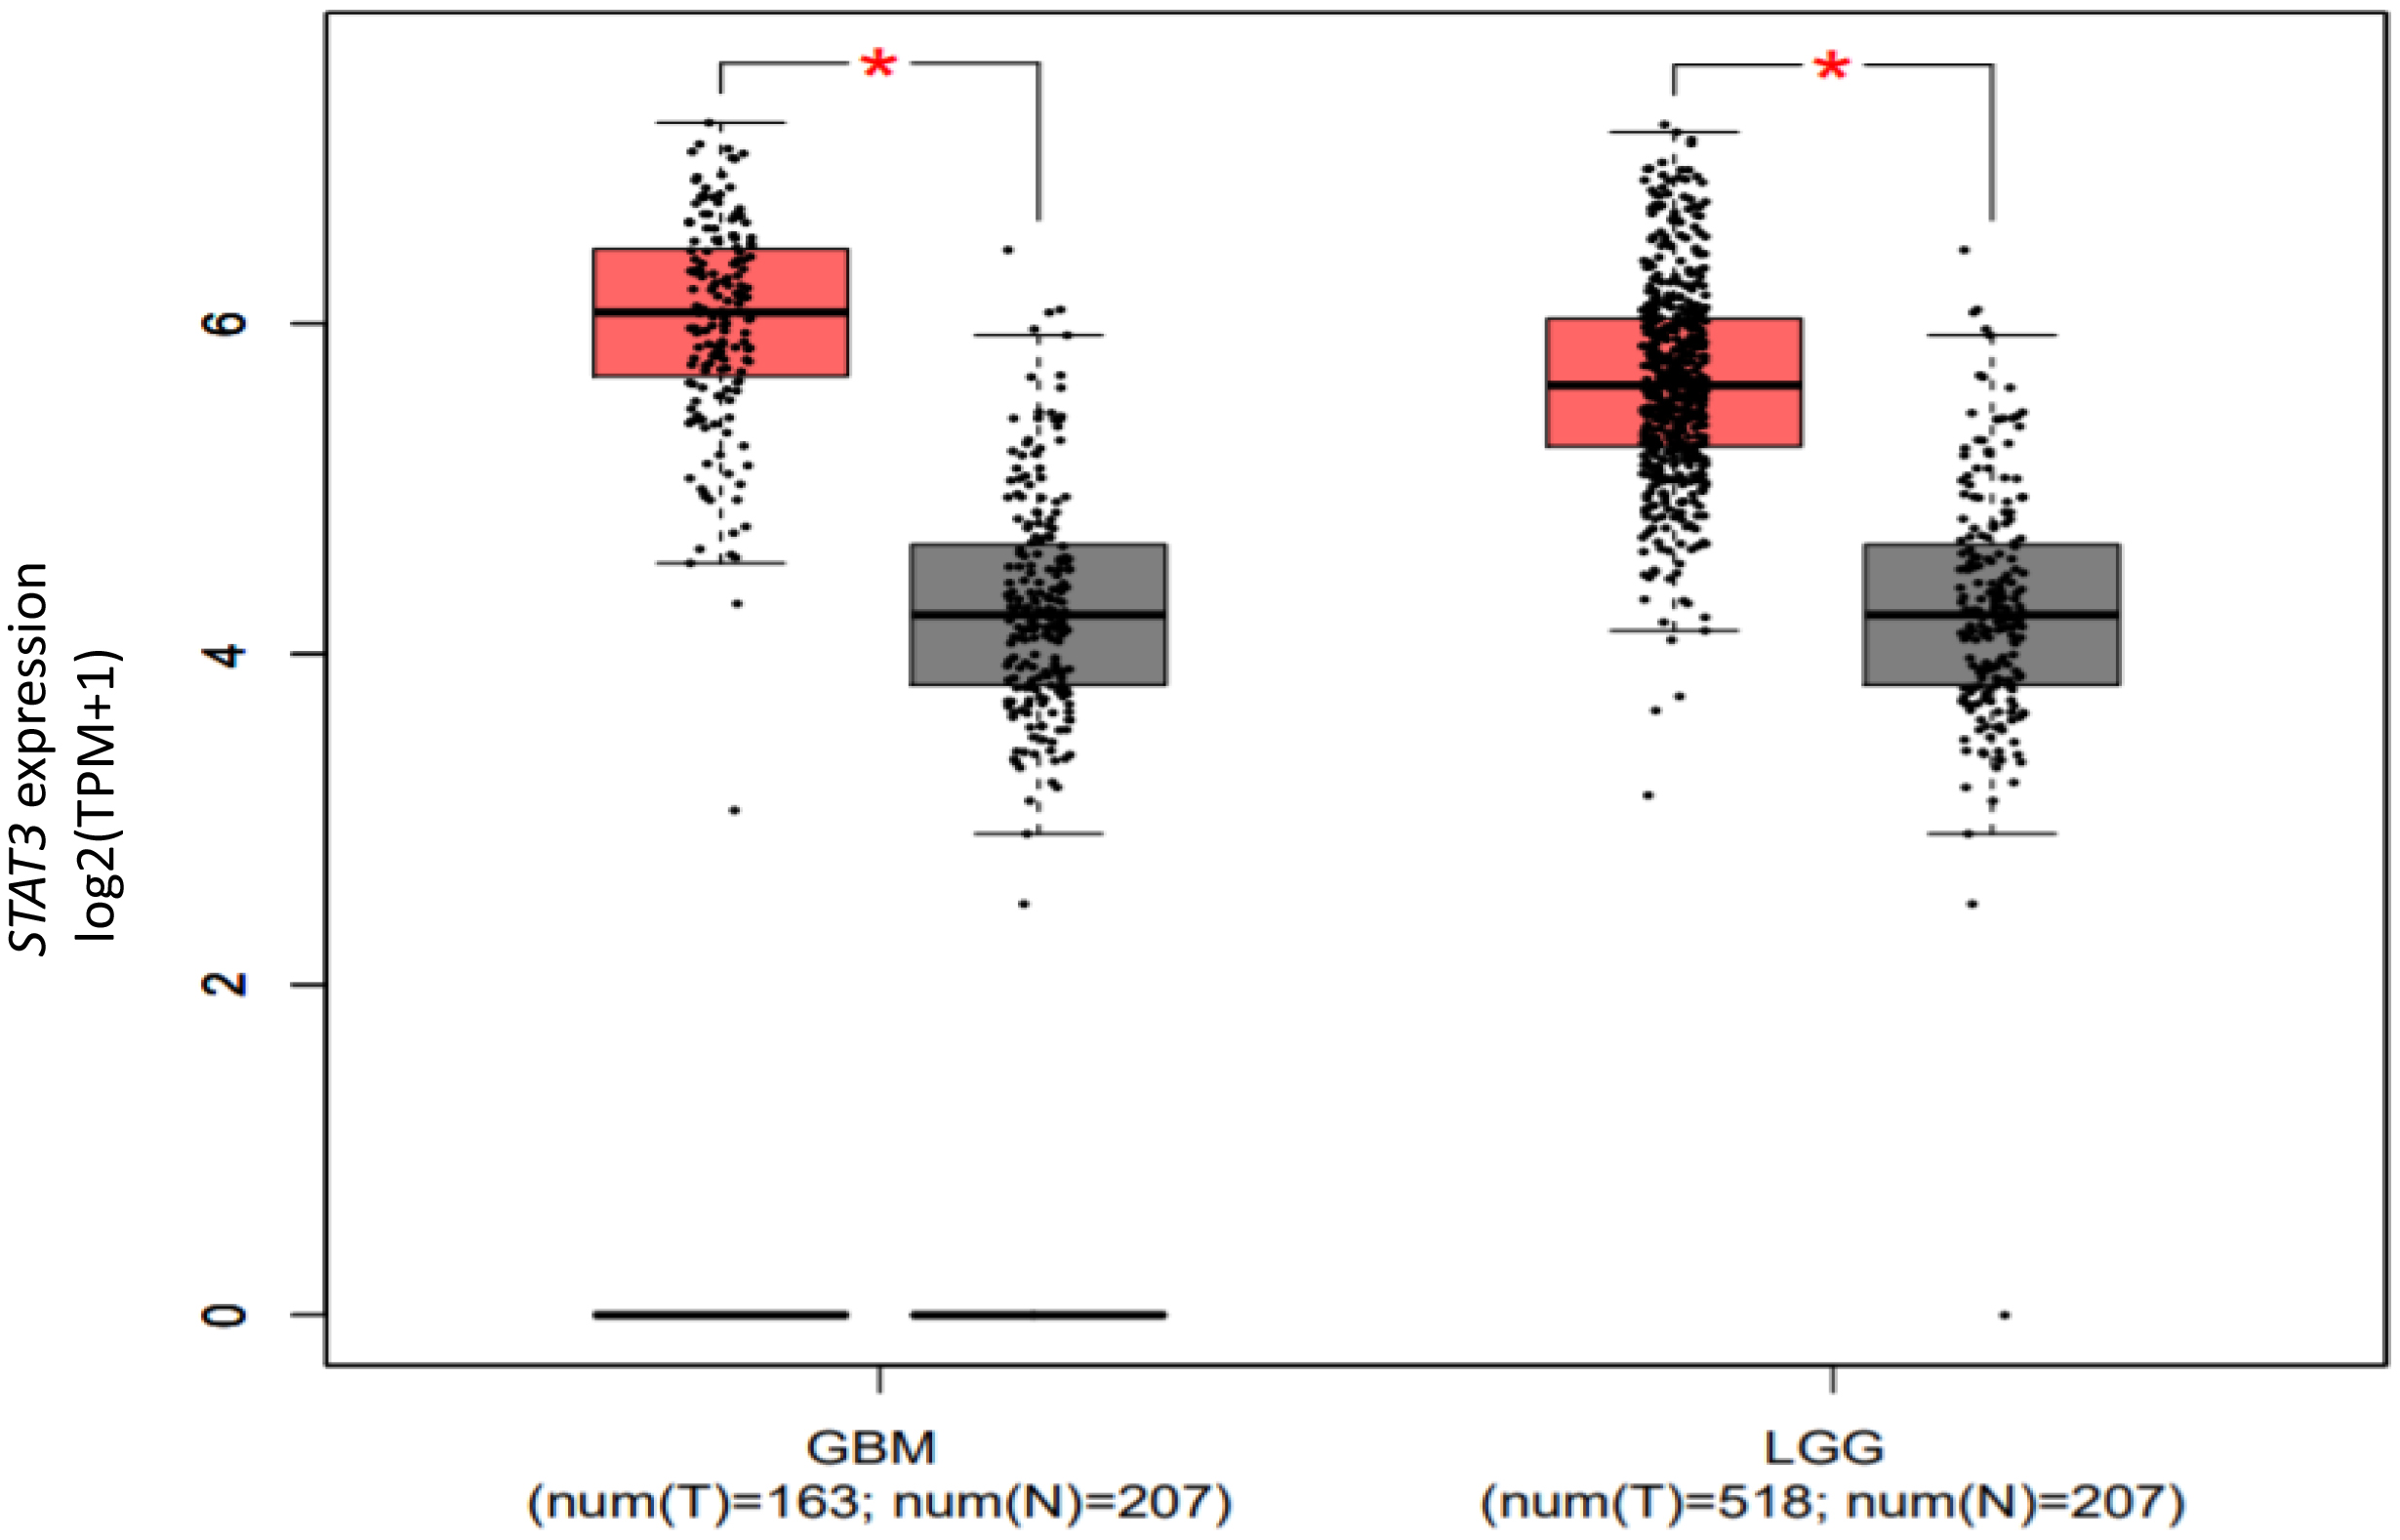
Expression level of STAT3 in LGG and GBM versus matching normal TCGA tissues and Gtex data presented as log2 (TPM