
Abstract
BACKGROUND:
Colorectal cancer (CRC) is one of the leading causes of cancer-related deaths and mining the molecular factors underlying CRC pathogenesis is imperative for alleviating the disease burden.
OBJECTIVE:
To highlight key molecular pathways, prioritize hub genes and their regulators related to CRC.
METHODS:
Data sets of TCGA-COAD and GTEx were used to identify differentially expressed genes (DEGs) and their functional enrichments in pathways and biological processes were analyzed using bioinformatics tools. Protein-protein interaction network was constructed and hub genes were identified using Cytoscape. Ingenuity Pathway Analysis was used to analyze the relations of the hub genes with diseases and canonical pathways. Key regulators targeting the hub genes such as TFs, miRNAs and their interactions were identified using in silico tools.
RESULTS:
AURKA, CDK1, MYC, CDH1, CCNB1, CDC20, UBE2C, PLK1, KIF11, and CCNA2 were prioritized as hub genes based on their topological properties. Enrichment analyses emphasized the roles of DEGs and hub genes in the cell cycle process. Interactions of the hub genes with TFs and miRNAs suggested TP53, EZH2 and KLF4 as being promising candidate biomarkers for CRC.
CONCLUSIONS:
Our results provide in silico evidence for candidate biomolecules that may have strong biomarker potential for CRC-related translational strategies.
Keywords
Introduction
Colorectal cancer (CRC) is one of the most common devastating cancer that leads to high mortality and morbidity in both women and men worldwide [1, 2]. However, the incidence of CRC was found to continue rising in developed countries especially in Europe along with the decline in mortality rates [3]. CRC is a complex heterogeneous disease and genetic, epigenetic and environmental risk factors such as diet, body fat distribution, and microbiome composition are known to contribute to the disease pathogenesis [4, 5, 6]. Continuing efforts to understand the genetic epidemiology of CRC have been successfully revealed several loci associated with the disease risk, yet early molecular diagnosis and accurate assessment of prognosis of CRC are still challenging [7, 8, 9]. Thus, in recent years, researchers have begun to investigate the missing heritability underlying the etiology of CRC by exploring the possible contributions of molecular regulators of the gene expression such as microRNAs (miRNAs) and transcription factors (TFs).
The figure depicts the workflow of the study and used bioinformatics tools.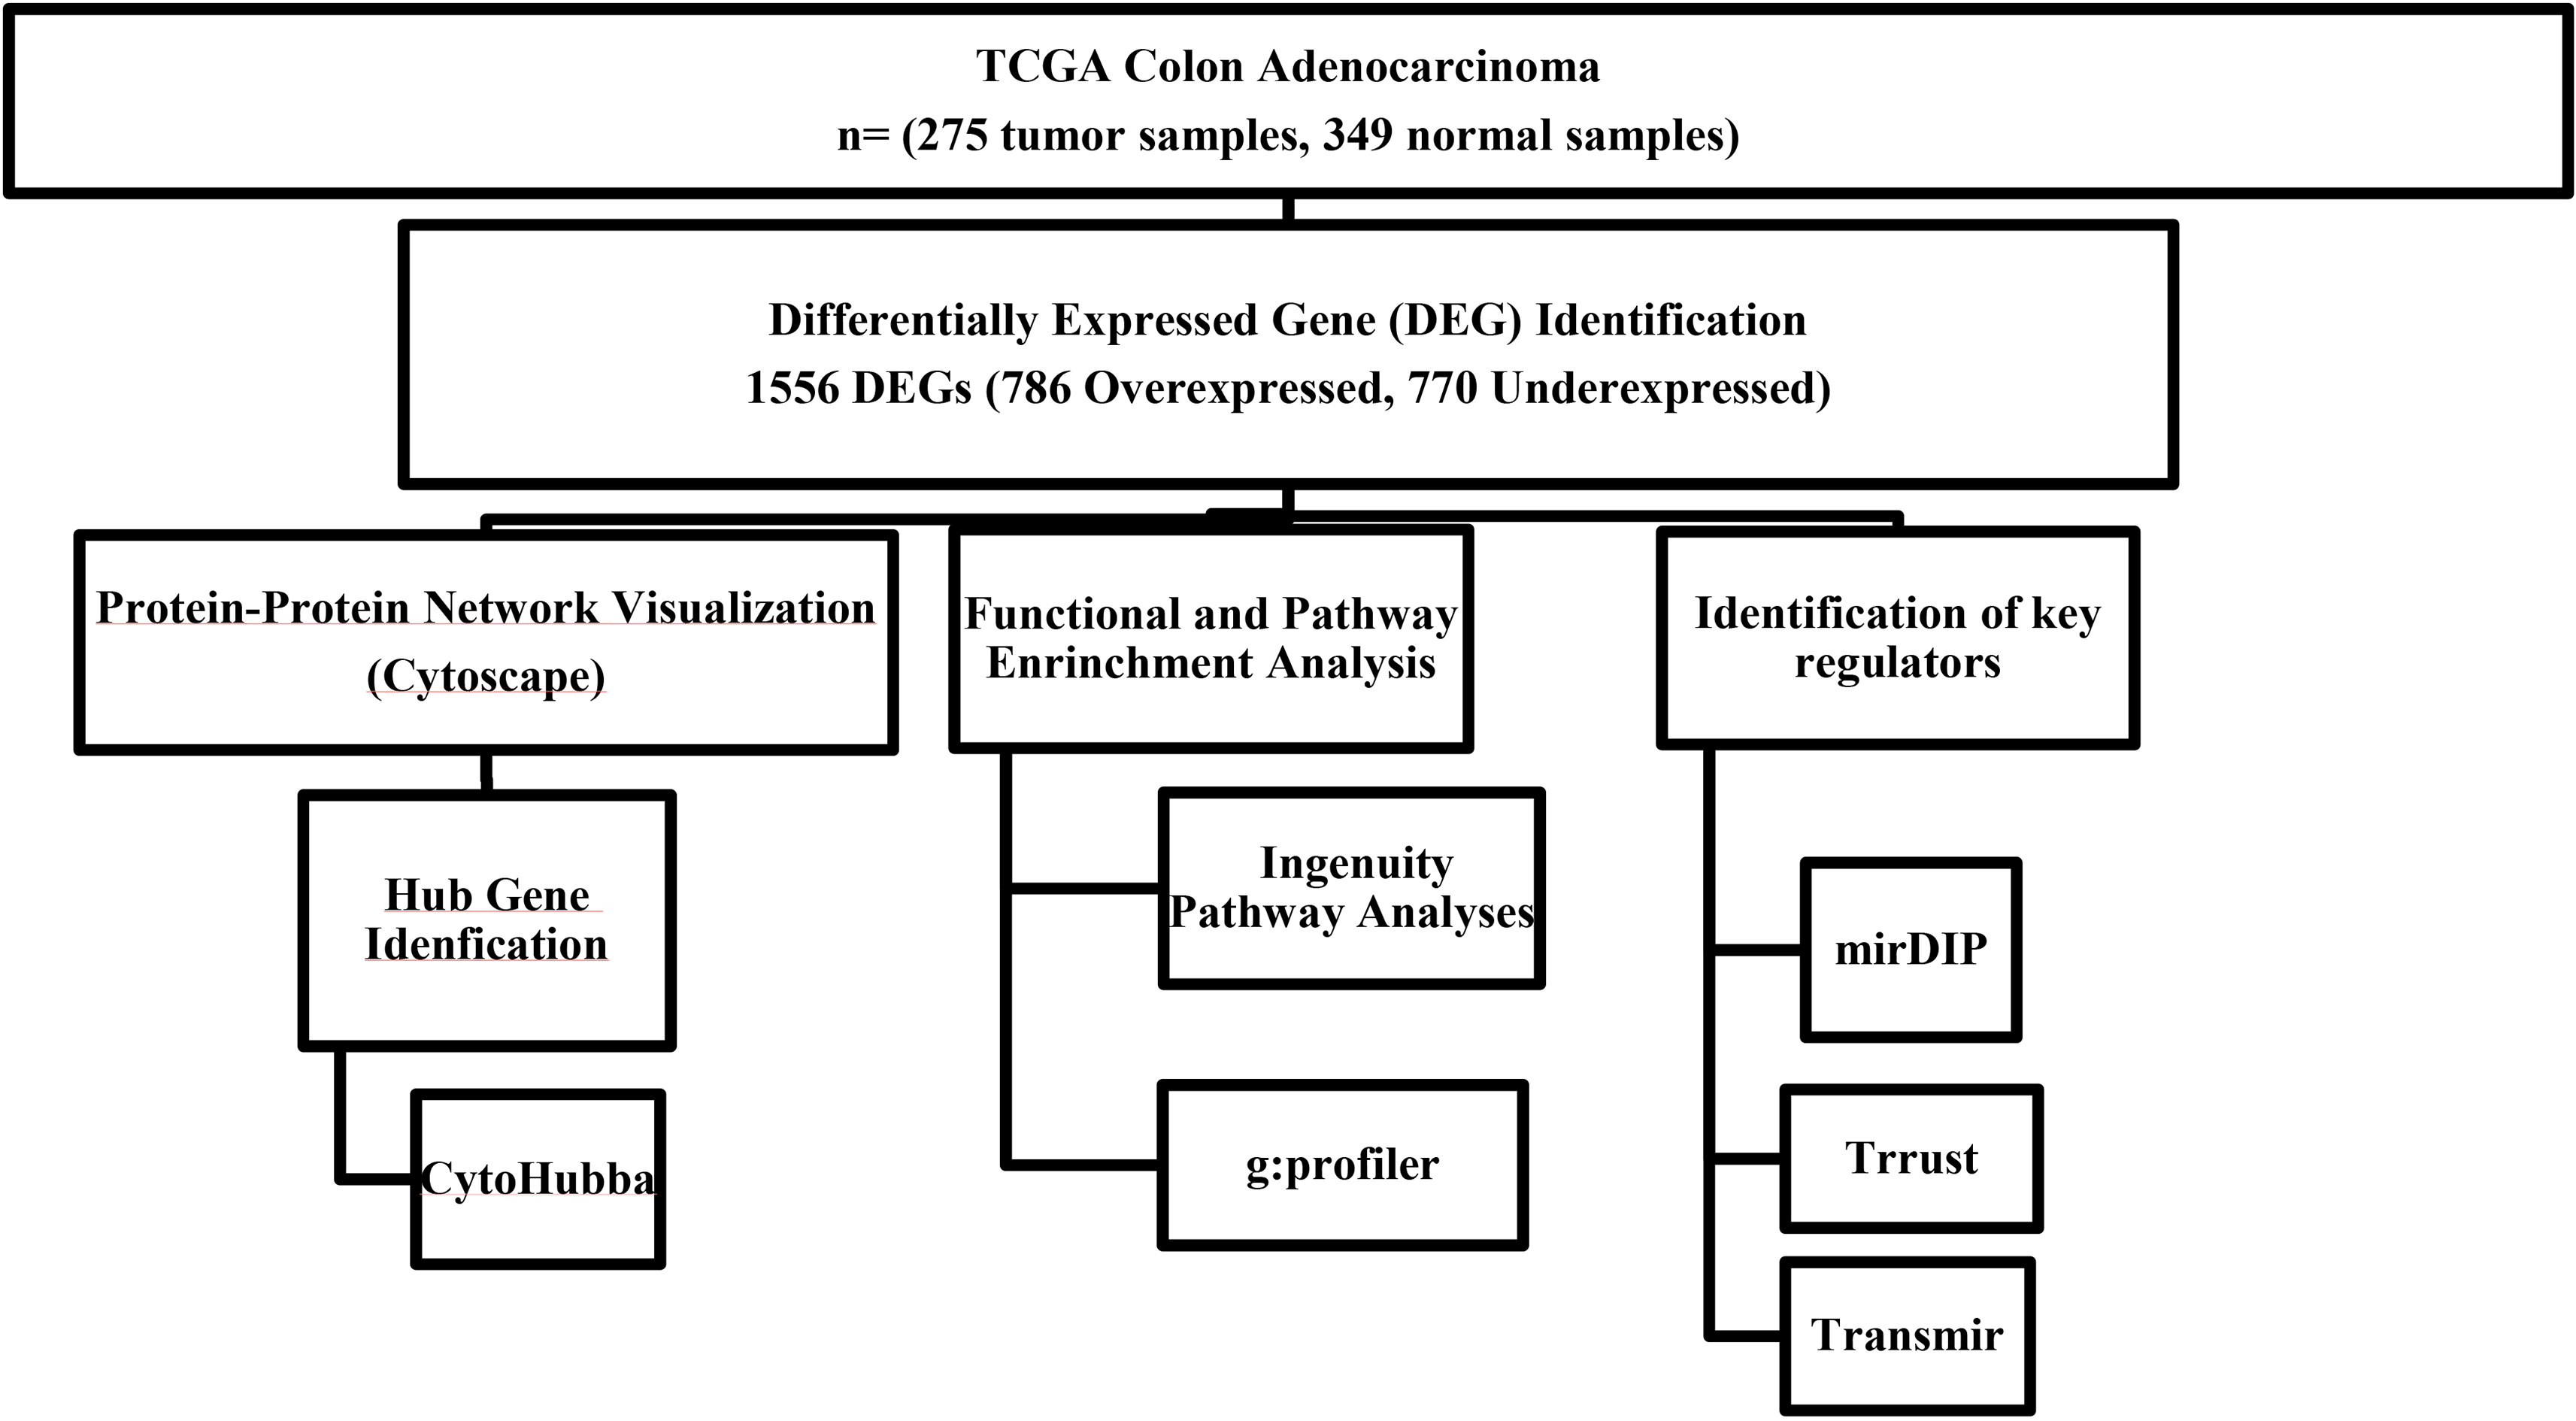
Dysregulation of the genes involved in the critical pathways in colorectal carcinogenesis is known to be associated with CRC. Hence, it is highly imperative to unveil the key mediators and their molecular function influencing the expressions of the genes dysregulated in CRC. Recently, miRNAs were proposed to have functional importance in carcinogenesis and also accumulating evidence indicates their utilization as a diagnostic and prognostic biomarker for CRC [10, 11, 12]. Also, dysregulated expression of some TFs was shown to be a major impact on colorectal tumor growth, CRC-associated oncogenic process as well as CRC metastasis [13, 14, 15, 16, 17]. Nowadays, researchers shed light on the interactions of the miRNAs, TFs and their target genes and suggested to consider them as a network to fully uncover their roles in CRC pathogenesis [18, 19].
Our study was designed as an “in silico” approach to generating novel knowledge related the missing genetic determinants and key regulators of the CRC as well as pinpoint candidate critical molecular pathways which may be targeted for therapeutic approaches and utilized for CRC management.
Data sets and differential gene expression analyses
The data sets analyzed in this study include the RNA-Sequencing (RNA-Seq) expression data of 624 samples retrieved from the Cancer Genome Atlas (TCGA) and The Genotype-Tissue Expression (GTEx) projects. Of 624 samples, 275 were tumor samples belong to the individuals with colon adenocarcinoma (COAD) in TCGA data sets and 349 were normal samples. Genes with a log2FC
Protein-protein interaction network construction and topological analysis
All DEGs were submitted to the STRING database to construct protein-protein interaction (PPI) network [20]. The network was imported to Cytoscape software for visualization. Cytohubba plugin was used to analyze the topological properties of the network and DEGs having the top scores in the degree ranking were defined as “hub genes” [22, 23].
Topological properties of the hub genes identified by Cytohubba
Topological properties of the hub genes identified by Cytohubba
Functional gene set enrichment analyses for DEGs were performed using the g:profiler web tool (
Identification of putative key regulators
TRRUST v.2 database was used to identify the key TFs interacted with hub genes [25] and significant TFs are predicted to be most likely involved in the colon cancer pathogenesis. We also identified the predicted miRNAs targeting the hub genes by using the microRNA Data Integration Portal (mirDIP) v4.1 database which integrates prediction scores from 30 distinct sources [26]. The miRDIP allows us to submit all hub genes as input and groups the miRNAs that have shared targets in the input list.
Assessment of TF-miRNA regulations and functional over-representation (enrichment) analyses of the miRNAs by their regulating TF were performed using the TransmiR v2.0 database [27]. TransmiR database retrieves data from literature-curated sources and extracts TF binding motifs from the UCSC genome browser as well as incorporates the experimental data from Chip-seq studies, transcriptome studies. Over-representation analysis in TransmiR was conducted by the hypergeometric test using the most stringent level (2) and
Results
Identification of significant differentially expressed genes
Analyzing the RNA-seq data including tumor samples with colorectal adenocarcinoma and normal tissues in GEPIA revealed a total of 1556 SDEGs (log2FC
Protein-protein interaction and hub gene identification
Protein-protein interactions of all DEGs were analyzed in the STRING database and data was used for network construction in the Cytoscape. Topological properties were analyzed by Cytohubba in Cytoscape and the top 10 genes (AURKA, CDK1, MYC, CDH1, CCNB1, CDC20, UBE2C, PLK1, KIF11, CCNA2) with the highest nodes’ scores in the topological analyses considering degree ranking were defined as significant nodes and hub genes (Table 1).
Functional and pathway analyses of the SDEGs and hub genes
Gene set enrichment analyses of the DEGs showed dysregulated genes play role in several molecular pathways of which cell cycle was the most significant molecular pathway (KEGG term: hsa04110) and cell division was the top GO term related biological process (Tables 2 and 3). Functional analyses of the hub genes in the IPA filtering the results by disease categories and functions revealed evidence of significant associations of hub genes with 9 disease categories related to different cancer types (8.76E-10
The top 10 significant KEGG pathways identified by enrichment analyses of DEGs
The top 10 significant KEGG pathways identified by enrichment analyses of DEGs
The top 10 significant GO Biological process terms identified by enrichment analyses of DEGs
The network displaying the 10 top hub genes and their relationships with the top significant disease and biological functions (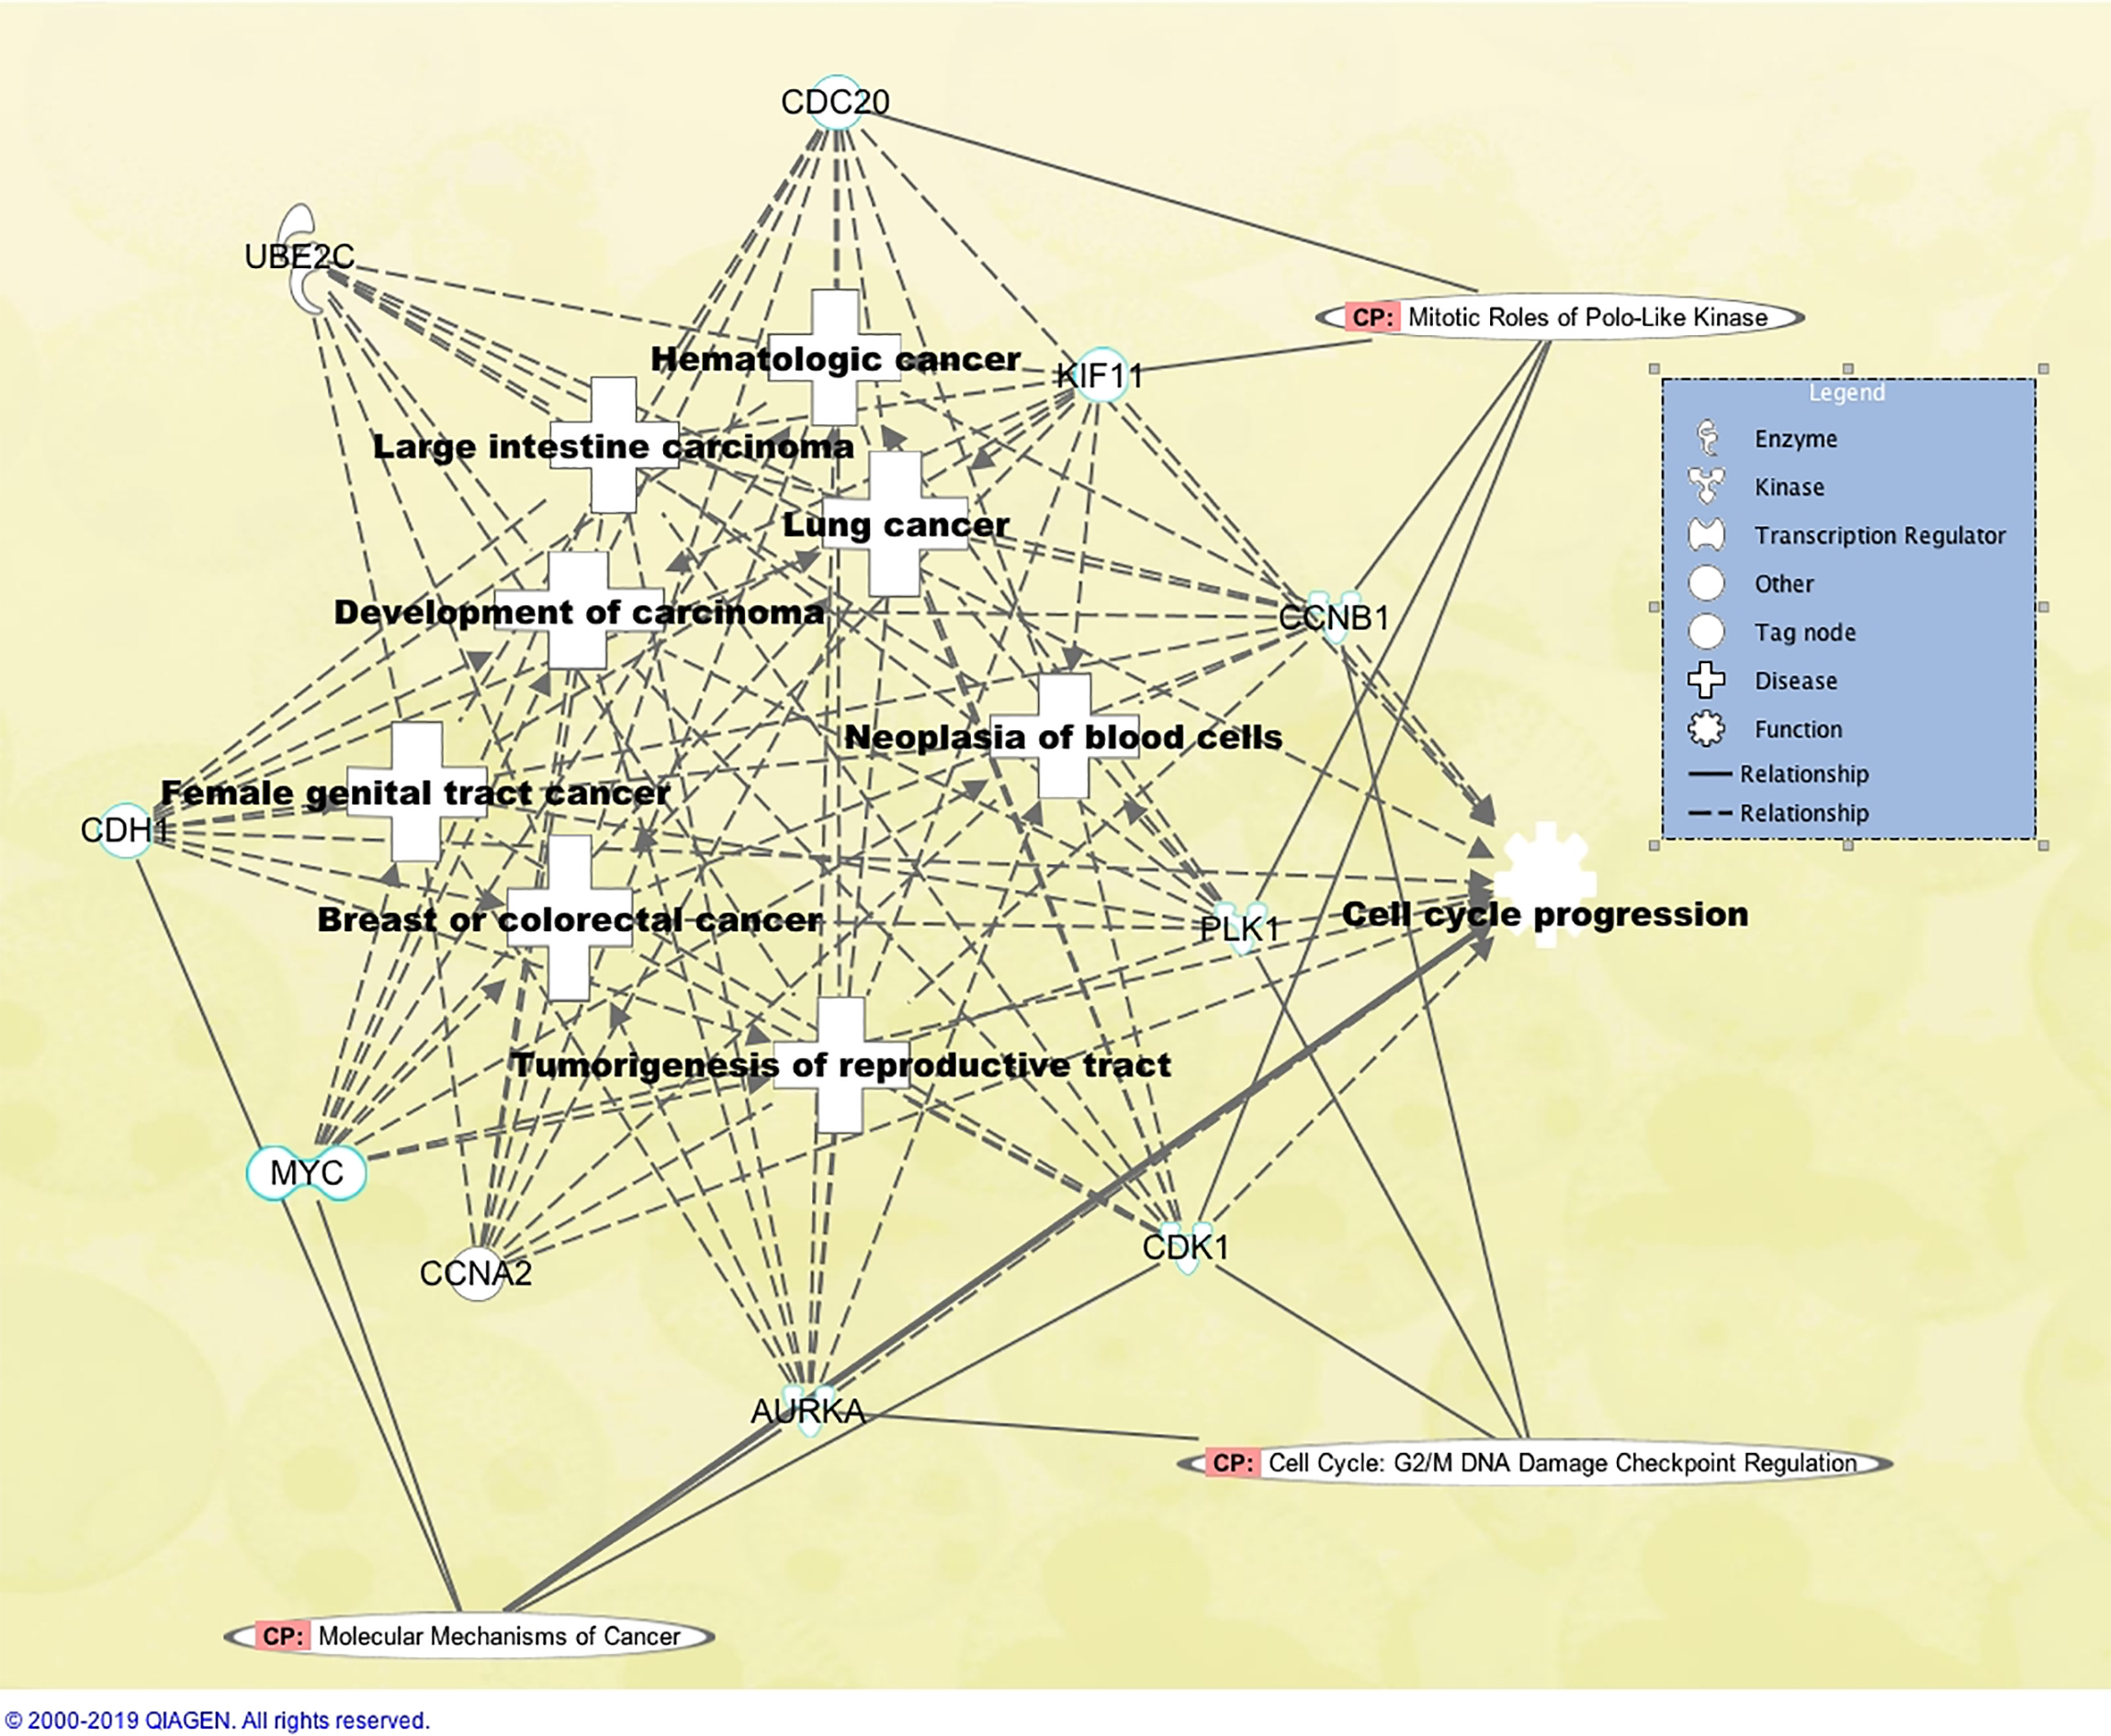
We also analyzed the enrichments of hub genes in the canonical pathways by using IPA and found pathways enriched with the hub genes. “Mitotic Roles of Polo-like Kinase” pathway was the top enriched pathway and 5 hub genes (CDC20, KIF11, CCNB1, PLK1, CDK1) showed evidence to be associated with this pathway. Figure 2 also displays the canonical pathways enriched with at least 4 hub genes identified in this study.
Predicted shared miRNAs targeting the hub genes (
Transcription factors identified in the enrichment analyses of the hub genes using TRRUST
Enrichment analyses of the miRNAs regulated by transcription factors
A total of 266 miRNAs targeting at least two hub genes were identified by setting the score class as “high” in the mirDIP tool (Supplementary Table 1). Of these miRNAs, 38 miRNAs were found to target at least 4 of the hub genes and predicted to be the common key regulators of the hub genes by strong evidence, thus they were retrieved and included in further downstream analyses. The mirDIP analyses reveal miRNAs targeting the gene as a group and we did not find any miRNA having interactions with more than 5 hub genes (Table 4).
Identification of key transcription factors
Enrichment analyses aiming to reveal the TF-hub genes interactions suggested 31 TFs including the E2F3, E2F1 and TP53 as the top TFs that were likely to involve in the transcriptional regulations of the hub genes and may contribute to the CRC development (Table 5). We also examined the miRNA-TF interactions by TransmiR database and enrichment analyses of the 38 miRNAs showed 25 TFs were possibly affecting the regulation of the miRNAs (Table 6). The KLF4, EZH2, and TP53 were the common TFs identified in both enrichment analyses and proposed to be the key transcription factors involving in CRC pathogenesis (Fig. 3).
Venn diagram depicts the identified candidate key TFs interacting with hub genes and miRNAs targeting the hub genes.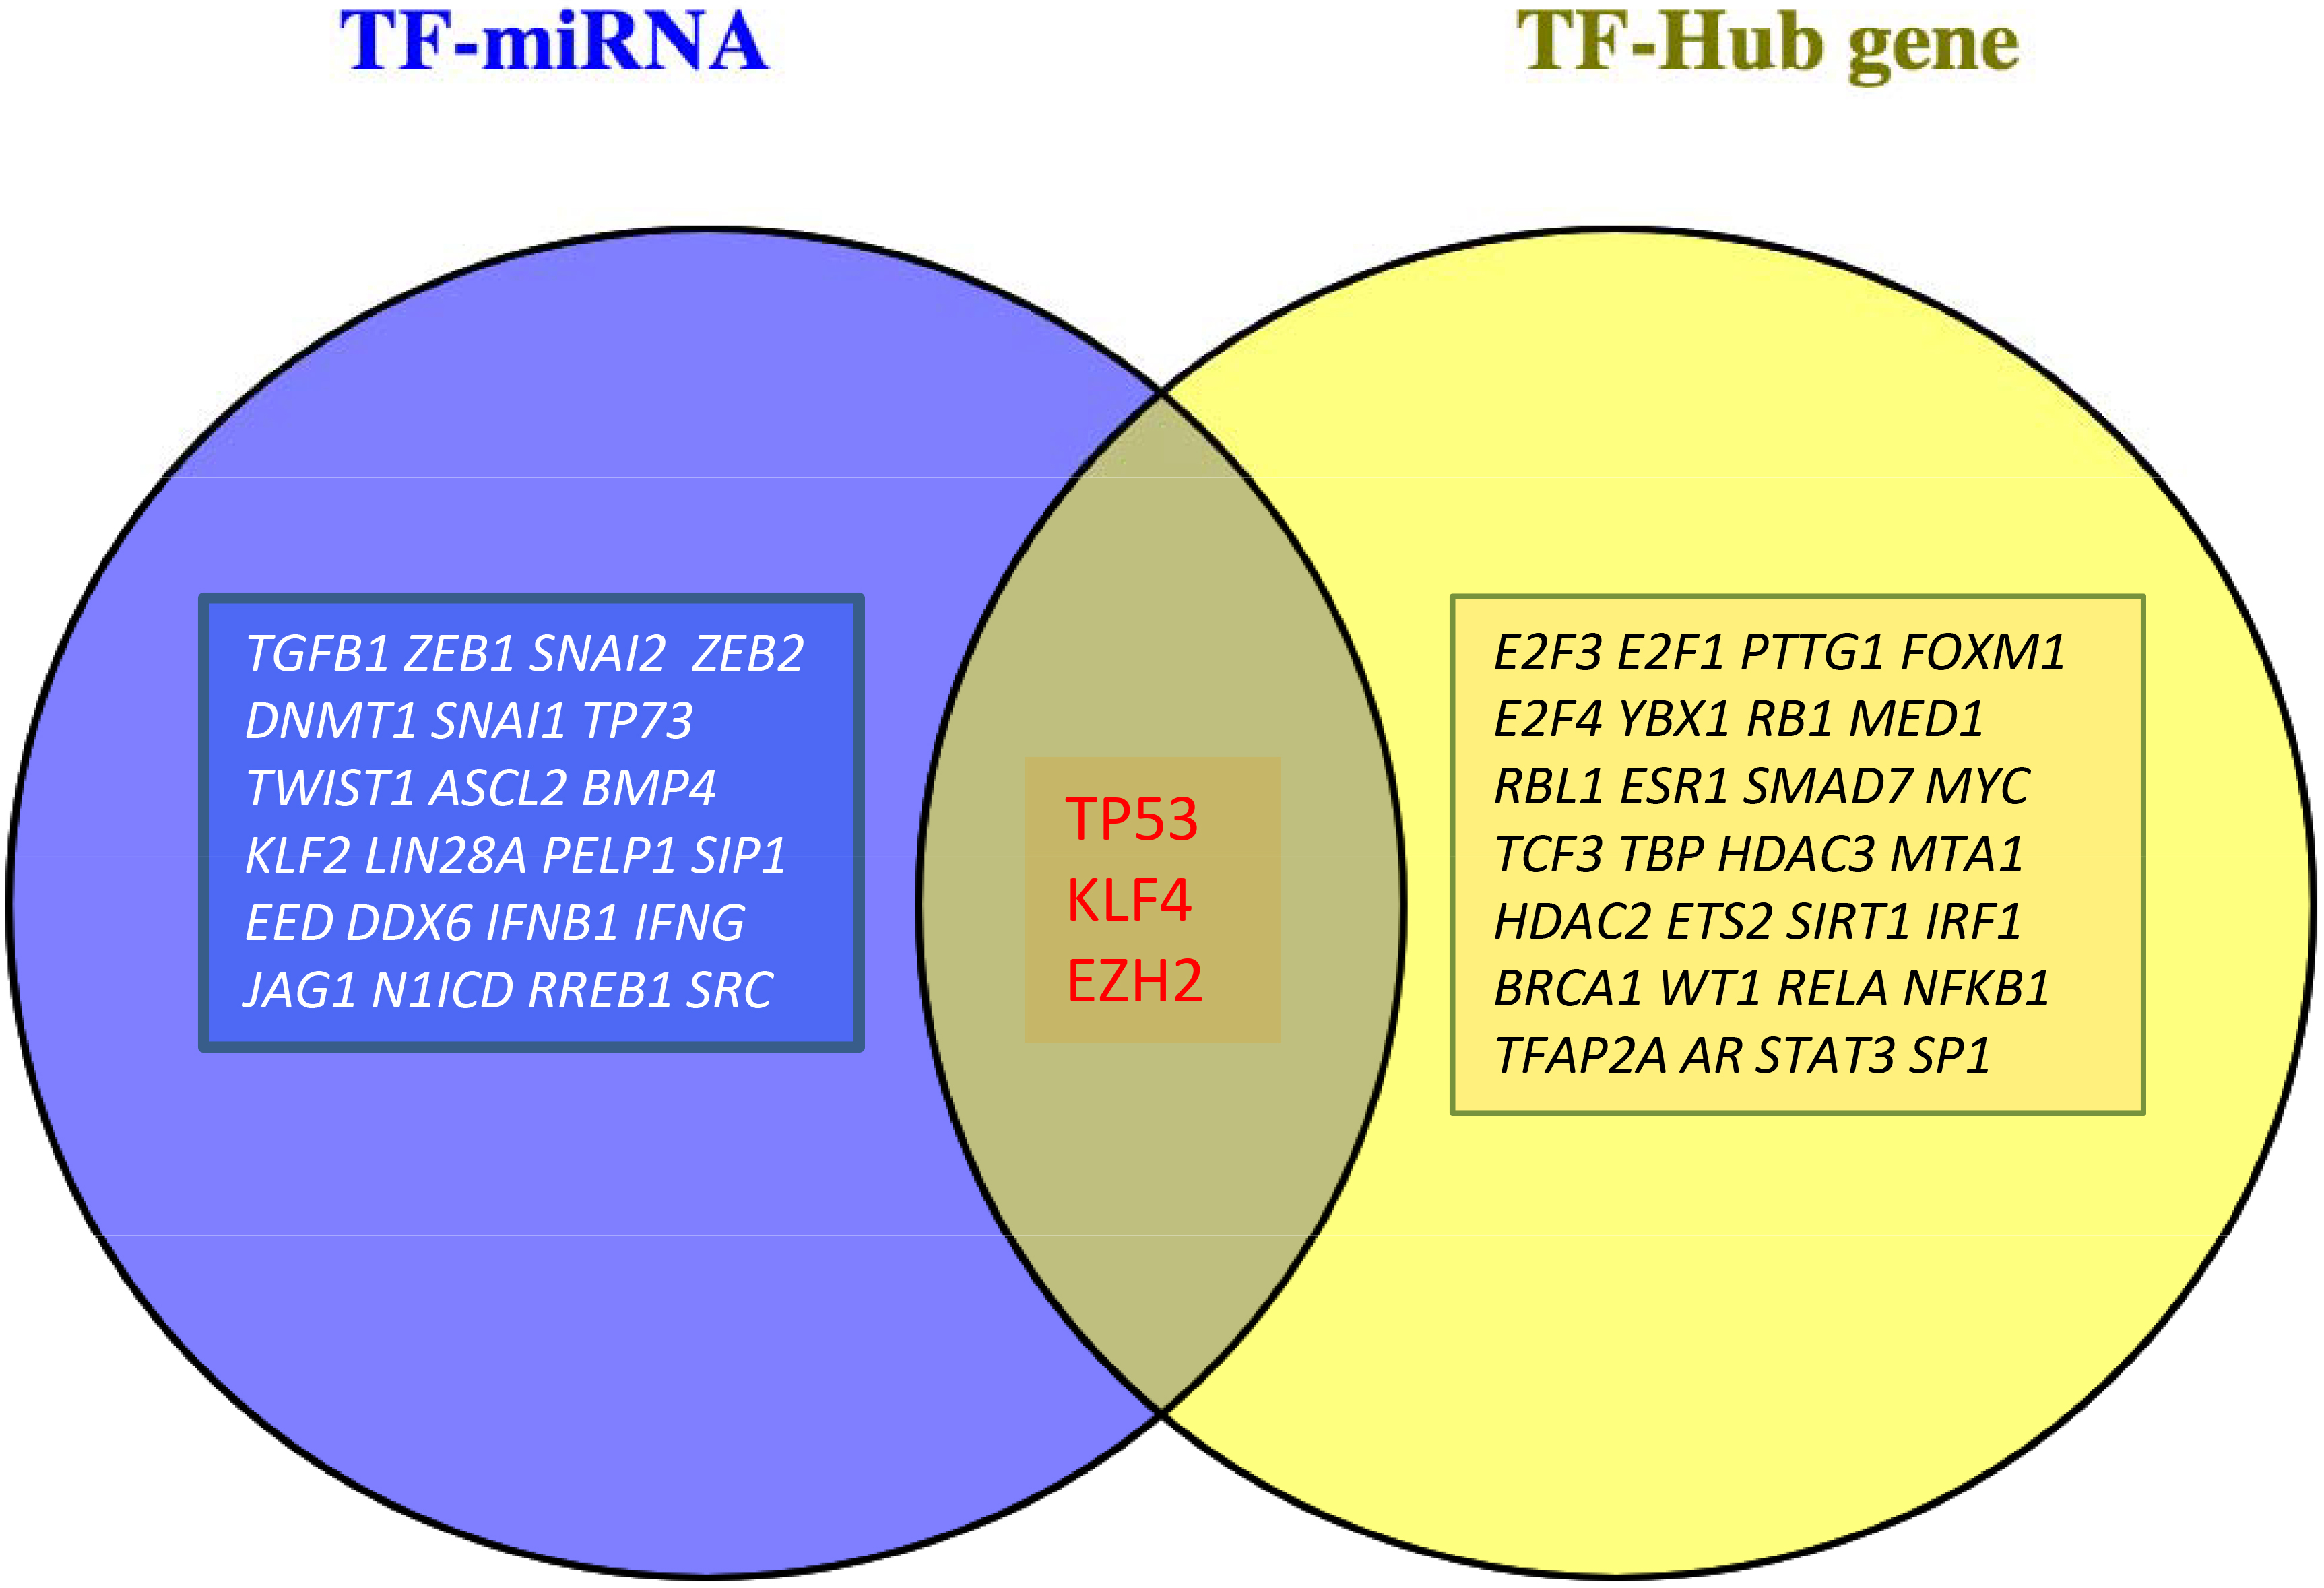
The etiology of colorectal cancer is still not fully understood for efficiently predicting disease development and designing tailored treatment options. Genetic risk factors are known to be associated with disease pathogenesis, prognosis and survival however there is a lack of knowledge regarding the CRC genetics and this needs to be comprehensively elucidated.
In this work, we used the transcriptomic data of TCGA-COAD samples and GTEx normal samples in an attempt to comprehensively investigate the key molecular pathways and mediators related CRC.
We initially identified the 1556 DEGs and constructed the PPI network by STRING to compute their topological properties and define the hub genes in the network. Ten overexpressed genes (AURKA, CDK1, MYC, CDH1, CCNB1, CDC20, UBE2C, PLK1, KIF11, CCNA2) were prioritized as hub (essential) genes based on the degree centrality in Cytohubba analysis. The degree centrality measure for a protein suggests its interaction level with other proteins in the network and the largest degree pinpoints the most connected and essential protein in the network [28]. Thus, these hub genes are likely to be facilitated in therapeutic approaches for CRC.
Functional enrichment of the DEGs in KEGG pathways and GO biological process highlight their role in the cell cycle and cell division. The IPA results were in concordance with these results and indicate the significant associations of hub genes with cell cycle progression. Moreover, the 5 of the hub genes including the 3 important genes (CDK1, CCNB1, PLK1) of kinase gene family were found to be involved in “Mitotic roles of Polo-like kinase” pathway (Fig. 2). Mitotic kinases are known to have critical functions for proper cell division. Specifically, PLK1 was shown to be a key regulator of mitotic cell division and have tumor suppressor properties by influencing the tumor formation [29, 30]. In recent years, upregulation of PLK1 was reported to be associated with many cancers including colon cancer, thus therapeutic approaches using anti-PLK1 have been exciting research topics for cancer researchers [31, 32]. Furthermore, CDK1 and CCNB1 were also primary cell cycle regulators and overexpressions of these genes were previously shown to contribute to the CRC pathogenesis [33, 34, 35].
In addition to examining the pathways associated with CRC, we mined the key transcriptional and post-transcriptional regulators of the CRC development using in silico tools. MicroRNAs are key mediators of the gene regulation and miRNAs targeting the genes involving in the fundamental pathways were highly important for unraveling the miRNA-mediated post-transcriptional mechanisms in CRC pathogenesis.
Recent research also sheds light on the miRNA-TF-target gene interactions and TFs tuning both miRNAs and their target genes may be considered as key regulators of the particular network and promising target for translational research applications [10, 18, 19, 36]. Considering the TFs as crucial mediators of the regulation of the miRNA expressions, uncovering the TF-miRNA interactions may have a considerable impact on developing novel drug targets and biomarkers. Our analyses revealed 3 key TFs (TP53, EZH2, KLF4) that were predicted to affect the regulations of hub genes and also the miRNAs targeting these genes (Fig. 3). The abnormal function of the tumor suppressor TP53 has been associated with various types of cancers including colorectal cancer and cause poor prognosis [37]. The role of EZH2 in CRC was also shown in several studies and an increased level of EZH2 was suggested to affect CRC development [38, 39]. Our result highlighting the imperative role of KLF4 is consistent with the literature which accumulating research indicates KLF4 as a tumor suppressor gene for colorectal cancer and overexpression of KLF4 was suggested to be a used in novel therapeutic and prognostic applications to alleviate the burden of CRC [40, 41]. Of note, all of the three TFs were predicted to be the common regulators affect 4 miRNA (miR-200b, miR-200c, miR-145, miR-143) (Table 6) which were previously reported to be dysregulated in CRC [12, 42, 43, 44, 45].
The results of our study depend solely on in silico analyses thus creates some limitations. Identified hub genes and key regulators of the gene regulations need to be further confirmed by biological experiments to evaluate their roles in the utilization of novel translational applications. However, our results provide additional insight for the interplay between TFs-miRNAs that were likely to involve in CRC development. It is also worth mentioning that our findings are eminently in accord with previous experimental research which strengths the accuracy of our analyses and research methodology.
Our study suggests key genes in dysregulated pathways implicated in CRC and shows in silico evidence for candidate key components of the transcriptional and post-transcriptional regulatory network in CRC. The results of this study can further enhance the molecular etiology of the CRC as well as can be employed in future research for biomarker and drug development related CRC.
Footnotes
Acknowledgments
I would like to thank my graduate student Niyazi Kaya for his help provided during the manuscript formatting and submission process.
Conflict of interest
The authors declare that they have no competing interests.
Supplementary
Targeting miRNAs of the 10 hub genes identidied in mirDIP tool
miRNAs
AURKA
CCNA2
CCNB1
CDC20
CDH1
CDK1
KIF11
MYC
PLK1
UBE2C
Shared genes
hsa-miR-4282
6
hsa-miR-203a-3p
6
hsa-miR-140-5p
5
hsa-miR-3163
5
hsa-miR-548n
5
hsa-miR-103a-3p
5
hsa-miR-107
5
hsa-miR-24-3p
5
hsa-miR-186-5p
5
hsa-miR-300
5
hsa-miR-381-3p
5
hsa-miR-98-5p
5
hsa-miR-548c-3p
5
hsa-miR-145-5p
4
hsa-miR-548a-3p
4
hsa-miR-590-3p
4
hsa-miR-561-3p
4
hsa-miR-101-3p
4
hsa-miR-20b-5p
4
hsa-let-7d-5p
4
hsa-let-7f-5p
4
hsa-miR-129-5p
4
hsa-miR-1297
4
hsa-miR-199b-5p
4
hsa-miR-218-5p
4
hsa-miR-26b-5p
4
hsa-miR-448
4
hsa-miR-4500
4
hsa-miR-143-3p
4
hsa-miR-16-5p
4
hsa-miR-200b-3p
4
hsa-miR-200c-3p
4
hsa-miR-374b-5p
4
hsa-miR-429
4
hsa-miR-495-3p
4
hsa-miR-138-5p
4
hsa-miR-23b-3p
4
hsa-miR-296-3p
4
hsa-miR-34a-5p
3
hsa-miR-410-3p
3
hsa-miR-454-3p
3
hsa-miR-570-3p
3
hsa-miR-183-5p
3
hsa-miR-106a-5p
3
hsa-miR-106b-5p
3
hsa-miR-17-5p
3
hsa-miR-181a-5p
3
hsa-miR-181b-5p
3
hsa-miR-181c-5p
3
hsa-miR-3609
3
hsa-miR-519d-3p
3
hsa-miR-548ah-5p
3
hsa-miR-93-5p
3
hsa-miR-124-3p
3
hsa-let-7a-3p
3
Table 1, continued
Supplementary
miRNAs
AURKA
CCNA2
CCNB1
CDC20
CDH1
CDK1
KIF11
MYC
PLK1
UBE2C
Shared genes
hsa-let-7b-3p
3
hsa-let-7f-1-3p
3
hsa-miR-1323
3
hsa-miR-146a-5p
3
hsa-miR-146b-5p
3
hsa-miR-199a-5p
3
hsa-miR-19a-3p
3
hsa-miR-211-5p
3
hsa-miR-219a-5p
3
hsa-miR-320a
3
hsa-miR-374a-5p
3
hsa-miR-4782-3p
3
hsa-miR-5011-5p
3
hsa-miR-508-3p
3
hsa-miR-548o-3p
3
hsa-miR-5688
3
hsa-miR-641
3
hsa-miR-7-5p
3
hsa-miR-9-3p
3
hsa-let-7a-5p
3
hsa-let-7b-5p
3
hsa-let-7c-5p
3
hsa-let-7e-5p
3
hsa-let-7g-5p
3
hsa-let-7i-5p
3
hsa-miR-122-5p
3
hsa-miR-149-3p
3
hsa-miR-25-3p
3
hsa-miR-329-3p
3
hsa-miR-362-3p
3
hsa-miR-363-3p
3
hsa-miR-3941
3
hsa-miR-603
3
hsa-miR-1284
3
hsa-miR-195-5p
3
hsa-miR-22-5p
3
hsa-miR-23a-3p
3
hsa-miR-31-5p
3
hsa-miR-340-5p
3
hsa-miR-371a-5p
3
hsa-miR-424-5p
3
hsa-miR-497-5p
3
hsa-miR-130a-3p
2
hsa-miR-192-3p
2
hsa-miR-301a-3p
2
hsa-miR-548a-5p
2
hsa-miR-548ab
2
hsa-miR-548ak
2
hsa-miR-548am-5p
2
hsa-miR-548ap-5p
2
hsa-miR-548aq-5p
2
hsa-miR-548ar-5p
2
hsa-miR-548as-5p
2
hsa-miR-548au-5p
2
hsa-miR-548b-5p
2
hsa-miR-548c-5p
2
hsa-miR-548d-5p
2
hsa-miR-548h-5p
2
hsa-miR-548i
2
hsa-miR-548j-5p
2
Table 1, continued
Supplementary
miRNAs
AURKA
CCNA2
CCNB1
CDC20
CDH1
CDK1
KIF11
MYC
PLK1
UBE2C
Shared genes
hsa-miR-548o-5p
2
hsa-miR-548w
2
hsa-miR-548y
2
hsa-miR-559
2
hsa-miR-607
2
hsa-miR-149-5p
2
hsa-miR-199a-3p
2
hsa-miR-1301-3p
2
hsa-miR-139-5p
2
hsa-miR-142-5p
2
hsa-miR-144-3p
2
hsa-miR-181d-5p
2
hsa-miR-214-3p
2
hsa-miR-3121-3p
2
hsa-miR-4262
2
hsa-miR-496
2
hsa-miR-498
2
hsa-miR-520g-3p
2
hsa-miR-520h
2
hsa-miR-184
2
hsa-miR-4458
2
hsa-miR-4465
2
hsa-miR-1237-3p
2
hsa-miR-1283
2
hsa-miR-148a-3p
2
hsa-miR-148b-3p
2
hsa-miR-150-5p
2
hsa-miR-152-3p
2
hsa-miR-196a-5p
2
hsa-miR-196b-5p
2
hsa-miR-19b-3p
2
hsa-miR-204-5p
2
hsa-miR-208a-3p
2
hsa-miR-208b-3p
2
hsa-miR-2110
2
hsa-miR-22-3p
2
hsa-miR-3182
2
hsa-miR-320b
2
hsa-miR-320c
2
hsa-miR-34c-5p
2
hsa-miR-3660
2
hsa-miR-378a-5p
2
hsa-miR-449b-5p
2
hsa-miR-497-3p
2
hsa-miR-513a-3p
2
hsa-miR-520d-5p
2
hsa-miR-524-5p
2
hsa-miR-548ar-3p
2
hsa-miR-548d-3p
2
hsa-miR-548e-3p
2
hsa-miR-548f-3p
2
hsa-miR-548g-3p
2
hsa-miR-548p
2
hsa-miR-548x-3p
2
hsa-miR-568
2
hsa-miR-589-3p
2
hsa-miR-606
2
hsa-miR-890
2
hsa-miR-98-3p
2
hsa-miR-1226-5p
2
Table 1, continued
Supplementary
miRNAs
AURKA
CCNA2
CCNB1
CDC20
CDH1
CDK1
KIF11
MYC
PLK1
UBE2C
Shared genes
hsa-miR-129-2-3p
2
hsa-miR-132-3p
2
hsa-miR-1321
2
hsa-miR-135a-5p
2
hsa-miR-142-3p
2
hsa-miR-153-3p
2
hsa-miR-154-5p
2
hsa-miR-17-3p
2
hsa-miR-206
2
hsa-miR-212-3p
2
hsa-miR-26a-5p
2
hsa-miR-30a-3p
2
hsa-miR-30e-3p
2
hsa-miR-32-5p
2
hsa-miR-326
2
hsa-miR-330-5p
2
hsa-miR-4739
2
hsa-miR-484
2
hsa-miR-490-3p
2
hsa-miR-493-5p
2
hsa-miR-506-3p
2
hsa-miR-510-5p
2
hsa-miR-532-5p
2
hsa-miR-562
2
hsa-miR-574-5p
2
hsa-miR-581
2
hsa-miR-605-5p
2
hsa-miR-92a-3p
2
hsa-miR-92b-3p
2
hsa-miR-10a-5p
2
hsa-miR-10b-5p
2
hsa-miR-1224-3p
2
hsa-miR-1244
2
hsa-miR-1262
2
hsa-miR-1276
2
hsa-miR-1304-5p
2
hsa-miR-155-5p
2
hsa-miR-186-3p
2
hsa-miR-18a-5p
2
hsa-miR-18b-5p
2
hsa-miR-193b-5p
2
hsa-miR-195-3p
2
hsa-miR-205-5p
2
hsa-miR-20a-5p
2
hsa-miR-217
2
hsa-miR-222-3p
2
hsa-miR-224-5p
2
hsa-miR-298
2
hsa-miR-302a-3p
2
hsa-miR-302d-3p
2
hsa-miR-3170
2
hsa-miR-3180-5p
2
hsa-miR-32-3p
2
hsa-miR-330-3p
2
hsa-miR-331-5p
2
hsa-miR-335-5p
2
hsa-miR-337-3p
2
hsa-miR-361-5p
2
hsa-miR-369-3p
2
hsa-miR-372-3p
2
Table 1, continued
Supplementary
miRNAs
AURKA
CCNA2
CCNB1
CDC20
CDH1
CDK1
KIF11
MYC
PLK1
UBE2C
Shared genes
hsa-miR-373-3p
2
hsa-miR-374c-5p
2
hsa-miR-382-5p
2
hsa-miR-423-5p
2
hsa-miR-4289
2
hsa-miR-432-5p
2
hsa-miR-449a
2
hsa-miR-4760-3p
2
hsa-miR-4770
2
hsa-miR-485-5p
2
hsa-miR-489-3p
2
hsa-miR-491-5p
2
hsa-miR-494-3p
2
hsa-miR-5003-3p
2
hsa-miR-525-5p
2
hsa-miR-532-3p
2
hsa-miR-539-5p
2
hsa-miR-551b-5p
2
hsa-miR-5700
2
hsa-miR-576-5p
2
hsa-miR-577
2
hsa-miR-582-5p
2
hsa-miR-586
2
hsa-miR-599
2
hsa-miR-612
2
hsa-miR-655-3p
2
hsa-miR-769-5p
2
hsa-miR-9-5p
2
hsa-miR-936
2
hsa-miR-939-5p
2
hsa-miR-940
2