
Abstract
BACKGROUND:
Thyroid cancer is the most common endocrine malignancy worldwide, with the predominant form papillary thyroid carcinoma (PTC) representing approximately 80% of cases.
OBJECTIVE:
This study was addressed to identify potential genes and pathways involved in the pathogenesis of PTC and potential novel biomarkers for this disease.
METHODS:
Gene expression profiling was carried out by DNA microarray technology. Validation of microarray data by qRT-PCR, western blot, and enzyme linked immunosorbent assay was also performed in a selected set of genes and gene products, with the potential to be used as diagnostic or prognostic biomarkers, such as those associated with cell adhesion, extracellular matrix (ECM) remodeling and immune/inflammatory response.
RESULTS:
In this study we found that upregulation of extracellular activities, such as proteoglycans, ECM-receptor interaction, and cell adhesion molecules, were the most prominent feature of PTC. Significantly over-expressed genes included SDC1 (syndecan 1), SDC4 (syndecan 4), KLK7 (kallikrein-related peptidase 7), KLK10 (kallikrein-related peptidase 10), SLPI (secretory leukocyte peptidase inhibitor), GDF15 (growth/differentiation factor-15), ALOX5 (arachidonate 5-lipoxygenase), SFRP2 (secreted Frizzled-related protein 2), among others. Further, elevated KLK10 levels were detected in patients with PTC. Many of these genes belong to KEGG pathway “Proteoglycans in cancer”.
CONCLUSIONS:
Using DNA microarray analysis allowed the identification of genes and pathways with known important roles in malignant transformation, and also the discovery of novel genes that may be potential biomarkers for PTC.
Introduction
The American Cancer Society estimates that 53,990 new cases of thyroid cancer are expected in the United States in 2018, making this cancer the most common endocrine malignancy, representing 3.1% of all new cancer cases in United States [42]. Histopathological features distinguish four main types of thyroid cancer: papillary, follicular, medullary, and anaplastic, with papillary thyroid carcinoma (PTC) accounting for 80% of cases [8]. Although PTC is characterized by slow growth and good prognosis, about 10–15% of cases exhibit aggressive behavior, including local invasion, distant metastasis and treatment resistance. In the presence of distant metastasis, considered the most important factor for aggressiveness, median survival estimates is 4.1 years, and the 10-year disease-specific survival rate is 26% [41]. Accurate classification of thyroid cancer is the primary step for assessment of prognosis and treatment selection. However, in some cases, histopathological classification is difficult to accomplish. In this regard, the Cancer Genome Atlas Research Network performed a comprehensive analysis of the PTC genomic landscape, and proposed a reclassification of thyroid cancers into molecular subtypes to better improve pathological classification and management of this disease [1]. According to that study, PTC has been classified as a Mitogen-Activated Protein Kinase (MAPK)-driven tumor with the two major signaling drivers being BRAF
Methods
Patients and ethics statement
Patients diagnosed with stage II/III PTC during thyroidectomy at the New York Eye and Ear Infirmary (New York, NY, USA) and Westchester Medical Center (Valhalla, NY, USA), were considered eligible for the study. Exclusion criteria included previous chemotherapy or radiotherapy for any carcinoma. The study protocol was approved by the Institutional Review Board committee at each institution and written informed consent was obtained from each patient.
Tissue samples and total RNA isolation
Tumor/normal paired thyroid tissue samples were obtained from PTC patients. The samples were harvested and frozen in dry ice/ethanol bath immediately after surgical removal and stored at
Microarray procedures
RNA quality from each sample was first assessed by electrophoresis using the Agilent Bioanalyzer 2100 and spectrophotometric analysis. Then, RNA amplification, and cDNA synthesis and labelling were performed at Functional Genomics Center, University of Rochester, according to Affymetrix techniques (Santa Clara, CA, USA). One
Microarray data preprocessing and analysis
Arrays were classified into Tumor group (from PTC tumor tissue samples) and Normal group (from normal paired thyroid tissue samples). Affymetrix CEL files were subjected to quality control, pre-processing and GC-RMA (GeneChip robust multi-array average) normalization, using the automatic R pipeline AffymetrixQC (
Functional group and pathway enrichment analysis
To identify functional groups and biological pathways implicated in PTC, the gene lists of differentially expressed genes were subjected to Gene Ontology (GO) functional and Kyoto Encyclopedia of Genes and Genomes (KEGG) pathway enrichment analyses using the online Database for Annotation, Visualization and Integrated Discovery (DAVID) (
Quantitative real time RT-PCR (qRT-PCR)
qRT-PCR was performed for a group of selected genes associated with ECM remodeling and the inflammatory response: kallikrein-related peptidase-7 (KLK7), kallikrein-related peptidase-10 (KLK10), arachidonate 5-lipoxygenase (ALOX5), growth differentiation factor-15 (GDF-15), and secreted frizzled-related protein-2 (SFRP2). Gene-specific primers were designed with Primer3 software (
Western blot (WB)
To correlate mRNA expression levels with protein levels, WB analysis was performed using standard protocols with antibodies against protein markers kallikrein-7, kallikrein-10, growth/differentiation factor-15 (GDF-15), and secretory leukocyte peptidase inhibitor (SLPI protein). Tumor/normal paired thyroid tissue samples from the PTC patients were coarsely grounded in a mortar under liquid nitrogen and washed twice in PBS containing 1
Enzyme-linked immunosorbent assay (ELISA)
ELISA assay was performed to validate selected candidate serum protein biomarkers in the sera of PTC patients and healthy controls using commercial kits for kallikrein-10 (IBEX Pharmaceuticals, Montreal, Quebec, Canada) and SLPI (R&D Systems, Minneapolis, MN, USA). ELISA assay kits were run following manufacturer’s instructions. Individual samples were assayed in triplicates, and absorbance of each well was measured at 450 nm with a ELISA plate reader. Concentrations were calculated using a four parameter logistic (4-PL) curve fit of the standard curves using GraphPad Prism 5.0 (GraphPad Software, Inc., San Diego, CA, USA). Kallikrein-10 and SLPI serum levels were analyzed in 13 PTC patients and 8 age-matched healthy donors. Serum samples from PTC patients were collected pre-surgically and stored at
Statistics
Statistics were performed using GraphPad Prism
Results
Patients and pathological findings
Age range was 23–74 years (average: 43.6); 6 females and 1 male; four were diagnosed with stage III, two with stage II, and one with stage I; four patients tested positive for BRAF
Genes validated in PTC
Genes validated in PTC
Statistical significance was determined using: *
Western blots of a set of proteins over-expressed in PTC. Western blot assays were carried for protein markers kallikrein-7, kallikrein-10, growth/differentiation factor 15, and antileukoproteinase/secretory leukocyte protease inhibitor in paired tumor/normal thyroid tissue samples from PTC patients. 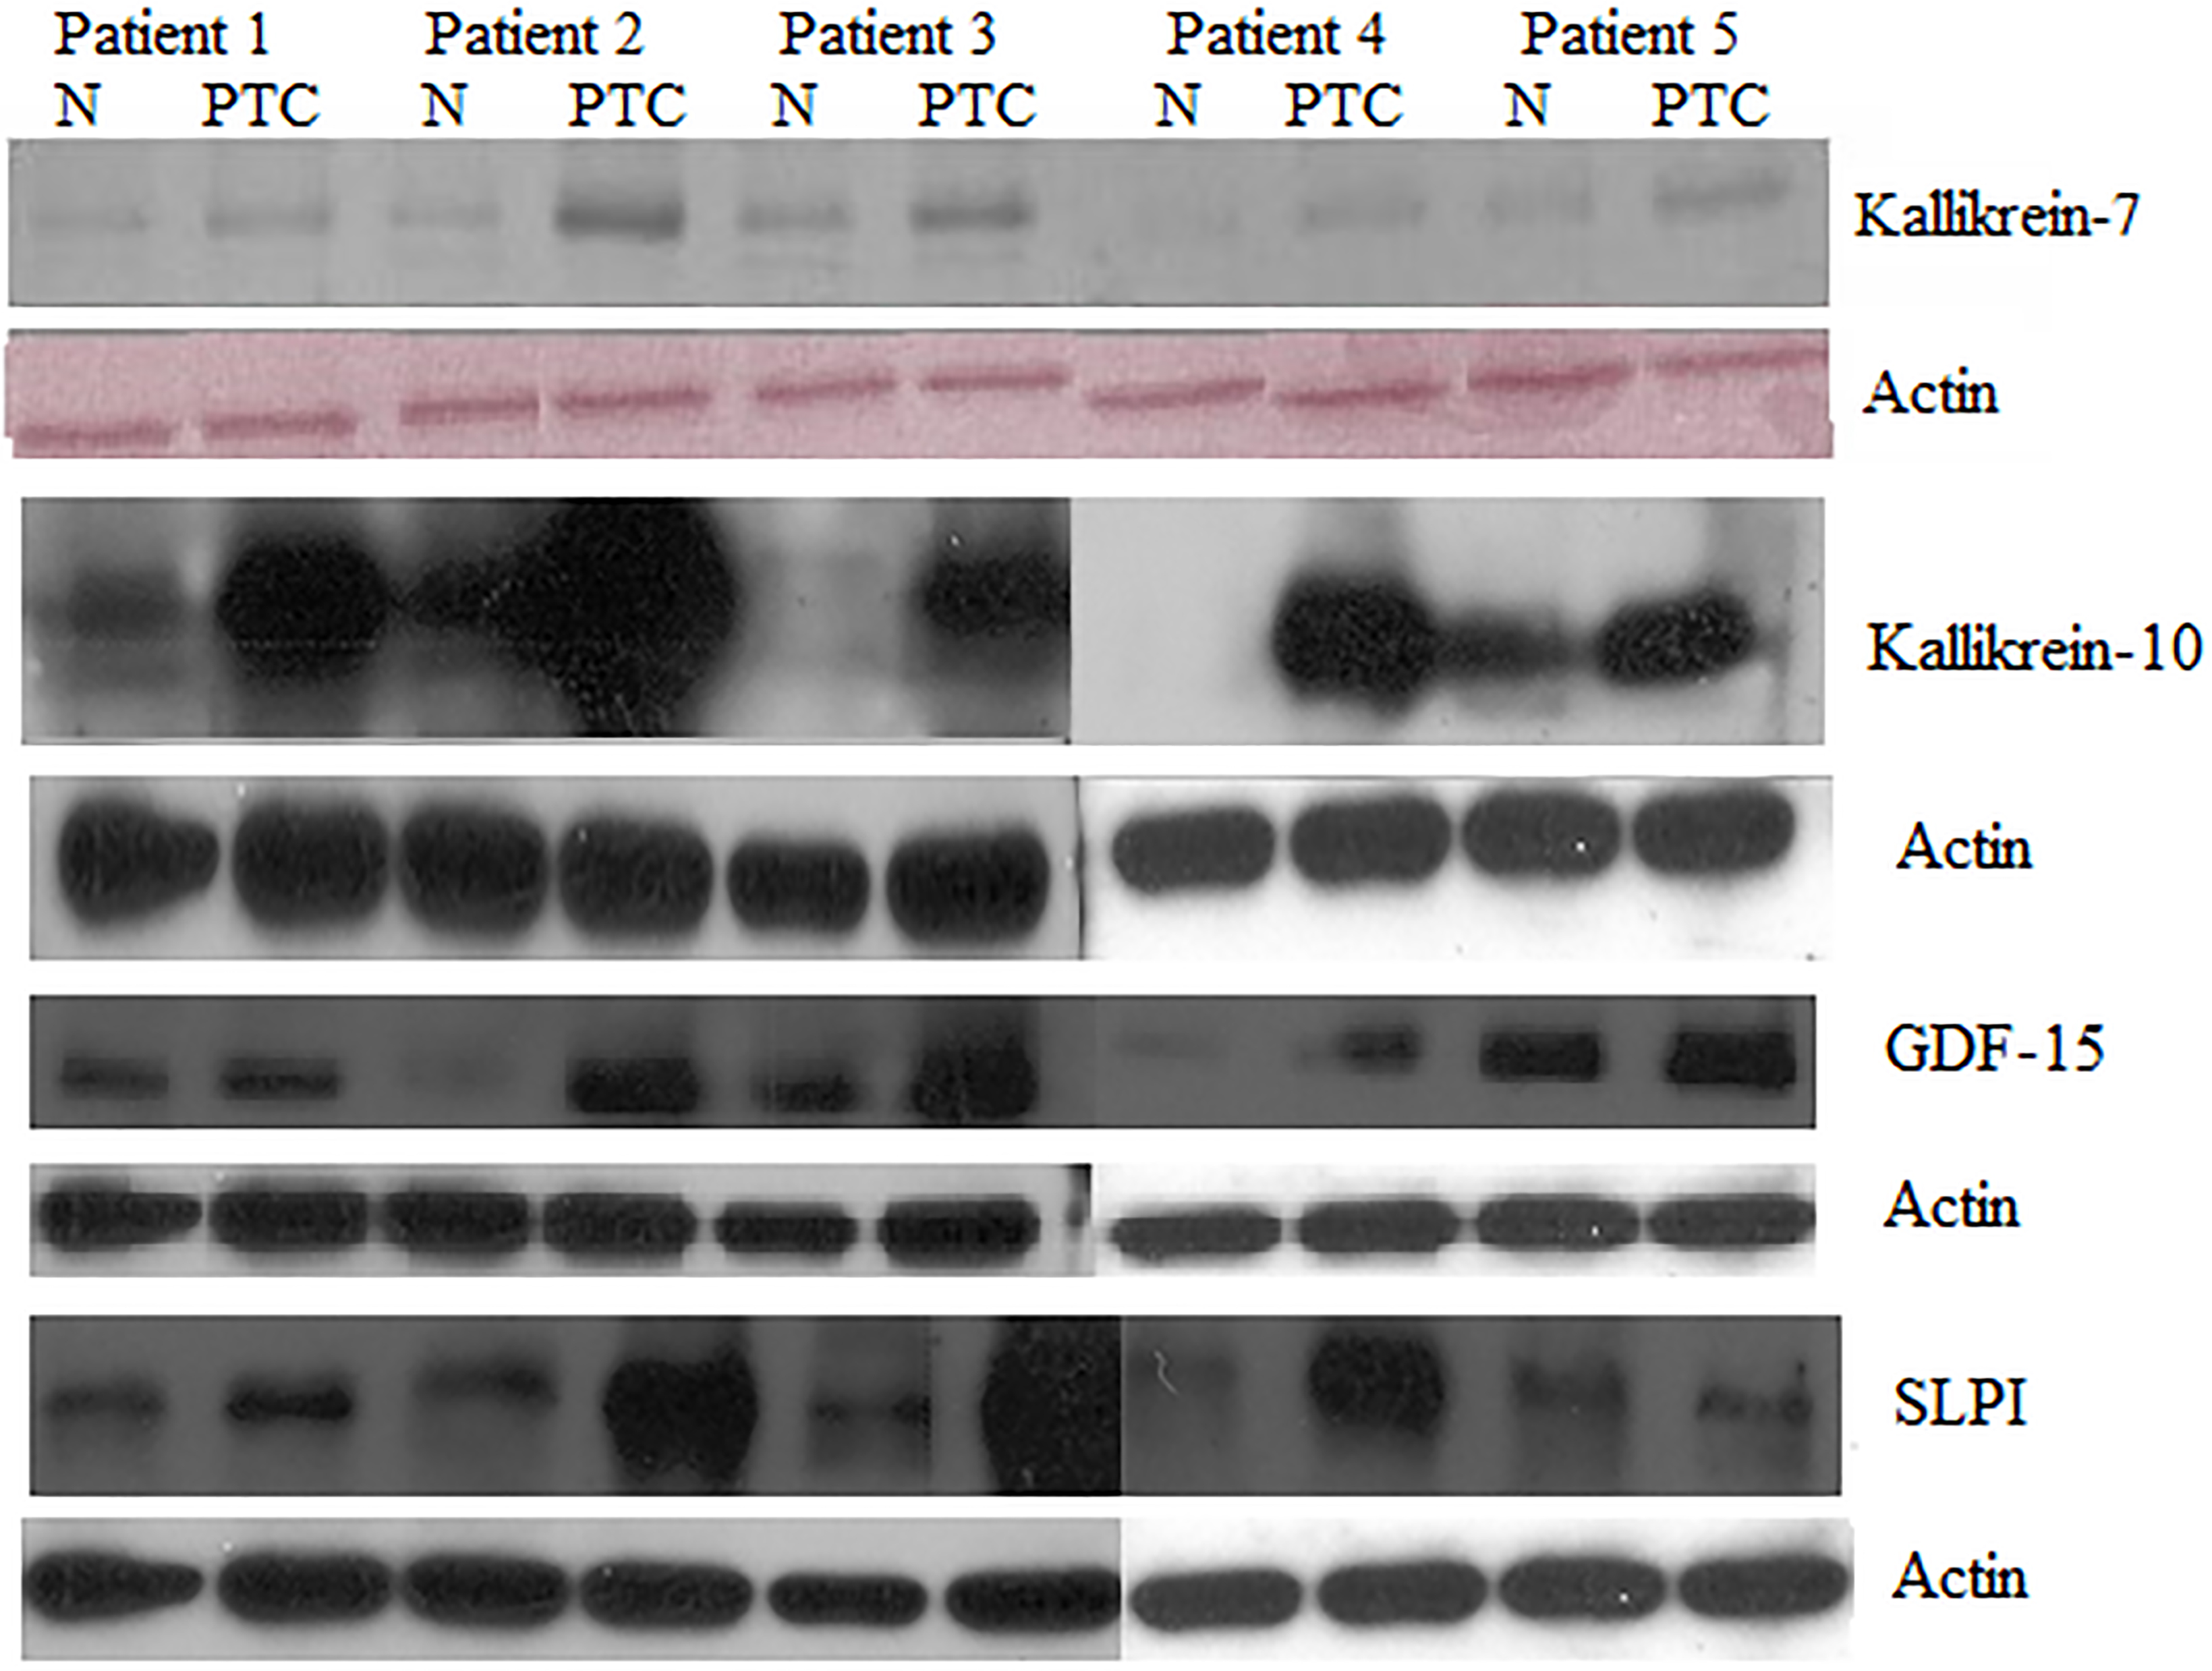
Preprocessing and statistical analysis of DNA microarray data generated from paired tumor and normal tissue from seven papillary thyroid carcinoma patients identified 20,111 genes: 205 were differentially expressed between tumor and normal tissue, 104 over-expressed and 101 under-expressed, with
Functional and pathway enrichment analysis
According to DAVID online tool, a total of 26 GO functions belonging to the Biological Process (BP) category were enriched with a count of at least 5 genes in each GO term and
Serum hK10 levels in PTC patients. Serum hK10 levels were measured by ELISA in three groups of individuals: Healthy Controls (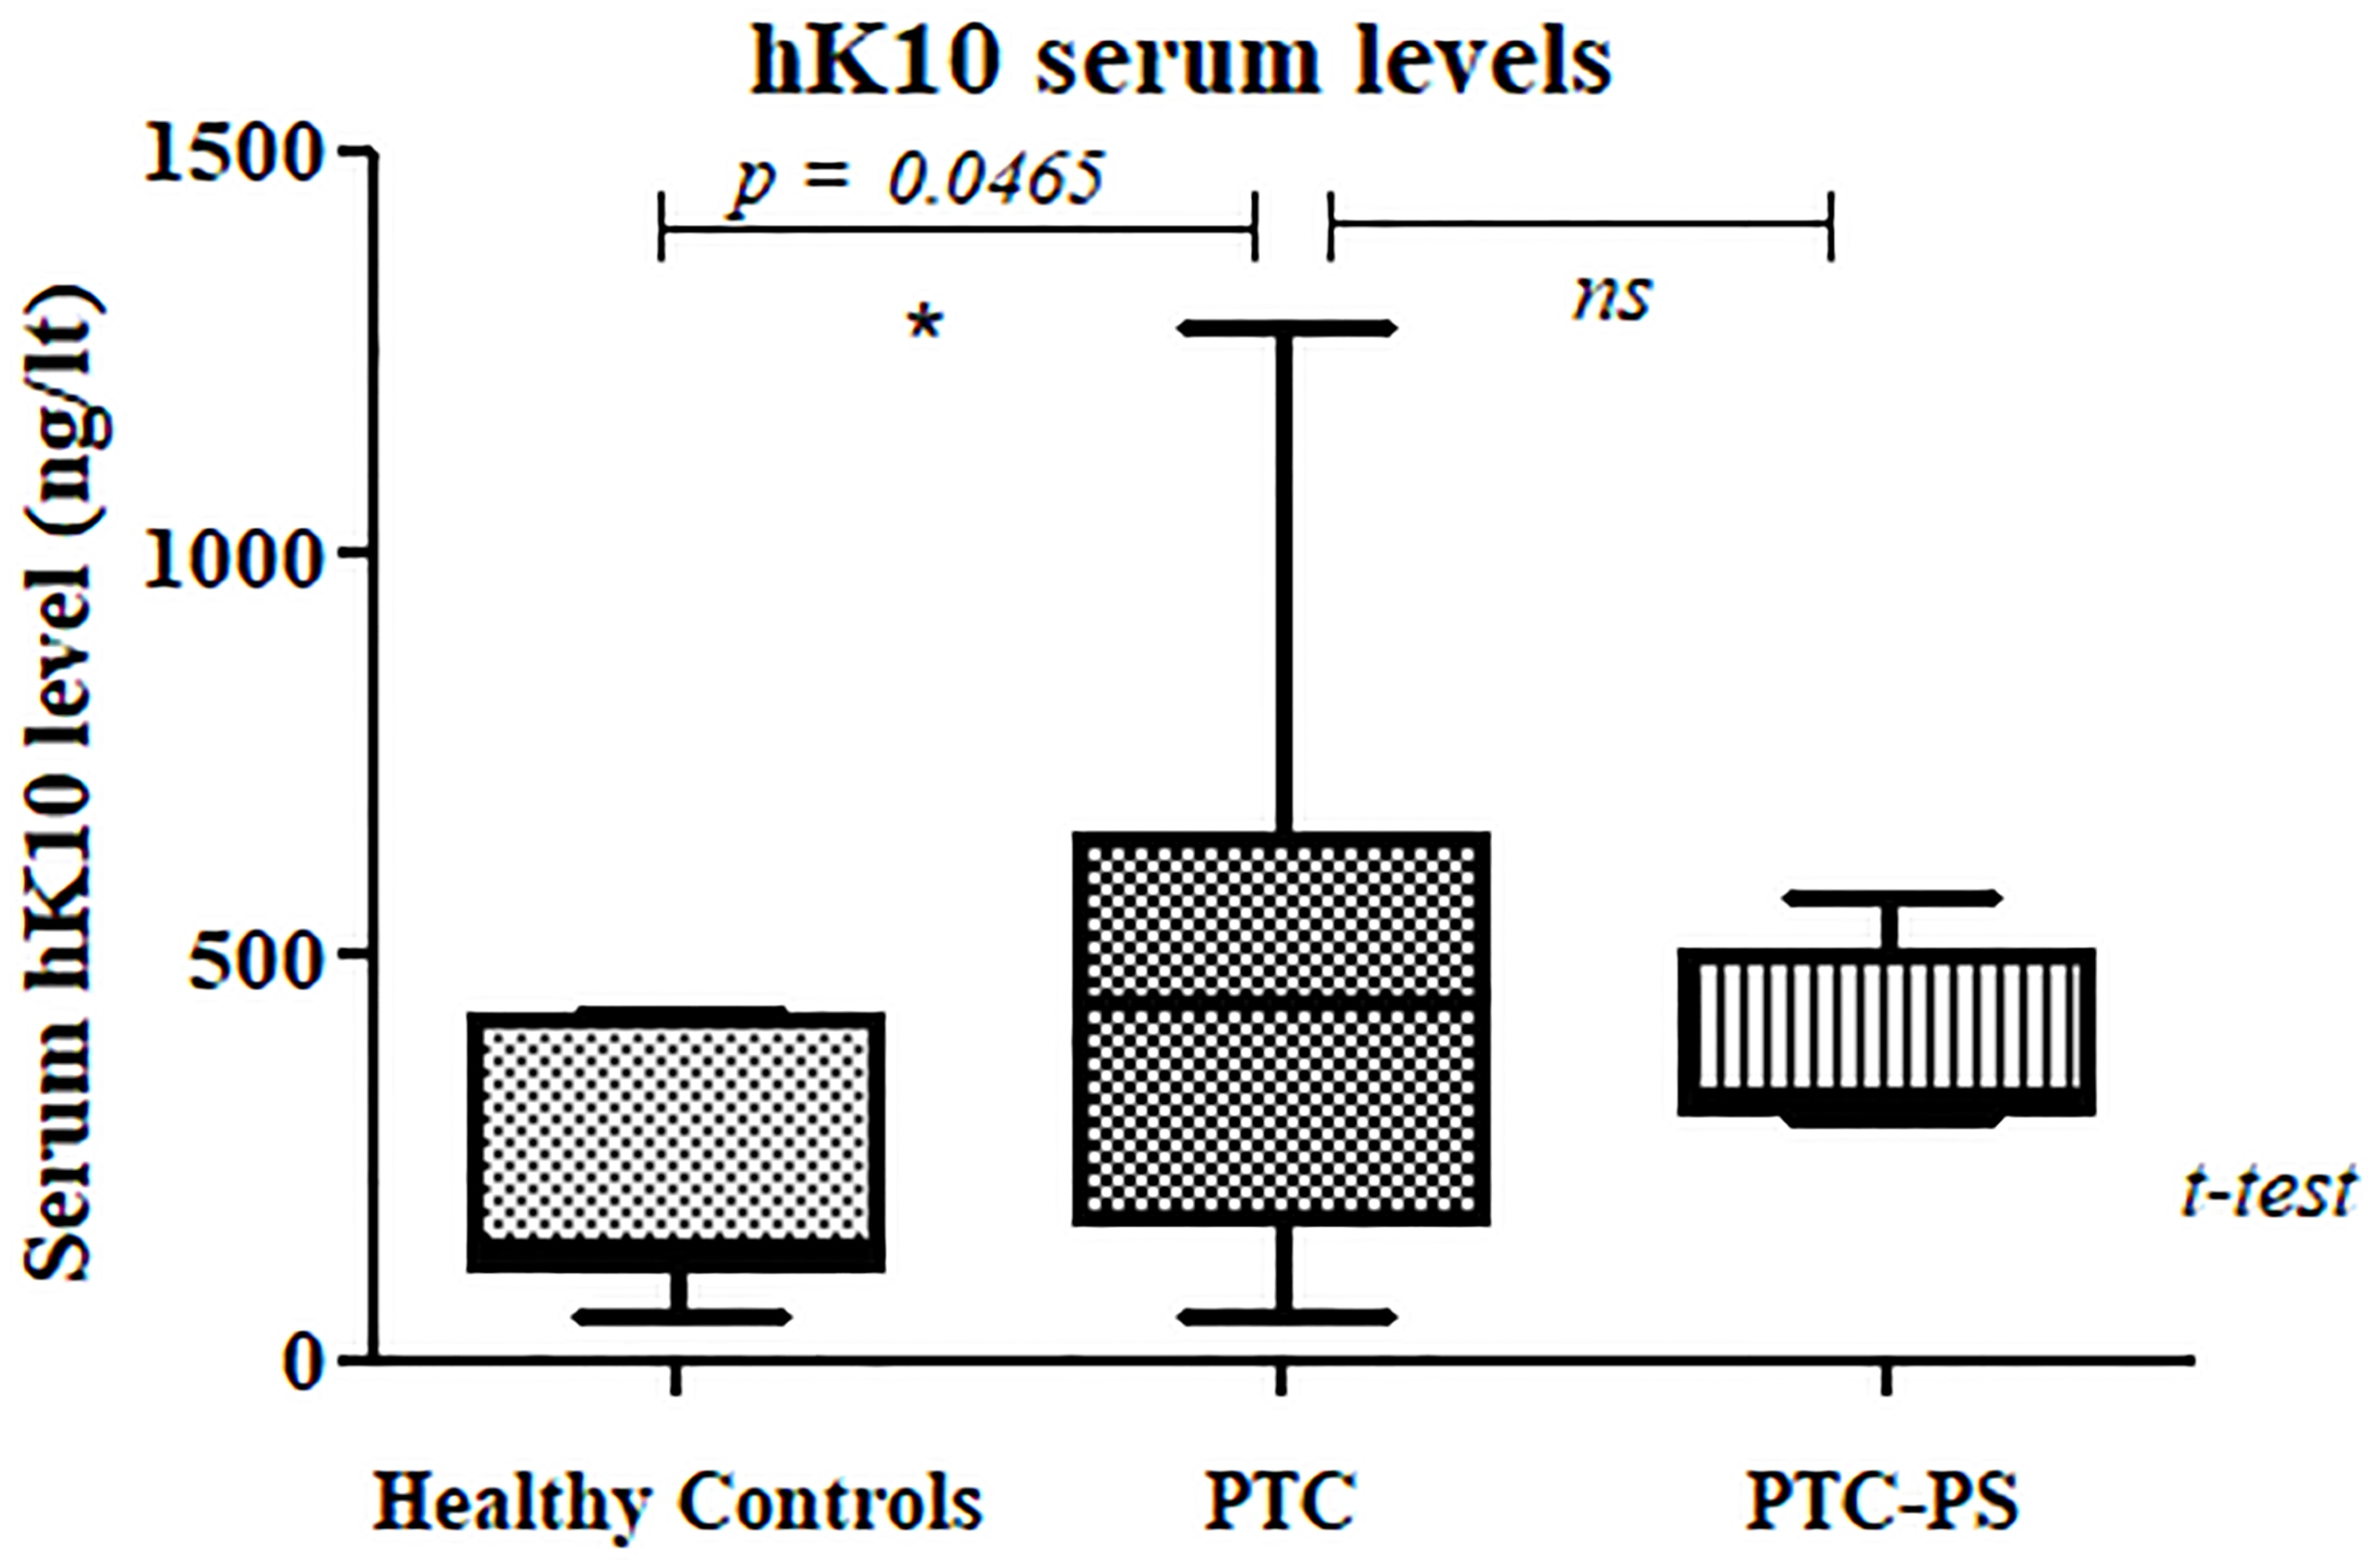
To identify novel genes not previously mentioned in PTC, a literature search was performed for genes with the highest over-expression in PTC compared to normal thyroid tissue (Table S2, supplementary material). Many of the genes listed have been previously identified in other published microarray expression studies [23, 43], validating our results. However, most of these genes have not been validated by other methods. Thus, we selected six of these genes and corresponding encoded proteins for validation by qPCR and/or WB: KLK7, KLK10, ALOX5, SLPI, GDF-15, and SFRP2. qRT-PCR and WB analysis confirmed the increased levels of these genes in PTC compared to normal paired thyroid tissues (Table 1; Fig. 1). Consistent with microarray results, qPCR experiments showed that expression of KLK7, KLK10, ALOX5, GDF-15, and SFRP2, were significantly increased in PTC compared to normal tissue. Densitometry analysis of bands from WB analysis showed that signal intensities for all the evaluated proteins were significantly higher in the tumor samples compared to the corresponding paired normal samples, with overall fold changes of 3.7 for kallikrein-7 (
Serum levels of selected protein markers
ELISA assays were performed twice and similar results were obtained. Serum kallikrein-10 levels in healthy controls were consistent with previous reports [28]. Kallikrein-10 serum level was significantly higher in PTC patients relative to healthy controls (Fig. 2). The mean and median values of serum kallikrein-10 in healthy controls were 230 and 142 ng/lt, respectively. Pre-surgery serum kallikrein-10 levels in the PTC group was significantly higher than levels from the Healthy Control group, with mean and median of 457 and 449 ng/liter, respectively (
Discussion
Whole transcriptome analysis has potential to identify novel biomarkers for diseases like cancer, and is beginning to impact real-time clinical decision-making [38]. In the present study, DNA microarray analysis identified genes and biological pathways differentially expressed between PTC and normal thyroid tissue. According to our results, the most apparent feature of PTC was upregulation of extracellular activities, such as proteoglycans, ECM-receptor interaction, and cell adhesion molecules, while downregulated pathways were involved with thyroid hormone biosynthesis and signaling pathways. Among over-expressed genes encoding components of the ECM were SDC1, SDC4, FN1, c-MET, erbB3, and Tiam1; upregulation of these genes has been previously reported in PTC [5, 15, 19, 34, 47], supporting the reliability of our microarray data. Syndecan-1 is mainly found on the basolateral surface of epithelial cells in adult tissues and syndecan-4 is ubiquitously expressed on most tissues [4]. Syndecan-4 binds to fibronectin leading to the activation of focal adhesion kinase (FAK), a tyrosine kinase that regulates focal adhesions [49, 50]. Binding of syndecan-1 and syndecan-4 to fibronectin has been shown to regulate tumor cell ECM attachment and growth [46]. c-MET is a receptor tyrosine kinase that regulates different cellular signaling pathways, including those involved in proliferation, motility, migration and invasion, which has been found to be aberrantly activated in many human cancers, including thyroid cancer [33, 43]. ERBB3 has been implicated in feedback regulation of MEK/ERK signaling in PTC driven by BRAF
Different studies have shown that high expression of Tiam1 protein is associated with progression of several cancer types [31], and it has been suggested as prognostic factor and potential therapeutic target for thyroid cancers [16, 27]. Tiam1 has also been shown to bind syndecans promoting cell-matrix adhesion and cell migration, establishing a novel link between Tiam1 and syndecans, two previously unrelated signal transduction pathways implicated in cancer [22, 39]. We found over-expression in PTC of all these genes belonging to KEGG pathway “Proteoglycans in cancer”. Our microarray data is strongly supported by the scientific literature on the involvement of these genes in thyroid carcinoma.
Functional group enrichment analysis in the context of GO_BP terms found that many of the significant genes were grouped into categories associated with cell adhesion, extracellular matrix organization, inflammatory response, activation of MAPK activity, among others. Two of the most upregulated genes in PTC were KLK7 and KLK10, two members of the tissue kallikrein (KLK) gene family of conserved serine proteases located in human chromosomal region 19q13.3–q13.4 [7], involved in cell adhesion and ECM remodeling. The encoded serine proteases have diverse expression patterns and physiological roles including activation of other proteases, degradation of extracellular matrix (ECM) components, and activation of growth and angiogenic factors [7, 53].
KLKs have been explored as promising biomarkers for different cancer types, especially for prediction and monitoring of patients’ response to chemotherapy [25]. Human kallikrein-3 (prostate-specific-antigen/PSA) and kallikrein-2 have clinical application as biomarkers for prostatic diseases [29]. Further evaluation of KLK10, both in tissue and serum, in larger cohorts of PTC patients and healthy controls are required to determine the true value of this protein in management of thyroid cancer. Another gene upregulated in PTC was SLPI (secretory leukocyte peptidase inhibitor), which encodes a protein that is a potent inhibitor of leukocyte elastase, cathepsin G, chymotrypsin, and trypsin; SLPI also has been shown to be a specific inhibitor of kallikrein-7 [12]. SLPI is produced and released into mucus by secretory cells in the parotid, bronchus, cervix, and testicular gland, playing physiological roles against proteolytic degradation of these tissues. In cancer tissues, increased expression of kallikrein-7 and decreased expression of SLPI have been found in cervical adenocarcinoma, but in ovarian tumors both proteins have been found overexpressed [40, 45].
This study identified additional genes which may represent potential markers for PTC, as they are associated with cell-extracellular matrix interaction (ECM), which is important in cell growth promotion and survival; these genes included secreted Frizzled-related protein 2 (SFRP2), proprotein convertase subtilisin/kexin type 2 (PCSK2), cathepsin-C (CTSC), and cathepsin-H (CTSH). SFRP2 gene encodes a secreted glycoprotein member of the SFRP family that function as Wnt receptors. Wnt signaling is implicated in cell proliferation, apoptosis, and onset of neoplasia. Methylation of SFRP2 gene has been associated with esophageal adenocarcinoma and colorectal cancer [52, 55].
We also found overexpression of some important genes associated with mechanisms other than epithelial-ECM interaction, such as immune/inflammatory reaction, antiapoptosis and angiogenesis, including ALOX5 and GDF-15. ALOX5 is a lipoxygenase implicated in several metabolic pathways and it has been recently associated with cell proliferation and neo-angiogenesis [37]. We previously reported ALOX5 overexpression in PTC and documented its correlation with invasive tumor histopathology [26]. GDF-15, which has been linked to prostate cancer [21], was first isolated from a differential screen for genes that were induced in macrophage activation [6]; it is member of TGF-
Genes identified in this study have been shown to play important roles in malignant transformation, tumor progression and phenotype of PTC. Additional studies with larger sample size and detailed clinical characterization of patients are required to evaluate the biological role and prognostic value in PTC of some of these genes and the encoded proteins.
Footnotes
Acknowledgments
Dr. Eleftherios P. Diamandis (Mount Sinai Hospital, Toronto, Ontario) for providing the anti-hK7 antiserum. Microarray Facility of the Functional Genomics Center at the University of Rochester. Author’s contributions: Niradiz Reyes performed microarray data analysis and drafted the article. Ismael Reyes performed sample processing for microarray analysis, qRT-PCR, WB, ELISA assays and contributed to draft the article. Codrin Iacob performed diagnosis of PTC according to WHO criteria Nina Suslina was Clinical Project Manager. Jan Geliebter and Raj Tiwari designed the project. Project funded by NIH grant 1R01CA131946-01A2 and New York Medical College/New York Eye and Ear Infirmary, Department of Otolaryngology.
Conflict of interest
The authors declare that they have no competing interests.
Supplementary data
Primer sequences for genes validated by qRT-PCR
Gene name
Nucleotide sequences (forward/reverse)
KLK7
5’-atggcaagatcccttctcct-3’/5’-gcagcctgactttcttcacc-3’
KLK10
5’-tcctctcgtggggtgtttac-3’/5’-gagtggcagaggaagtcagg-3’
ALOX5
5’-cgcaagtactggctgaatga-3’/5’-tttctcaaagtcggcgaagt-3’
GDF-15
5’-actgctggcagaatcttcgt-3’/5’-tatgcagtggcagtctttgg-3’
SFRP2
5’-gagagttcaagcgcatctcc-3’/5’-gggccacagagaaaattgaa-3’
Most highly over-expressed genes in PTC
Gene stable ID
Gene name
Gene description
Fold
*adj. P.Val
change
ENSG00000164935
DCSTAMP
dendrocyte expressed seven transmembrane protein
82.8
0.0000575
ENSG00000145864
GABRB2
gamma-aminobutyric acid type A receptor beta2 subunit
78.5
0.000186735
ENSG00000169035
KLK7
kallikrein related peptidase 7
78.4
0.00000358
ENSG00000157765
SLC34A2
solute carrier family 34 member 2
65.4
0.0000346
ENSG00000197249
SERPINA1
serpin family A member 1
57.9
0.00000809
ENSG00000163898
LIPH
lipase H
47.7
0.00000171
ENSG00000125931
CITED1
Cbp/p300 interacting transactivator with Glu/Asp rich carboxy-terminal domain 1
41.4
0.0000174
ENSG00000184574
LPAR5
lysophosphatidic acid receptor 5
32.8
0.000128406
ENSG00000168878
SFTPB
surfactant protein B
32.5
0.001260656
ENSG00000133048
CHI3L1
chitinase 3 like 1
28.9
0.00938079
ENSG00000176532
PRR15
proline rich 15
28.2
0.003127366
ENSG00000184292
TACSTD2
tumor associated calcium signal transducer 2
27.7
0.011421143
ENSG00000134569
LRP4
LDL receptor related protein 4
21.2
0.001437797
ENSG00000147883
CDKN2B
cyclin dependent kinase inhibitor 2B
20.9
0.0000276
ENSG00000115414
FN1
fibronectin 1
17.3
0.000888731
ENSG00000129451
KLK10
kallikrein related peptidase 10
17.1
0.002351774
ENSG00000009694
TENM1
teneurin transmembrane protein 1
16.9
0.001174524
ENSG00000012779
ALOX5
arachidonate 5-lipoxygenase
15.1
0.048401649
ENSG00000123700
KCNJ2
potassium voltage-gated channel subfamily J member 2
14.3
0.00095752
ENSG00000110042
DTX4
deltex E3 ubiquitin ligase 4
13.8
0.00000397
ENSG00000138061
CYP1B1
cytochrome P450 family 1 subfamily B member 1
11.7
0.035892153
ENSG00000125851
PCSK2
proprotein convertase subtilisin/kexin type 2
11.6
0.058196787
ENSG00000131435
PDLIM4
PDZ and LIM domain 4
11.4
0.004377039
ENSG00000124813
RUNX2
runt related transcription factor 2
11.3
0.000549528
ENSG00000164379
FOXQ1
forkhead box Q1
11
0.005319016
ENSG00000163347
CLDN1
claudin 1
10.8
0.002239326
*Benjamini and Hochberg method.
Supplementary Table S2, continued
Gene stable ID
Gene name
Gene description
Fold
*adj. P.Val
change
ENSG00000196352
CD55
CD55 molecule (Cromer blood group)
10.5
0.00530691
ENSG00000188906
LRRK2
leucine rich repeat kinase 2
10.2
0.000510028
ENSG00000159216
RUNX1
runt related transcription factor 1
10.1
0.000677037
ENSG00000091129
NRCAM
neuronal cell adhesion molecule
9.8
0.00263012
ENSG00000124107
SLPI
secretory leukocyte peptidase inhibitor
8.9
0.025152889
ENSG00000156299
TIAM1
T cell lymphoma invasion and metastasis 1
8.9
0,003420038
ENSG00000138166
DUSP5
dual specificity phosphatase 5
8.4
0.009720843
ENSG00000133110
POSTN
periostin
8.4
0.007539624
ENSG00000109861
CTSC
cathepsin C
8.2
0.000412857
ENSG00000135547
HEY2
hes related family bHLH transcription factor with YRPW motif 2
8.1
0.001020278
ENSG00000169302
STK32A
serine/threonine kinase 32A
8.1
0.000518075
ENSG00000130513
GDF-15
growth differentiation factor-15 (GDF-15)
4.9
0.018193137
ENSG00000124145
SDC4
syndecan 4
4.2
0.022380342
ENSG00000145423
SFRP2
secreted Frizzled-related protein 2
3.4
0.01292622
Most highly under-expressed genes in PTC
Gene stable ID
Gene name
Gene description
Fold
adj.P.Val
change
ENSG00000153246
PLA2R1
phospholipase A2 receptor 1
0.00002860
ENSG00000066382
MPPED2
metallophosphoesterase domain containing 2
0.00000524
ENSG00000115705
TPO
thyroid peroxidase
0.00003920
ENSG00000166426
CRABP1
cellular retinoic acid binding protein 1
0.00051808
ENSG00000160180
TFF3
trefoil factor 3
0.00002760
ENSG00000233705
SLC26A4-AS1
SLC26A4 antisense RNA 1
0.00012965
ENSG00000211452
DIO1
iodothyronine deiodinase 1
0.00059553
ENSG00000074706
IPCEF1
interaction protein for cytohesin exchange factors 1
0.00000268
ENSG00000091137
SLC26A4
solute carrier family 26 member 4
0.00511303
ENSG00000132561
MATN2
matrilin 2
0.00000969
ENSG00000184905
TCEAL2
transcription elongation factor A like 2
0.00048673
ENSG00000184908
CLCNKB
chloride voltage-gated channel Kb
0.00002590
ENSG00000170323
FABP4
fatty acid binding protein 4
0.00325702
ENSG00000109819
PPARGC1A
PPARG coactivator 1 alpha
0.00695480
ENSG00000147606
SLC26A7
solute carrier family 26 member 7
0.00778682
ENSG00000022267
FHL1
four and a half LIM domains 1
0.00331415
ENSG00000149294
NCAM1
neural cell adhesion molecule 1
0.00979842
ENSG00000166148
AVPR1A
arginine vasopressin receptor 1A
0.00098430
ENSG00000009765
IYD
iodotyrosine deiodinase
0.03486764
ENSG00000166415
WDR72
WD repeat domain 72
0.00051920
ENSG00000169282
KCNAB1
potassium voltage-gated channel subfamily A member regulatory beta subunit 1
0.00191092
ENSG00000125845
BMP2
bone morphogenetic protein 2
0.00563634
ENSG00000198682
PAPSS2
3’-phosphoadenosine 5’-phosphosulfate synthase 2
0.00078994
ENSG00000164761
TNFRSF11B
TNF receptor superfamily member 11b
0.00468003
ENSG00000168079
SCARA5
scavenger receptor class A member 5
0.00331415
ENSG00000101938
CHRDL1
chordin like 1
0.00186596
ENSG00000141338
ABCA8
ATP binding cassette subfamily A member 8
0.00051916
ENSG00000150995
ITPR1
inositol 1,4,5-trisphosphate receptor type 1
0.00000589
ENSG00000151136
BTBD11
BTB domain containing 11
0.00115643
ENSG00000116194
ANGPTL1
angiopoietin like 1
0.00206053
ENSG00000154556
SORBS2
sorbin and SH3 domain containing 2
0.00040446
ENSG00000135218
CD36
CD36 molecule
0.01309059
ENSG00000154175
ABI3BP
ABI family member 3 binding protein
0.00454651
ENSG00000155792
DEPTOR
DEP domain containing MTOR interacting protein
0.00586608
ENSG00000153823
PID1
phosphotyrosine interaction domain containing 1
0.00118254
ENSG00000169047
IRS1
insulin receptor substrate 1
0.00942050
ENSG00000178568
ERBB4
erb-b2 receptor tyrosine kinase 4
0.00002760
ENSG00000125740
FOSB
FosB proto-oncogene, AP-1 transcription factor subunit
0.00332647
ENSG00000076864
RAP1GAP
RAP1 GTPase activating protein
0.00029231
ENSG00000164442
CITED2
Cbp/p300 interacting transactivator with Glu/Asp rich carboxy-terminal domain 2
0.00136737
GO_BP functional enrichment of differentially expressed genes Gene count: the number of differentially expressed genes. The
Category
GO term/description
Gene count
Over-expressed
GO:0007165
signal transduction
16
0.001715599
GO:0006915
10
0.004154717
GO:0006508
9
0.006517584
GO:0007155
8
0.013743966
GO:0030198
7
0.00076932
GO:0010628
7
0.003347854
GO:0006954
7
0.018726822
GO:0042060
6
0.00008099
GO:0010951
6
0.00056046
GO:0007596
6
0.003572519
GO:0000187
5
0.002945726
GO:0071356
5
0.003254238
GO:0045766
5
0.003816204
GO:0006888
5
0.012031361
Under-expressed
GO:0055114
11
0.001247293
GO:0045944
11
0.036881265
GO:0007155
8
0.011614032
GO:0006898
7
0.000490878
GO:0042493
7
0.005851721
GO:0070374
6
0.002498736
GO:0010628
6
0.013351468
GO:0007399
6
0.019058266
GO:0008283
6
0.046843321
GO:0098869
5
0.000540099
KEGG pathway enrichment of over-expressed genes Gene count: the number of differentially expressed genes. The
KEGG code/description/genes
Gene count
Fold change
hsa05205: Proteoglycans in cancer
6
0.013118572
Fibronectin 1(FN1)
0.00000271
16.3
Syndecan 4 (SDC4)
0.000427846
4.2
MET proto-oncogene, receptor tyrosine kinase (cMET)
0.00000303
5.1
Erb-b2 receptor tyrosine kinase 3 (ERBB3)
0.000000015
7.7
Syndecan 1 (SDC1)
0.001565398
4.8
T cell lymphoma invasion and metastasis 1 (Tiam1)
0.0000236
8.9
hsa04512: ECM-receptor interaction
5
0.003226258
Fibronectin 1(FN1)
0.00000271
16.3
Syndecan 4 (SDC4)
0.000427846
4.2
Syndecan 1 (SDC1)
0.001565398
4.8
Collagen type I alpha 2 chain (COL1A2)
0.003648144
4.5
Collagen type I alpha 1 chain (COL1A1)
0.000841148
4.9
hsa04514: Cell adhesion molecules (CAMs)
5
0.0177183
Neuronal cell adhesion molecule (NRCAM)
0.0000149
9.8
Syndecan 4 (SDC4)
0.000427846
4.2
Claudin 1 (CLDN1)
0.0000113
10.8
Versican (VCAN)
0.006636398
4.9
Syndecan 1 (SDC1)
0.001565398
4.8
hsa04610: Complement and coagulation cascades
4
0.012650834
Protein S (PROS1)
0.00000000039
7.4
Serpin family A member 1 (SERPINA1)
0.00000000186
57.8
CD55 molecule/Cromer blood group (CD55)
0.000046
10.5
Complement C3 (C3)
0.025288406
4.2
KEGG pathway enrichment of under-expressed genes Gene count: the number of differentially expressed genes. The
KEGG code/description/genes
Gene count
Fold change
hsa04918: Thyroid hormone synthesis
6
0.000124594
Solute carrier family 26 member 4
0.005113032
Heat shock protein family A (Hsp70) member 5
0.003082101
LDL receptor related protein 2
0.014633499
Inositol 1,4,5-trisphosphate receptor type 1
0.00000589
Thyroid peroxidase
0.0000392
Iodotyrosine deiodinase
0.034867638
hsa04931: Insulin resistance
5
0.006968337
TBC1 domain family member 4
0.003314146
CD36 molecule
0.013090592
Insulin receptor substrate 1
0.009420503
PPARG coactivator 1 alpha
0.006954803
Acetyl-CoA carboxylase beta
0.009982905
hsa04921: Oxytocin signaling pathway
5
0.025126328
Regulator of calcineurin 1
0.009836101
Jun proto-oncogene, AP-1 TF subunit
0.000292306
Inositol 1,4,5-trisphosphate receptor type 1
0.00000589
Fos proto-oncogene, AP-1 TF subunit
0.037532991
Calcium/calmodulin dependent protein kinase ID
0.021868732
hsa04920: Adipocytokine signaling pathway
4
0.013152301
CD36 molecule
0.013090592
Insulin receptor substrate 1
0.009420503
PPARG coactivator 1 alpha
0.006954803
Acetyl-CoA carboxylase beta
0.009982905
hsa04919: Thyroid hormone signaling pathway
4
0.046572382
Regulator of calcineurin 1
0.009836101
TBC1 domain family member 4
0.003314146
Regulator of calcineurin 2
0.016633138
Iodothyronine deiodinase 1
0.000595533