Lung cancer is a malignant tumor with high morbidity and mortality, of which 80% is non-small cell lung cancer (NSCLC). And lung adenocarcinoma (LUAD) is the most important and common subtype in the NSCLC. In current study, the microarray data GSE31210 containing LUAD ( 226) and normal lung tissue ( 20) was analyzed to identify 965 differentially expressed genes, on which weighted gene co-expression network analysis was performed. Finally, it was confirmed that there was a significant correlation between brown module and LUAD stage. In the significant module, a total of 54 network hub genes were identified, and six of them were also identified as hub genes of the protein-protein interaction network. In validation, KIF2C showed a higher correlation with disease stage than other hub genes ( 0.001, R2 0.955). Functional enrichment suggests that KIF2C is associated with cell mitosis and cell cycle. Combined with clinicopathological parameters, we found that the high expression of KIF2C is closely related to the relapse and tumor stage of LUAD. Survival analysis showed a significant reduction in overall survival in LUAD patients with high expression of KIF2C. Gene set enrichment analysis (GSEA) also showed that the “cell cycle signaling pathway” and “P53 related pathway” were significantly enriched in LUAD samples with high expression of KIF2C (FDR 0.05). In conclusion, based on the co-expression analysis, KIF2C was identified in the association with progression and prognosis of LUAD, which might refer a poor prognosis probably by regulating cell cycle signaling pathway.
Lung cancer is the leading cause of cancer-related deaths in the worldwide, with 80% of lung cancer being non-small cell lung cancer (NSCLC) [1]. NSCLC includes three major histological subtypes: squamous cell carcinoma, adenocarcinoma and large cell carcinoma. The most common type of NSCLC is lung adenocarcinoma (LUAD), accounting for 40% of all lung cancer [2]. In recent years, despite the great breakthroughs in the diagnosis and treatment of NSCLC, the 5-year survival rate of advanced NSCLC remains low [3]. Therefore, identification of sensitive biomarkers which can predict tumor recurrence and prognosis is still an urgent task in guiding the treatment of NSCLC.
Currently, with the development of high-throughput chip technologies, gene expression profiling has been used to identify genes which are associated with LUAD progression [4, 5, 6, 7]. However, most studies have focused on the screening of differentially expressed genes (DEGs), ignoring the high correlation between genes, although genes with similar patterns of expression may be functionally related [8].
Weighted gene co-expression network analysis (WGCNA) is used to study the association of gene sets with clinical features by constructing free-scale gene co-expression networks [9]. Recently, many studies have used WGCNA to screen hub genes and modules which are associated with clinical features through microarray or RNA sequencing data [10, 11]. Therefore, we attempted to construct a co-expression network for the relationship between genes using WGCNA and identify the relationship between the network hub genes and different stages of LUAD [12, 11].
Materials and method
Data collection
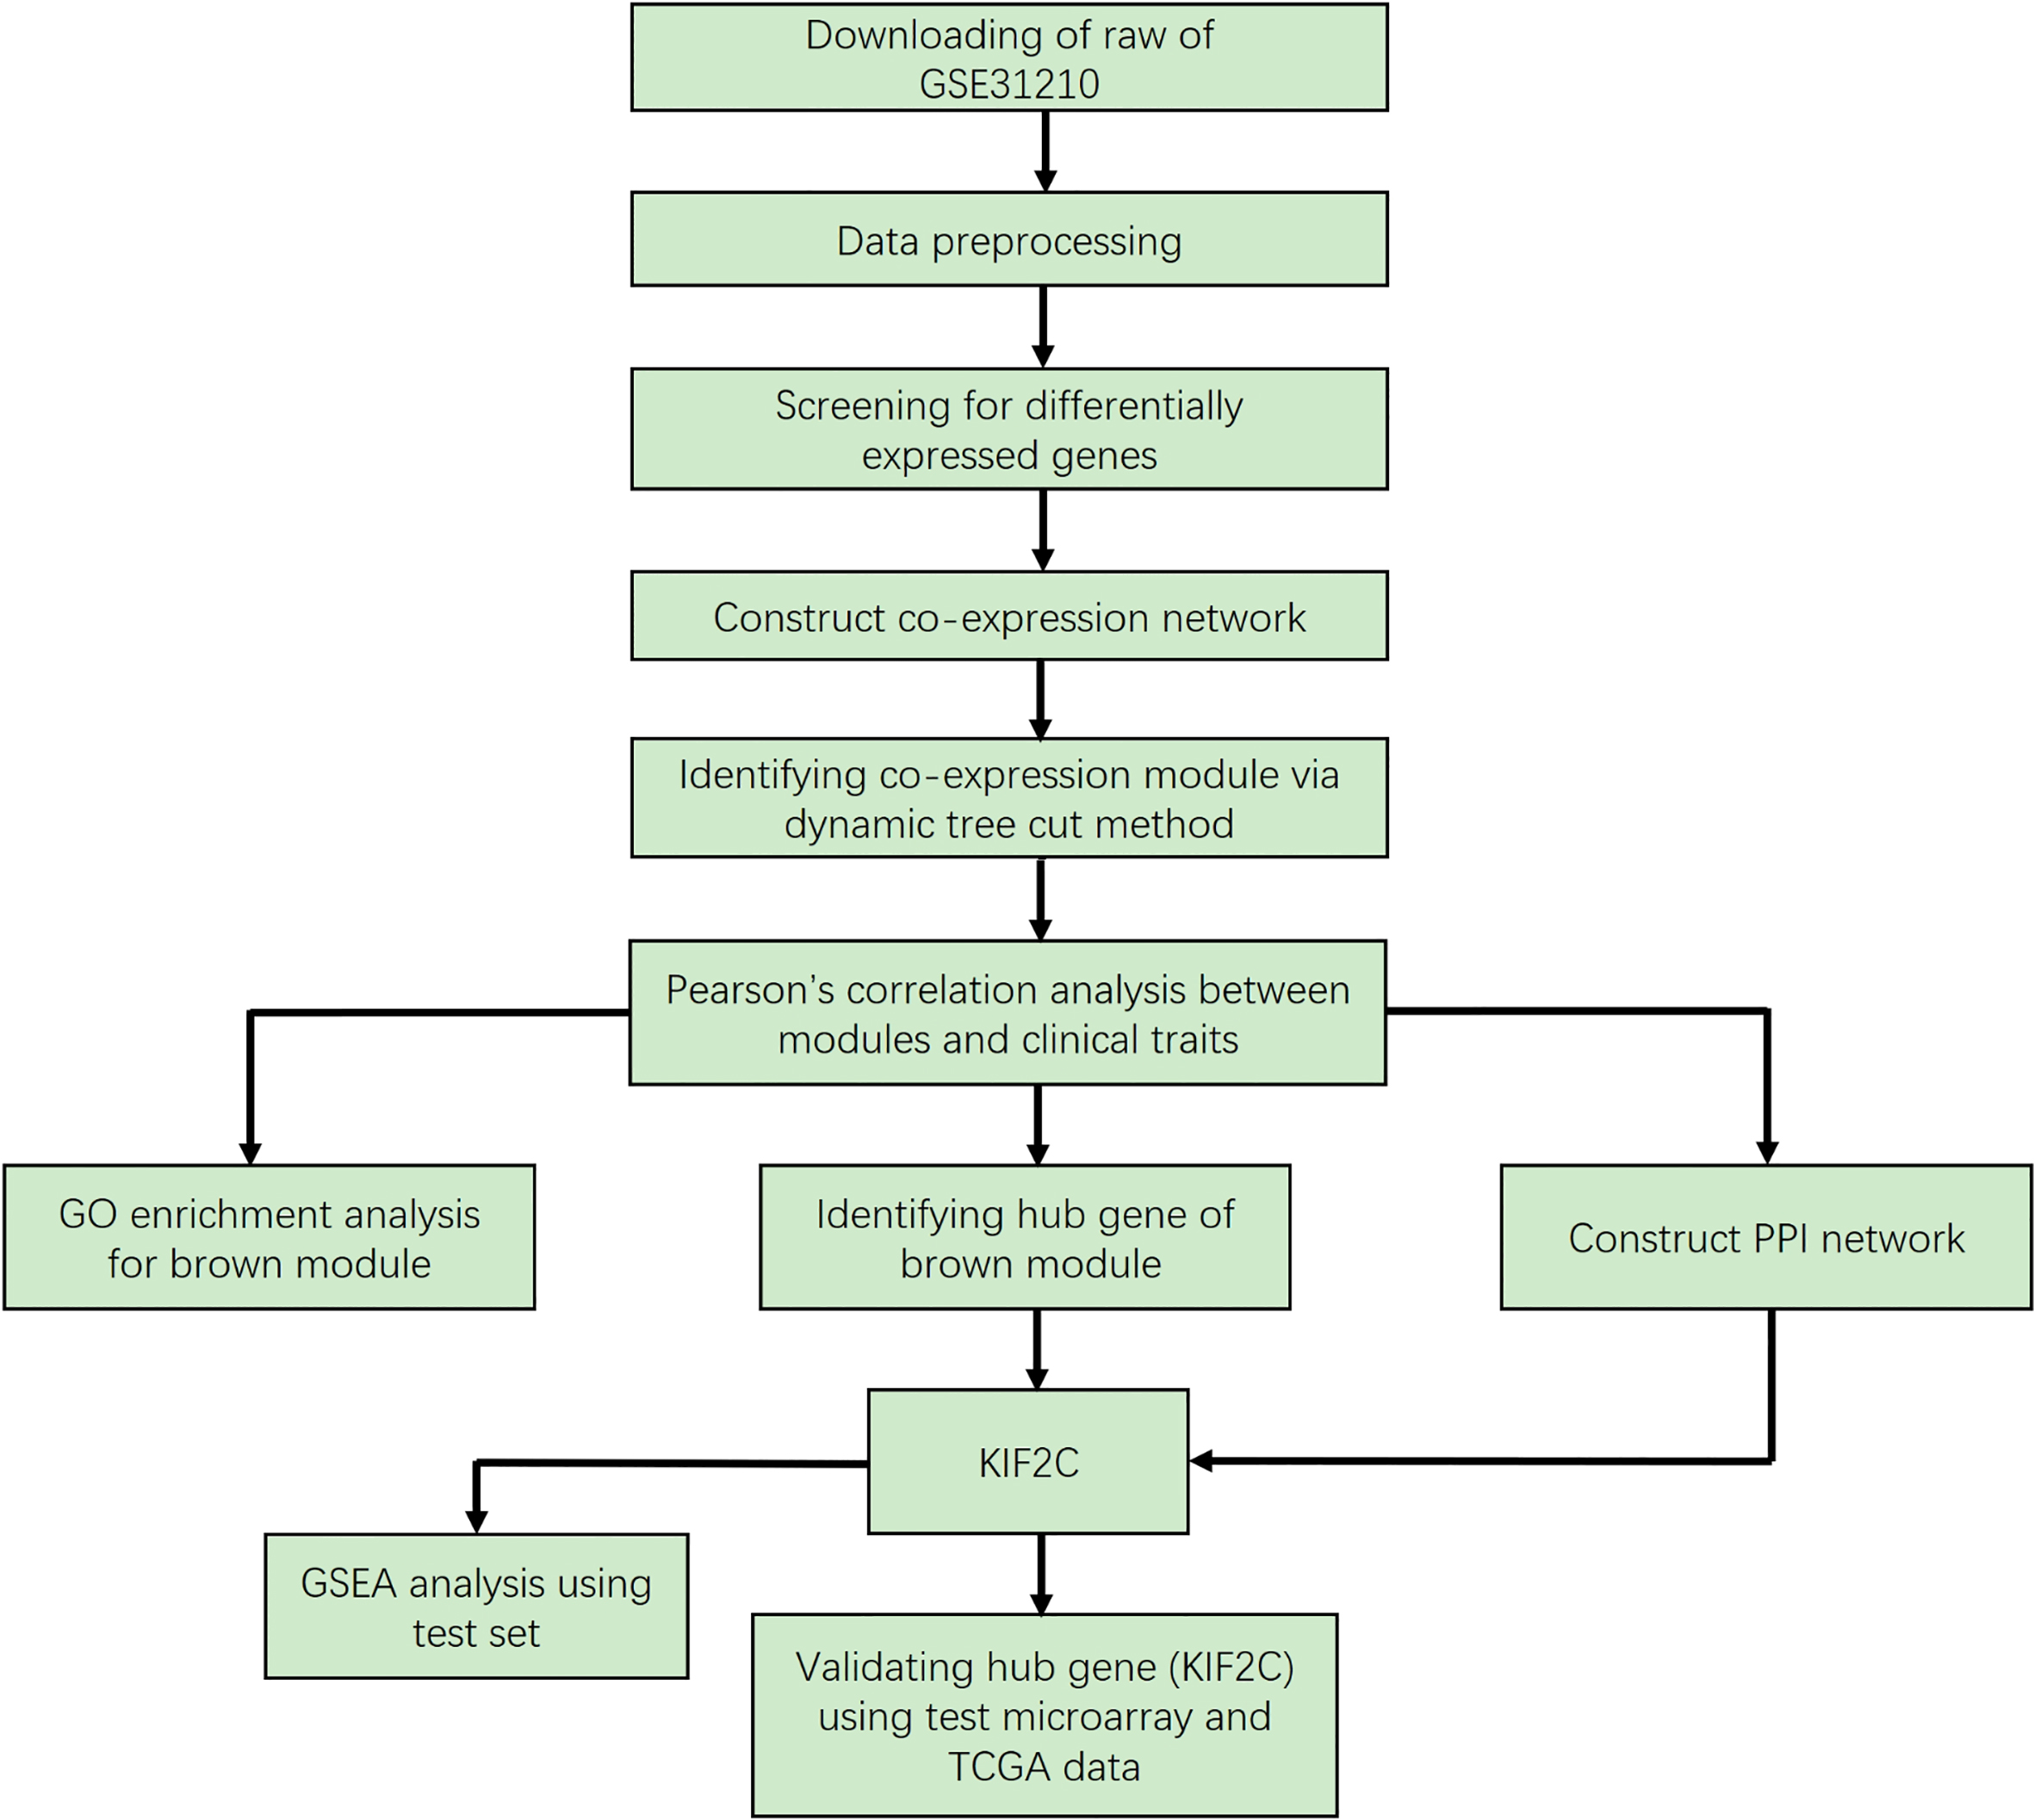
The research workflow is shown in Fig. 1. The LUAD microarray data set was downloaded from the Gene Expression Omnibus (GEO) database (http:// www.ncbi.nlm.nih.gov/geo/). Data set GSE31210 [13] performed on Affymetrix Human Genome U133 Plus 2.0 Array (Affymetrix, Santa Clara, CA, USA) was used to construct a co-expression network and to identify hub genes in this study. The dataset includes 226 LUAD and 20 normal lung tissues. And the clinical information as following: different histological staging (I-II), smoking status (ever-smoker or never-smoker), recurrence (yes or no) and death (yes or no). Another independent data set, GSE40791 [14], was also downloaded from GEO and used to verify our results. This dataset includes 100 non-tumor lung tissues and 94 LUAD with different tumor stages (I-III).
Flow chart of data preparation, processing, analysis and validation in this study.
Data preprocessing
The original microarray data was subjected to RMA background and log2 transformations and then normalized by quantile. Median-polish probesets were summarized by using the “Affy” R package [15]. At last, probes were annotated by the Affymetrix annotation files. Microarray quality was assessed by sample clustering according to the distance between different samples in Pearson’s correlation matrices and average linkage.
Differentially expressed genes (DEGs) screening
Differentially expressed data between normal lung tissues and LUAD tissues were screened using the “limma” R package [16]. The significance analysis of microarrays with false discovery rate (FDR) 0.05 and log2 fold change (FC) 1.5 was used to screen for genes that require further consideration in network construction.
Co-expression network construction
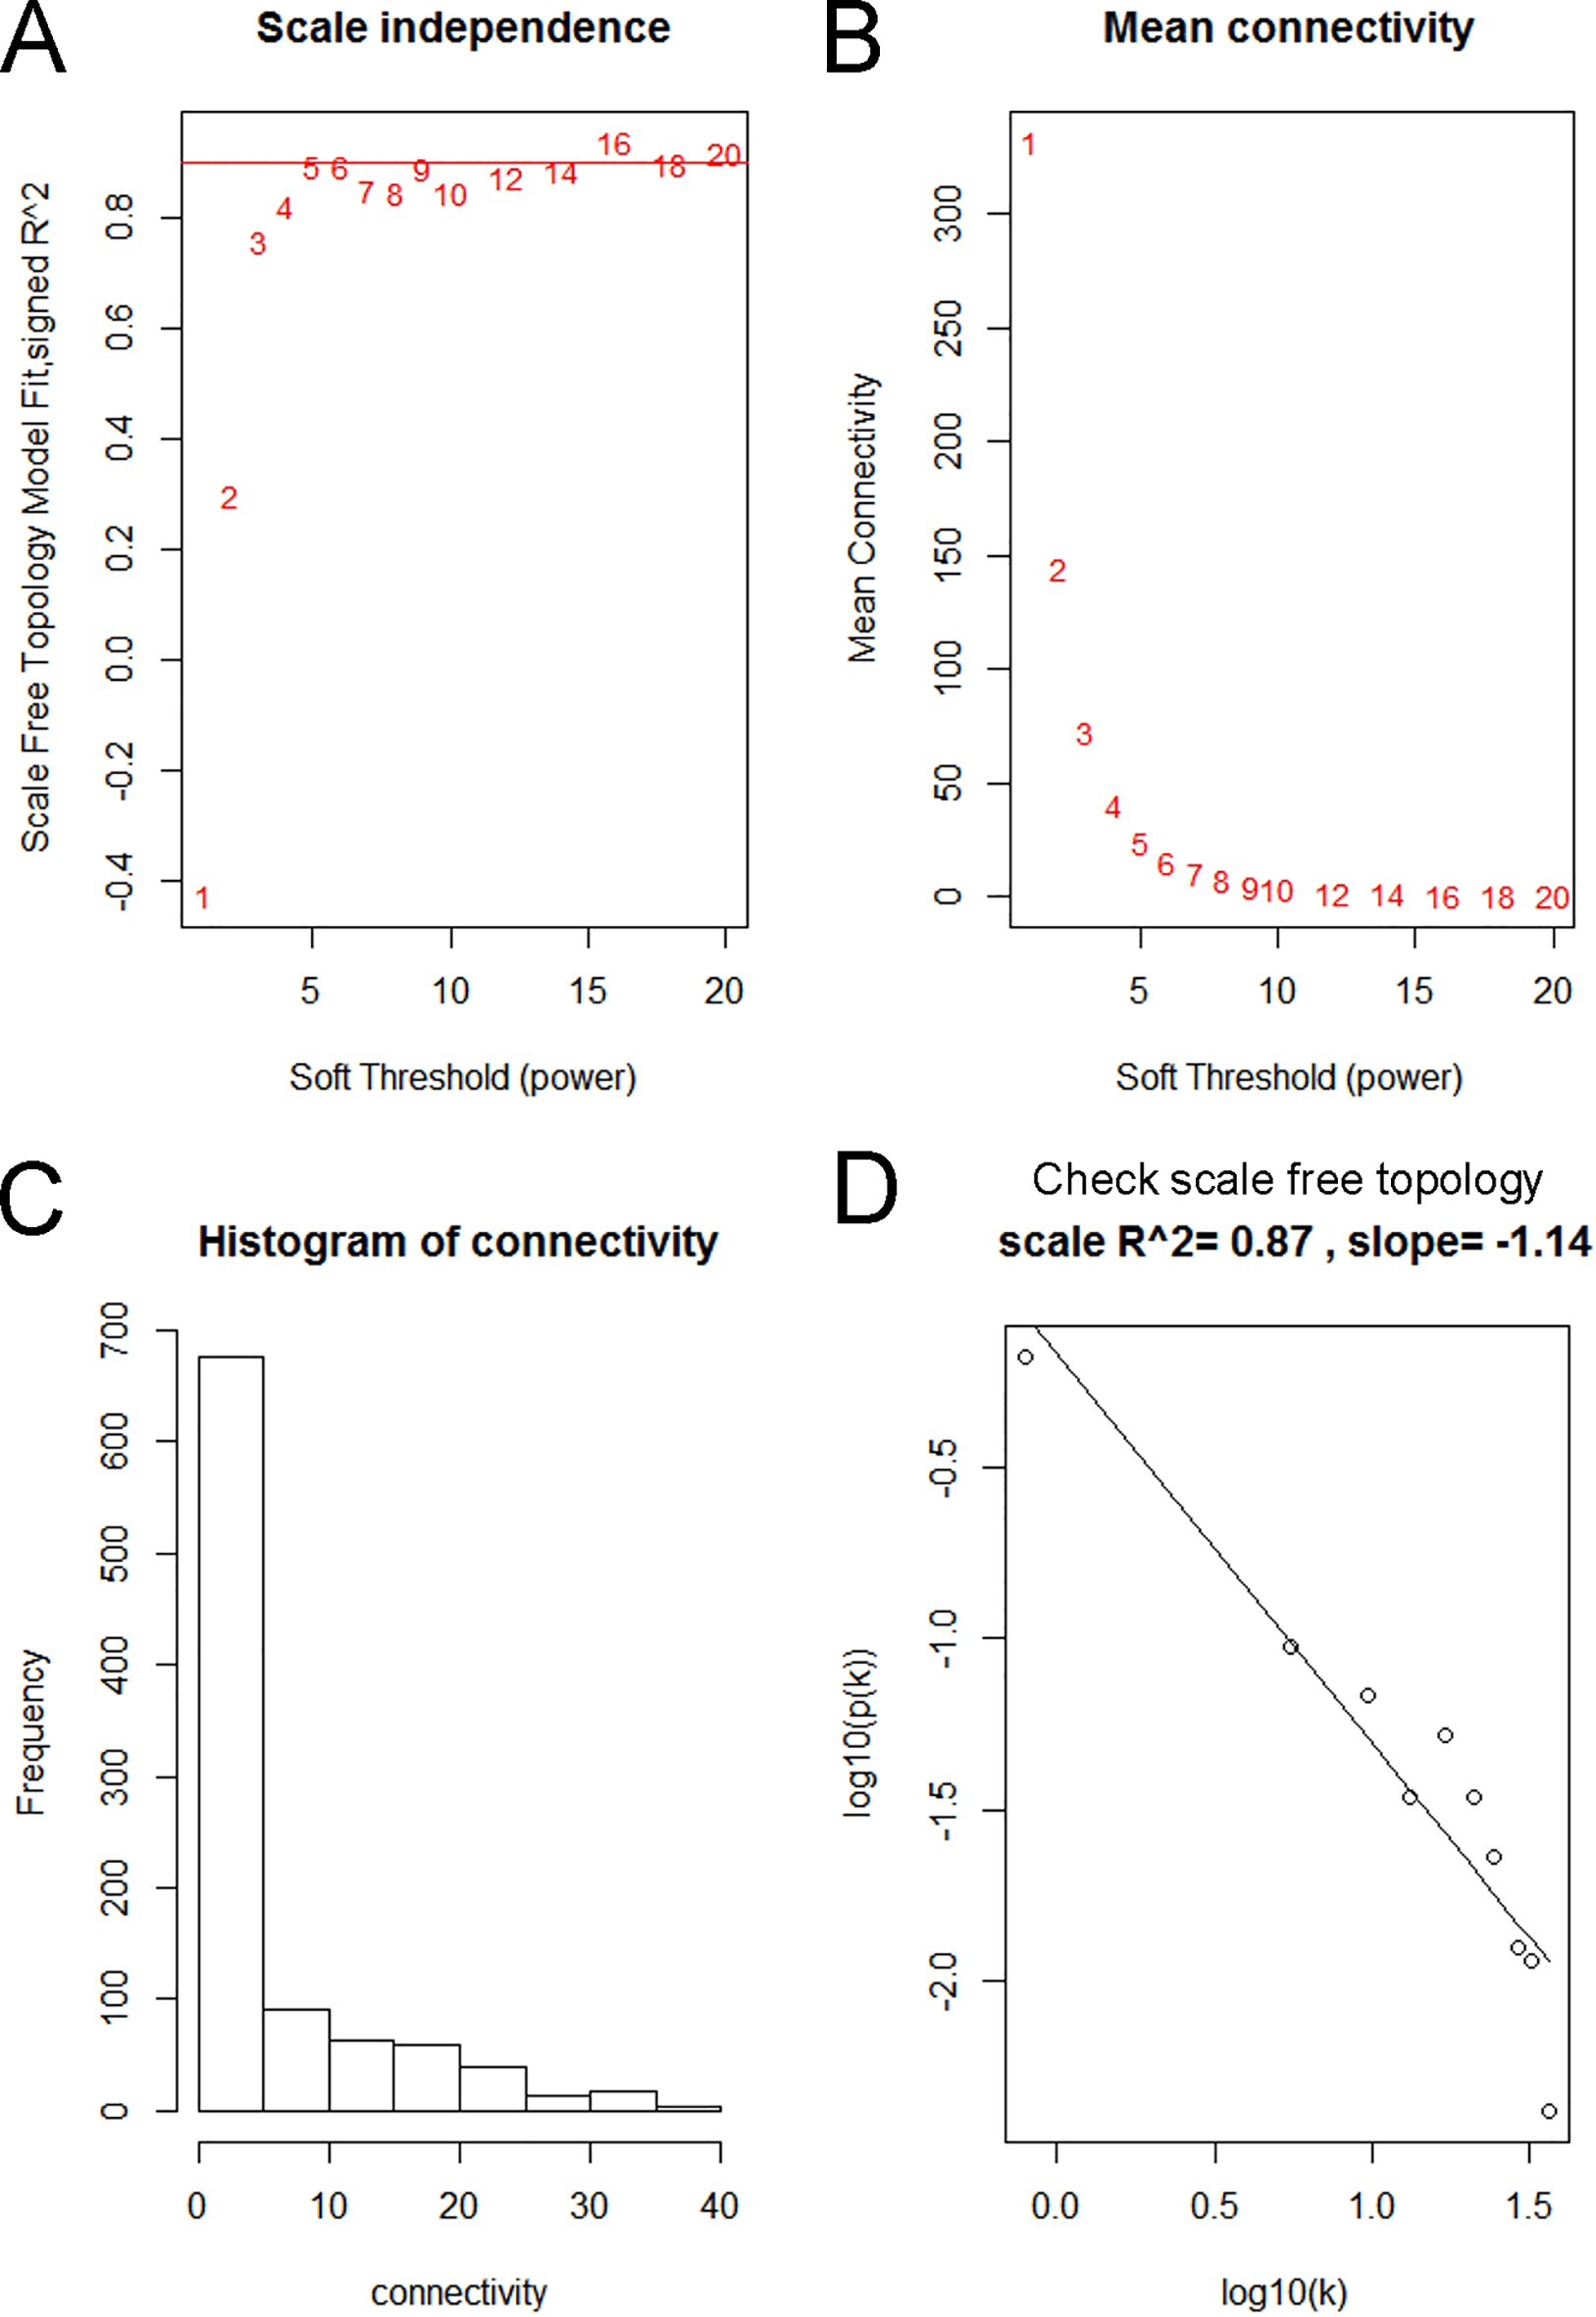
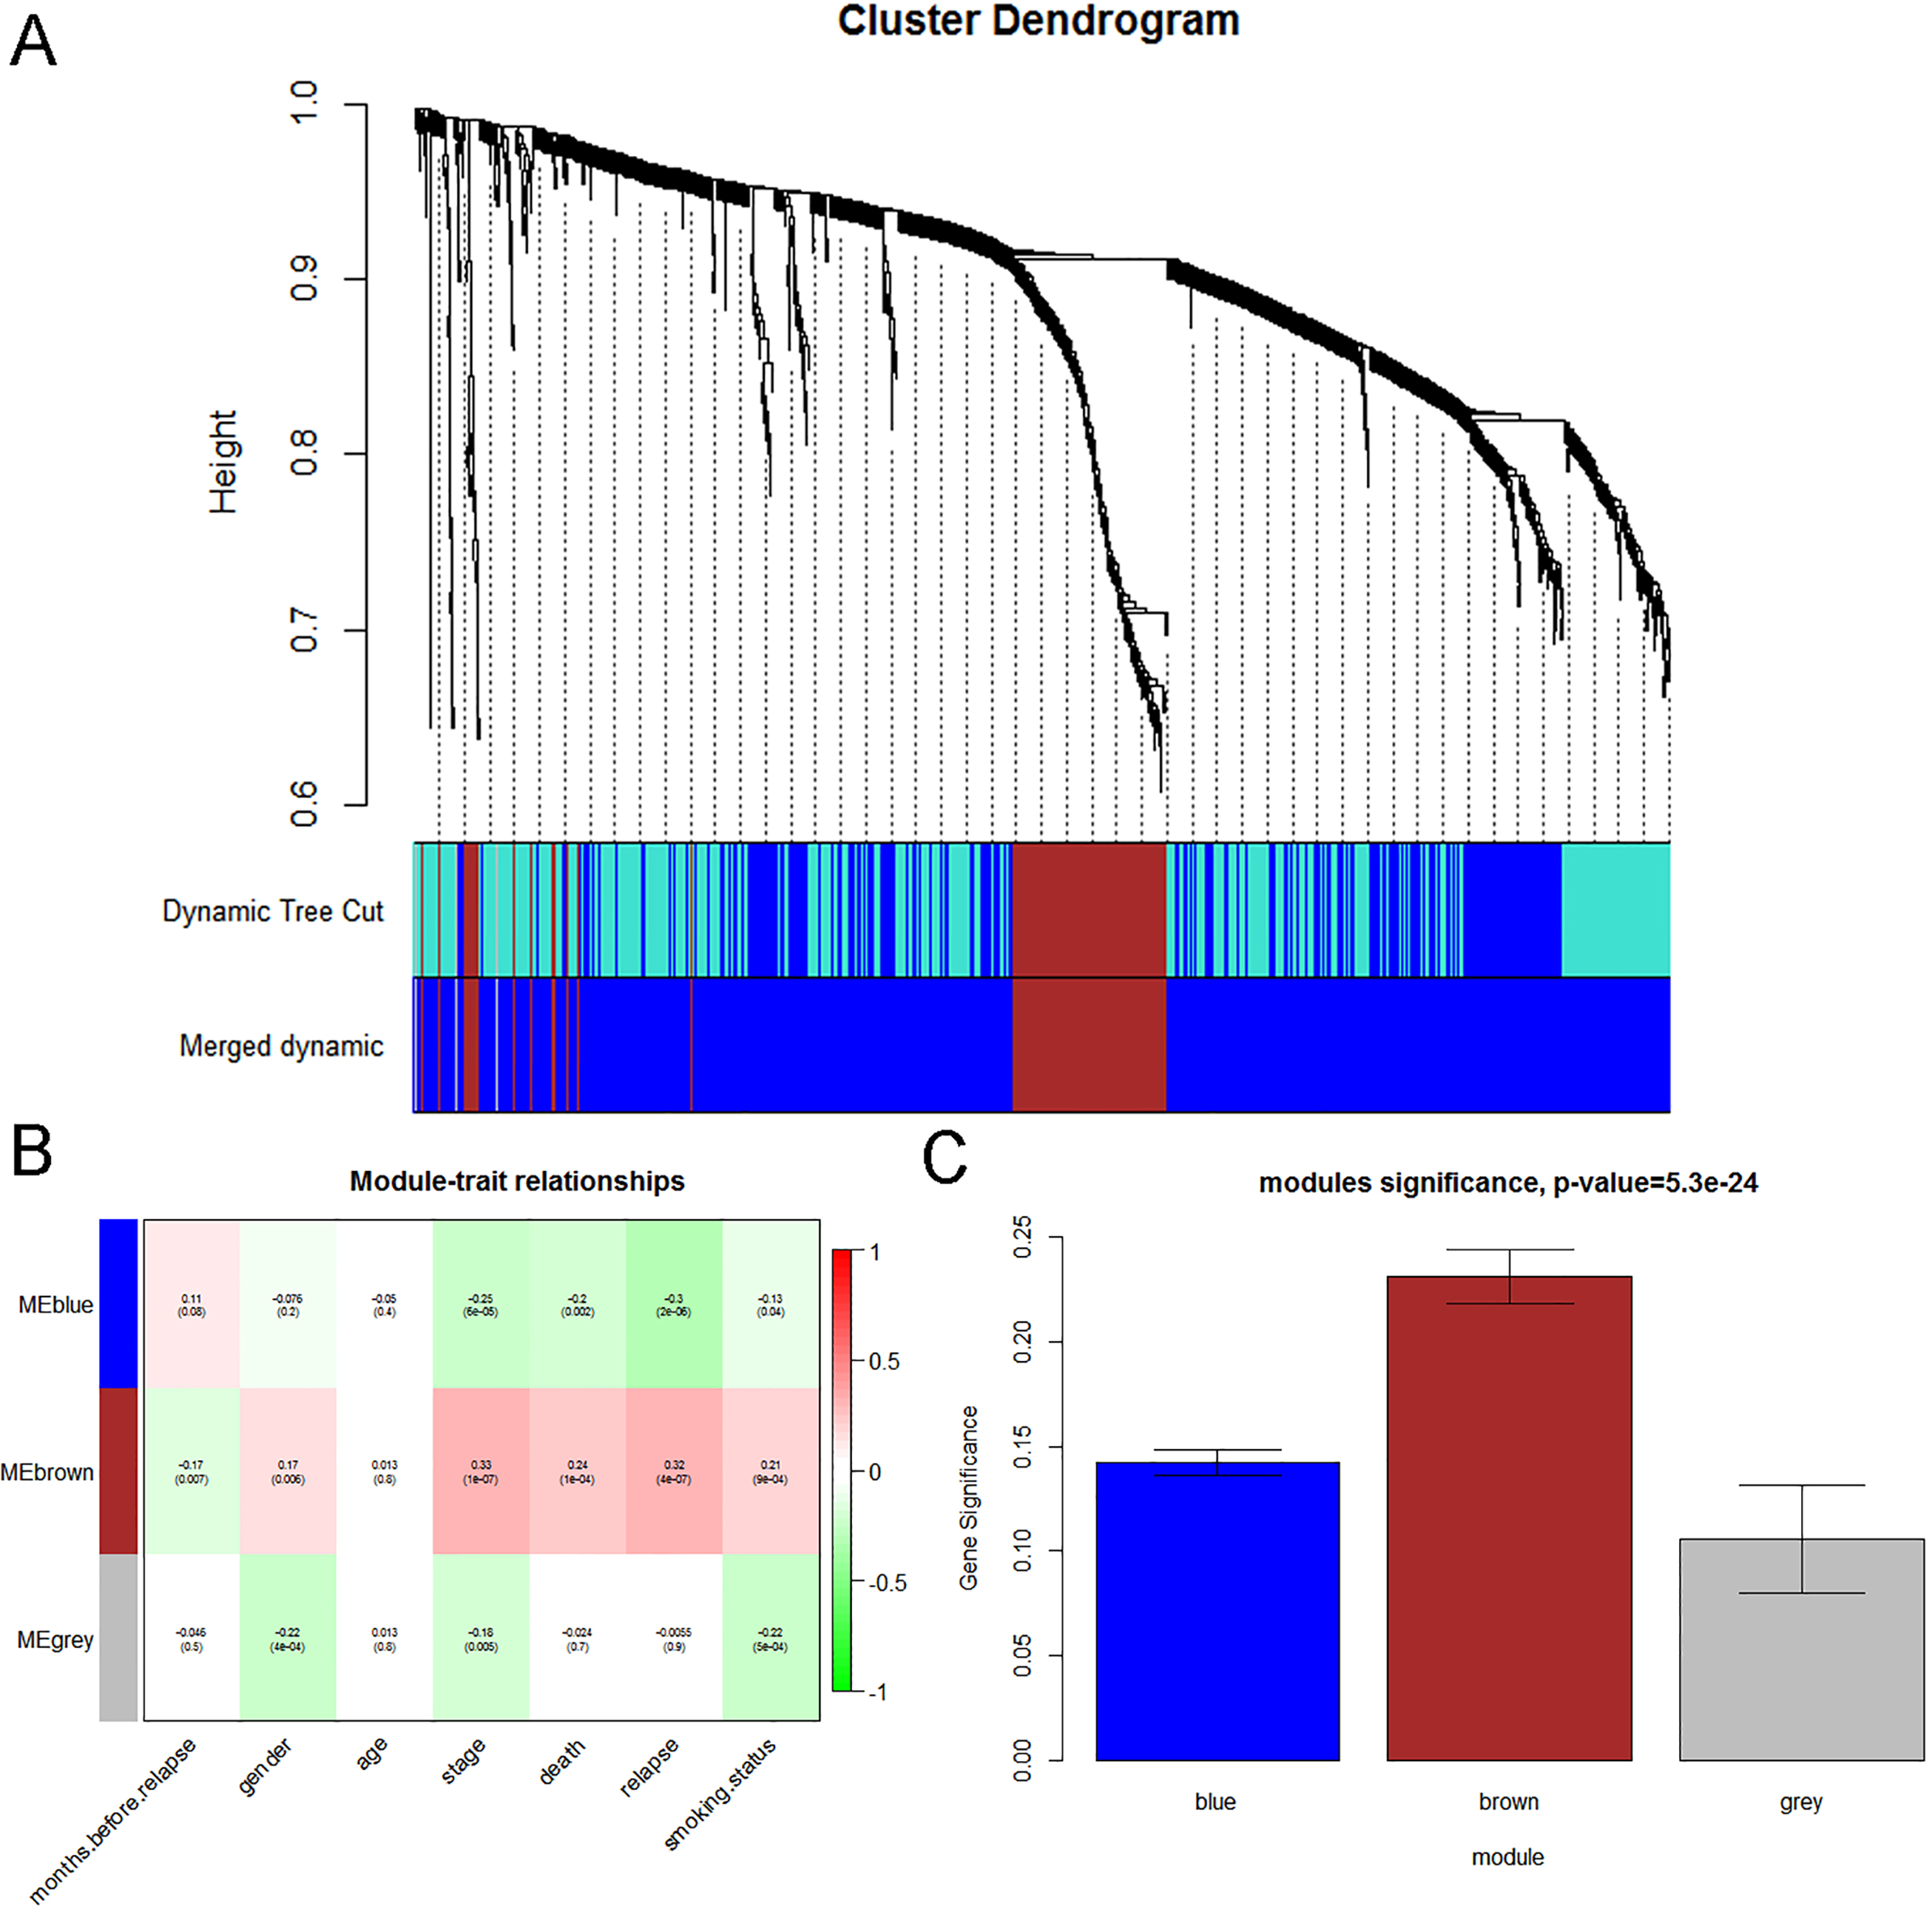
First, we examined the expression data characteristics of DEGs and observed whether it is necessary to exclude outlier samples and genes. The co-expression network of DEGs was then constructed using the “WGCNA” R package [17, 18]. The Pearson’s correlation matrices were both performed for all pair-wise genes. Then, a weighted adjacency matrix was constructed using a power function ( Pearson’s correlation between gene and gene ; adjacency between gene and gene ). was a soft-thresholding parameter that could emphasize strong correlations between genes and penalize weak correlations. Here, 5 (scale-free R = 0.87) was used to ensure scale-free network (Fig. 3). After that, the adjacency matrix was transformed into topology overlay matrix (TOM) [19]. To classify genes with similar expression profiles into gene modules, average linkage hierarchical clustering was conducted according to the TOM-based dissimilarity measure. To further analyze the module, we calculated the dissimilarity of the module information, selected a tangent for the module tree, and merged some of the modules.
Identification of clinical significant modules
Two approaches were used to identify modules related with the progression of LUAD. First, Gene significance (GS) was defined as the log10 transformation of the P value (GS lgP) in the linear regression between gene expression and pathological stage. In addition, module significance (MS) was defined as the average GS for all the genes in a module. Module eigengenes (MEs) were considered as the major component in the principal component analysis for each gene module and the expression patterns of all genes could be summarized into a single characteristic expression profile within a given module. In addition, we calculated the correlation between MEs and clinical trait to identify the relevant module.
Analysis and validation of hub gene
In our study, hub genes were defined by module connectivity, measured by absolute value of the Pearson’s correlation (cor.geneModuleMembership 0.8) and clinical trait relationship, measured by absolute value of the Pearson’s correlation (cor.geneTraitSignificance 0.2). To screen for the key candidates in the hub gene, a linear regression analysis was performed to calculate the relationship between hub gene expression and clinical information. In addition, we uploaded all the genes into the STRING database [20] to construct a protein-protein interaction (PPI) network to screen the central node. To validate our results, we used clinical information in microarray data to explore the correlation between hub gene expression and clinical characteristics of LUAD. The Oncomine database and test set GSE40791 were used to detect the expression of the hub gene in LUAD. In addition, the Gene Expression Profiling Interactive Analysis (GEPIA) database (http://gepia.cancer-pku.cn/) was used to verify the progress and prognosis of candidate hub genes [4].
Functional enrichment analysis
The Database for Annotation, Visualization and Integrate Discovery (DAVID) database [21] (http://david. abcc.ncifcrf.gov/) is an online program that provides a comprehensive set of functional annotation tools for investigators to understand biological meaning behind large list of genes. Hub genes in hub module were uploaded to screen enriched Gene Ontology (GO) terms by using DAVID database. 0.05 and FDR 0.01 was set as the cut-off criteria.
Gene set enrichment analysis (GSEA)
194 samples from the training set were divided into two groups (high and low) based on the expression level of KIF2C and the median was used as the cut-off point. In order to figure out potential function of KIF2C, GSEA (http://software.broadinstitute.org/gsea/ index.jsp) [22, 23] was performed between the two groups. Annotated gene sets c2.cp.kegg.v6.0.symbols. gmt was chosen as the reference gene sets. FDR 0.05, enrichment score (ES) 0.5 and gene size 35 were set as the cut-off criteria.
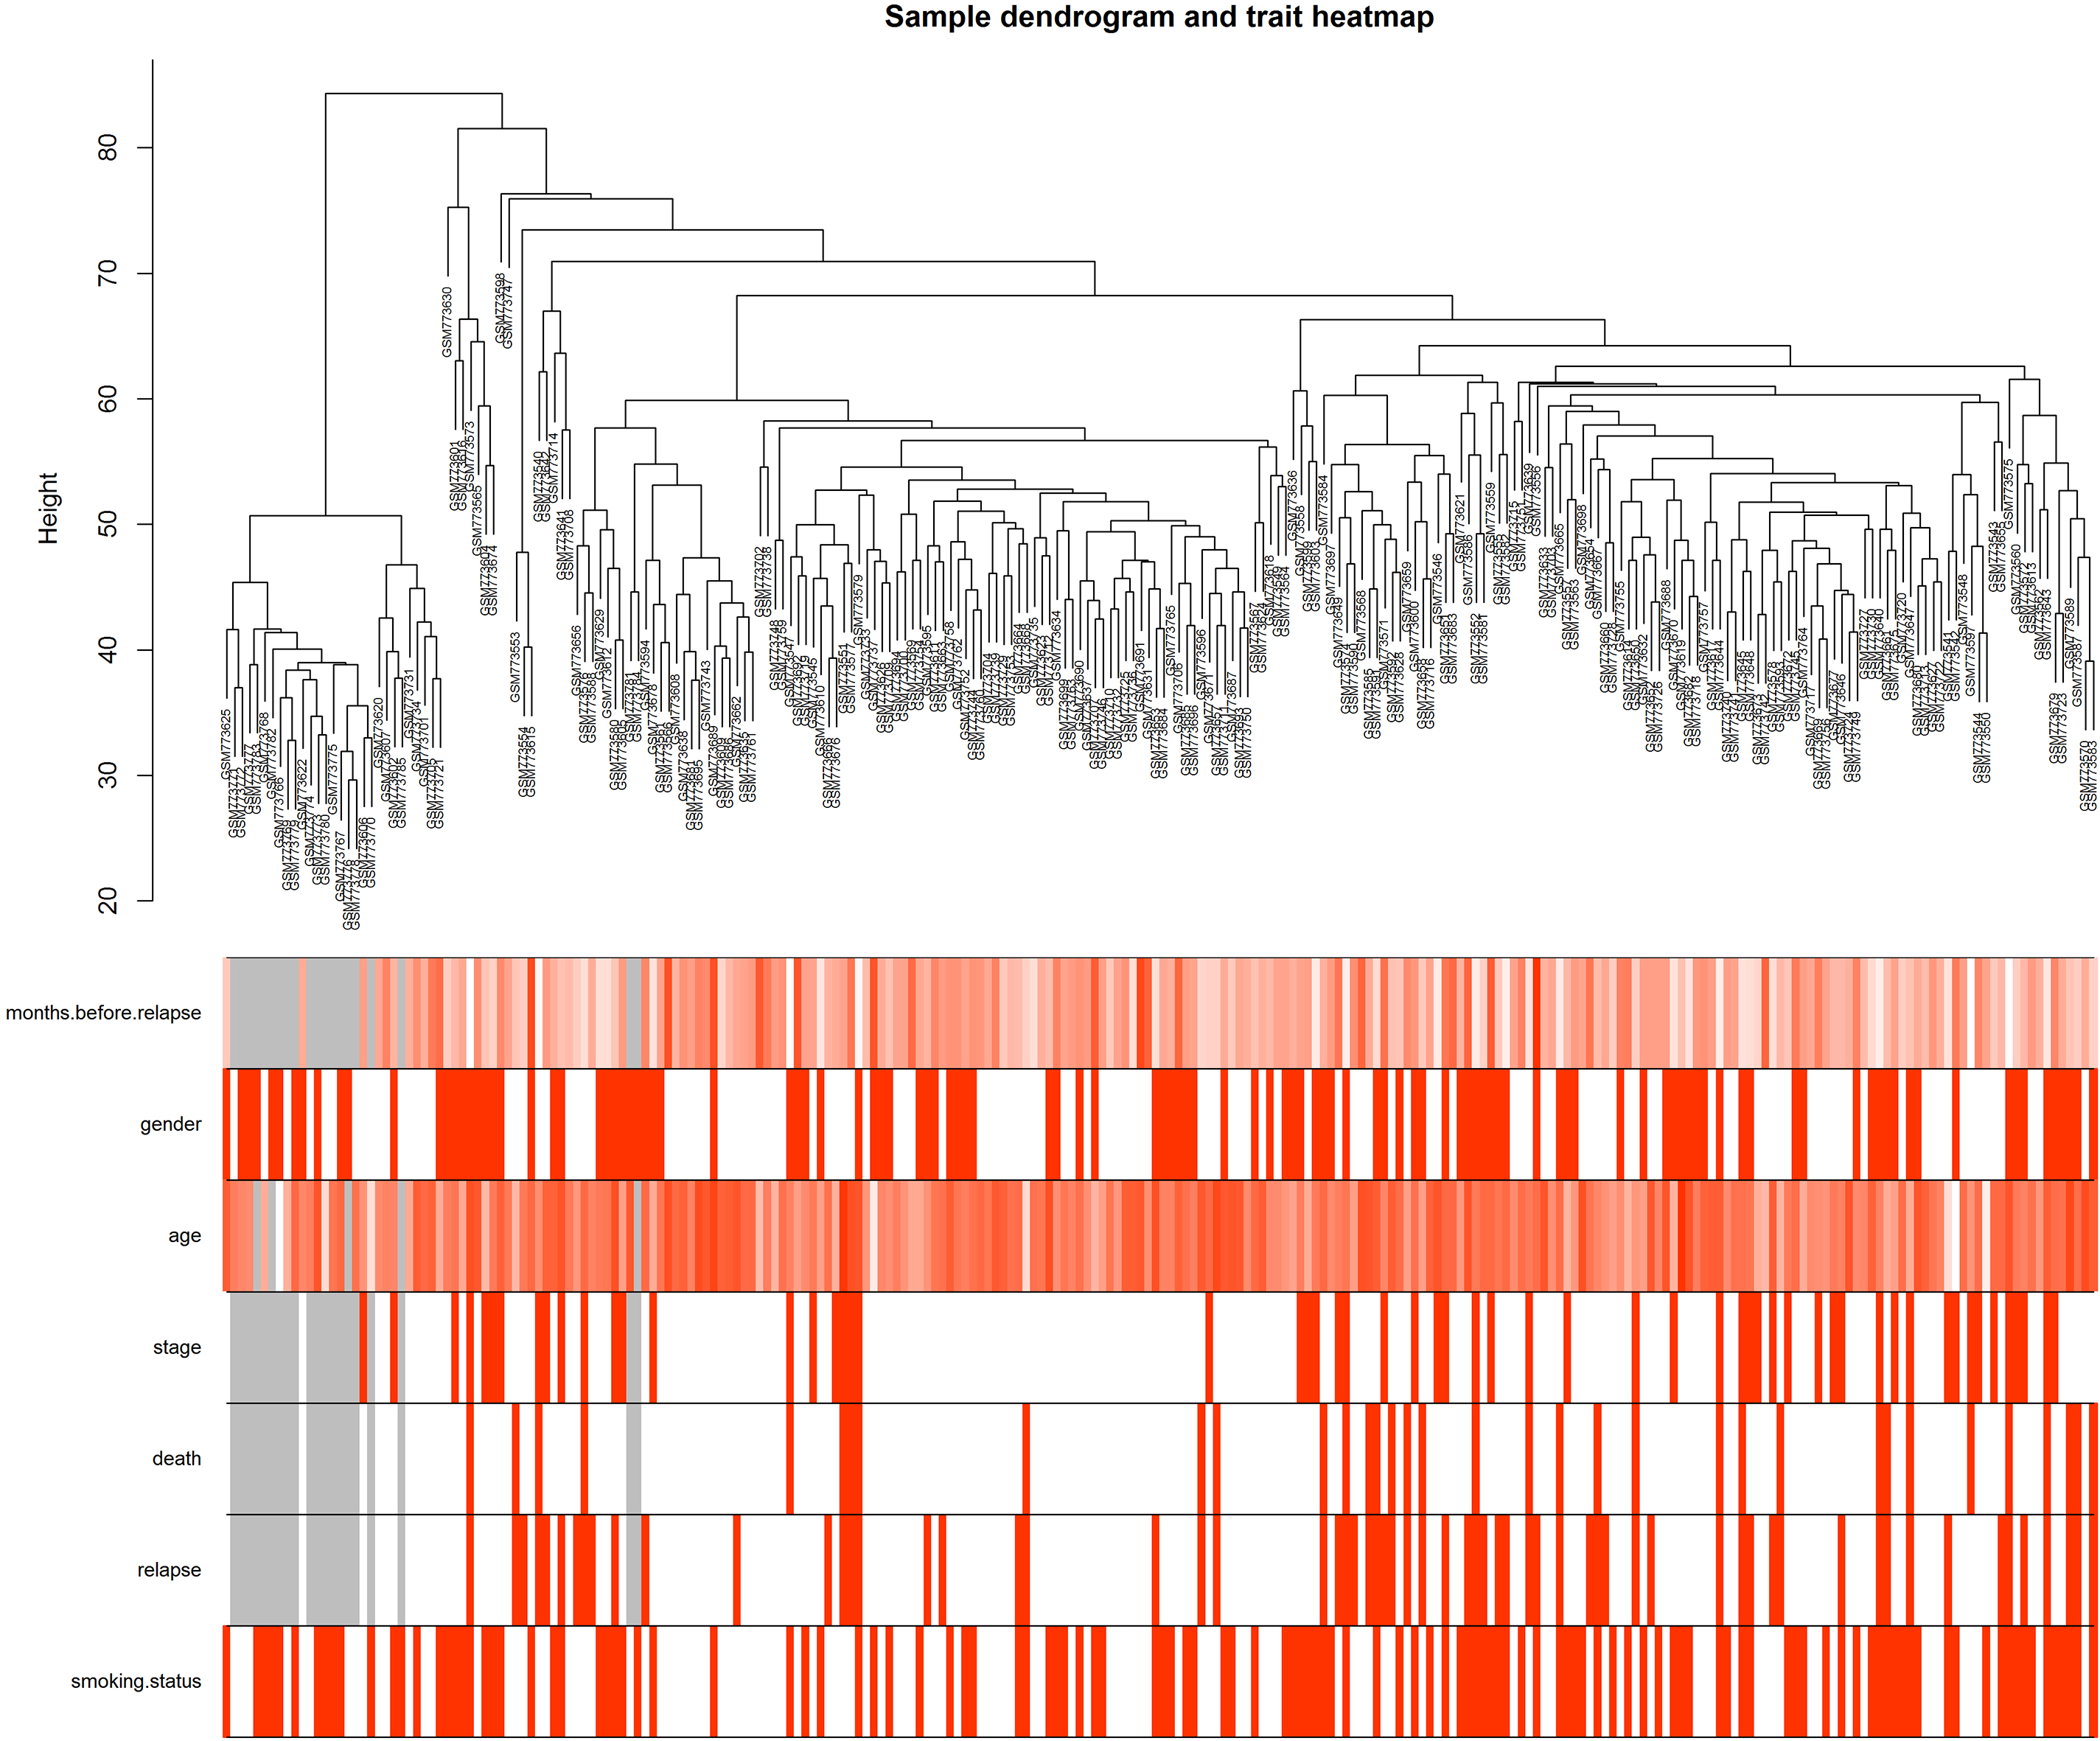
Clustering dendrogram of GSE31210 and the clinical traits. The clustering was based on the expression data of differentially expressed genes between tumor samples and non-tumor samples in LUAD. The red color represented relapse and female. The color intensity was proportional to older age as well as stage, smoking status.
Result
Differentially expressed genes screening
After excluding the abnormalities, the gene profile of 246 samples was analyzed (Fig. 2). Under the screening conditions of FDR 0.05 and logFC 1.5, a total of 965 differential genes (572 up-regulated, 393 down-regulated LUAD) were selected for follow-up analysis.
Weighted co-expression network construction and key modules identification
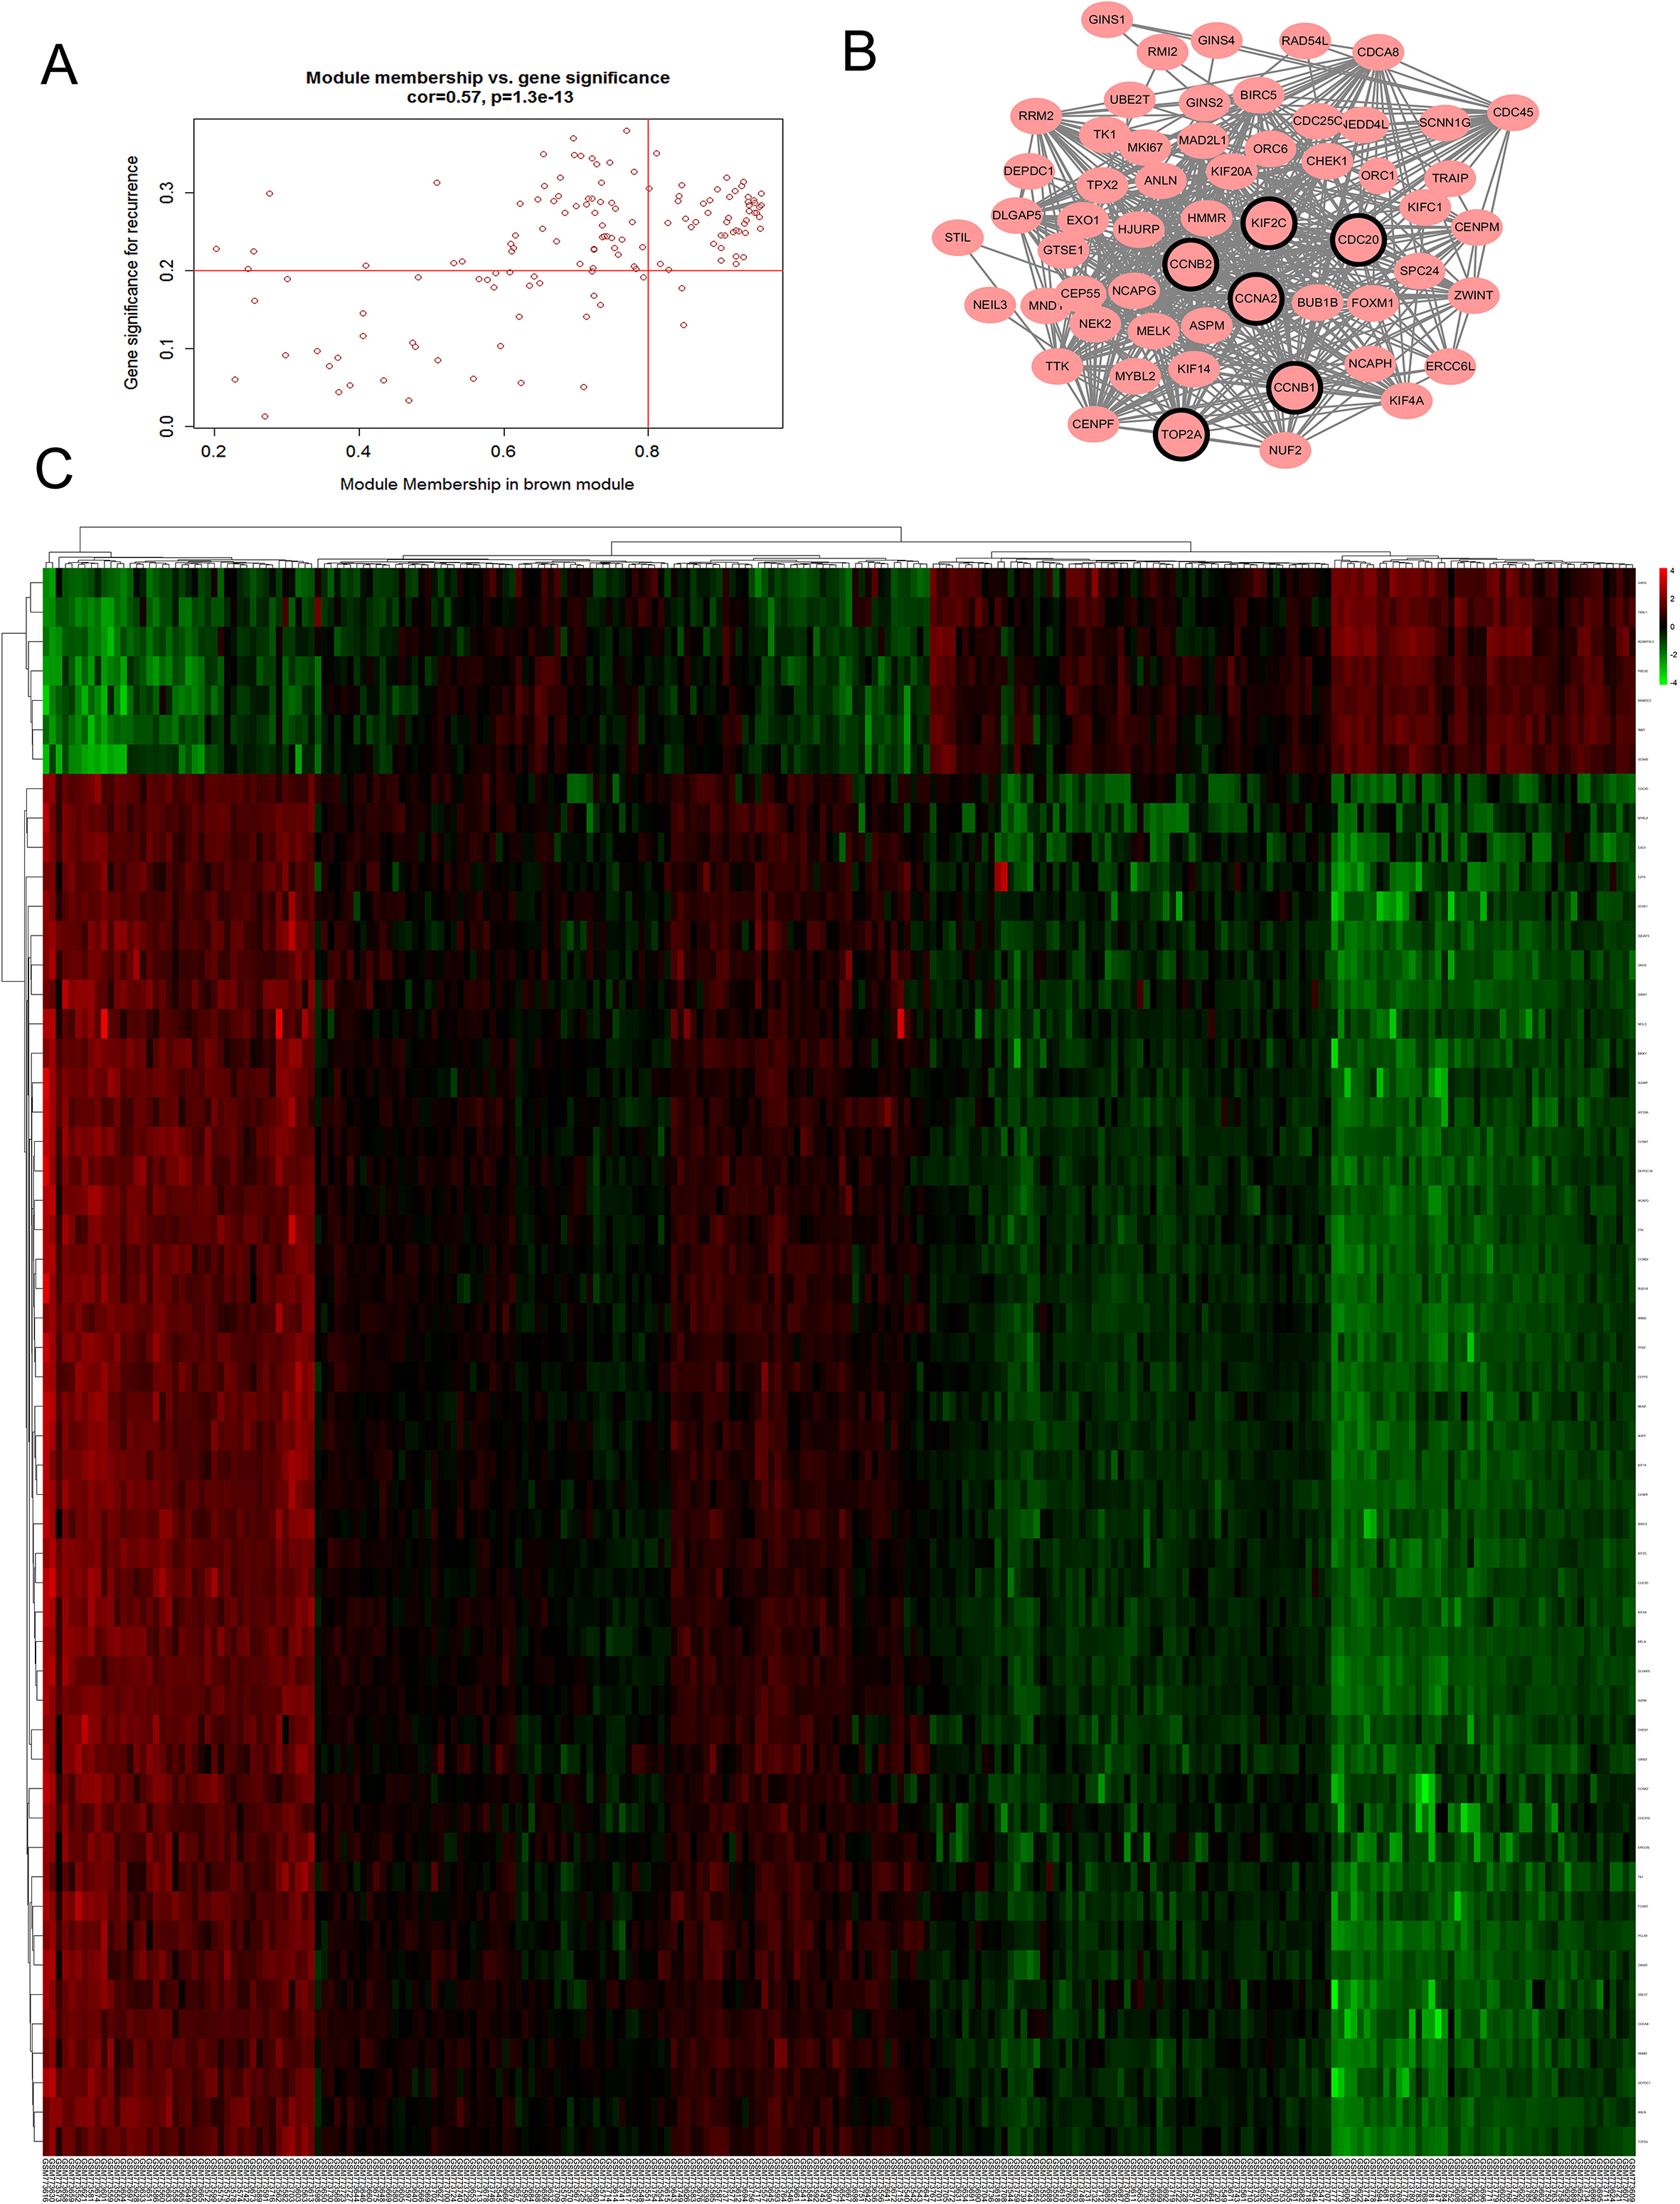
We used “WGCNA” R package to put the DEGs with similar expression patterns into modules by average linkage clustering. In current study, the power of 5 (scale free 0.87) was selected as the soft-thresholding to ensure a scale-free network (Fig. 3), and a total of 3 modules were identified (Fig. 4A). Two methods were used to test the relevance between each module and the clinical information. We found that the ME in the brown module showed a higher correlation with LUAD stage than other modules (Fig. 4B). As modules with greater MS were considered to have more connection with our concerned clinical information, we found that the MS of brown module was also higher than those of any other MS (Fig. 4C). Based on the two methods, we identified the brown module was the module most relevant to the disease progression of LUAD.
Determination of soft-thresholding power in the weighted gene co-expression network analysis (WGCNA). (A) Analysis of the scale-free fit index for various soft-thresholding powers (). (B) Analysis of the mean connectivity for various soft thresholding powers. (C) Histogram of connectivity distribution when 5. (D) Checking the scale free topology when 5.
Hub gene identification
Defined by module connectivity, measured by absolute value of the Pearson’s correlation (cor.geneModule Membership 0.8) and clinical trait relationship, measured by absolute value of the Pearson’s correlation (cor.geneTraitSignificance 0.2), 54 genes with the high connectivity in brown module were taken as hub genes (Fig. 5A–C). In addition, we also constructed a PPI network for all genes in the brown module by Cytoscape [24] based on the STRING database (https://string-db.org/) (Fig. 5B). And six genes with a degree of centrality over 35 were identified as hub genes in the PPI network. We found that all six genes were contained in 54 genes with high connectivity (Table 1). The six consensus hub genes (KIF2C, CCNB2, CDC20, TOP2A, CCNB1 and CCNA2) in the co-expression and PPI network are considered “real” hub genes for further validation.
Hub genes in the module related with pathological stage
Symbols
Probe
cor.geneModuleMembership
Hub gene in
DEG analysis
PPI network
logFC
FDR
KIF2C
209408_at
0.955121
Yes
1.771095
1.50E-10
CCNB2
202705_at
0.947118
Yes
1.976688
2.55E-09
CDC20
202870_s_at
0.937495
Yes
1.625766
1.39E-07
TOP2A
201291_s_at
0.931434
Yes
2.621412
1.51E-13
CCNB1
214710_s_at
0.931292
Yes
1.563052
1.54E-08
CCNA2
203418_at
0.885054
Yes
2.120177
5.61E-12
Identification of modules associated with clinical information. (A) Dendrogram of all differentially expressed genes clustered based on a dissimilarity measure (1-TOM). (B) Heatmap of the correlation between module eigengenes and different clinical information of LUAD (Month before relapse, Gend, Age, Stage, Death, Relapse and Smoking status). (C) Distribution of average gene significance and errors in the modules associated with the progression of LUAD.
Hub genes detection and protein-protein network. (A) Scatter plot of module eigengenes in brown module. (B) Protein-protein interaction (PPI) network of genes in the brown module. The positive correlation in red and negative correlation in green, in our PPI network, there’s no negative correlation node. The nodes with bold circle represented network hub genes identified by degree>35 in PPI. (C) Heatmap of the expression of hub genes in different stages of LUAD.
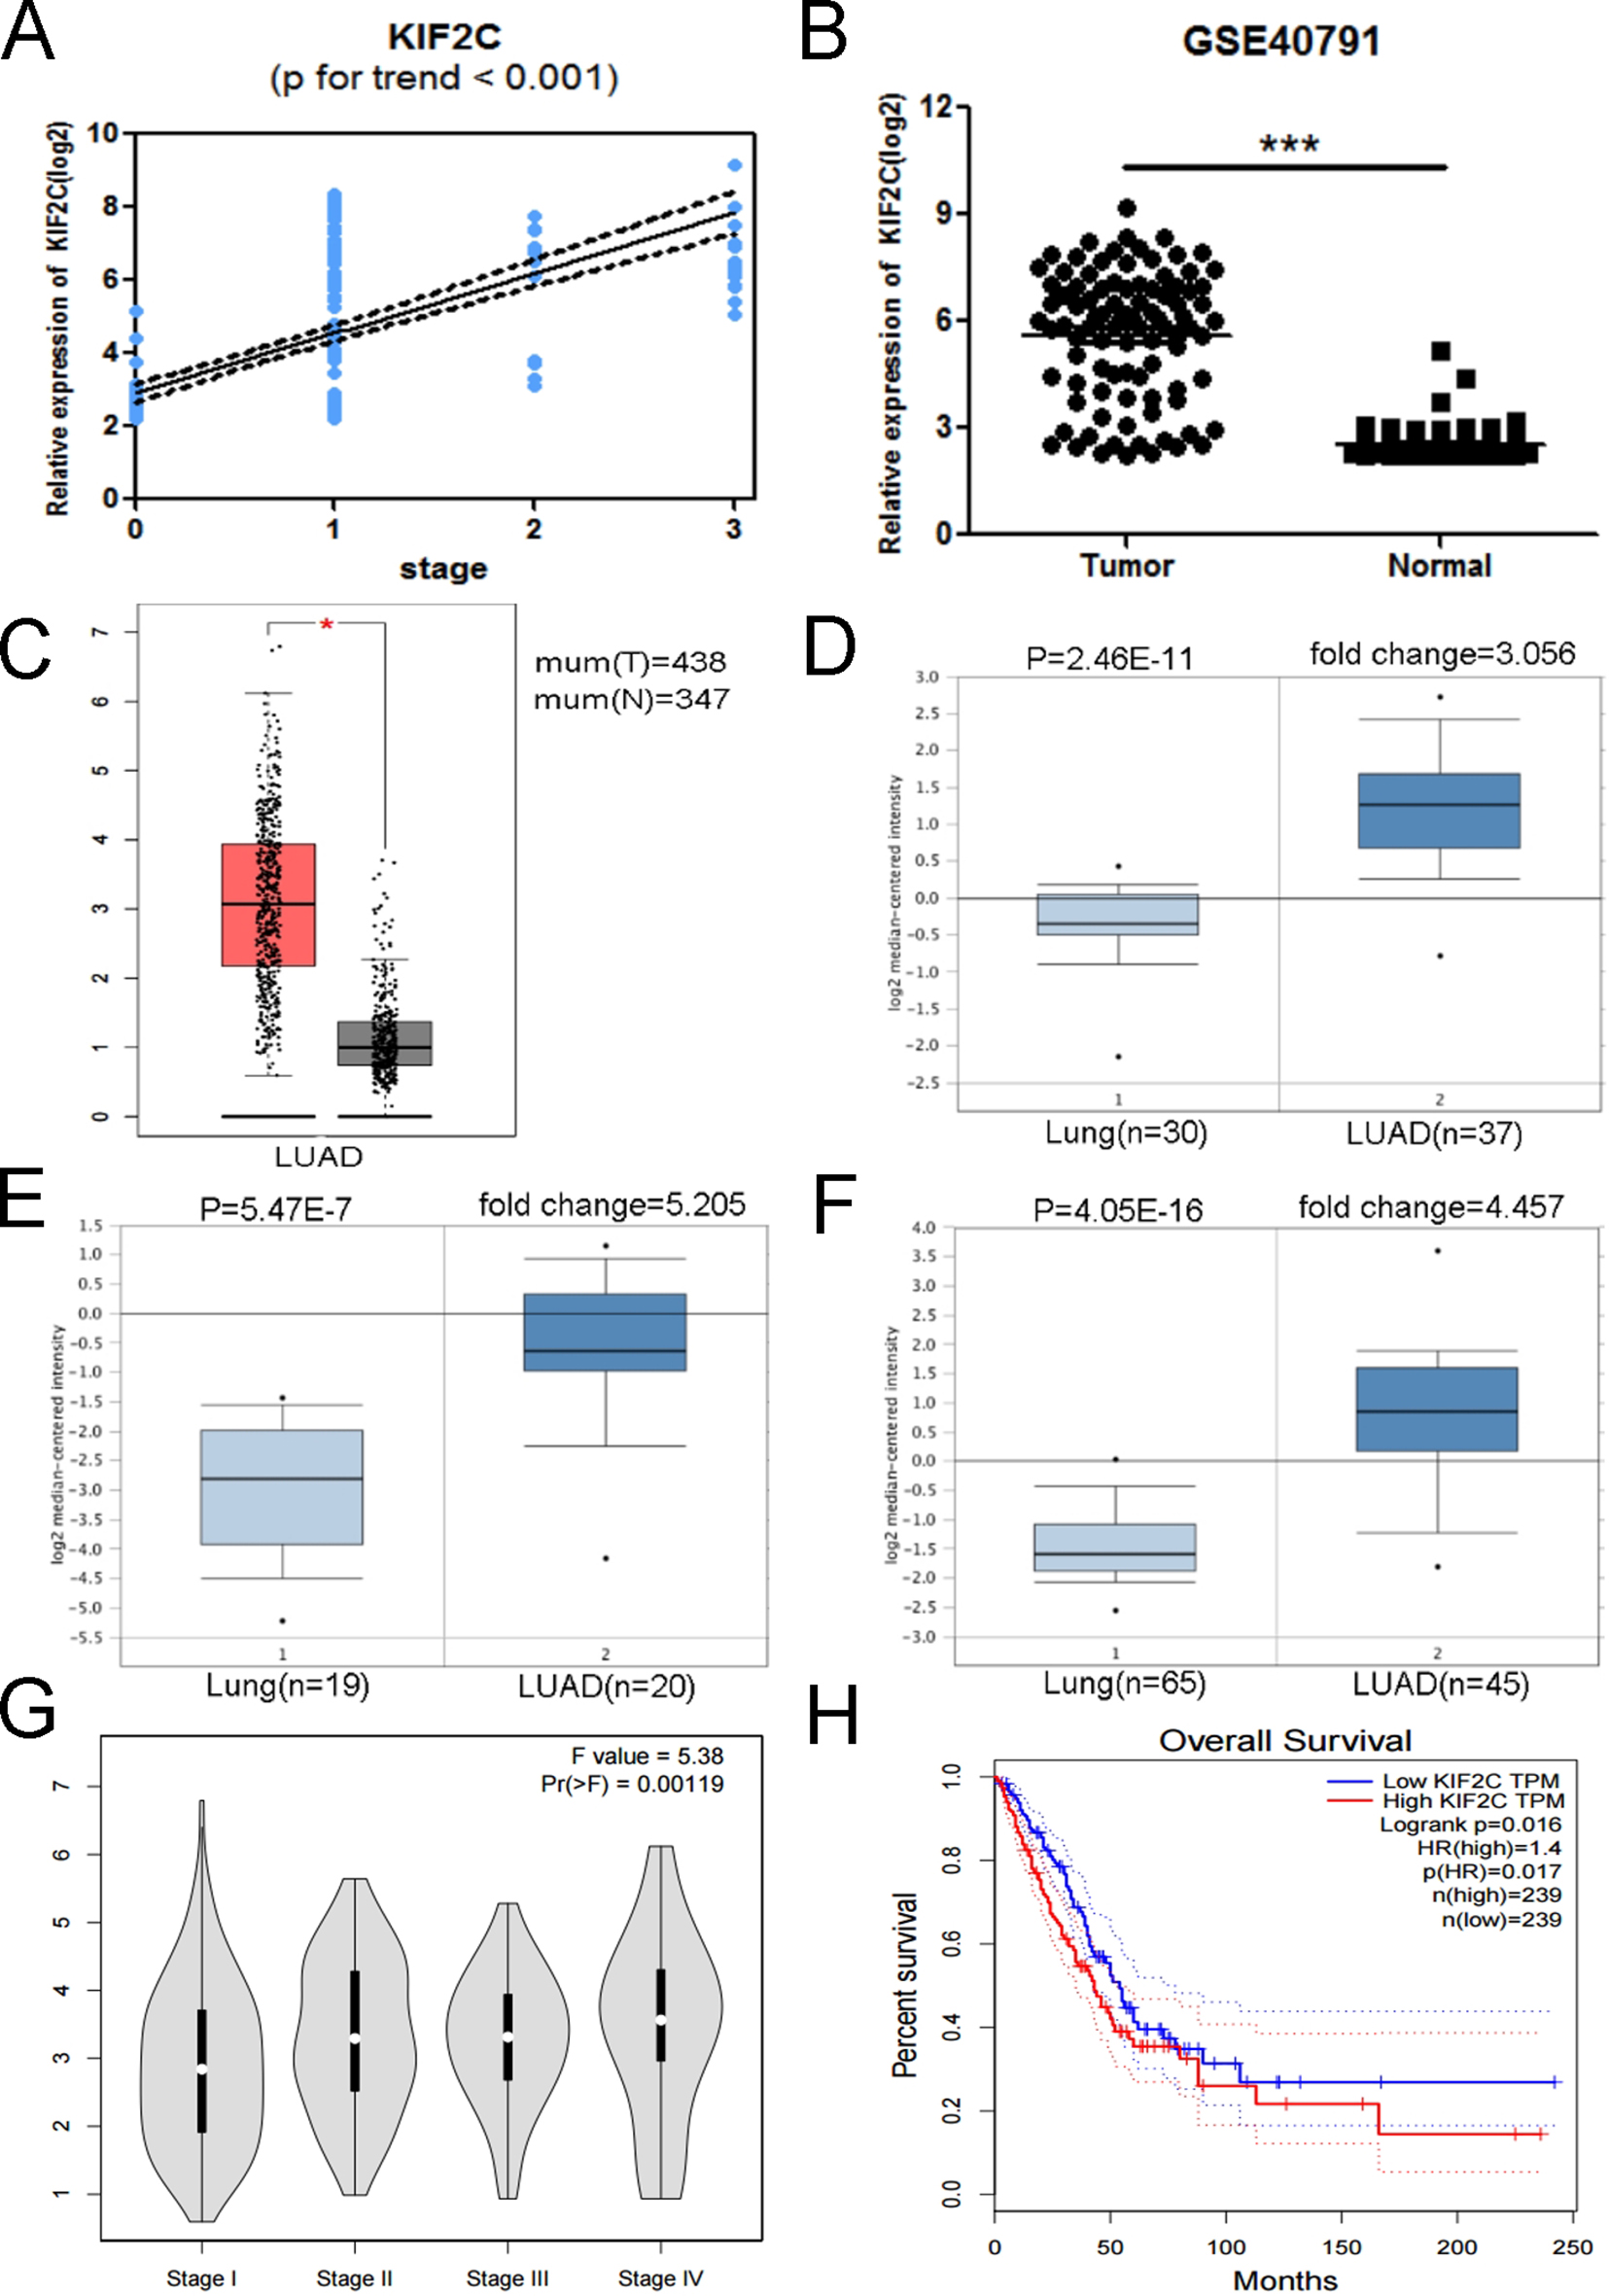
Validation of KIF2C. (A) KIF2C expression was correlated with the disease progression of LUAD (GSE40791). (B) KIF2C mRNA was validated using GSE40791 ( 0.01). (C) Expression level of KIF2C in cancer and normal tissues. LUAD: Lung Adenocarcinoma; 0.05. (D-F) Oncomine database indicated that COL3A1 was up-regulated in LUAD, compared with normal lung tissue. (G) GEPIA database indicated that KIF2C had a strong correlation with the progression of LUAD based on TCGA data. (H) Kaplan-Meier survival curve obtained GEPIA database revealed that LUAD patients with higher expression of KIF2C had a significantly shorter overall survival time.
Correlations between KIF2C expression and clinicopathological parameters in lung adenocarcinoma
Parameter
Category
Expression of KIF2C
value
Low
High
Gender
Female
71
59
0.125
Male
52
64
Age
65
85
92
0.627
65
33
31
Smoking status
Ever-smoker
53
71
0.022
Never-smoker
70
52
Stage
I
93
75
0.001
II
10
48
Months before relapse
7.42 0.56
9.22 0.83
0.001
Relapse
Not relapsed
89
73
0.001
Relapsed
14
50
Death
Alive
95
96
0.003
Dead
8
27
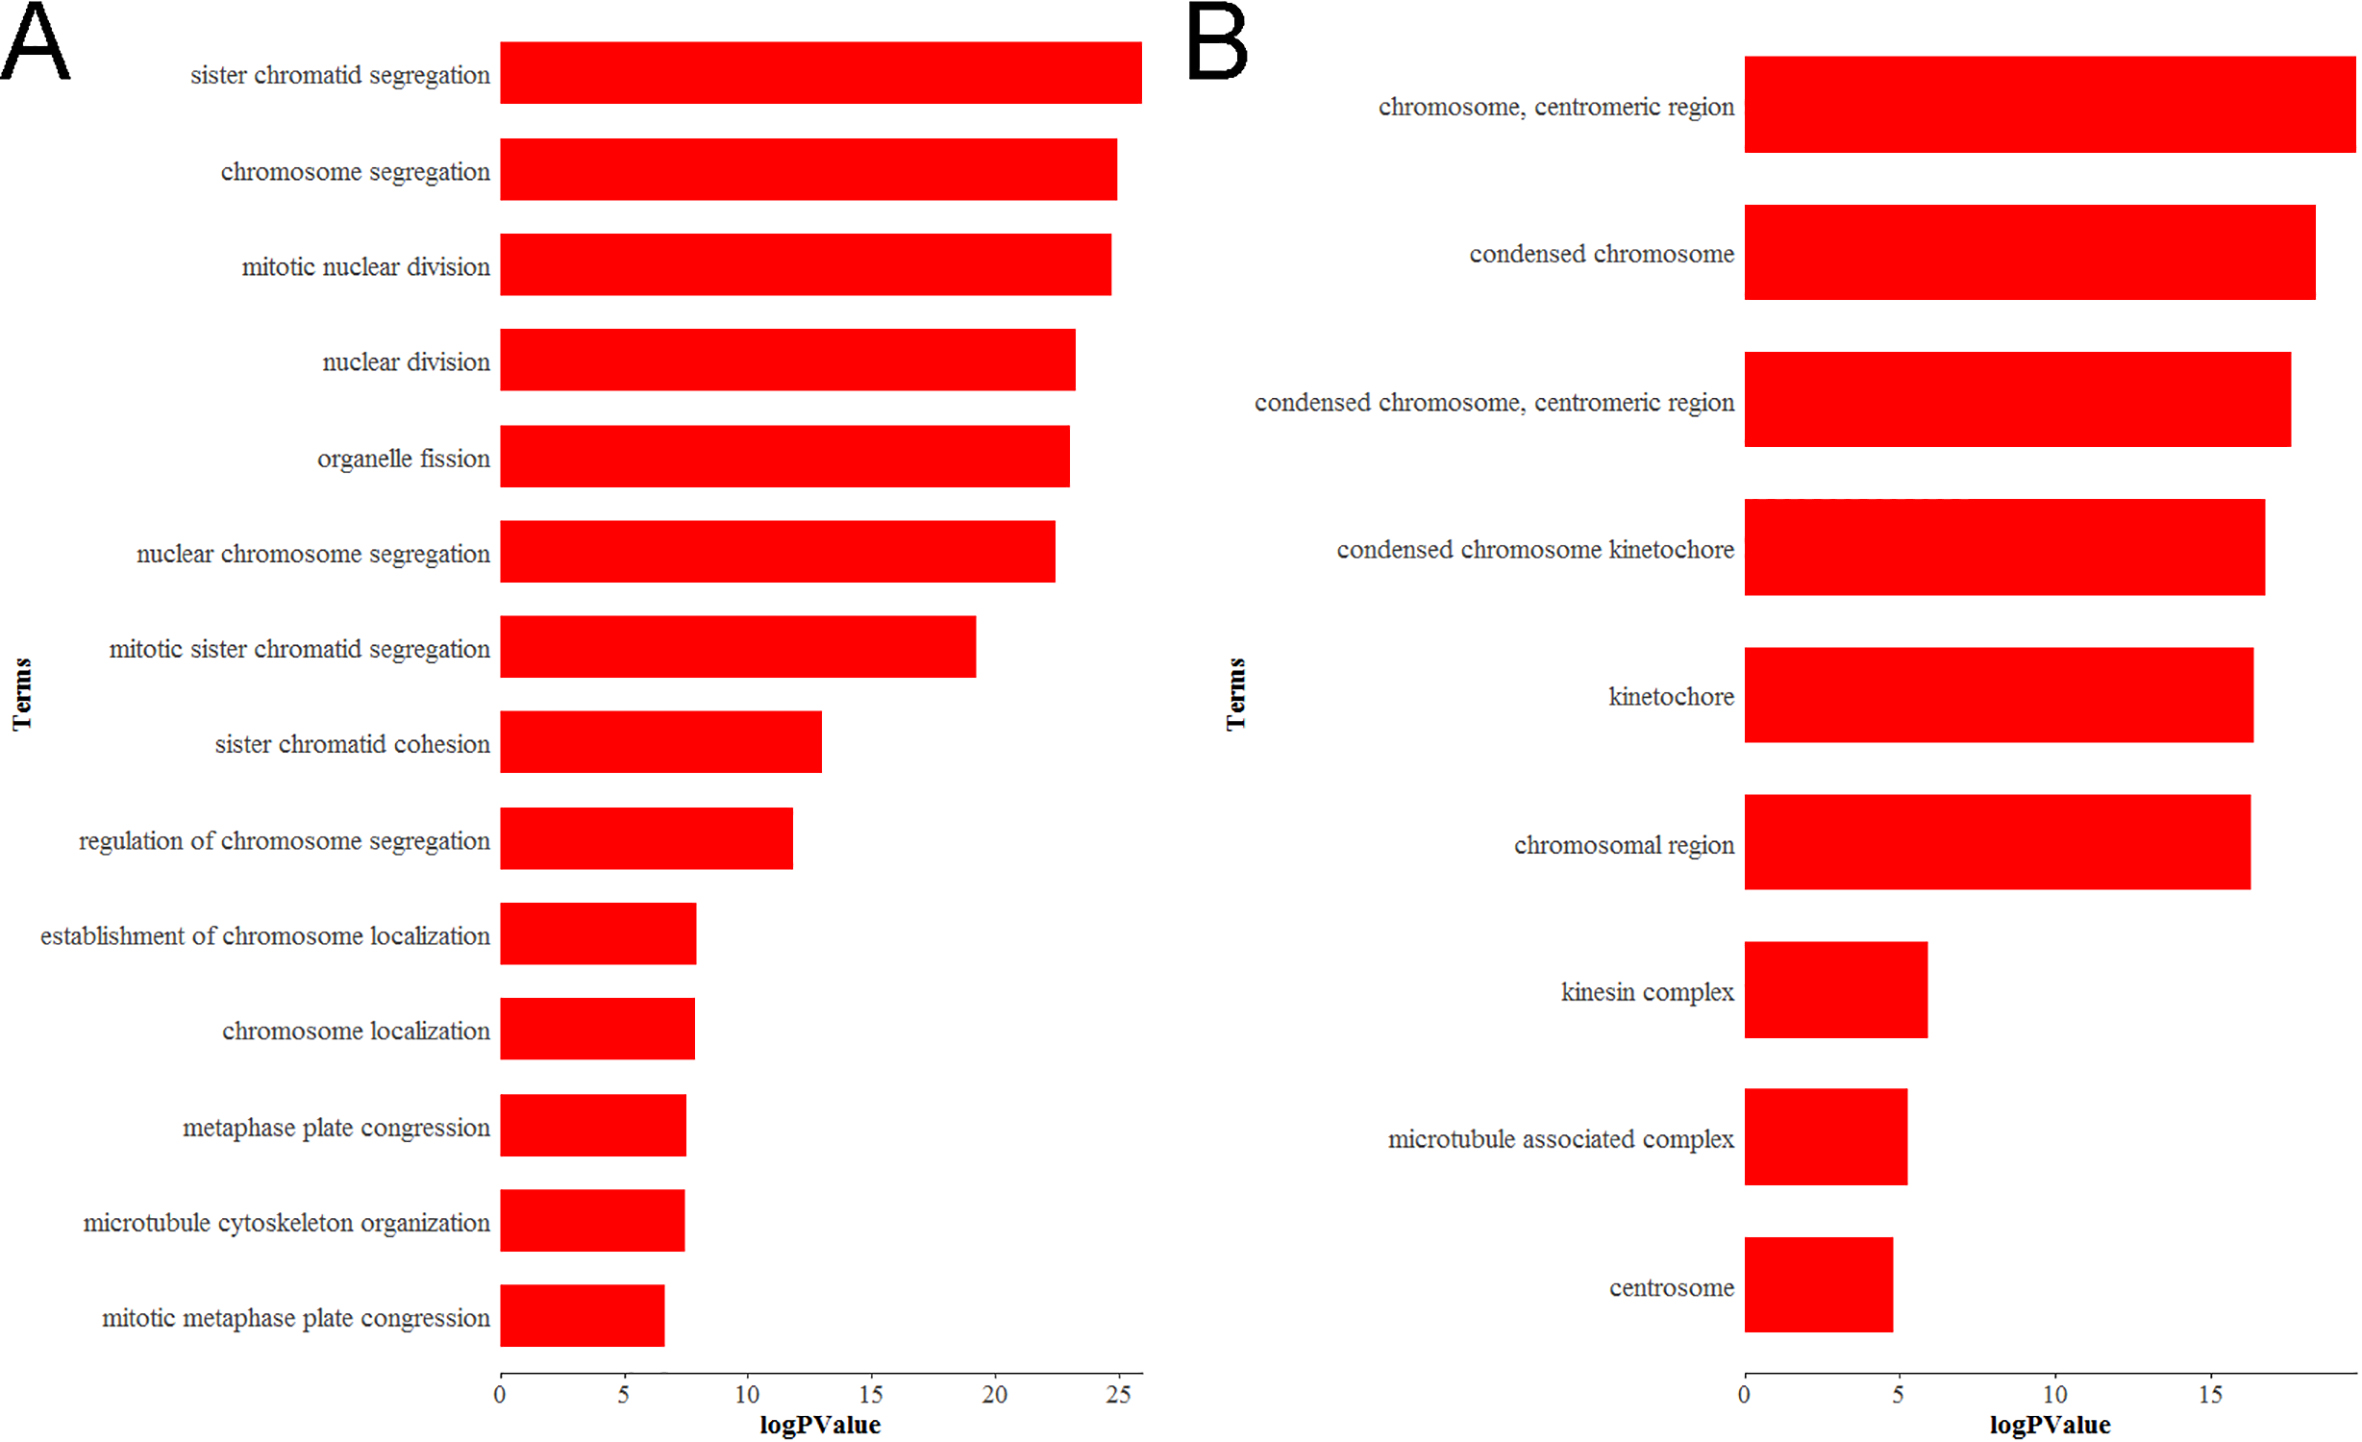
Bioinformatics analysis of Differentially expressed genes (DEGs). (A) GO biological process (BP) and (B) cellular component (CC) enrichment of KIF2C.
Hub gene validation
The six hub genes (KIF2C, CCNB2, CDC20, TOP2A, CCNB1 and CCNA2) were selected for validation. In training set GSE31210, the association of KIF2C with disease stage ( 0.955) was higher than the other five genes ( 0.947, 0.937, 0.931, 0.931 and 0.885). Therefore, KIF2C was chosen as a candidate gene for further validation. In test set GSE40791, a linear regression analysis was performed to validate KIF2C, showing a strong positive correlation between KIF2C expression and LUAD stage ( 0.001, Fig. 6A). Based on the Oncomine database, we found that KIF2C was highly expressed in LUAD compared to normal lung tissue (Fig. 6D–F). At the same time, KIF2C expression was significantly increased in LUAD compared to normal lung tissue based on the test set GSE40791 and TCGA data (Fig. 6B and C). And according to the GEPIA database, we can find significant differences between different stages of LUAD (Fig. 6G). In addition, we found that the overall survival of patients with KIF2C overexpression was significantly shorter (Fig. 6H). Comparing different clinicopathological parameters, we found that KIF2C has significant changes in different stages of LUAD; patients with high KIF2C expression have a history of smoking, more cancer recurrence, and a shorter survival (Table 2).
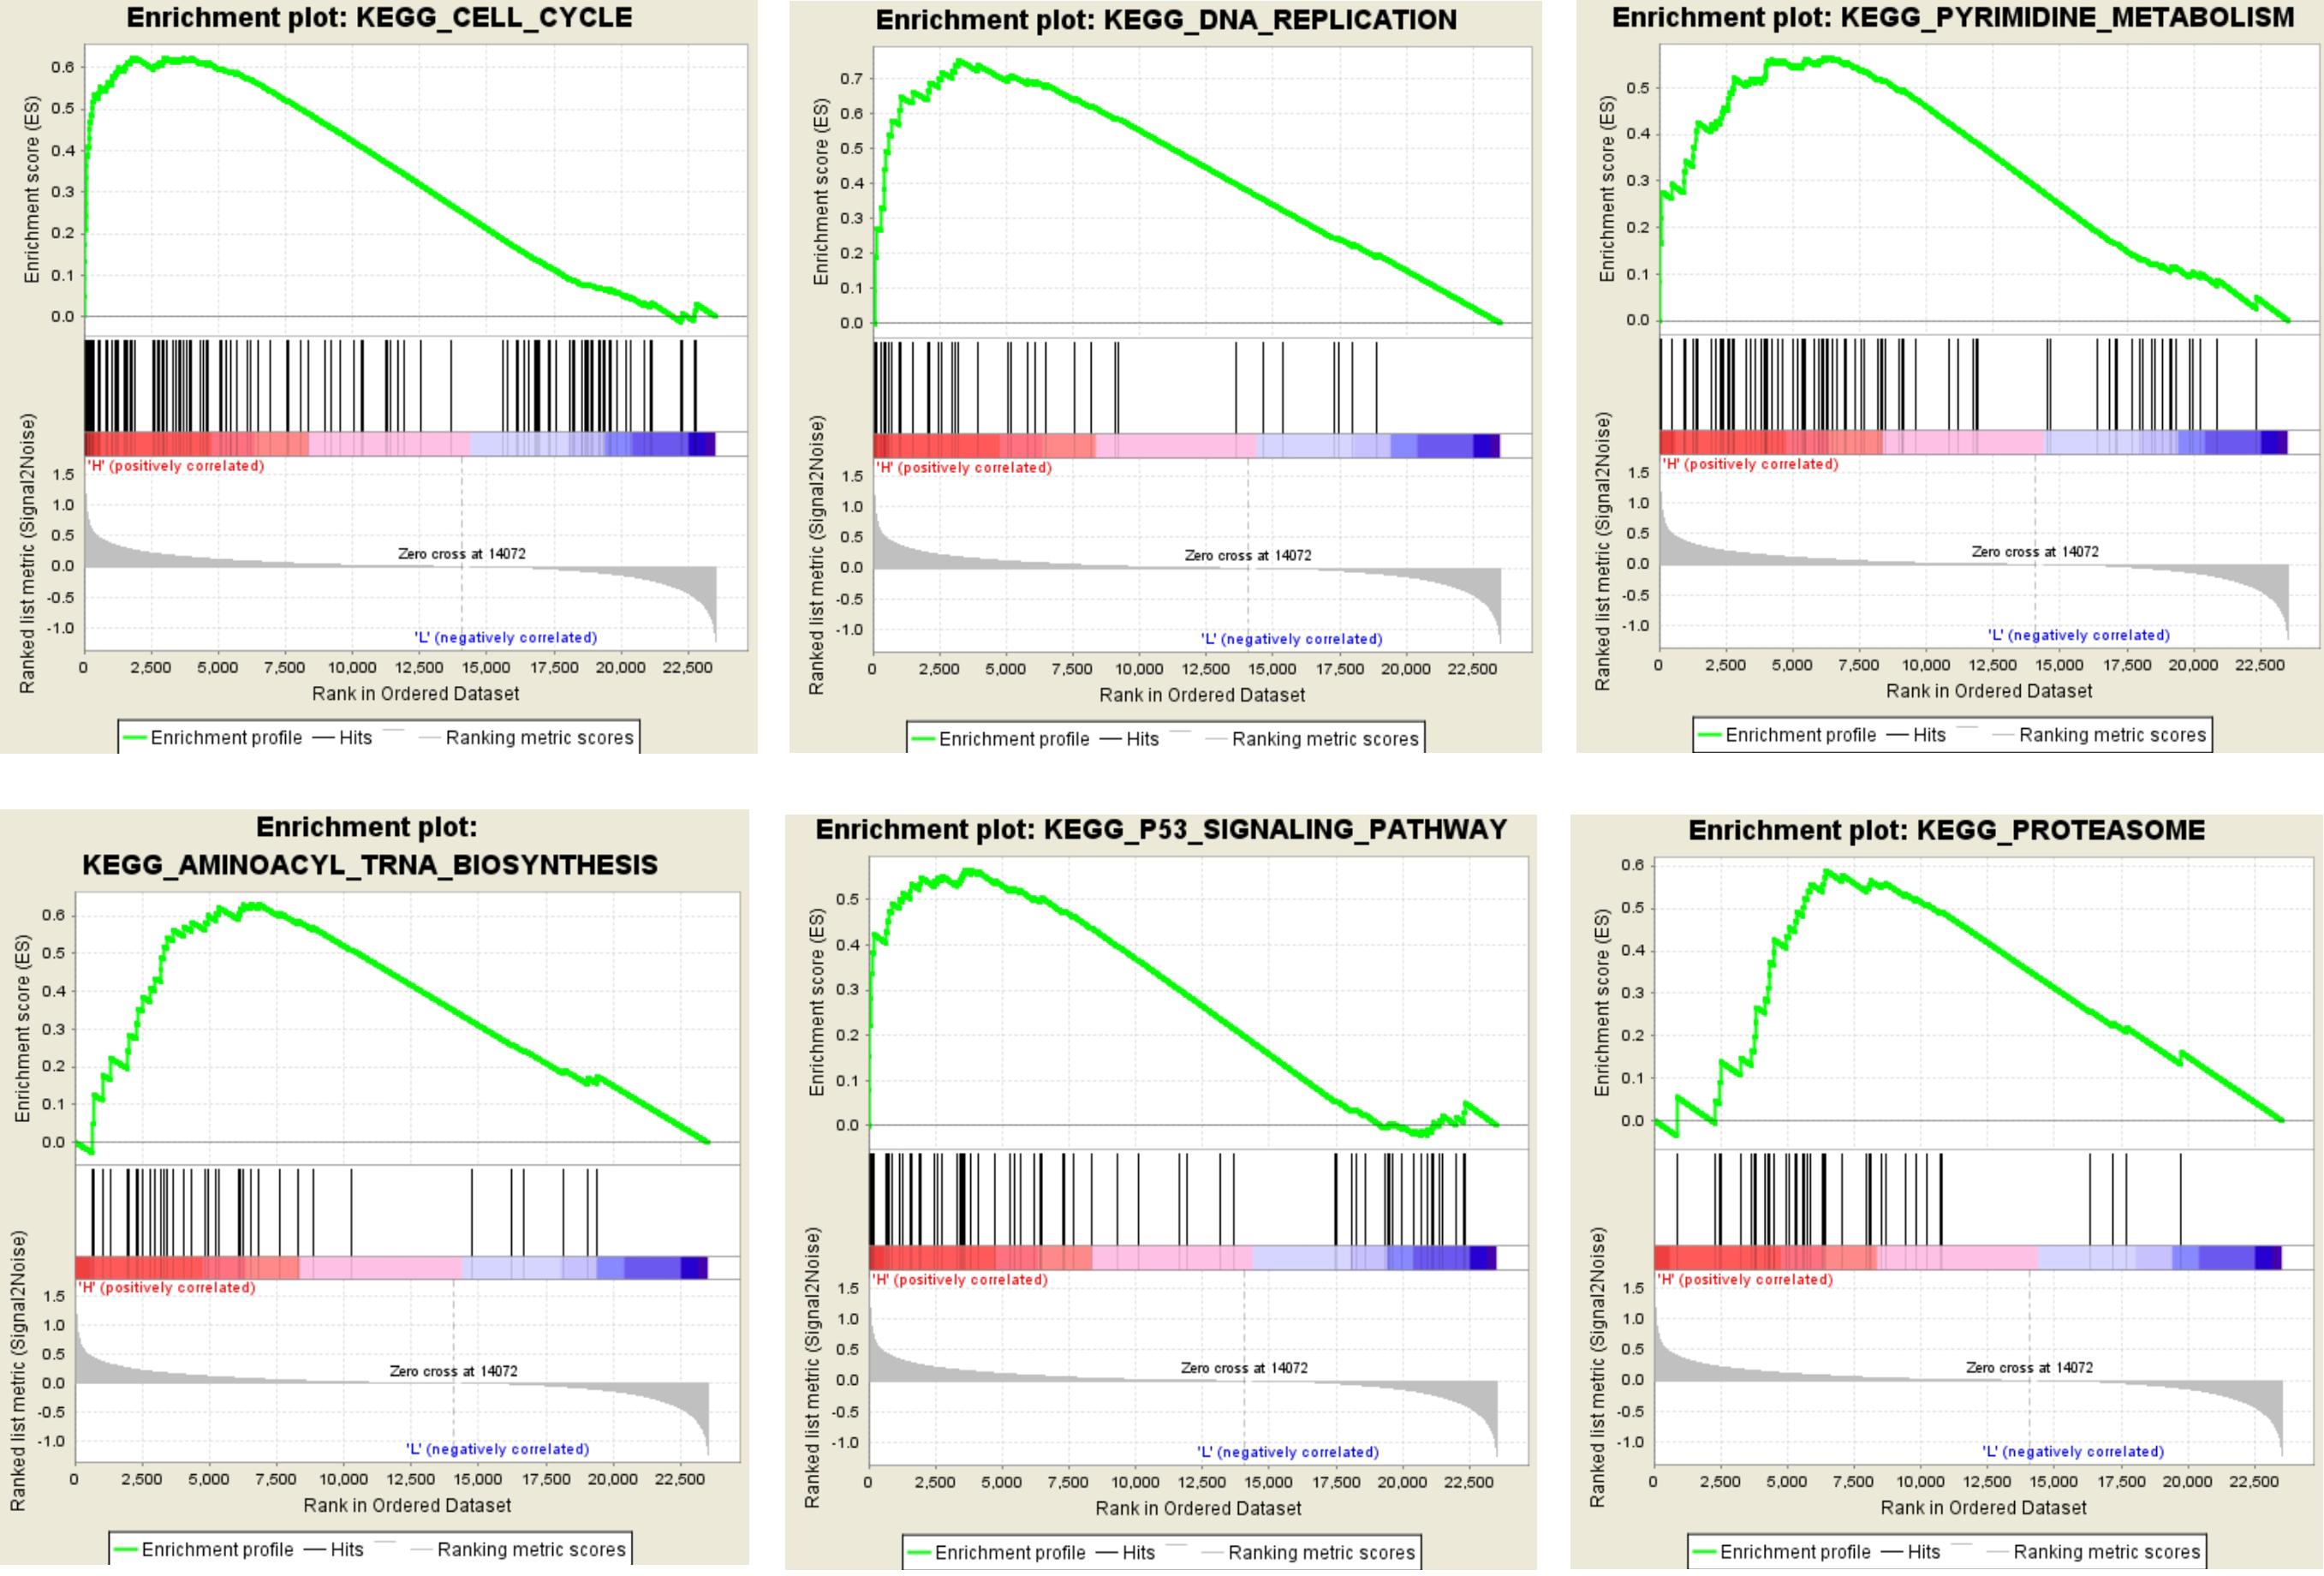
Gene set enrichment analysis (GSEA) analysis for gene sets related with KIF2C expression. The gene sets of "Cell cycle", “DNA replication”, “pyrimidine metabolism”, “aminoacyl trna biosynthesis”, “p53 signaling pathway” and “proteasome” were enriched in LUAD samples with KIF2C highly expressed (GSE40791).
Functional enrichment analysis
To learn more about the function of DEGs in the hub module, they were uploaded to the DAVID database (http://david.abcc.ncifcrf.gov/). GO analysis revealed that KIF2C is enriched in 14 biological processes and 9 cellular components (Fig. 7, Supplementary Table S1), of which KIF2C is significantly enriched in biological processes such as chromosomal segregation and mitotic mitosis.
Gene set enrichment analysis (GSEA)
In order to identify the potential function of hub genes, GSEA was used to retrieve enrichment of KIF2C-overexpressed samples on the KEGG pathway. Under the cut-off criteria, FDR 0.05, enrichment score (ES) 0.5 and gene size 35, a total of 6 functional gene sets were enriched (Fig. 8, Supplementary Table S2). The six representative pathways are “cell cycle”, “DNA replication”, “pyrimidine metabolism”, “aminoacyl trna biosynthesis”, “p53 signaling pathway” and “proteasome”.
Discussions
Lung adenocarcinoma is the most common malignancy in NSCLC. Because the early symptoms of LUAD are mild, the majority of patients are already diagnosed at late stage [25]. Radical resection is the only possible treatment for LUAD patients to obtain basic cure to restore normal life. The 5-year survival rate of LUAD patients with IA to IIIA stage is approximately 23% to 67% after surgical [26]. However, approximately three-fourths of NSCLC are diagnosed at late stage, and have already lost the opportunity for surgery [27]. Tumor stage as an important clinical indicator is closely related to the malignancy and metastasis of the tumor. There are currently no tumor markers that can accurately predict the progression of LUAD. Therefore, there is an urgent need for effective biomarkers for the prediction of tumor stage and prognosis of LUAD.
In this study, WGCNA was used to identify gene co-expression module (brown module) which was associated with LUAD progression. In addition, we found that KIF2C, CCNB2, CDC20, CCNA2, CCNB1 and TOP2A are the common hub nodes of the co-expression module and PPI network, indicating that these hub genes are closely related to clinical features and biological processes. In validation, KIF2C was highly correlated with the clinical trait estimated by log rank test (Fig. 6A).
KIF2C, the mitotic centromere associated kinesin, is the most representative member of Kine- sin-13. It participates in microtubule disaggregation, bipolar spindle formation, and chromosome segregation to regulate mitosis and cell cycle [28]. KIF2C is important for normal spindle assembly to repair microtubules and chromosomal abnormalities. Therefore, in theory, the abnormal expression of KIF2C may play an important role in the development of cancer. The activity and localization of KIF2C is regulated by many kinases and phosphatases [29, 30], so that deregulation of mitogenic kinases and phosphatases can lead to mitotic anomalies, chromosomal instability and uncontrolled transcription. Some scholars found that the expression of KIF2C protein in tongue cancer tissues was significantly higher than that in paracancerous tissues, and the high expression of KIF2C was correlated with lymph node metastasis and tumor stage [31]. Our study also found that high expression of KIF2C was correlated with tumor stage in patients with LUAD ( 0.001, Fig. 6G, Table 2), suggesting that the high expression of KIF2C may be related with tumor stage. With compared the expression levels of KIF2C in different types of cancer, we found that KIF2C was overexpressed in gastric cancer, breast cancer and rectal cance [32]. This study found that KIF2C was highly expressed in LUAD tissues compared to normal lung tissue (Fig. 6B). These findings suggest that KIF2C may play an important role in cell mitosis and is an essential factor in spindle assembly and chromosome segregation. And the overexpression of KIF2C is highly likely to promote tumorigenesis. KIF2C, a cytoskeletal motor protein, is not only involved in the division and proliferation of LUAD cells, but also closely related to the distant metastasis of tumor cells. Therefore, KIF2C can be regarded as a protoncogene.
As oncogenes, based on the Oncomine and GEPIA database, we found that KIF2C expression was significantly increased in LUAD compared to normal lung tissue (Fig. 6C–F). We found that the expression of KIF2C was increased significantly with the progression of LUAD based on the test set GSE40791 and the GEPIA database (Fig. 6A and G), so we speculate that KIF2C plays an important role in the progression of LUAD and can be used as a candidate biomarker to distinguish different LUAD stage. As for the prognosis, we observed that higher expression of KIF2C resulted in shorter overall survival (Fig. 6H) and lower survival ( 0.003, Table 2). Thus, there is a significant relationship between the overexpression of KIF2C and the poor prognosis in LUAD patients, and KIF2C can be used as an important prognostic factor. Taking into account functional enrichment analysis, KIF2C performed better on chromosome segregation and mitotic mitosis (Fig. 7). Meanwhile, GSEA analysis showed that the overexpression of KIF2C of LUAD samples were significantly enriched in the cell cycle and DNA replication signaling pathways (Fig. 8), suggesting that KIF2C may affect cell mitosis and proliferation through cell cycle signaling pathways. Therefore, we believe that KIF2C plays an important role in the progression of LUAD, which may affect the prognosis by regulating the cell cycle signaling pathway, leading to poor prognosis of LUAD. More interestingly, based on the correlation between KIF2C expression and clinicopathological parameters of LUAD, we found that high expression of KIF2C may lead to the progression of LUAD and higher recurrence rate ( 0.001, Table 2).
In summary, we constructed a co-expression network using weighted co-expression analysis, identify and validate network hub genes associated with the progression and poor prognosis of LUAD. Finally, KIF2C was identified as involved in the progression of LUAD and the development of poor prognosis by regulating cell cycle signaling pathways.
Footnotes
Supplementary data
The supplementary files are available to download from http://dx.doi.org/10.3233/CBM-181512.
References
1.
ChuangK.Y.ChuangY.C. and HoY.S., Global influence of Cancer Statistics articles, Current Science109 (2015), 1552–1554.
2.
ZappaC. and MousaS.A., Non-small cell lung cancer: current treatment and future advances, Transl Lung Cancer Res5 (2016), 288–300.
3.
CetinK.EttingerD.S.HeiY.J. and O’MalleyC.D., Survival by histologic subtype in stage IV nonsmall cell lung cancer based on data from the Surveillance, Epidemiology and End Results Program, Clin Epidemiol3 (2011), 139–48.
4.
TangZ.F.LiC.W.KangB.X.GaoG.LiC. and ZhangZ.M., GEPIA: a web server for cancer and normal gene expression profiling and interactive analyses, Nucleic Acids Research45 (2017), W98–W102.
5.
YamauchiM.YamaguchiR.NakataA.KohnoT.NagasakiM.ShimamuraT.ImotoS.SaitoA.UenoK.HatanakaY.YoshidaR.HiguchiT.NomuraM.BeerD.G.YokotaJ.MiyanoS. and GotohN., Epidermal growth factor receptor tyrosine kinase defines critical prognostic genes of stage I lung adenocarcinoma, PLoS One7 (2012), e43923.
6.
XiaoJ.LuX.ChenX.ZouY.LiuA.LiW.HeB.HeS. and ChenQ., Eight potential biomarkers for distinguishing between lung adenocarcinoma and squamous cell carcinoma, Oncotarget8 (2017), 71759–71771.
7.
BotlingJ.EdlundK.LohrM.HellwigB.HolmbergL.LambeM.BerglundA.EkmanS.BergqvistM.PontenF.KonigA.FernandesO.KarlssonM.HeleniusG.KarlssonC.RahnenfuhrerJ.HengstlerJ.G. and MickeP., Biomarker discovery in non-small cell lung cancer: integrating gene expression profiling, meta-analysis, and tissue microarray validation, Clin Cancer Res19 (2013), 194–204.
8.
TavazoieS.HughesJ.D.CampbellM.J.ChoR.J. and ChurchG.M., Systematic determination of genetic network architecture, Nat Genet22 (1999), 281–5.
9.
LangfelderP. and HorvathS., WGCNA: an R package for weighted correlation network analysis, BMC Bioinformatics9 (2008), 559.
10.
HeZ.SunM.KeY.LinR.XiaoY.ZhouS.ZhaoH.WangY.ZhouF. and ZhouY., Identifying biomarkers of papillary renal cell carcinoma associated with pathological stage by weighted gene co-expression network analysis, Oncotarget8 (2017), 27904–27914.
11.
YuanL.ChenL.QianK.QianG.WuC.L.WangX. and XiaoY., Co-expression network analysis identified six hub genes in association with progression and prognosis in human clear cell renal cell carcinoma (ccRCC), Genom Data14 (2017), 132–140.
12.
ChouW.C.ChengA.L.BrottoM. and ChuangC.Y., Visual gene-network analysis reveals the cancer gene co-expression in human endometrial cancer, BMC Genomics15 (2014), 300.
13.
OkayamaH.KohnoT.IshiiY.ShimadaY.ShiraishiK.IwakawaR.FurutaK.TsutaK.ShibataT.YamamotoS.WatanabeS.SakamotoH.KumamotoK.TakenoshitaS.GotohN.MizunoH.SaraiA.KawanoS.YamaguchiR.MiyanoS. and YokotaJ., Identification of Genes Upregulated in ALK-Positive and EGFR/KRAS/ALK-Negative Lung Adenocarcinomas, Cancer Research72 (2012), 100–111.
14.
ZhangY.ForemanO.WigleD.A.KosariF.VasmatzisG.SalisburyJ.L.van DeursenJ. and GalardyP.J., USP44 regulates centrosome positioning to prevent aneuploidy and suppress tumorigenesis, Journal of Clinical Investigation122 (2012), 4362–4374.
15.
GautierL.CopeL.BolstadB.M. and IrizarryR.A., Affy – analysis of Affymetrix GeneChip data at the probe level, Bioinformatics20 (2004), 307–315.
16.
RitchieM.E.PhipsonB.WuD.HuY.F.LawC.W.ShiW. and SmythG.K., limma powers differential expression analyses for RNA-sequencing and microarray studies, Nucleic Acids Research43 (2015).
17.
HorvathS. and DongJ., Geometric Interpretation of Gene Coexpression Network Analysis, Plos Computational Biology4 (2008).
18.
MasonM.J.FanG.P.PlathK.ZhouQ. and HorvathS., Signed weighted gene co-expression network analysis of transcriptional regulation in murine embryonic stem cells, Bmc Genomics10 (2009).
19.
YipA.M. and HorvathS., Gene network interconnectedness and the generalized topological overlap measure, BMC Bioinformatics8 (2007), 22.
20.
SzklarczykD.FranceschiniA.WyderS.ForslundK.HellerD.Huerta-CepasJ.SimonovicM.RothA.SantosA.TsafouK.P.KuhnM.BorkP.JensenL.J. and von MeringC., STRING v10: protein-protein interaction networks, integrated over the tree of life, Nucleic Acids Research43 (2015), D447–D452.
21.
DennisG.ShermanB.T.HosackD.A.YangJ.GaoW.LaneH.C. and LempickiR.A., DAVID: Database for annotation, visualization, and integrated discovery, Genome Biology4 (2003).
22.
MoothaV.K.LindgrenC.M.ErikssonK.F.SubramanianA.SihagS.LeharJ.PuigserverP.CarlssonE.RidderstraleM.LaurilaE.HoustisN.DalyM.J.PattersonN.MesirovJ.P.GolubT.R.TamayoP.SpiegelmanB.LanderE.S.HirschhornJ.N.AltshulerD. and GroopL.C., PGC-1alpha-responsive genes involved in oxidative phosphorylation are coordinately downregulated in human diabetes, Nat Genet34 (2003), 267–73.
23.
SubramanianA.TamayoP.MoothaV.K.MukherjeeS.EbertB.L.GilletteM.A.PaulovichA.PomeroyS.L.GolubT.R.LanderE.S. and MesirovJ.P., Gene set enrichment analysis: a knowledge-based approach for interpreting genome-wide expression profiles, Proc Natl Acad Sci U S A102 (2005), 15545–50.
24.
ShannonP.MarkielA.OzierO.BaligaN.S.WangJ.T.RamageD.AminN.SchwikowskiB. and IdekerT., Cytoscape: a software environment for integrated models of biomolecular interaction networks, Genome Res13 (2003), 2498–504.
25.
PetersS.AdjeiA.A.GridelliC.ReckM.KerrK.FelipE. and GroupE.G.W., Metastatic non-small-cell lung cancer (NSCLC): ESMO Clinical Practice Guidelines for diagnosis, treatment and follow-up, Ann Oncol23(Suppl 7) (2012), vii56–64.
26.
RussellP.A.WainerZ.WrightG.M.DanielsM.ConronM. and WilliamsR.A., Does Lung Adenocarcinoma Subtype Predict Patient Survival? A Clinicopathologic Study Based on the New International Association for the Study of Lung Cancer/American Thoracic Society/European Respiratory Society International Multidisciplinary Lung Adenocarcinoma Classification, Journal of Thoracic Oncology6 (2011), 1496–1504.
27.
ZhouQ.H., Individualized Surgical Treatment for Locally Advanced Non-Small Cell Lung Cancer Based on Molecular Biomarkers., Journal of Thoracic Oncology8 (2013), S284–S284.
28.
ZhangL.Y.ShaoH.Y.HuangY.J.YanF.ChuY.J.HouH.ZhuM.FuC.H.AikhionbareF.FangG.W.DingX. and YaoX.B.A., PLK1 Phosphorylates Mitotic Centromere-associated Kinesin and Promotes Its Depolymerase Activity, Journal of Biological Chemistry286 (2011), 3033–3046.
29.
ShaoH.HuangY.ZhangL.YuanK.ChuY.DouZ.JinC.Garcia-BarrioM.LiuX. and YaoX., Spatiotemporal dynamics of Aurora B-PLK1-MCAK signaling axis orchestrates kinetochore bi-orientation and faithful chromosome segregation, Sci Rep5 (2015), 12204.
30.
FrielC.T. and HowardJ., The kinesin-13 MCAK has an unconventional ATPase cycle adapted for microtubule depolymerization, Embo Journal30 (2011), 3928–3939.
31.
WangC.Q.XiangF.G.LiY.J.XingX.M.WangN.ChiJ.H. and YuW.J., Relation between the expression of mitotic centromere-associated kinesin and the progression of squamous cell carcinoma of the tongue, Oral Surgery Oral Medicine Oral Pathology Oral Radiology117 (2014), 353–360.
32.
BieL.ZhaoG.WangY.P. and ZhangB., Kinesin family member 2C (KIF2C/MCAK) is a novel marker for prognosis in human gliomas, Clinical Neurology and Neurosurgery114 (2012), 356–360.