To investigate the impact of Bmi-1-mediated NF-B pathway on the biological characteristics of CD133 liver cancer stem cells (LCSCs).
METHODS:
Flow cytometry was used to isolate CD133 LCSC cells from Huh7, Hep3B, SK-hep1, and PLC/PRF-5 cells. CD133 Huh7 cells were divided into Control, Blank, Bmi-1 siRNA, JSH-23 (NF-B pathway inhibitor), and Bmi-1 JSH-23 groups. The properties of CD133 Huh7 cells were detected by the colony-formation and sphere-forming assays. Besides, Transwell assay was applied for the measurement of cell invasion and migration, immunofluorescence staining for the detection of NF-B p65 nuclear translocation, and qRT-PCR and Western blotting for the determination of SOX2, NANOG, OCT4, Bmi-1, and NF-B p65 expression.
RESULTS:
CD133 Huh-7 cells were chosen as the experiment subjects after flow cytometry. Compared with CD133 Huh-7 cells, the expression of CD133, OCT4, SOX2, NANOG, Bmi-1, and NF-B p65, the nuclear translocation of NF-B p65, the number of cell colonies and Sphere formation, as well as the abilities of invasion and migration were observed to be increased in CD133 Huh-7 cells, which was inhibited after treated with Bmi-1 siRNA or JSH-23, meanwhile, the cell cycle was arrested at the G0/G1 and S phases with apparently enhanced cell apoptosis. Importantly, no significant differences in the biological characteristics of CD133 Huh-7 cells were found between the Blank group and Bmi-1 JSH-23 group.
CONCLUSION:
Down-regulating Bmi-1 may inhibit the biological properties of CD133 LCSC by blocking NF-B signaling pathway, which lays a scientific foundation for the clinical treatment of liver cancer.
Liver cancer ranks fifth in morbidity and second in mortality among the most prevalent deadly cancers worldwide, while Hepatitis B Virus (HBV) infection is accepted as the leading cause of the global high incidence of liver cancer, especially in most Asian and African countries and regions [1]. At present, liver resection or liver transplantation has been suggested to be the major therapy to cure liver cancer, and the 5-year survival rate of patients depends on the tumor staging at the time of diagnosis. It is important to note, however, most patients are at the later/advanced stage of cancer when diagnosed and cannot undergo surgery, as well as with poorer sensitivity to radiotherapy or chemotherapy [2]. Therefore, effective diagnosis and treatment strategies are becoming more and more urgent for liver cancer patients. According to a recent theory of cancer stem cells (CSCs), tumor tissues consist of heterogeneous cell populations [3]. CSCs are a small group of cancer cells with the characteristics of stem cells and the ability of self-renewal and multicellular differentiation, which constitute a major reason for the generation, proliferation, and migration of tumor cells and the resistance to radiotherapy and chemotherapy [4]. From the perspective of etiology, morphology, biological behavior, treatment response and clinical outcome, liver cancer can be classified as a heterogeneous disease [5]. With the deepening of researches and studies, more and more surface biomarkers of liver cancer stem cell (LCSC) have been well recognized, including CD133, CD24, CD44, CD90, and epithelial cell adhesion molecules (EpCAM) [6]. Among them, CD133 molecule is a cell membrane surface marker widely used in the isolation and identification of various solid tumor stem cells [7]. Actually, many studies have revealed a close relationship between CD133 LCSC and the tumor signal transduction, tumor immune escape, drug tolerance, as well as radiation resistance in liver cancer patients [8, 9]. Therefore, CD133 LCSC is expected to be a novel therapeutic target for the treatment of liver cancer.
Bmi-1, a member of polycomb of genes (PCG), was initially discovered as a proto-oncogene that synergistically cooperated with another oncogene c-myc to induce cell transformation and tumor formation, ultimately resulting in the genesis of B-cell lymphoma in transgenic mice [10]. According to recent studies, Bmi-1 has been considered as the cancer stem cell in tumors and is abnormally expressed in many malignant tumors, such as breast cancer, cervical cancer, lung cancer and liver cancer, making it an alternative biomarker and a potential therapeutic target for tumors [11, 12, 13]. Unfortunately, the role of Bmi-1 in the transduction of cellular signals has not been clearly elucidated. A previous study revealed that Bmi-1 may play a critical role in the occurrence and development of invasive phenotype of glioma by activating the NF-B pathway [14]. Kim et al. also found that over-expressed Bmi-1 can dramatically improve the activity of NF-B [15], suggesting that Bmi-1 may mediate the NF-B signaling pathway to participate in the bioprocess of cancers. Besides, accumulating evidence has proved that NF-B signaling pathway is involved in the pathogenesis and progression of liver cancer. For example, NF-B pathway can upregulate the expression of AFP to play a significant role in liver cancer [16] which was also found involved in the regulation of malignant phenotypes of tumor cells [17, 18]. Therefore, this study aims to explore whether Bmi-1 can affect the stem cell-like characteristics of liver cancer cells via regulation of NF-B signaling pathway.
Materials and methods
Cell culture
Human liver cancer cell lines Huh7, Hep3B, SK-hep1 and PLC/PRF-5 cells were cultured in Dulbecco’s modified Eagles Medium (DMEM) supplemented with 10% fetal bovine serum (FBS) in an incubator (at 37C with 5% CO). When cell confluence reached 80% or above, the culture medium was removed and cells were washed with PBS buffer twice, followed by the digestion of cells with 0.25% trypsin (containing EDTA) for 2 min. After discarding of trypsin, the culture medium was used to neutralize trypsin and stop digestion, and a glass dropping pipette was used for the preparation of single cell suspension.
Magnetic affinity cell sorting (MACS)
Single cell suspension was prepared and cell density was adjusted to 1 10 cells/100 l. Then, cells were washed with PBS for three times and added with primary antibody of CD133-PE for 15 min of incubation at 4C, avoiding exposure to the light. Next, cells were washed again with PBS for three times and centrifuged at the rate of 800 rpm/min for 3 min, the supernatant was discarded, and cell suspension was suspended to 80 l with the cell density adjusted to 1 10, followed by the addition of 20 l anti-PE immunomagnetic beads for 15 min of incubation at 4C in the dark. Subsequently, cells were washed with PBS for 3 times, centrifuged for 3 min (800 rpm/min), and made into 500 l cell suspension after removing the supernatant. After that, the cell suspension was poured into the column for cell separation and CD133 cells eluted from the column were collected and counted. At last, the separation column was taken out of the magnetic field, 5 ml PBS buffer was used to pipette CD133 cells adhering to the column, and the number of cells was counted.
Grouping of CD133 Huh7 LCSC
CD133 Huh7 cells were assigned into five groups: Blank group (cells cultured in normal culture medium), NC siRNA group (cells transfected with negative control siRNA), Bmi-1 siRNA group (cells transfected with Bmi-1 siRNA), JSH-23 group (cells treated with NF-B activation inhibitor JSH-23), and Bmi-1 JSH-23 group (cells transfected with Bmi-1-overexpression plasmid and treated with JSH-23). Besides, Bmi-1 siRNA (Catalog #: AM16708) and NC siRNA (Catalog #: AM4611) were purchased from Thermo Fisher Scientific (Waltham, MA, USA), while JSH-23 (Catalog #: CAS 749886-87-1) was bought from Santa Cruz Biotech. Inc. (Santa Cruz, CA, USA).
The total RNA extracted from cells was determined for RNA purity and concentration with an ultraviolet spectrophotometer (UV-1800, Japan), and observed for RNA integrity by using the agarose gel electrophoresis. The reverse-transcription process was conducted by following the instructions on the reverse-transcription kit (Takara, Japan), and qRT-PCR was performed by using the SYBR Premix Ex Taq II (TliRNaseH Plus, Takara, Japan) in the fluorescence quantitative PCR instrument (Applied Bio-systems, Foster City, CA, USA). The reaction system (20 l) contained 7 l of DNase/RNase-free water, 10 l of SYBY Premix Ex TaqTM (TliRNaseH Plus) (2x), 0.5 l of Forward primer (10 M), 0.5 l of Reverse primer (10 M) and 2 l of cDNA. The conditions for qRT-PCR reaction were as follows: 30 s at 95C, 5 s at 95C, and 30 s at 60C, in a total of 40 cycles. With GAPDH as the internal reference gene, 2 method was employed to calculate the relative expression of target genes. The experiment was repeated three times.
Western blotting
The total proteins were extracted and centrifuged for 15 min at the speed of 12000 rpm, the supernatant was discarded, and sodium dodecyl sulphate-polyacrylamide gel electrophoresis (SDS-PAGE) was applied for the separation of proteins. Next, proteins separated were transferred to nitrocellulose membrane by electrotransfer and the membrane was placed in 5% skim milk-PBS buffer for 1 h of blocking at room temperature, followed by the addition of primary antibodies for overnight reaction at 4C. Subsequently, the membrane was washed 3 times with PBS buffer before the addition of corresponding secondary antibodies for 1 h at room temperature. After that, the membrane was washed again with PBS buffer for three times, and the enhanced chemiluminescence was employed for visualization and development. The gray value ratio of target bands to the loading control (-actin) band was used to measure the relative expression levels of target proteins. The experiment was repeated three times.
Immunofluorescence staining
Cells were washed with PBS buffer, fixed in 4% paraformaldehyde for 30 min at room temperature, washed for three times with cold PBS buffer, and added with goat serum blocking buffer for 60 min of incubation at 37C. Next, cells were washed again with PBS buffer for three times, followed by the addition of NF-B antibody for 60 min of incubation at 37C, three times of washing with cold PBS buffer, and the addition of secondary antibody DAPI (4, 6-diamino-2-phenylindole)-labeled rabbit-anti-rat IgG for 30 min of incubation at 37C. After 30 min of blocking and antibody incubation, cells were washed again with cold PBS buffer, mounted, and observed under a fluorescence microscope (Olympus, Japan). Five visual fields were randomly selected for photographing and later analysis, and the experiment was repeated three times.
Colony formation assay
Liver cancer cells adherent to the bottom and wall of the plate were digested by EDTA-containing trypsin, which was terminated by serum. Then, cells were centrifuged for 5 min at the rate of 1500 rpm and the supernatant was removed. Next, 1 ml culture medium was used for cell suspension and 0.4% trypan blue for cell staining and counting. Subsequently, cells were seeded onto the 6-well plate by 2000 cells/well, and 2 ml routine culture medium was added for incubation in an incubator with 5% CO at 37C. After six days, the number of cell colonies was counted. The experiment was repeated three times.
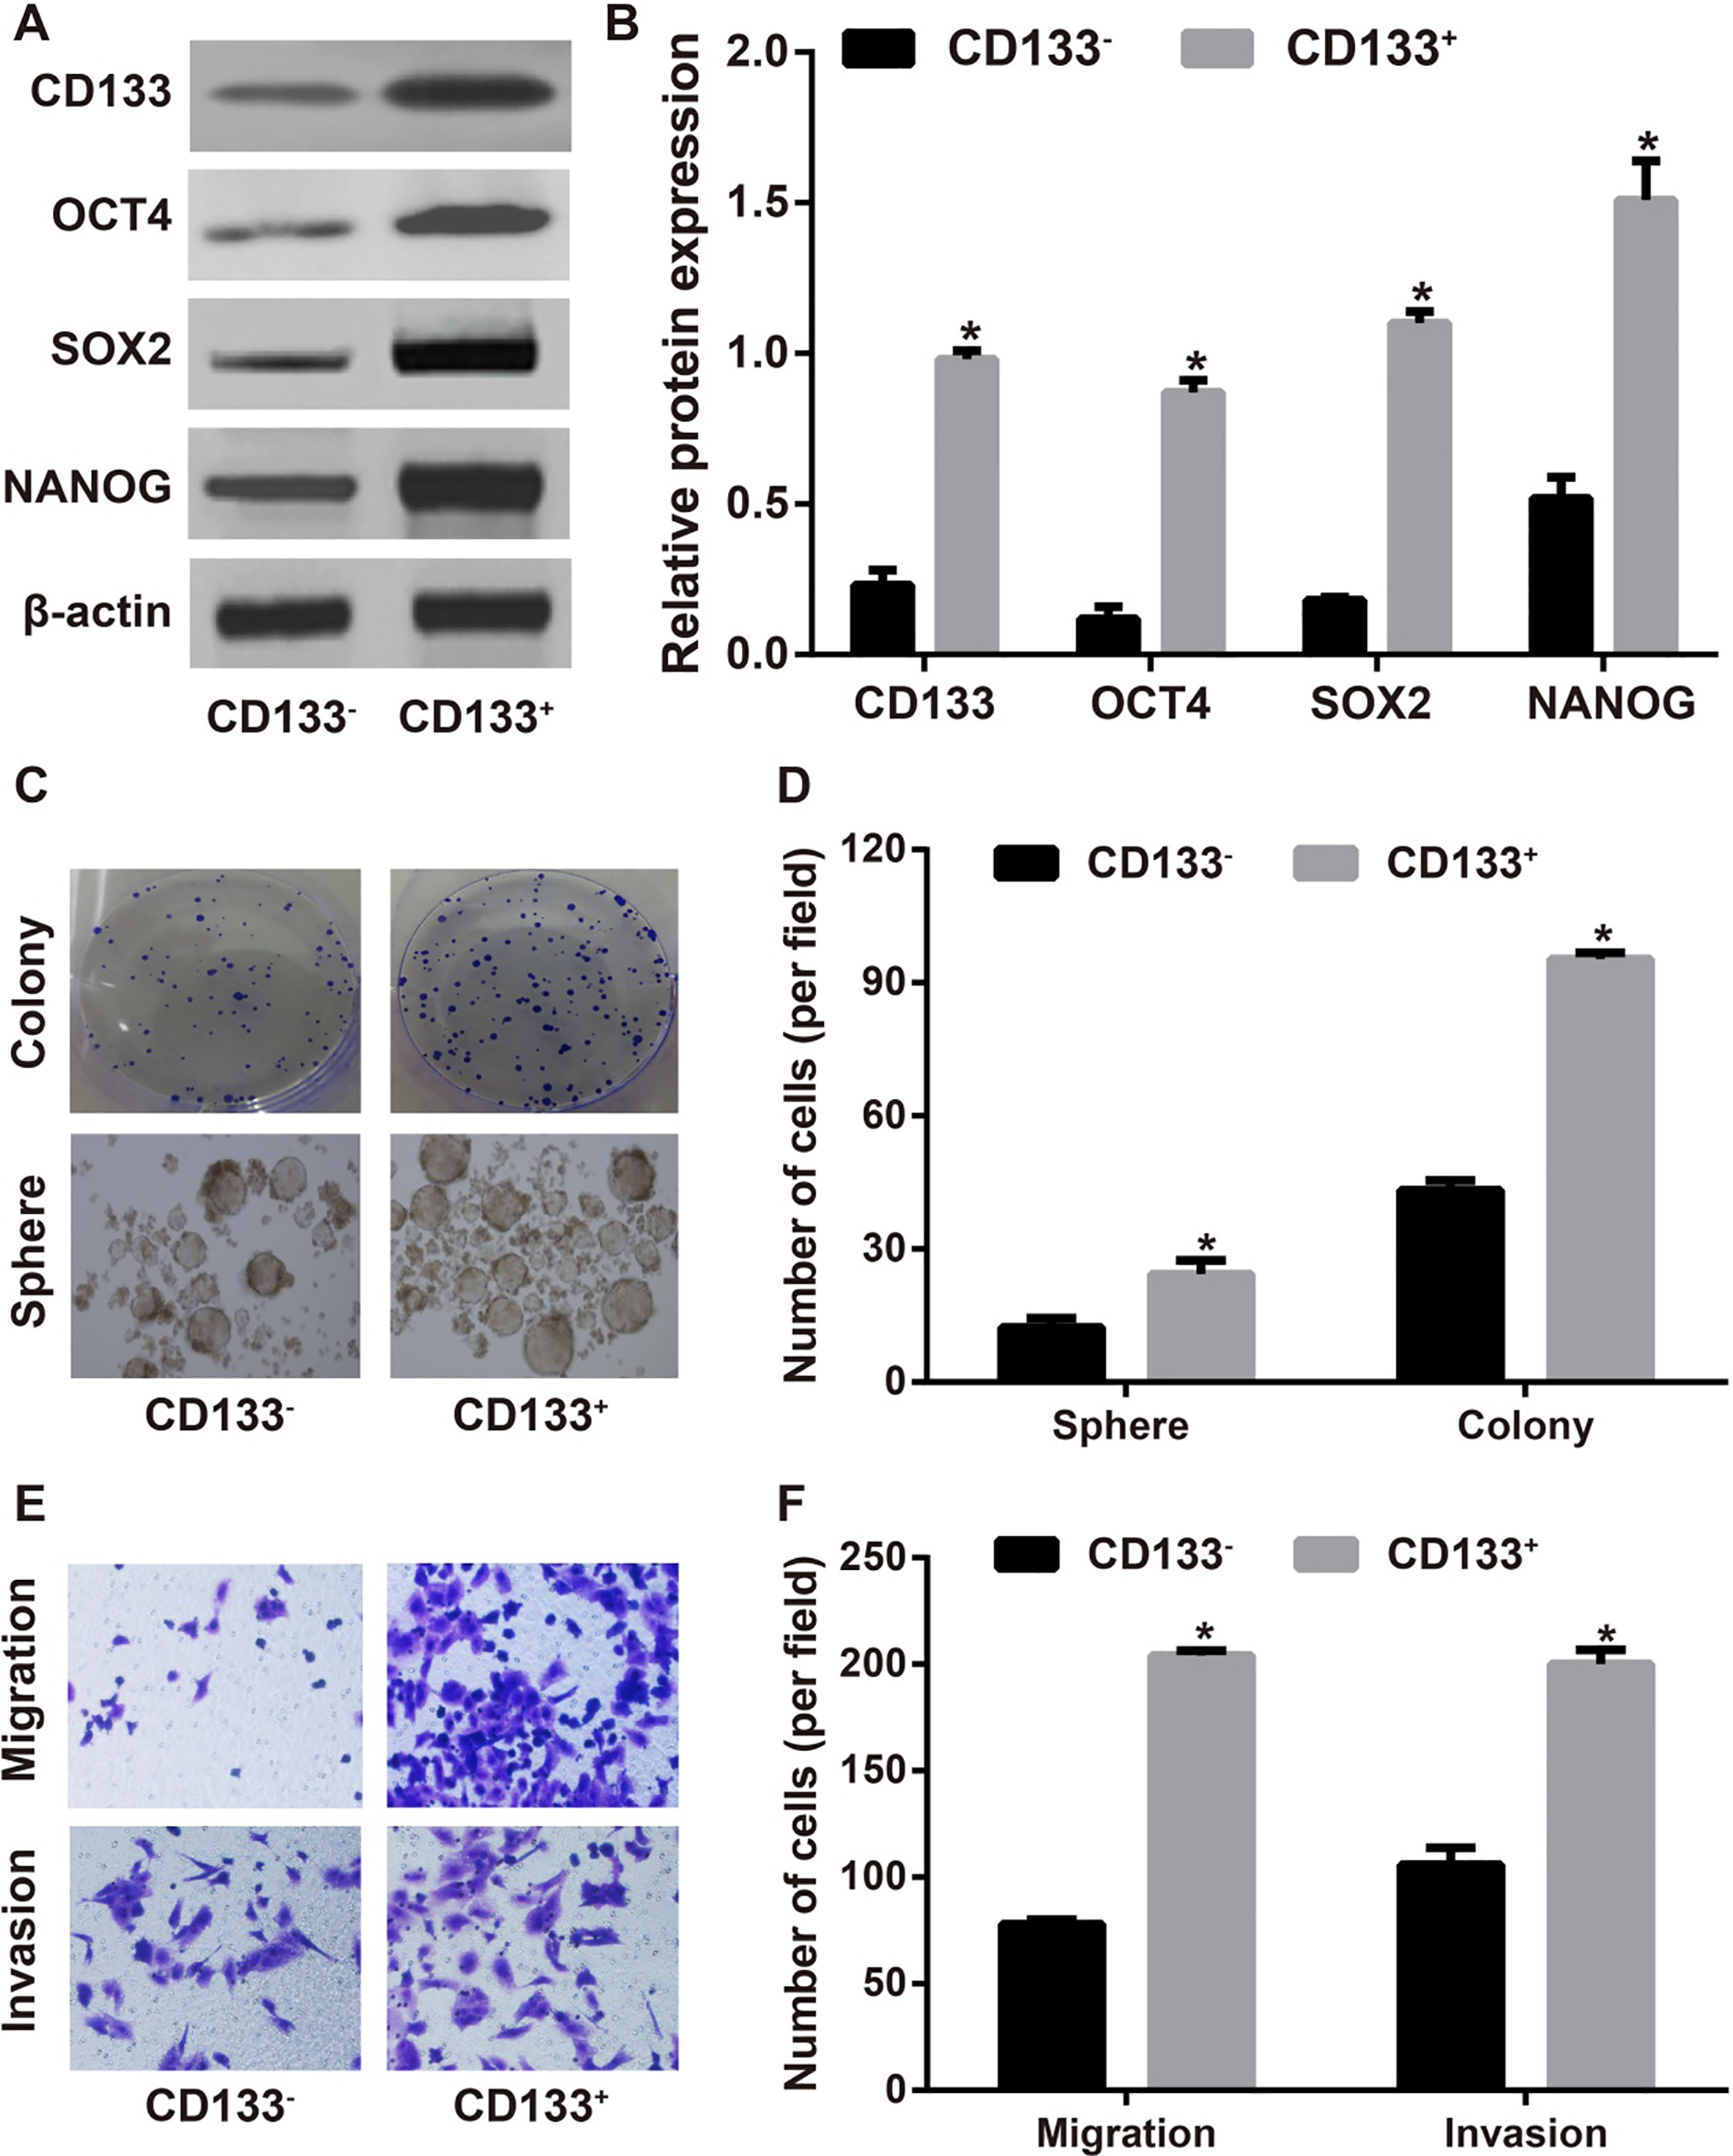
Identification of CD133 cells in human liver cancer cell line Huh-7. Note: A–B, The expression levels of CD133, OCT4, SOX2 and NANOG in Huh-7 cells detected by Western blotting; C–D, The property of CD133 Huh7 cells was evaluated by the colony-formation and sphere-forming assays; E–F, The invasion and migration abilities of Huh-7 cells assessed by Transwell assay; , 0.05 compared with CD133 Huh-7 cells.
Expression levels of Bmi-1 and NF-B in CD133 and CD133 Huh-7 cells. Note: A, The expressions of Bmi-1 and NF-B p65 in CD133 and CD133 Huh-7 cells were detected by qRT-PCR (A) and Western blotting (B–C); D, The nuclear translocation of NF-B p65 in CD133 and CD133 Huh-7 cells measured by immunofluorescence staining; The same letter was accepted not statistically significant, 0.05; and the different letter indicated statistical significance, 0.05.
Sphere-forming assay
After digestion and centrifugation, the supernatant was removed, and cells were washed twice with 1 PBS. Next, the upper PBS buffer was discarded and serum-free culture medium DMEM/F12 was used to suspend cells. Since only 1000 cells should be added to each well, cell suspension was diluted gradually until the concentration was 10, 10, and 10 cells/ml. Then, 1 ml of specially prepared cell sphere-forming culture fluid was added to the 24-well plate, and 100 l of diluted cell suspension (1000 cells) was added for mixing. After that, the 24-well plate was placed in a 37C incubator for 6 days of incubation, and the number of sphere-forming cells was counted. Similarly, this experiment was also repeated for three times.
Transwell assay
Cells were digested by EDTA-containing trypsin, which was terminated by serum. Then, cells were centrifuged and the supernatant was removed. Next, cells were washed with PBS buffer, suspended by using DMEM medium, and adjusted to the cell density of 1–10 10/ml. In the migration experiment, 2 10 cells were placed in the upper chamber with diameter of 8 m, and was added with DMEM medium to 200 l; and the lower chamber was added with 600 l culture medium containing 20% FBS. In the invasion experiment, DMEM medium and Matrigel (7:1) was spread on the 8 m-diameter upper chamber, which was placed in a 37C incubator for 30 min until the mixture became jellied. Next, cells (5 10) were placed in the upper chamber and DMEM medium was added until the volume reached 200 l; and the lower chamber was added with 600 l culture medium supplemented with 20% FBS. The culture medium was placed in the incubator (37C, 5% CO) for 48 h, and cells were then fixed in 4% paraformaldehyde, stained by 0.4% crystal violet, and observed under a microscope for cell counting. The experiment was repeated three times.
Statistical method
All statistical data were processed and analyzed by using the statistics software SPSS. Measurement data were presented by mean standard deviation ( s). Mean values between two groups were compared by using independent sample -test, while among multiple groups were analyzed by one-way ANOVA followed by least significant difference (LSD) post hoc analysis. 0.05 was of statistical significance.
Bmi-1-mediated NF-B pathway in CD133 Huh-7 cells. Note: A, The relative mRNA expression of Bmi-1 and NF-B p65 in CD133 Huh-7 cells detected by qRT-PCR; B–C, The relative protein expression of Bmi-1 and NF-B p65 in CD133 Huh-7 cells evaluated by Western blotting; The same letter indicates the non-statistical was accepted not statistically significant, 0.05; and the different letter indicated statistical significance, 0.05.
Effect of Bmi-1-mediated NF-B pathway on the expression of stemness genes in CD133 Huh-7 cells. Note: A, The relative mRNA expression of OCT4, SOX2 and NANOG in CD133 Huh-7 cells detected by qRT-PCR; B–C, The relative protein expression of OCT4, SOX2 and NANOG in CD133 Huh-7 cells evaluated by Western blotting; , 0.05 compared with the Blank, NC siRNA, and Bmi-1 JSH-23 groups.
Results
Isolation of CD133 LCSC
A flow cytometer was used to analyze the CD133 expression level of each liver cancer cell lines, and the results showed that the CD133 expression rate in SK-hep1, Hep3B, PLC/PRF/5 and Huh-7 cells was 0.3% 0.05%, 91.13% 2.59%, 89.17% 3.33% and 51.37% 1.16%, respectively. Hence, CD133 Huh-7 cells were more appropriate for use in further experiments.
Identification of CD133 cells in human liver cancer cell line Huh-7
As shown by Western blotting, the expression of CD133 in CD133 Huh-7 cells was greatly higher than that in CD133 cells, and the expressions of stemness genes (OCT4, SOX2 and NANOG) were also significantly increased in CD133 Huh-7 cells when compared with CD133 cells (all 0.05, Fig. 1A and B). In order to measure the tumorigenic ability of CD133 cells, we applied colony formation and sphere-forming assays to find that CD133 Huh-7 cells were apparently higher in the number of cell colonies and sphere-formation than CD133 cells (all 0.05, Fig. 1C and D). Additionally, Transwell assays demonstrated that the abilities of invasion and migration CD133 Huh-7 cells were remarkably elevated as compared with the CD133 Huh-7 cells (all 0.05, Fig. 1E and F).
Effect of Bmi-1-mediated NF-B pathway on the colony formation (A) and sphere-forming (B) abilities of CD133 Huh-7 cells. Note: , 0.05 compared with the Blank, NC siRNA, and Bmi-1 JSH-23 groups.
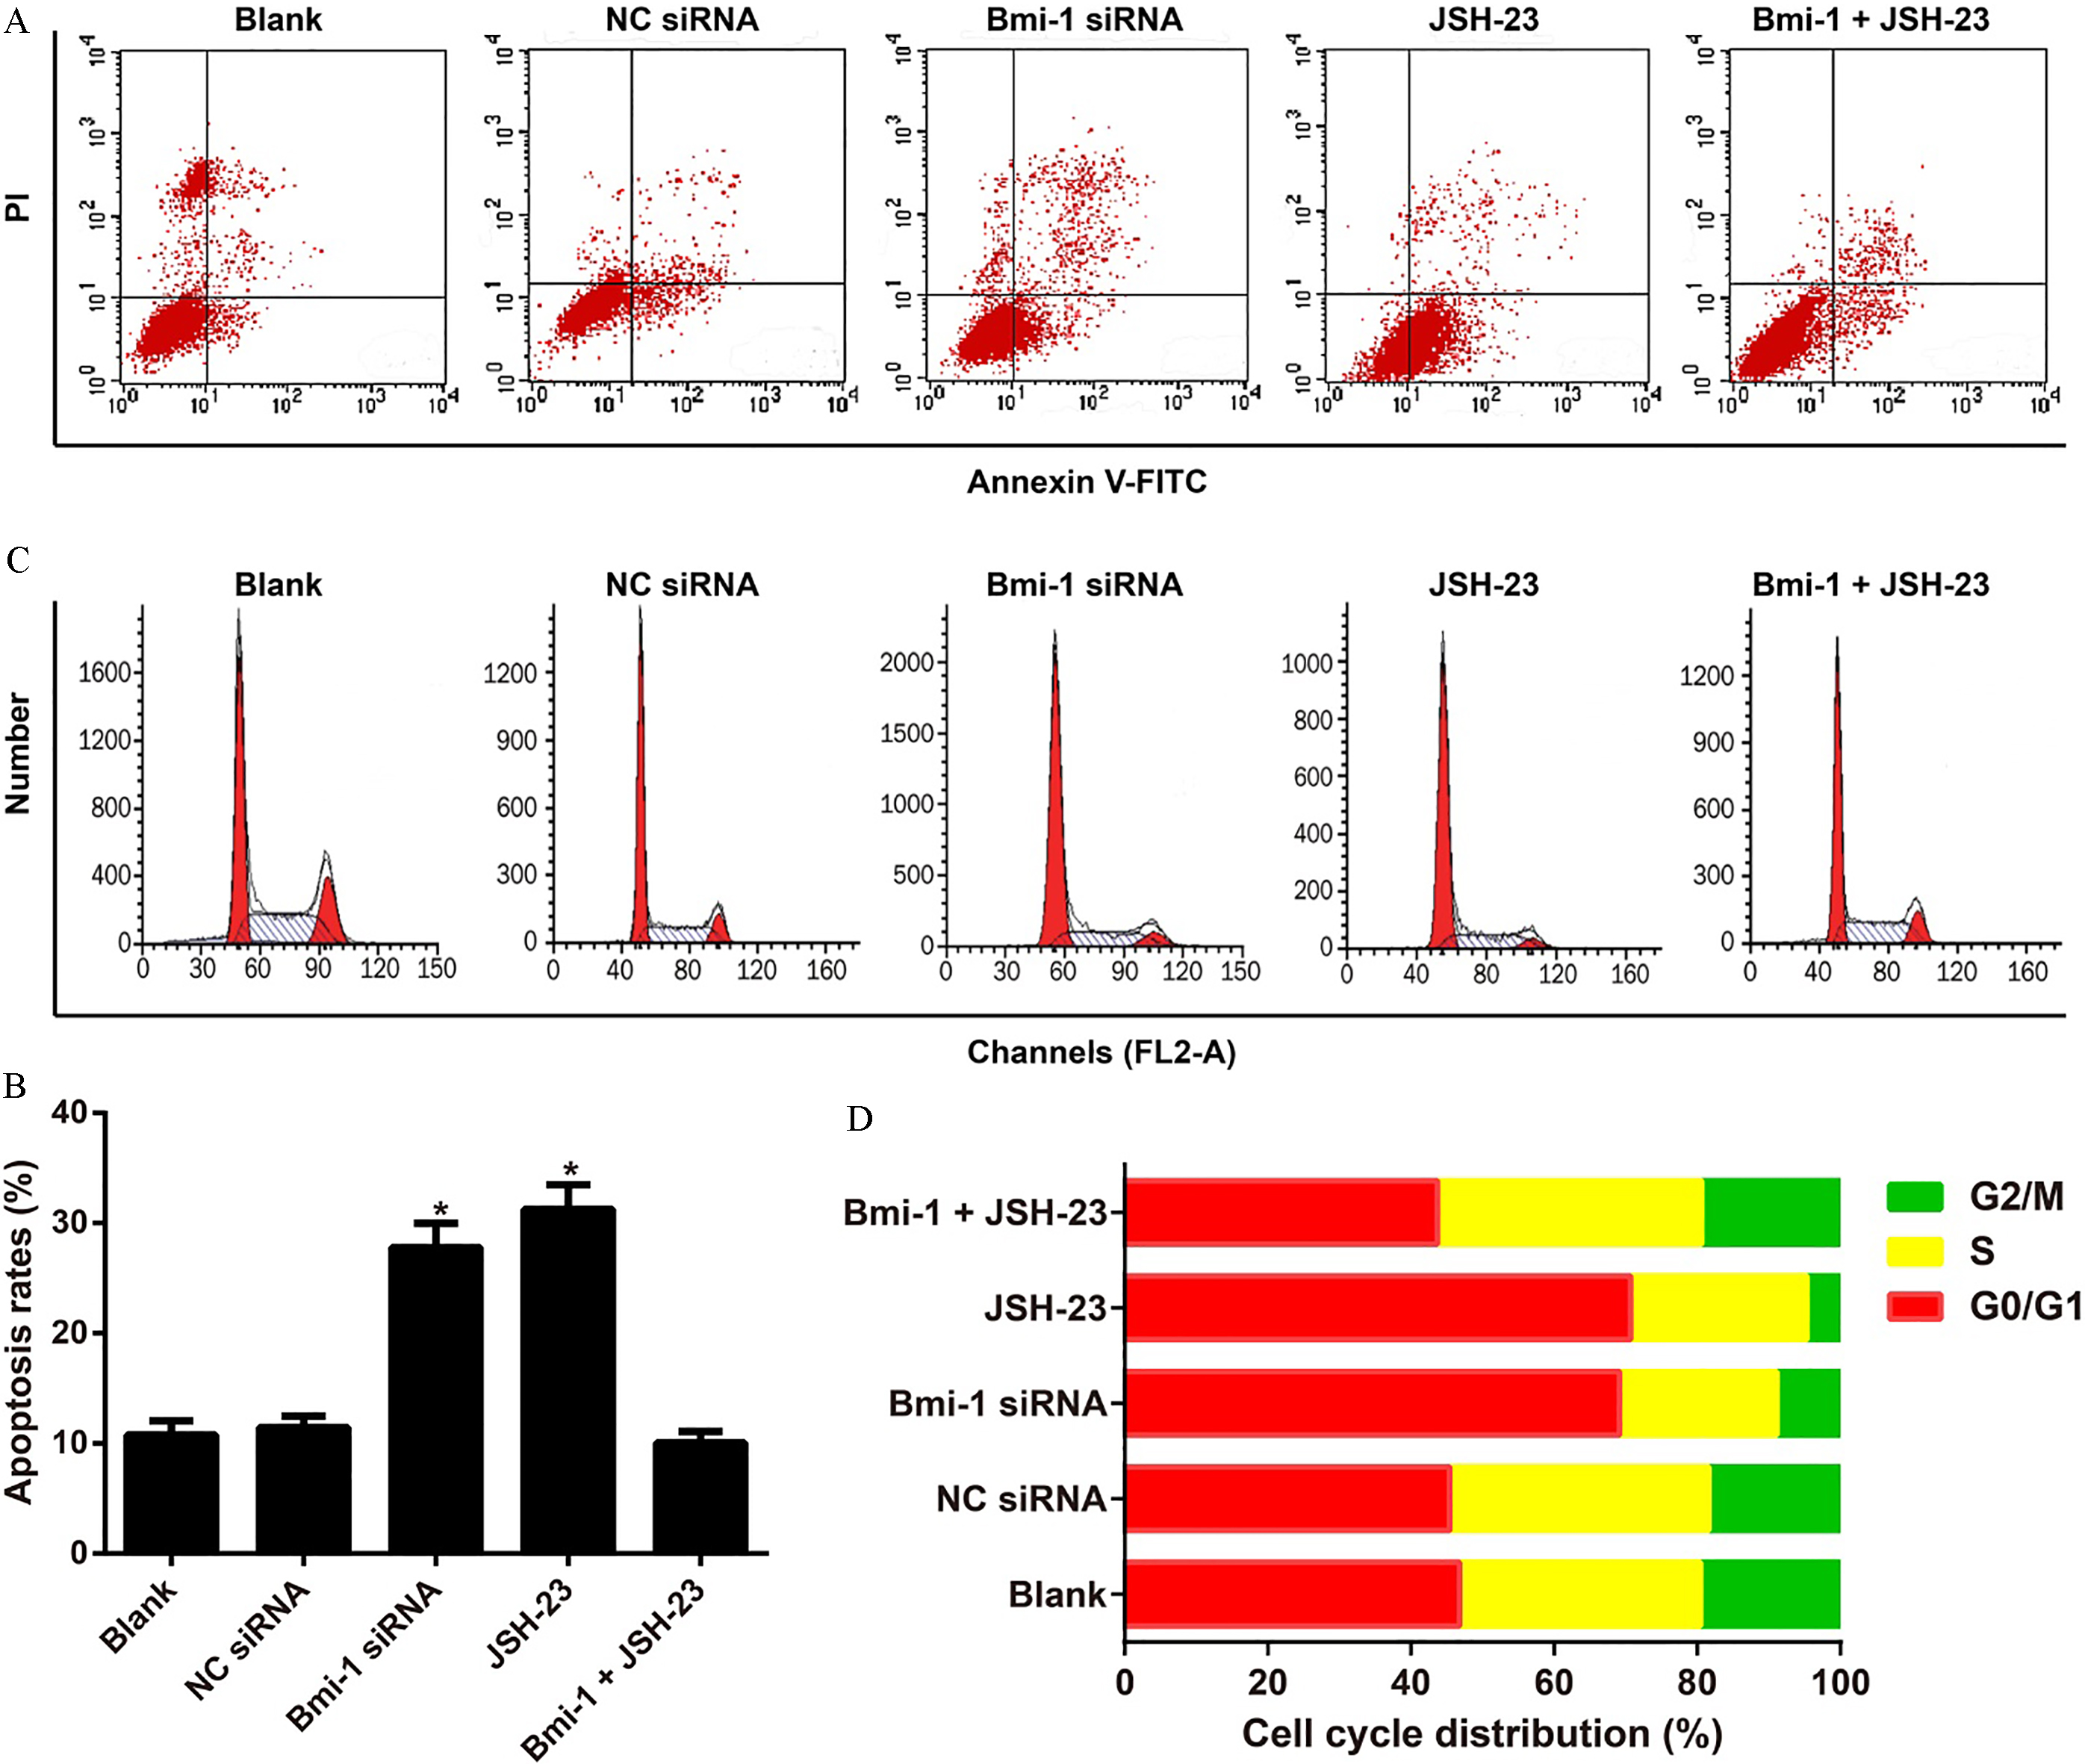
Effect of Bmi-1-mediated NF-B pathway on the apoptosis and cell cycle of CD133 Huh-7 cells. Note: A–B, The apoptosis of CD133 Huh-7 cells in each group detected by Annexin V-FITC/PI staining; C–D, The cell cycle distribution of CD133 Huh-7 cells in each group measured by flow cytometer; , 0.05 compared with the Blank, NC siRNA, and Bmi-1 JSH-23 groups.
Effect of Bmi-1-mediated NF-B pathway on the migration and invasion abilities of CD133 Huh-7 cells. Note: , 0.05 compared with the Blank, NC siRNA, and Bmi-1 JSH-23 groups.
Expression levels of Bmi-1 and NF-B in CD133 Huh-7 cells
Compared with CD133 cells, the mRNA levels of Bmi-1 and NF-B p65 were significantly increased in the CD133 Huh-7 cells (all 0.05, Fig. 2A), and the protein expression of Bmi-1 and the phos- phorylation level of NF-B p65 were also elevated as displayed by Western blotting ( 0.05). However, the total protein levels of NF-B p65 had no significant difference between CD133 and CD133 Huh-7 cells ( 0.05, Fig. 2B and C). Besides, the nuclear translocation of NF-B p65 was found obviously improved in CD133 cells (Fig. 2D). After transfected with Bmi-1siRNA, Bmi-1 and NF-B p65 mRNAs, as well as Bmi-1 protein expression and NF-B P65 phosphorylation levels, were decreased and inhibited dramatically in CD133 Huh-7 cells (all 0.05). Cells in the NC siRNA and the JSH-23 groups didn’t show observable difference from Blank group in Bmi-1 expression (all 0.05), while cells in the Bmi-1 JSH-23 group had a dramatically elevated Bmi-1 ( 0.05). The total protein level of NF-B P65 presented no statistical difference among all groups (all 0.05, Fig. 3).
Effect of Bmi-1-mediated NF-B pathway on the expression of stemness genes in CD133 Huh-7 cells
As illustrated by qRT-PCR detection (Fig. 4A), CD133 Huh-7 cells transfected with Bmi-1 siRNA were apparently inhibited in the mRNA expression of stemness genes (including OCT4, SOX2 and NANOG) when compared to the Blank group (all 0.05). Besides, the expression of stemness genes exhibited no obvious difference between the JSH-23 group and Bmi-1 siRNA group (all 0.05), which apparently enhanced in Bmi-1 JSH-23 group as compared with JSH-23 or Bmi-1 siRNA group (all 0.05). Notably, the protein expression trend was consistent with the mRNA expression trend of OCT4, SOX2 and NANOG, as evident by Western blotting (Fig. 4B and C).
Effect of Bmi-1-mediated NF-B pathway on the colony formation and sphere-forming abilities of CD133 Huh-7 cells
CD133 Huh-7 cells in the Bmi-1 siRNA group and JSH-23 group were obviously lower in cell colonies and sphere formations than those in other three groups (all 0.05, Fig. 5), and the influence of JSH-23 was slightly but not statistically higher than that of Bmi-1 siRNA (all 0.05). Meanwhile, Blank group was not statistically different from the Bmi-1 JSH-23 group in the number of CD133 Huh-7 cell colonies and sphere formations (all 0.05).
Effect of Bmi-1-mediated NF-B pathway on apoptosis and cell cycle of CD133 Huh-7 cells
According to the results of flow cytometry (Fig. 6), CD133 Huh-7 cells treated with Bmi-1 siRNA or JSH-23 showed apparent increase in the apoptotic cells and the proportion of G0/G1 phase and S phase cells, while presented a significant decrease in the proportion of G2/M phase cells (all 0.05). On the other hand, cells in the Bmi-1 siRNA group did not differ significantly from those in the JSH-23 group in these indexes (all 0.05). Additionally, there was no significant difference in apoptosis and cell cycle distribution of CD133 Huh-7 cells between the Blank group and the Bmi-1 JSH-23 group (all 0.05).
Effect of Bmi-1-mediated NF-B pathway on the invasion and migration of CD133 Huh-7 cells
Transwell assays demonstrated that Bmi-1 siRNA can significantly reduce the cell migration and invasion of CD133 Huh-7 cells (all 0.05), and JSH-23 had the same effect as Bmi-1 siRNA. However, CD133 Huh-7 cells treated with Bmi-1-overexpression plasmid and NF-B pathway inhibitor JSH-23 were remarkably increased in migration and invasion abilities when compared with cells both treated with Bmi-1 siRNA and JSH-23 (all 0.05), but no significant difference was found in comparison with cells in the Blank group (all 0.05, Fig. 7).
Discussion
CSCs, also known as “Tumor-initiating cells (TICs)”, were initially discovered in leukemia and considered likely to be responsible for the occurrence and progression of a variety of solid tumors [19], such as melanoma, breast cancer, prostate cancer, head and neck cancer, lung cancer, colon cancer, pancreatic cancer, and ovarian cancer [9, 20]. Besides, Parent et al. separated CSCs with self-renewal and differentiation capabilities from liver cancer cells and found that the number of CSCs was 50% higher in liver with lesions than in normal liver tissues [21]. Thus, it would provide a novel strategy for prevention and treatment of liver cancer from the perspective of CSCs.
CD133, previously named as human AC133 antigen, is identified as a 5-transmembrane cell-surface glycol protein expressed on the cell membrane of multiple somatic stem cells, hematopoietic stem/progenitor cells, and cancer stem cells [22]. In recent years, accumulating studies have pointed out the universal biomarker of CD133 involved in the pathogenesis and progression of various tumors, such as small cell lung cancer [23], and colon cancer [24]. When Suetsugu et al. initially isolated CD133 cells from liver cancer cell line Huh-7, the CD133 Huh-7 cells presented a higher proliferative ability and lower mRNA expressions of mature hepatocyte markers than CD133 cells [25], which were widely used in numerous studies at home and abroad due to their LCSCs characteristics [26, 27]. In this study, flow cytometer analysis showed that the expression rate of CD133 in Huh-7 cells was 51.37% 1.16%, and relatively more cell colonies, sphere formations, invasive cells and migrated cells found in CD133 Huh-7 cells, indicating that CD133 Huh-7 cells were more suitable for subsequent experiments.
Actually, Bmi-1 has been well-recognized to play important roles in the self-renewal of hematopoietic stem cells, neural stem cells, and breast stem cells [11]. In our experiment, Bmi-1 was observed to be apparently up-regulated in CD133 Huh-7 cells. In head and neck cancer, cisplatin treatment promoted self-renewal and survival of CSCs in vitro, as seen by an induction of Bmi-1 [28], suggesting that Bmi-1 may also participate in the regulation of CSCs, including LCSCs. To further explore the effect of Bmi-1 on LCSCs, we transfect Bmi-1 siRNA and NC siRNA into CD133 Huh-7 cells, and found that Bmi-1 siRNA could effectively decrease the number of sphere formiations and cell colonies, arrest cells at the G0/G1 phase and S phase, promote cell apoptosis, and reduce cell migration and invasion. Similar to our study, Zhang et al. reported that Bmi-1 gene interference mediated by its promoter could significantly inhibit the malignant phenotype and stem cell-like properties of gastric cancer cells [11]. Additionally, Chiba et al. also revealed that Bmi-1 inhibition was closely associated with the malignant transformation of hepatic stem/progenitor cells [29] and the possible explanation is that Bmi-1 can down-regulate p16 and p19 by inhibiting the INK4a/ARF site and thereby modulating cell proliferation and apoptosis [30]. Besides, it is worth to mention that Bmi-1 can induce EMT formation and promote cell migration [31]. On the other side, NANOG, OCT4 and SOX2 can regulate the gene transcription of embryonic stem cells and have a crucial regulatory effect on their pluripotency and self-renewal [32]. Nowadays, they have been studied extensively as the transcription factors in CSCs [33], including LCSCs [34]. More importantly, Bmi-1 siRNA used in our study dramatically down-regulated the expression of stemness genes (OCT4, SOX2, and NANOG) in CD133 Huh-7 cells, highlighting the inhibitory role of Bmi-1 on suppressing stem cell-like characteristics of liver cancer cells.
Particularly, differential activation of signaling was also supposed to be associated with the maintenance of CSC phenotype, like NF-B pathway [35]. As demonstrated by our experiment, CD133 Huh-7 cells were detected to be higher in the phosphorylation level of NF-B P65 and in the nuclear translocation of NF-B p65, whereas the properties of CD133 LCSCs were significantly inhibited after treated by NF-B signaling pathway inhibitor JSH-23. Consistent with the study by Vazquez-Santillan et al., the breast cancer cell line with the high proportion of CSCs showed high NF-B-inducing kinase (NIK) expression, and inhibition of NIK declined the expression of CSC markers and impaired clonogenicity and tumorigenesis [18]. Meanwhile, Zhang et al. demonstrated that regulation of NF-B pathway can affect the EMT and metastasis of CD133 pancreatic cancer stem-like cells [36], which also indicated that NF-B signaling pathway may participate in the occurrence and progression of LCSCs.
In addition, deregulation of Bmi-1 may affect the expressions of hundreds of downstream target genes, as indicated by expression profiling studies [37] suggesting that Bmi-1 may play its role via multiple mechanisms. According to our results, Bmi-1 siRNA can remarkably reduce the expression of NF-B P65 in CD133 Huh-7 cells, and there were no differences with respect to these indexes in CD133 Huh-7 cells when treated with both Bmi-1-overespression plasmid and JSH-23. In addition, Ye et al. also found that BMI-1 deletion can inhibit NF-B signaling pathway and thus take part in the invasion and EMT of inflammation-induced colon cancer cells [38]. Moreover, in the study by Wang et al., Bmi-1 can enhance the transcriptional activity of NF-B, which can bind to the promoter of miR-21 and miR-34a to activate the expression of miR-34a, eventually affecting the stem cell-like characteristics of gastric cancer [39], suggesting that Bmi-1 siRNA may block the NF-B signaling pathway to inhibit the properties of LCSCs.
In conclusion, increased Bmi-1 expression and activation of NF-B signaling pathway were found in CD133 Huh-7 cells. Besides, Bmi-1 siRNA may reduce cell colonies and sphere formations and cause cell cycle arrest at G0/G1 phase and S phase via inhibiting NF-B signaling pathway, consequently promoting cell apoptosis and inhibiting cell metastasis.
Footnotes
Acknowledgments
The authors appreciate the reviewers for their useful comments in this study.
Conflict of interest
None of the authors have any competing interests.
References
1.
FarombiE.O., Review-Aflatoxin contamination of foods in developing countries: Implications for hepatocellular carcinoma and chemopreventive strategies, Academic Journals5 (2016), 1–14.
2.
YangZ.F.NgaiP.HoD.W.YuW.C.NgM.N.LauC.K.LiM.L.TamK.H.LamC.T.PoonR.T. and FanS.T., Identification of local and circulating cancer stem cells in human liver cancer, Hepatology47 (2008), 919–928.
3.
JordanC.T.GuzmanM.L. and NobleM., Cancer stem cells, N Engl J Med355 (2006), 1253–1261.
4.
PanJ.ZhangQ.WangY. and YouM., 26S proteasome activity is down-regulated in lung cancer stem-like cells propagated in vitro, PLoS One5 (2010), e13298.
5.
YamashitaT. and KanekoS., Orchestration of hepatocellular carcinoma development by diverse liver cancer stem cells, J Gastroenterol49 (2014), 1105–1110.
6.
TanakaK.TomitaH.HisamatsuK.NakashimaT.HatanoY.SasakiY.OsadaS.TanakaT.MiyazakiT.YoshidaK. and HaraA., ALDH1A1-overexpressing cells are differentiated cells but not cancer stem or progenitor cells in human hepatocellular carcinoma, Oncotarget6 (2015), 24722–24732.
7.
NunukovaA.NeradilJ.SkodaJ.JarosJ.HamplA.SterbaJ. and VeselskaR., Atypical nuclear localization of CD133 plasma membrane glycoprotein in rhabdomyosarcoma cell lines, Int J Mol Med36 (2015), 65–72.
8.
ZhangJ.LuoN.LuoY.PengZ.ZhangT. and LiS., microRNA-150 inhibits human CD133-positive liver cancer stem cells through negative regulation of the transcription factor c-Myb, Int J Oncol40 (2012), 747–756.
9.
TsaiS.T.TsouC.C.MaoW.Y.ChangW.C.HanH.Y.HsuW.L.LiC.L.ShenC.N. and ChenC.H., Label-free quantitative proteomics of CD133-positive liver cancer stem cells, Proteome Sci10 (2012), 69.
10.
van LohuizenM.VerbeekS.ScheijenB.WientjensE.van der GuldenH. and BernsA., Identification of cooperating oncogenes in E mu-myc transgenic mice by provirus tagging, Cell65 (1991), 737–752.
11.
ZhangX.GuoW.WangX.LiuX.HuangM.GanL.ChengY. and LiJ., Antitumor activity and inhibitory effects on cancer stem cell-like properties of Adeno-associated virus (AAV) -mediated Bmi-1 interference driven by Bmi-1 promoter for gastric cancer, Oncotarget7 (2016), 22733–22745.
12.
WangY.ZheH.DingZ.GaoP.ZhangN. and LiG., Cancer stem cell marker Bmi-1 expression is associated with basal-like phenotype and poor survival in breast cancer, World J Surg36 (2012), 1189–1194.
13.
Abd El hafezA. and El-HadaadH.A., Immunohistochemical expression and prognostic relevance of Bmi-1, a stem cell factor, in epithelial ovarian cancer, Ann Diagn Pathol18 (2014), 58–62.
14.
JiangL.WuJ.YangY.LiuL.SongL.LiJ. and LiM., Bmi-1 promotes the aggressiveness of glioma via activating the NF-kappaB/MMP-9 signaling pathway, BMC Cancer12 (2012), 406.
15.
KimB.R.KwonY. and RhoS.B., BMI-1 interacts with sMEK1 and inactivates sMEK1-induced apoptotic cell death, Oncol Rep37 (2017), 579–586.
16.
YeG.SunG.ChengZ.ZhangL.HuK.XiaX. and ZhouY., p55PIK regulates alpha-fetoprotein expression through the NF-kappaB signaling pathway, Life Sci191 (2017), 104–110.
17.
Gonzalez-TorresC.Gaytan-CervantesJ.Vazquez-SantillanK.Mandujano-TinocoE.A.Ceballos-CancinoG.Garcia-VenzorA.ZampedriC.Sanchez-MaldonadoP.Mojica-EspinosaR.Jimenez-HernandezL.E. and MaldonadoV., NF-kappaB Participates in the Stem Cell Phenotype of Ovarian Cancer Cells, Arch Med Res48 (2017), 343–351.
18.
Vazquez-SantillanK.Melendez-ZajglaJ.Jimenez-HernandezL.E.Gaytan-CervantesJ.Munoz-GalindoL.Pina-SanchezP.Martinez-RuizG.TorresJ.Garcia-LopezP.Gonzalez-TorresC.RuizV.Avila-MorenoF.Velasco-VelazquezM.Perez-TapiaM. and MaldonadoV., NF-kappaBeta-inducing kinase regulates stem cell phenotype in breast cancer, Sci Rep6 (2016), 37340.
19.
LapidotT.SirardC.VormoorJ.MurdochB.HoangT.Caceres-CortesJ.MindenM.PatersonB.CaligiuriM.A. and DickJ.E., A cell initiating human acute myeloid leukaemia after transplantation into SCID mice, Nature367 (1994), 645–648.
20.
BrinckerhoffC.E., Cancer Stem Cells (CSCs) in melanoma: There’s smoke, but is there fire? J Cell Physiol232 (2017), 2674–2678.
21.
ParentR.MarionM.J.FurioL.TrepoC. and PetitM.A., Origin and characterization of a human bipotent liver progenitor cell line, Gastroenterology126 (2004), 1147–1156.
22.
LeelawatK.ThongtaweeT.NarongS.SubwongcharoenS. and TreepongkarunaS.A., Strong expression of CD133 is associated with increased cholangiocarcinoma progression, World J Gastroenterol17 (2011), 1192–1198.
23.
CuiF.WangJ.ChenD. and ChenY.J., CD133 is a temporary marker of cancer stem cells in small cell lung cancer, but not in non-small cell lung cancer, Oncol Rep25 (2011), 701–708.
24.
SchneiderM.HuberJ.HadaschikB.SiegersG.M.FiebigH.H. and SchulerJ., Characterization of colon cancer cells: a functional approach characterizing CD133 as a potential stem cell marker, BMC Cancer12 (2012), 96.
25.
SuetsuguA.NagakiM.AokiH.MotohashiT.KunisadaT. and MoriwakiH., Characterization of CD133+ hepatocellular carcinoma cells as cancer stem/progenitor cells, Biochem Biophys Res Commun351 (2006), 820–824.
26.
MaS.ChanK.W.LeeT.K.TangK.H.WoJ.Y.ZhengB.J. and GuanX.Y., Aldehyde dehydrogenase discriminates the CD133 liver cancer stem cell populations, Mol Cancer Res6 (2008), 1146–1153.
27.
MoriwakiK.OkudoK.HaraguchiN.TakeishiS.SawakiH.NarimatsuH.TanemuraM.IshiiH.MoriM. and MiyoshiE., Combination use of anti-CD133 antibody and SSA lectin can effectively enrich cells with high tumorigenicity, Cancer Sci102 (2011), 1164–1170.
28.
NorC.ZhangZ.WarnerK.A.BernardiL.VisioliF.HelmanJ.I.RoeslerR. and NorJ.E., Cisplatin induces Bmi-1 and enhances the stem cell fraction in head and neck cancer, Neoplasia16 (2014), 137–146.
29.
ChibaT.SekiA.AokiR.IchikawaH.NegishiM.MiyagiS.OguroH.SarayaA.KamiyaA.NakauchiH.YokosukaO. and IwamaA., Bmi1 promotes hepatic stem cell expansion and tumorigenicity in both Ink4a/Arf-dependent and -independent manners in mice, Hepatology52 (2010), 1111–1123.
30.
MolofskyA.V.HeS.BydonM.MorrisonS.J. and PardalR., Bmi-1 promotes neural stem cell self-renewal and neural development but not mouse growth and survival by repressing the p16Ink4a and p19Arf senescence pathways, Genes Dev19 (2005), 1432–1437.
31.
WangZ.AliS.BanerjeeS.BaoB.LiY.AzmiA.S.KorcM. and SarkarF.H., Activated K-Ras and INK4a/Arf deficiency promote aggressiveness of pancreatic cancer by induction of EMT consistent with cancer stem cell phenotype, J Cell Physiol228 (2013), 556–562.
32.
RoddaD.J.ChewJ.L.LimL.H.LohY.H.WangB.NgH.H. and RobsonP., Transcriptional regulation of nanog by OCT4 and SOX2, J Biol Chem280 (2005), 24731–24737.
33.
LeeS.WottrichS. and BonavidaB., Crosstalks between Raf-kinase inhibitor protein and cancer stem cell transcription factors (Oct4, KLF4, Sox2, Nanog), Tumour Biol39 (2017), 1010428317692253.
34.
SunD.QinL.XuY.LiuJ.X.TianL.P. and QianH.X., Influence of adriamycin on changes in Nanog, Oct-4, Sox2, ARID1 and Wnt5b expression in liver cancer stem cells, World J Gastroenterol20 (2014), 6974–6980.
35.
ThakurB. and RayP., Cisplatin triggers cancer stem cell enrichment in platinum-resistant cells through NF-kappaB-TNFalpha-PIK3CA loop, J Exp Clin Cancer Res36 (2017), 164.
36.
ZhangL.WangD.LiY.LiuY.XieX.WuY.ZhouY.RenJ.ZhangJ.ZhuH. and SuZ., CCL21/CCR7 Axis Contributed to CD133+ Pancreatic Cancer Stem-Like Cell Metastasis via EMT and Erk/NF-kappaB Pathway, PLoS One11 (2016), e0158529.
37.
DouglasD.HsuJ.H.HungL.CooperA.AbduevaD.van DoorninckJ.PengG.ShimadaH.TricheT.J. and LawlorE.R., BMI-1 promotes ewing sarcoma tumorigenicity independent of CDKN2A repression, Cancer Res68 (2008), 6507–6515.
38.
YeK.ChenQ.W.SunY.F.LinJ.A. and XuJ.H., Loss of BMI-1 dampens migration and EMT of colorectal cancer in inflammatory microenvironment through TLR4/MD-2/MyD88-mediated NF-kappaB signaling, J Cell Biochem119 (2018), 1922–1930.
39.
WangX.WangC.ZhangX.HuaR.GanL.HuangM.ZhaoL.NiS. and GuoW., Bmi-1 regulates stem cell-like properties of gastric cancer cells via modulating miRNAs, J Hematol Oncol9 (2016), 90.