
Abstract
BACKGROUND:
Oral squamous cell carcinoma is a malignant tumor which is particularly common in the developing world, mostly in older males.
OBJECTIVE:
Although gene expression analyses had been performed previously, to our best knowledge, systemic co-expression analysis for this disease is still lacking to date.
METHODS:
In this study, we built the co-expression modules with the help of Weighted Correlation Network Analysis (WGCNA) and investigated the function enrichment of co-expression genes from important modules by bioinformatics analysis.
RESULTS:
A total of 10 co-expression modules were conducted for 4500 genes from 167 oral squamous cell carcinoma samples. Number of genes for each module ranged from 52 to 1112, with the mean of 450. Interaction relationships of hub-genes between pairwise modules showed great differences, suggesting the high confidence of modules. Functional enrichments of the co-expression modules exhibited great differences. Furthermore, genes in the module ME blue and module ME magenta significantly enriched in hsa05332 (Graft-versus-host disease) and hsa05330 (Allograft rejection), and the two pathways were associated with the oral squamous cell carcinoma.
CONCLUSION:
Together, our findings provided the framework of co-expression gene modules of oral squamous cell carcinoma and further understanding of these modules at functional aspect.
Introduction
Oral squamous cell carcinoma is caused by carcinogenesis of oral keratinocytes, which is caused by DNA mutation. The main cause of disease risk factors are often smoking, drinking and in some specific areas (such as Southeast Asia): chewing betel nut and mouth snuff, microbial origin such as yphilis, Candida and viruses including human papilloma viruses and herpes simplex virus). Most OSCC often occur in older males, especially tobacco and alcohol are the most important mutagens. The Confirmed evidence of the Oral squamous cell carcinoma are that the oral persistent existence of ulcerated epithelium, red or white lesion, solid growth or ulcero-proliferative growth that last more than three weeks [1]. Some other characters, such as the non-healing socket, unexplained loose tooth and numbness/parasthesia, should also be regarded as cancer until proven histopathologically [2].
When thenormal cells become independent with self-regulated signaling activity, is termed as cancer cell. Histologically, the cancer cells are recognized by invasion across the epithelial basement membrane. These cancer cells may ultimately metastasize to lymph nodes, bone, brain, liver or distant sites. Oral squamous cell carcinoma is the most cancer type to occur in oral cavity with a high proportion, up to 96% [3]. The early clinical diagnosis was only observed in 35% of histologically proven cases. One of the key reasons in failure of early diagnosis is due to the lack of molecular studies of the early stages of clinical diagnosis of disease. However, recently remarkable advances in technologies for assaying gene expression and the availability of high-throughput data are observed.
Vinay Randhawa and Vishal Acharya classified Gene expression profiles into cancer stage-related modules, to understand these genes function, a classification model, 5-fold cross validation and on an independent dataset, was used to tested groups of genes that are significantly related to OSCC. However, via these approaches, genes identified are usually not functionally related and therefore may not reveal key biological processes. Fortunately, rapid advances in network biology have provided system analysis of multidimensional biological data and could reduce the data scheme to only hundreds [4, 5, 6] or even tens [7, 8, 9, 10] of relevant genes. The existing study lacks an example of a modular analysis of gene expression data for oral squamous cell carcinoma, limiting the understanding of the key genes affecting the incidence of oral squamous cell carcinoma.
Weighted gene co-expression network analysis is a biology method for finding clusters (modules) of highly correlated genes by using the module Eigen gene or an intramodular hub gene. These method calculating module membership measures by such modules correspond to the external sample traits, can be used to identify candidate biomarkers or therapeutic targets. The R software package of the WGCNA is a comprehensive collection of weighted correlation network analysis. The R package was used to construct a gene co-expression network, identify Eigen gene Networks modules, reduction biological data, and relate modules to external information. Further evidence for the GATA2 gene is being an important regulatory gene in prostate cancer identification via WGCNA. In identification via WGCNA of modules consisting of expression pattern correlated genes will be particularly useful. It pinpoints the GATA2-activated genes that are involved in the same biological processes or share regulatory mechanisms. GATA2 could represent a prostate cancer metastasis-driving gene and a potential target for therapy of metastatic prostate cancer [11]. The unsupervised nature of WGCNA avoids subjective decisions and potential biases associated with defining control samples for supervised approaches or selecting genes previously associated with breast cancer [12].
The purpose and significance of this study: Based on the existing data of Oral Squamous Cell Carcinoma, the co-expression modules were constructed by using these data, and the main modules were analyzed by GO and KEGG functional enrichment. Has the main function, in order to facilitate the effective treatment of oral squamous cell carcinoma.
Material and methods
Analysis of gene expression in oral squamous cell carcinoma
The Probe signal data from the key word “oral squamous cell carcinoma data” were downloaded from the GEO data repository (
Gene co-expression modules correspond to oral squamous cancer
Applied the WGCNA, the power values in the module building process are first screened, the independent and average connection degree of the module were detected with different Power values via the scale test (Power value 1
The cluster analysis of oral squamous cell carcinoma. WGCNA and flashClust to clustering analysis a data set comprising 4500 gene with the strongest degree of expression. All samples divided into 2 clusters, had no significant difference. One cluster contains 3 samples and the other divided into 2 subtypes contains 3 samples and 161 samples.
For the gene Functional annotation analyses, the gene information were corresponded on the basis ofthe DAVIA [15] database (
Results
Collection of oral squamous cell carcinoma data and analysis of gene expression
The oral squamous cell carcinoma gene expression data from 229 data sets (include 167 oral squamous cancer data, 17 Dysplasia and 45 normal samples) were downloaded from the published expression data sets GSE30784 (
A: Scale Independence of Oral squamous cell carcinoma gene co-expression module related to the 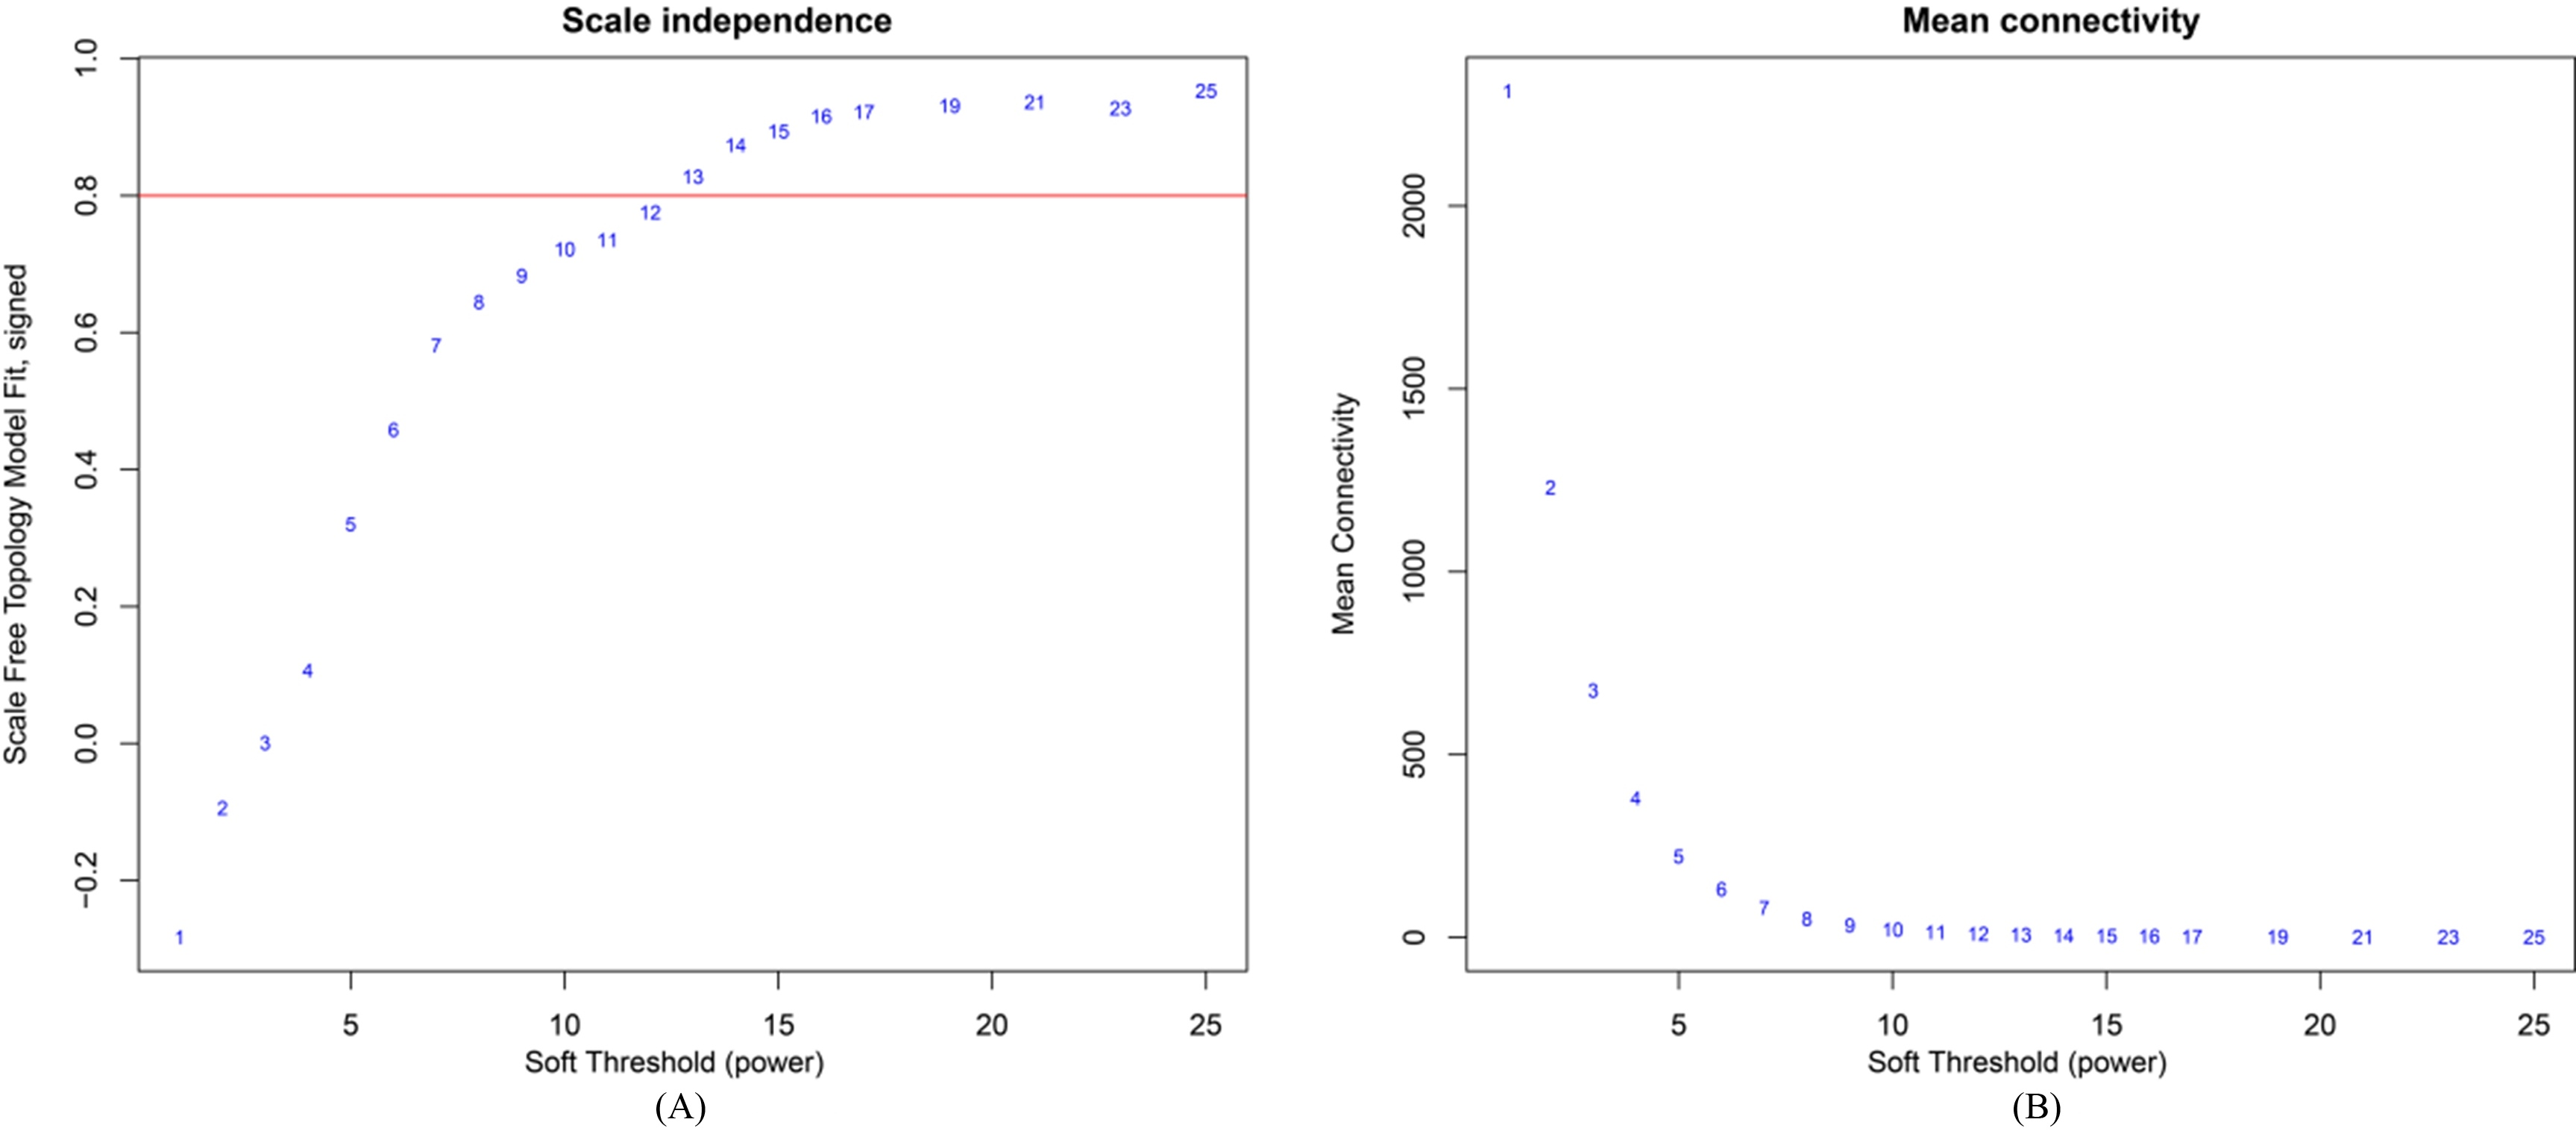
Weighted gene co-expression network analysis(WGCNA) was utilized to analyze a data set comprising 4500 samples taken from 167 samples sets.
We further construct co-expression modules with the 4500 genes with the strongest degree of expression from 167 samples (
A: Oral squamous cell carcinoma gene co-expression module via WGCNA. B: data of each gene co-expression module.
We utilized WGCNA to analyze the association of the 10 co-expression gene modules (Fig. 4). There is poor difference with each module but some middle areas, which reveals the relatively independent gene expression of the modules. This result confirms that there is a significant diversity degree of Scale Independence and the high reliability of the modules.
We analyzed the connectivity of the Eigen genes to understand the relationship between co-expression modules. We clustered the Eigen genes first (Fig. 5A), then found the 10 modules were clustered into2 clusters, which respectively correspond 4 modules (MEblue, MEmagena, MEbrown, MEgrey) and 6 modules (MEblack, MEpink, MEred, MEgreen, MEpurple, MEturquoise). Further study confirmed that significant difference connectivity existed in the modules (Fig. 5). In addition to that exist the highest adjacency of self-comparison, there were three modules generated a high degree of interaction (MEgreen and MEred, MEpurple and MEturquoise) and the correlation coefficient is greater than 0.8 with high effect.
In the heat chart, the gradient from blue (0) to red (1) represents the degree of connectivity for Eigen genes in different modules from weak to strong. The icons in the right are the legend of the module’s number of genes.
Association of gene expression modules. The different colors of the horizontal and vertical axes represent different modules. The yellowness of the middle part represents the correlation between the modules. There is poor difference with each modules, indicating that the modules have a diversity degree of Scale Independence.
Connectivity of Eigen genes in different modules. A: cluster of Eigen genes. B: heat chart of connectivity for Eigen genes. Mainly 2 clusters, respectively correspond 4 modules (MEblue, MEmagena, MEbrown, MEgrey) and 6 modules (MEblack, MEpink, MEred, MEgreen, MEpurple, MEturquoise).
Heat Chart for GO and KEGG enrichment of genes in Oral squamous cell carcinoma co-expression module. A, Clustering map of GO enrichment for gene co-expression module. B, Clustering map of KEGG enrichment for gene co-expression module. The text on the right represents the number of GO and KEGG metabolic pathways (
We carried out the GO analysis for the 10 modules mainly through detecting the result of the genes’ GO and KEGG enrichment. We extracted the result of the GO (Gene Ontology) term and KEGG pathway enrichment which were top 5 in each modules (
For the enrichment of KEGG metabolic pathway, the module MEturquoise was mainly enriched in the cut (hsa03040: Spliceosome), DNA replication (hsa03030: DNA replication), cell cycle (hsa04110: Cell cycle) and antibiotic synthesis (hsa01130: Biosynthesis ofantibiotics). The MEblue was mainly enriched in Staphylococcus aureus infection (hsa05150: Staphylococcus aureus infection), NF-kappa B signaling pathway (hsa0504: NF-kappa B signaling pathway), graft-versus-host disease (hsa05332: Graft-versus-host disease), Allograft rejection (hsa05330: Allograftrejection) and lysosomes (hsa04142: Lysosome). The MEbrown was mainly enriched in oxidative phosphorylation (hsa00190: Oxidative phosphorylation) Antibiotic synthesis (hsa01130: Biosynthesis of antibiotics), Alzheimer’s disease, Parkinson’s disease, and metabolic pathway (hsa01100: Metabolic pathways). The module MEgreen is mainly enriched in the proteasome (hsa03050: Proteasome), Epstein-Barr virusinfection (hsa05169: Epstein-Barr virus infection)and the endoplasmic reticulum protein processing (hsa04141: Protein processing in endoplasmic reticulum) and other metabolic pathways on. The module MEred did not have a corrected
Discussion
In this study, we utilize the WGCNA to construct the co-expression module of oral squamous cell carcinoma, furthermore confirmed that the key module and concluded the key gene via Functional analysis of genes. We analyze 229 data sets by the biological analysis method (WGCNA) and finally get 21665 genes which are expressed in 167 oral squamous cell carcinoma. Then we select the 4500 genes with the highest expression to construct 10 gene co-expression modules (MEblue, MEmagena, MEbrown, Megrey, MEblack, MEpink, MEred, MEgreen, MEpurple, MEturquoise). By analyzing the GO enrichment and KEGG enrichment of the gene, the functional analysis of the ten modules was carried out, and the gene and gene interaction network which was closely related to the occurrence of oral squamous cell carcinoma were obtained.
WGCNA has several advantages in analyzing highly multivariable and complex data. Self-Organized Mapping (SOM) is an effective tool for clustering and visualizing high-dimensional complex data on a single two-dimensional graph. However, it is necessary to be able to carry out extensive comparisons of the characteristics of a large number of genomic sequences between species, and it is necessary to improve the algorithm of self-organizing mapping. And WGCNA as a system of biological research methods, through the R package directly based on the genetic background of modeling, individual branches can be clustered in separate “modules” [4]. And it could reduce the amount of data. The building of the gene modules achieve the real response to the link between genes and functions, and find the disease of the target gene. As this approach models the interactions of real biological networks and is intuitively understood by users [13, 18, 19].
Principal component analysis (PCA) allows the user to reveal the relative similarity between the samples when each major component is associated with a set of original variables. While this is a very useful tool for preliminary exploration of multidimensional data, it is not very effective in clustering or sorting data [20]. The PCA does not inform the user of the larger cause of the difference between sample types, No it provides a more detailed way to investigate specific differences. WGCNA is a method based on correlation, description and visualization of data points for genes, and other phenotypic data analysis [13]. Features are integrated into co-expressed “modules”, each module through a tree Semi-automatic pruning, and are represented by a unique color, which simplifies the data set. This holistic approach allows extensive statistical analysis of feature clusters while preserving fine scale relationships for further analysis. This powerful function of WGCNA allows the user to explore on multiple scales depending on the sample differences, and may provide an explanation for any observed differences. WGCNA is fundamentally different from the previously mentioned method.
We suggest that this approachable network analysis tool would be extremely useful to biologists who are hoping to condense meaning from large, multidimensional and incompletely annotated datasets. Immune molecules mainly refer to the antigen and antibodies, modern molecular immunology are the main research object. MEblue module is mainly concentrated in the immune response here, in this module of the gene can be a good response to the antigen to stimulate the body, the body after the emergency response caused by a series of changes in the gene, the real response to the occurrence and immunization of the disease, Gene target gene provides a lot of basis. The module MEmagenta is mainly enriched in a series of immune responses in the body after being stimulated by the antigen, in which the main immune signaling pathway can be found and its key molecules are identified, providing a scientific basis for the treatment of diseases and cancer. Oral GVHD, a chronic mucosal inflammation, has been sedition; both diseases have the same pathogenesis involving T-lymphocytes that chronically attack the oral epithelium. In agreement to the literature, in our opinion, one of the main aspects to malignant transformation is the long-term immunologic damage to the mucosa by T-cells [21]. In this study, the graft-versus-host disease is one of the MEmagenta enrichment zones. This proves that graft-versus-host disease is one of the causes of oral squamous cell carcinoma.
Epstein-Barr virus prevalence is associated with OSCC and seems to be enhanced by betel quid chewing, suggesting that EBV may, together with betel quid chewing, act as an important etiological risk factor of OSCC [22]. In this study, the Epstein-Barr virus infection is one of the MEgreen enrichment zones. This proves that Epstein-Barr virus infection is one of the causes of oral squamous cell carcinoma. Proteasome inhibitor sensitizes oral squalors cell carcinoma cells to TRAIL-mediated apoptosis. Oral squamous cell carcinoma (OSCC) cells are relatively resistant to tumor necrosis factor-related apoptosis inducing legend (TRAIL)-mediated apoptosis during culture. Awesome inhibitor MG132 may therefore represent a novel strategy for overcoming resistance to TRAIL-mediated apoptosis in OSCC cells [23]. In this study, the proteasome is one of the MEmagenta enrichment zones. This proves that proteasome is one of the causes of oral squamous cell carcinoma.
Specific inhibitors have also been developed for cathepsin L.74,75. Of these, the most promising metastasis and/or invasion blocking compounds include CLIK-148 and FF-FMK.65 FFFMK, which can also inhibit cathepsin B at higher concentrations, decreases the invasion of human oral squamous cell carcinoma cell lines in vitro. For example, overexpression of the gene encoding for the V1 subunit C (ATP6V1C1) in oral squamous carcinoma cells has been suggested to enhance the pump activity by promoting the assembly of V0 and V1 sub complexes [24]. In this study, the lysosome is one of the MEblack enrichment zones. This proves that lysosome is one of the causes of oral squamous cell carcinoma.
In conclusion, our study provided information to understand cancer genetic and epigenetic profiles, which would be beneficial to the diagnosis and treatment of oral squamous carcinoma.
Footnotes
Conflict of interest
The authors declare that they have no competing interests.